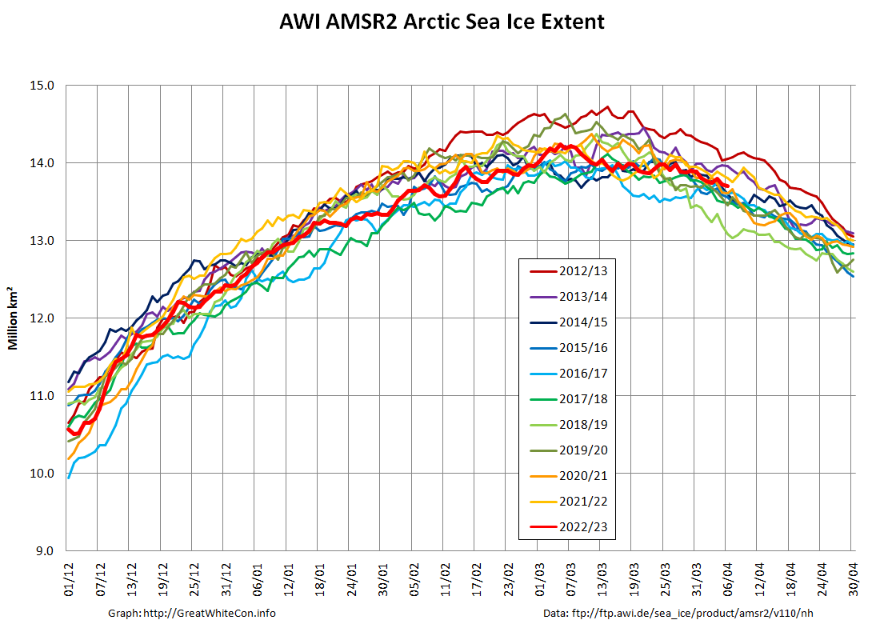
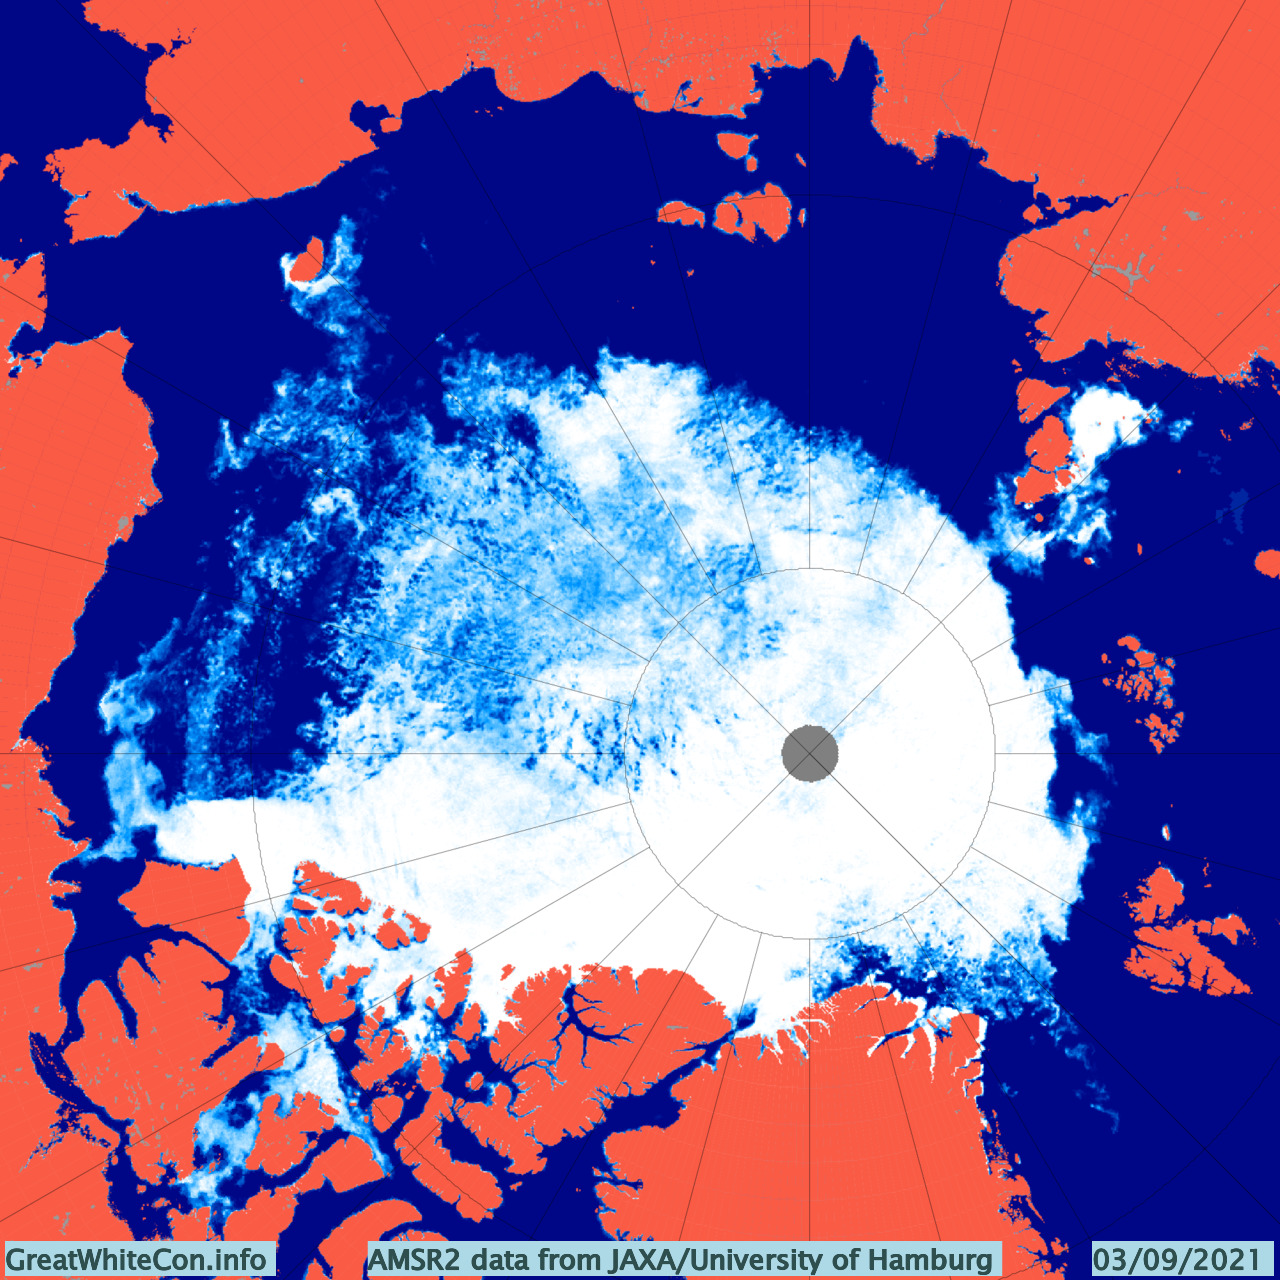
Arctic sea ice extent in early April is singularly unexceptional. Here’s the AWI AMSR2 version:
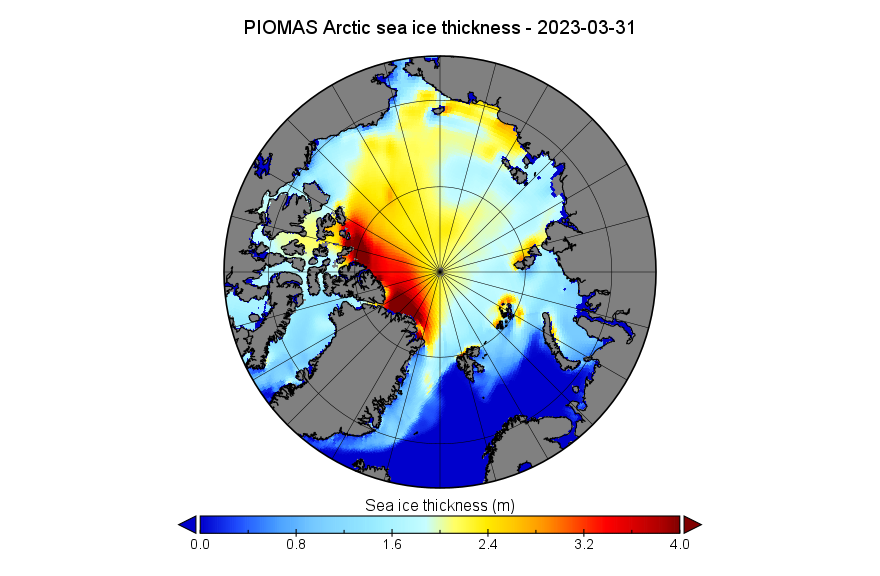
Things start to become more interesting when looking at the third dimension. Here’s the PIOMAS gridded thickness map for March 31st:
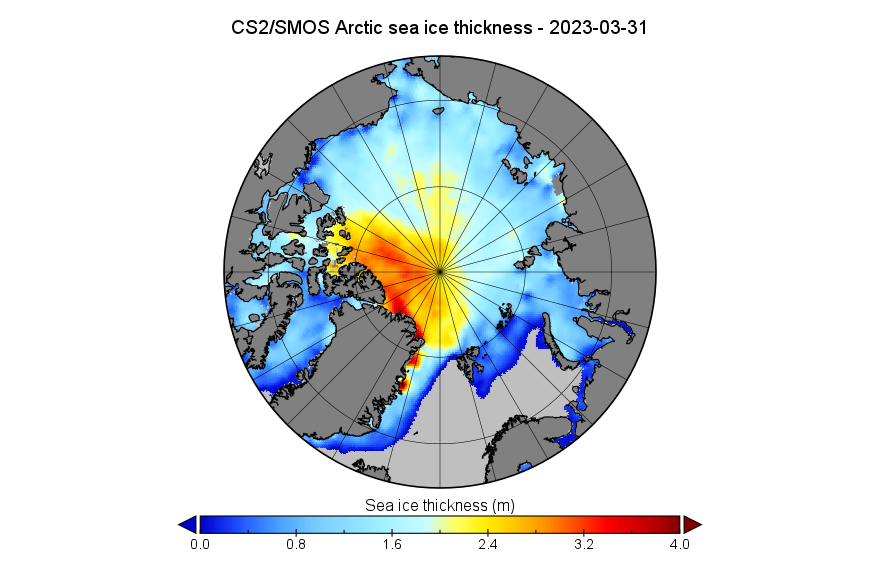
and the CryoSat-2/SMOS map for the same date:
Note the differing distribution of thick ice north of Greenland and the Canadian Arctic Archipelago between the two maps. Note also the area of thinner ice along the coast of the Beaufort Sea visible on the CS2/SMOS map.
By way of explanation for that phenomenon see the March sea level pressure map from the latest edition of the NSIDC’s Arctic Sea Ice News:
As in previous years there is already a thread devoted to this year’s minimum extent. By way of a summary here are the end of August numbers for our favourite “high resolution” AMSR2 area and extent metrics:
Extent is currently near the top of the range of the last 10 years.
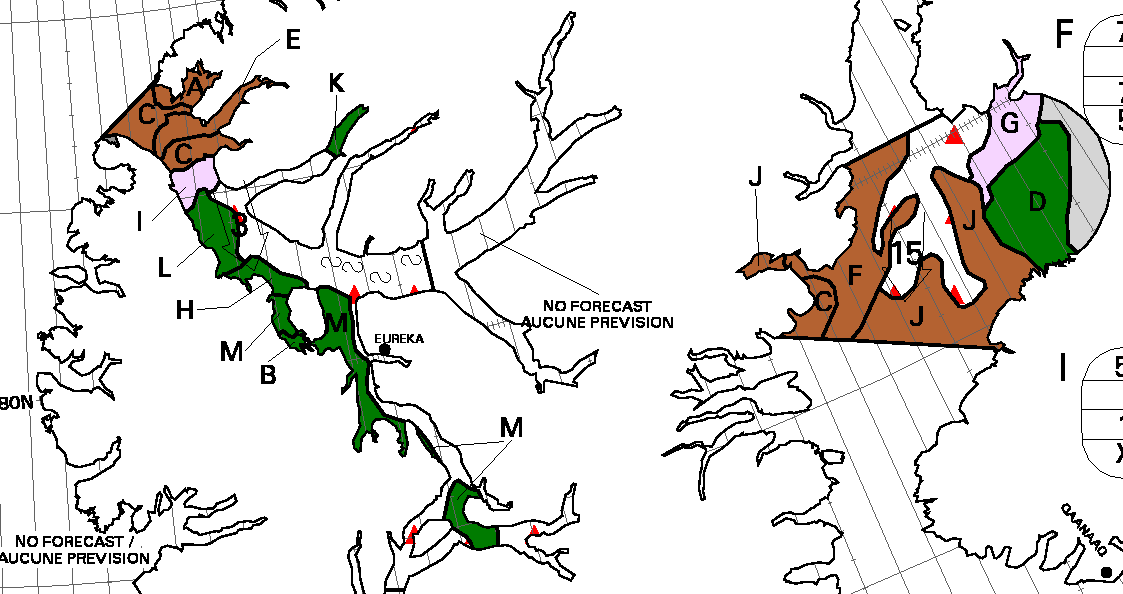
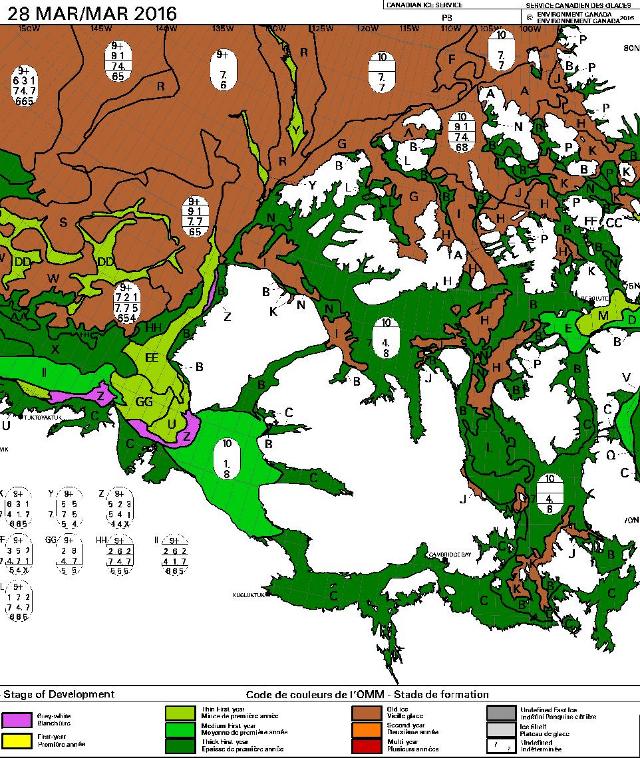
We have now reached the stage of the “melting season” when “refreezing” has started in the Central Arctic but melting at the periphery is outpacing it. However the Canadian Ice Service stage of development charts now show the arrival of new ice in the high latitudes of the Canadian Arctic Archipelago:
A detailed dissection of the 2021 minimum of various Arctic sea ice extent metrics can be found on a dedicated thread. All other Arctic news in September will be found below.
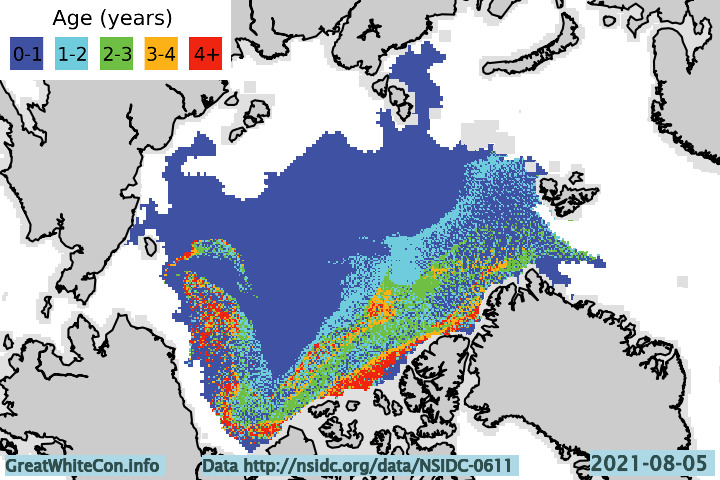
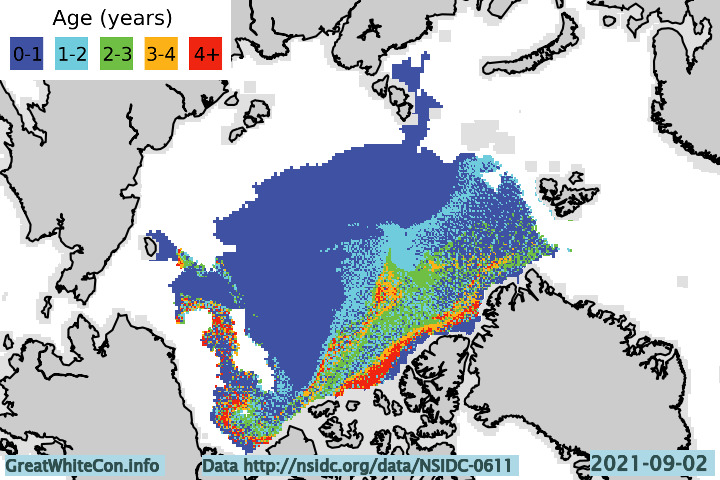
Let’s start with a map of sea ice age at the beginning of August:
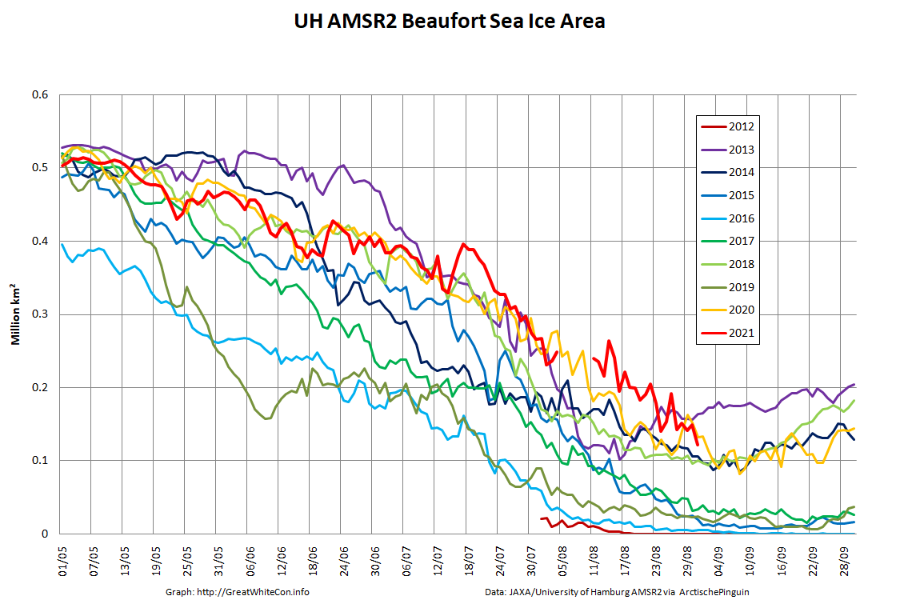
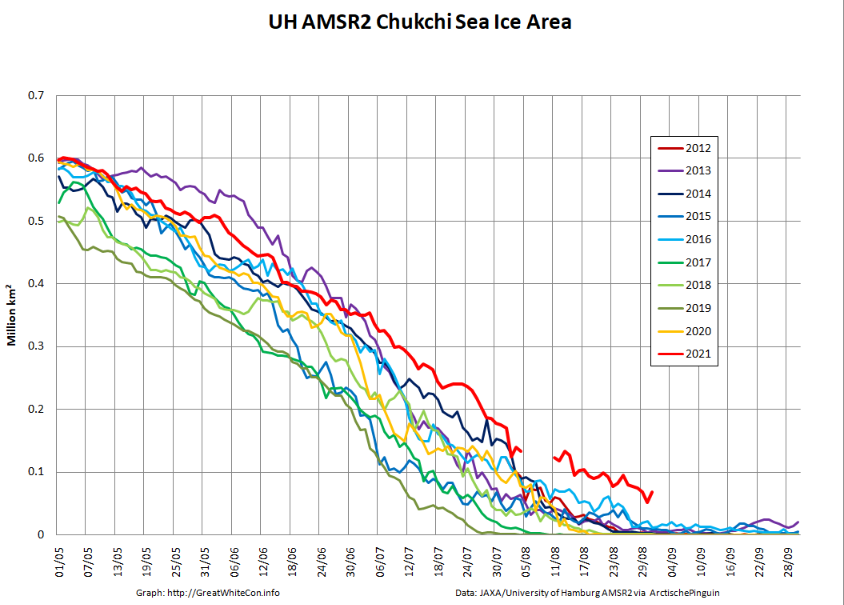
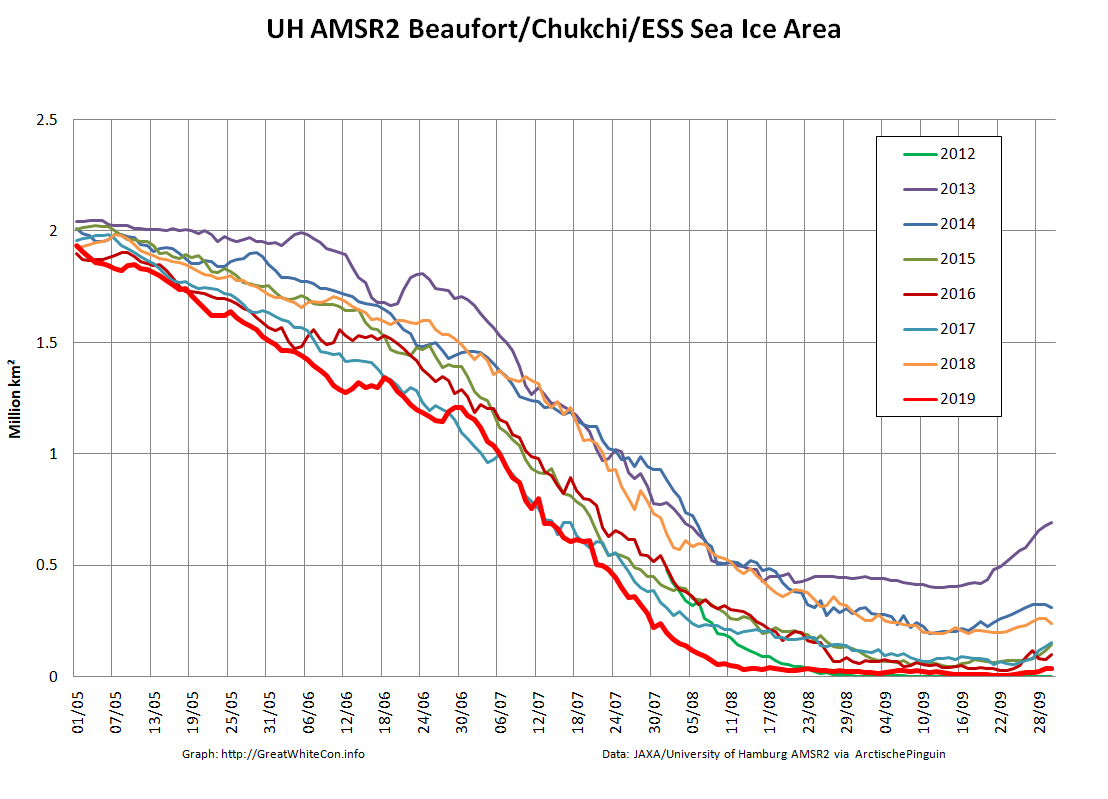
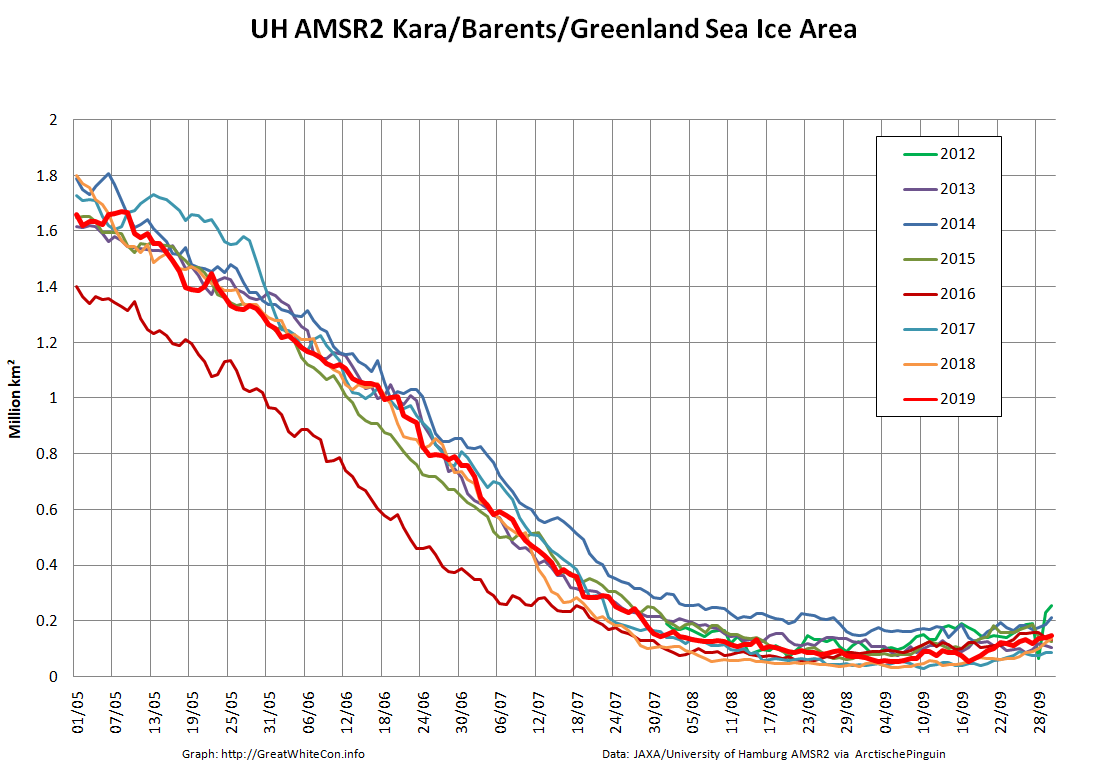
Firstly notice the absence of 3+ year old ice off the coast of north east Greenland. Also visible is a band of 4+ year old ice across the Pacific side of the Arctic Basin, which has slowed melting in the region and explains the following regional sea ice area graphs:
Next here’s the current AMSR2 concentration map:
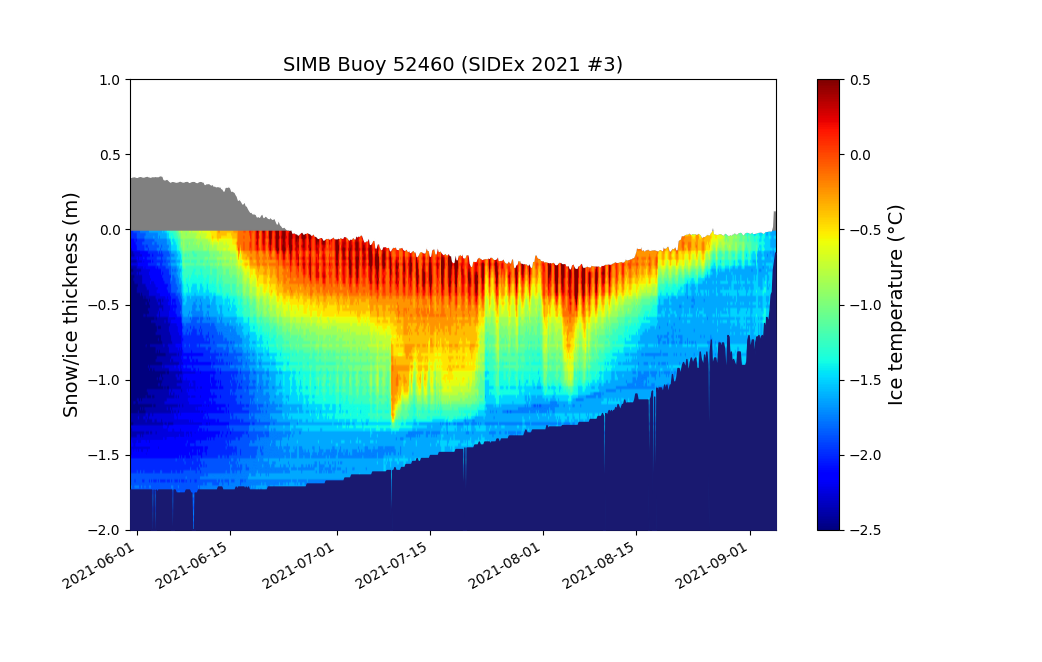
There is currently a large area of open water in the Wandel Sea to the north of Greenland. There is also an arm of old ice across the Beaufort and Chukchi Seas which is still clearly visible, but also visible is the recent reduction in sea ice concentration in the region. By way of explanation, here’s another look at the thickness of an ice floe currently situated to the north of the Chukchi at 74.84 N, 164.29 W, as measured by an ice mass balance buoy:
As the 2021 melting season draws towards its conclusion the floe is experiencing rapid bottom melt. How much longer will this floe and others like it last? Will it survive to become an “old ice” dot on next year’s ice age maps?
[Edit – September 6th]
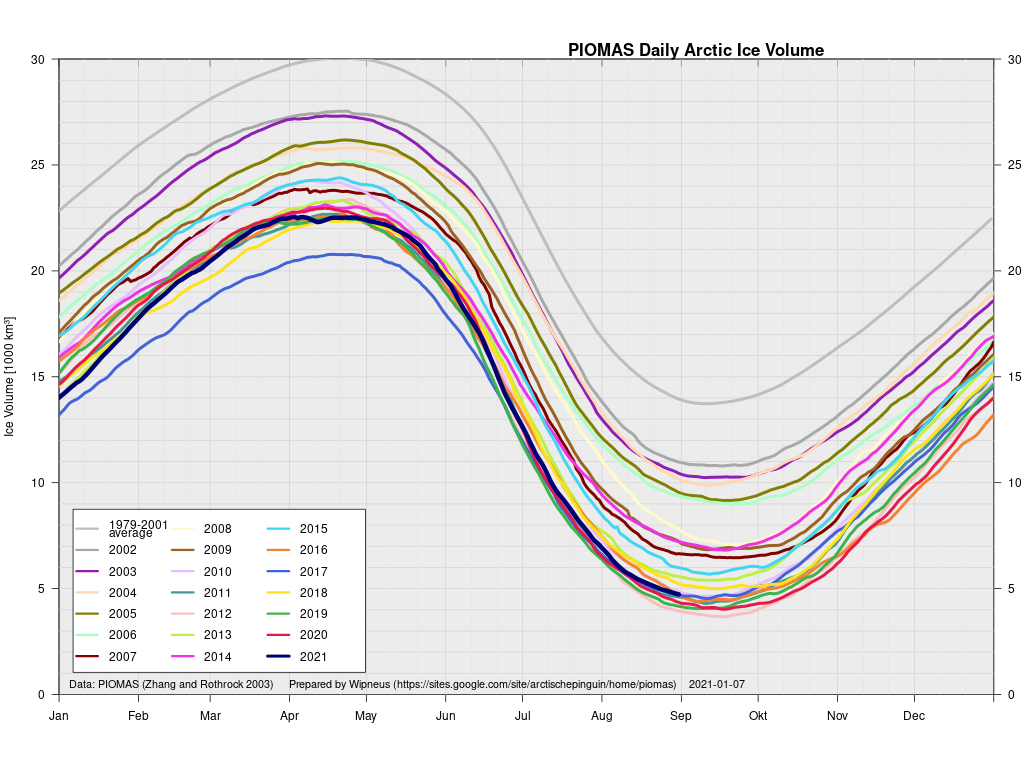
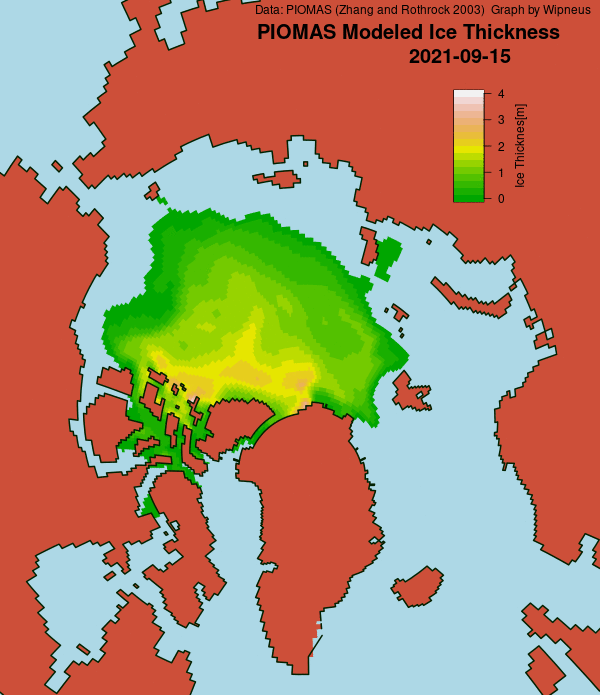
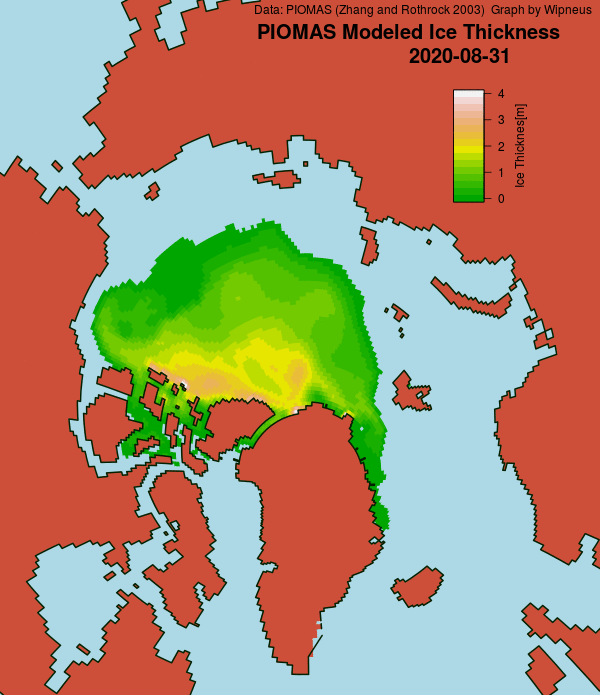
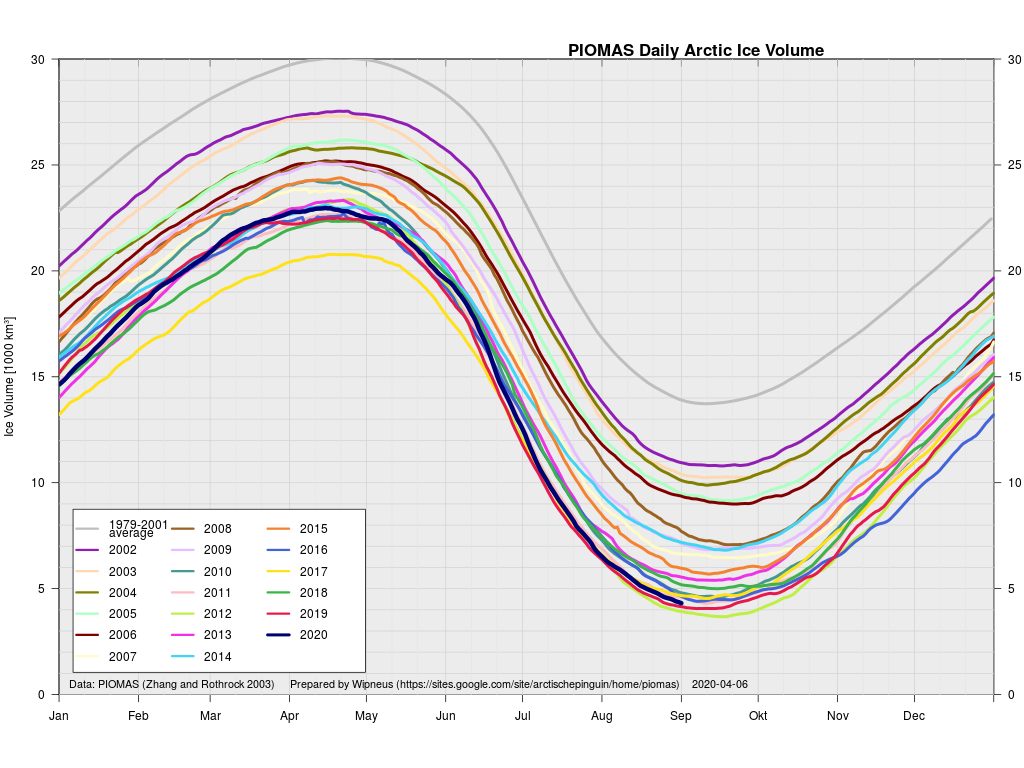
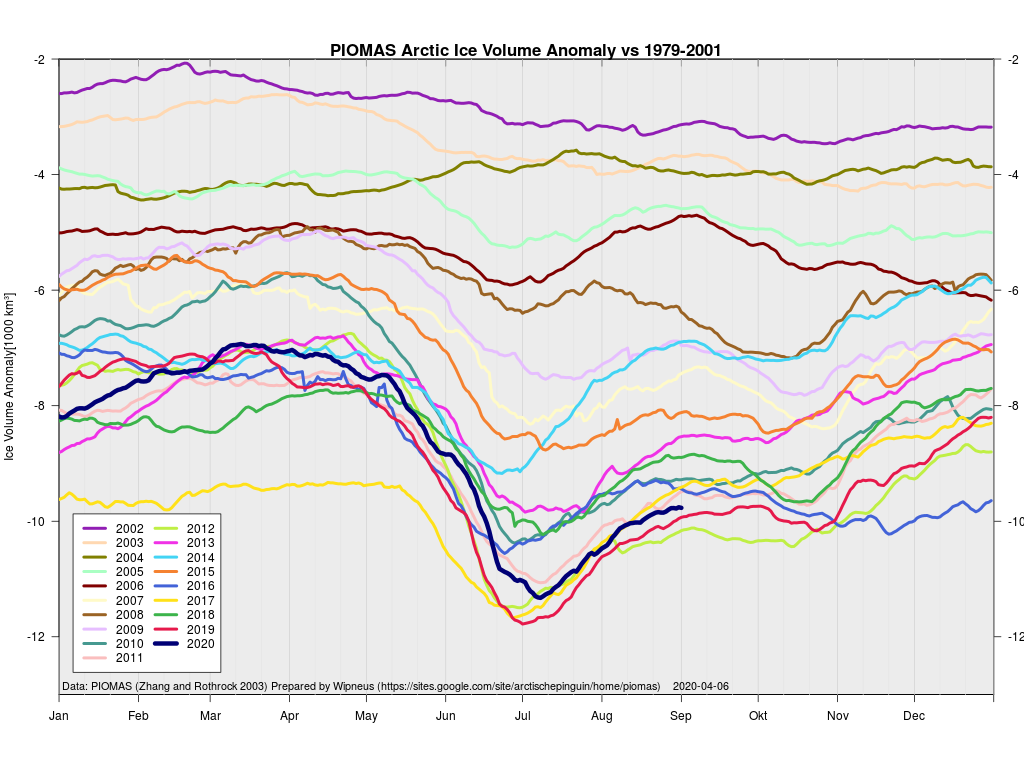
As Wipneus puts it on the Arctic Sea Ice Forum, “PIOMAS has updated the gridded thickness data up to the 31st of August”. Here’s the latest modelled thickness map, which shows the thickest remaining ice located north of the Canadian Arctic Archipelago rather than north of Greenland:
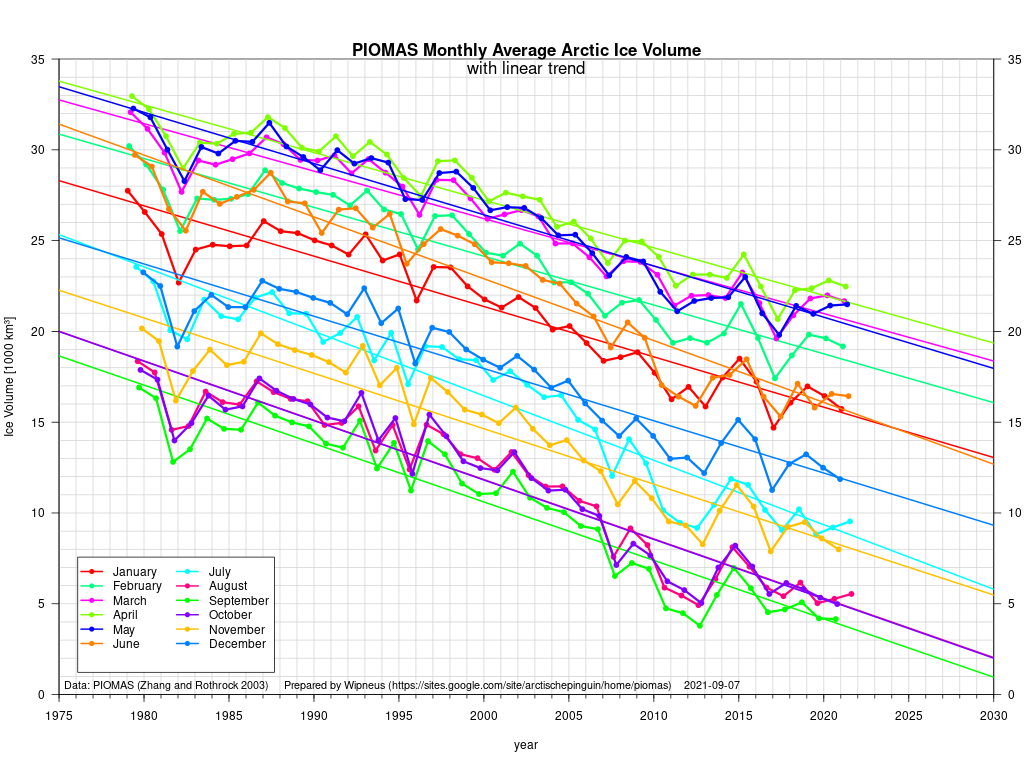
The accompanying volume graph shows 2021 in 7th lowest position, at 4.7 thousand km3:
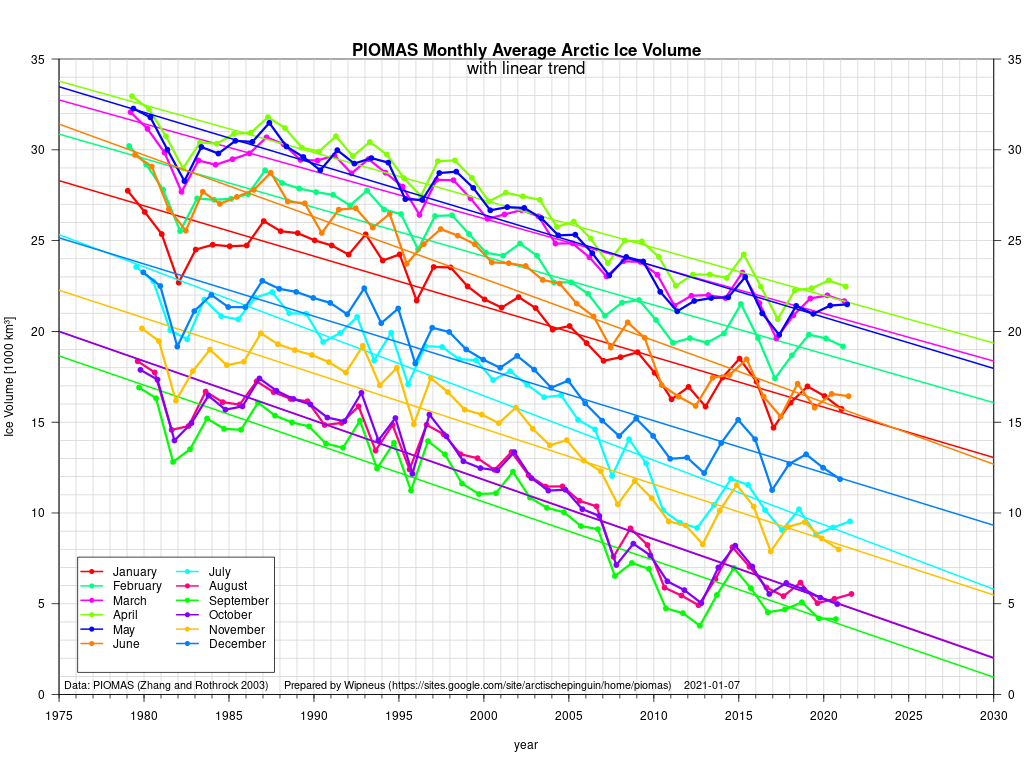
Here too are the current PIOMAS volume trends for each month of the year:
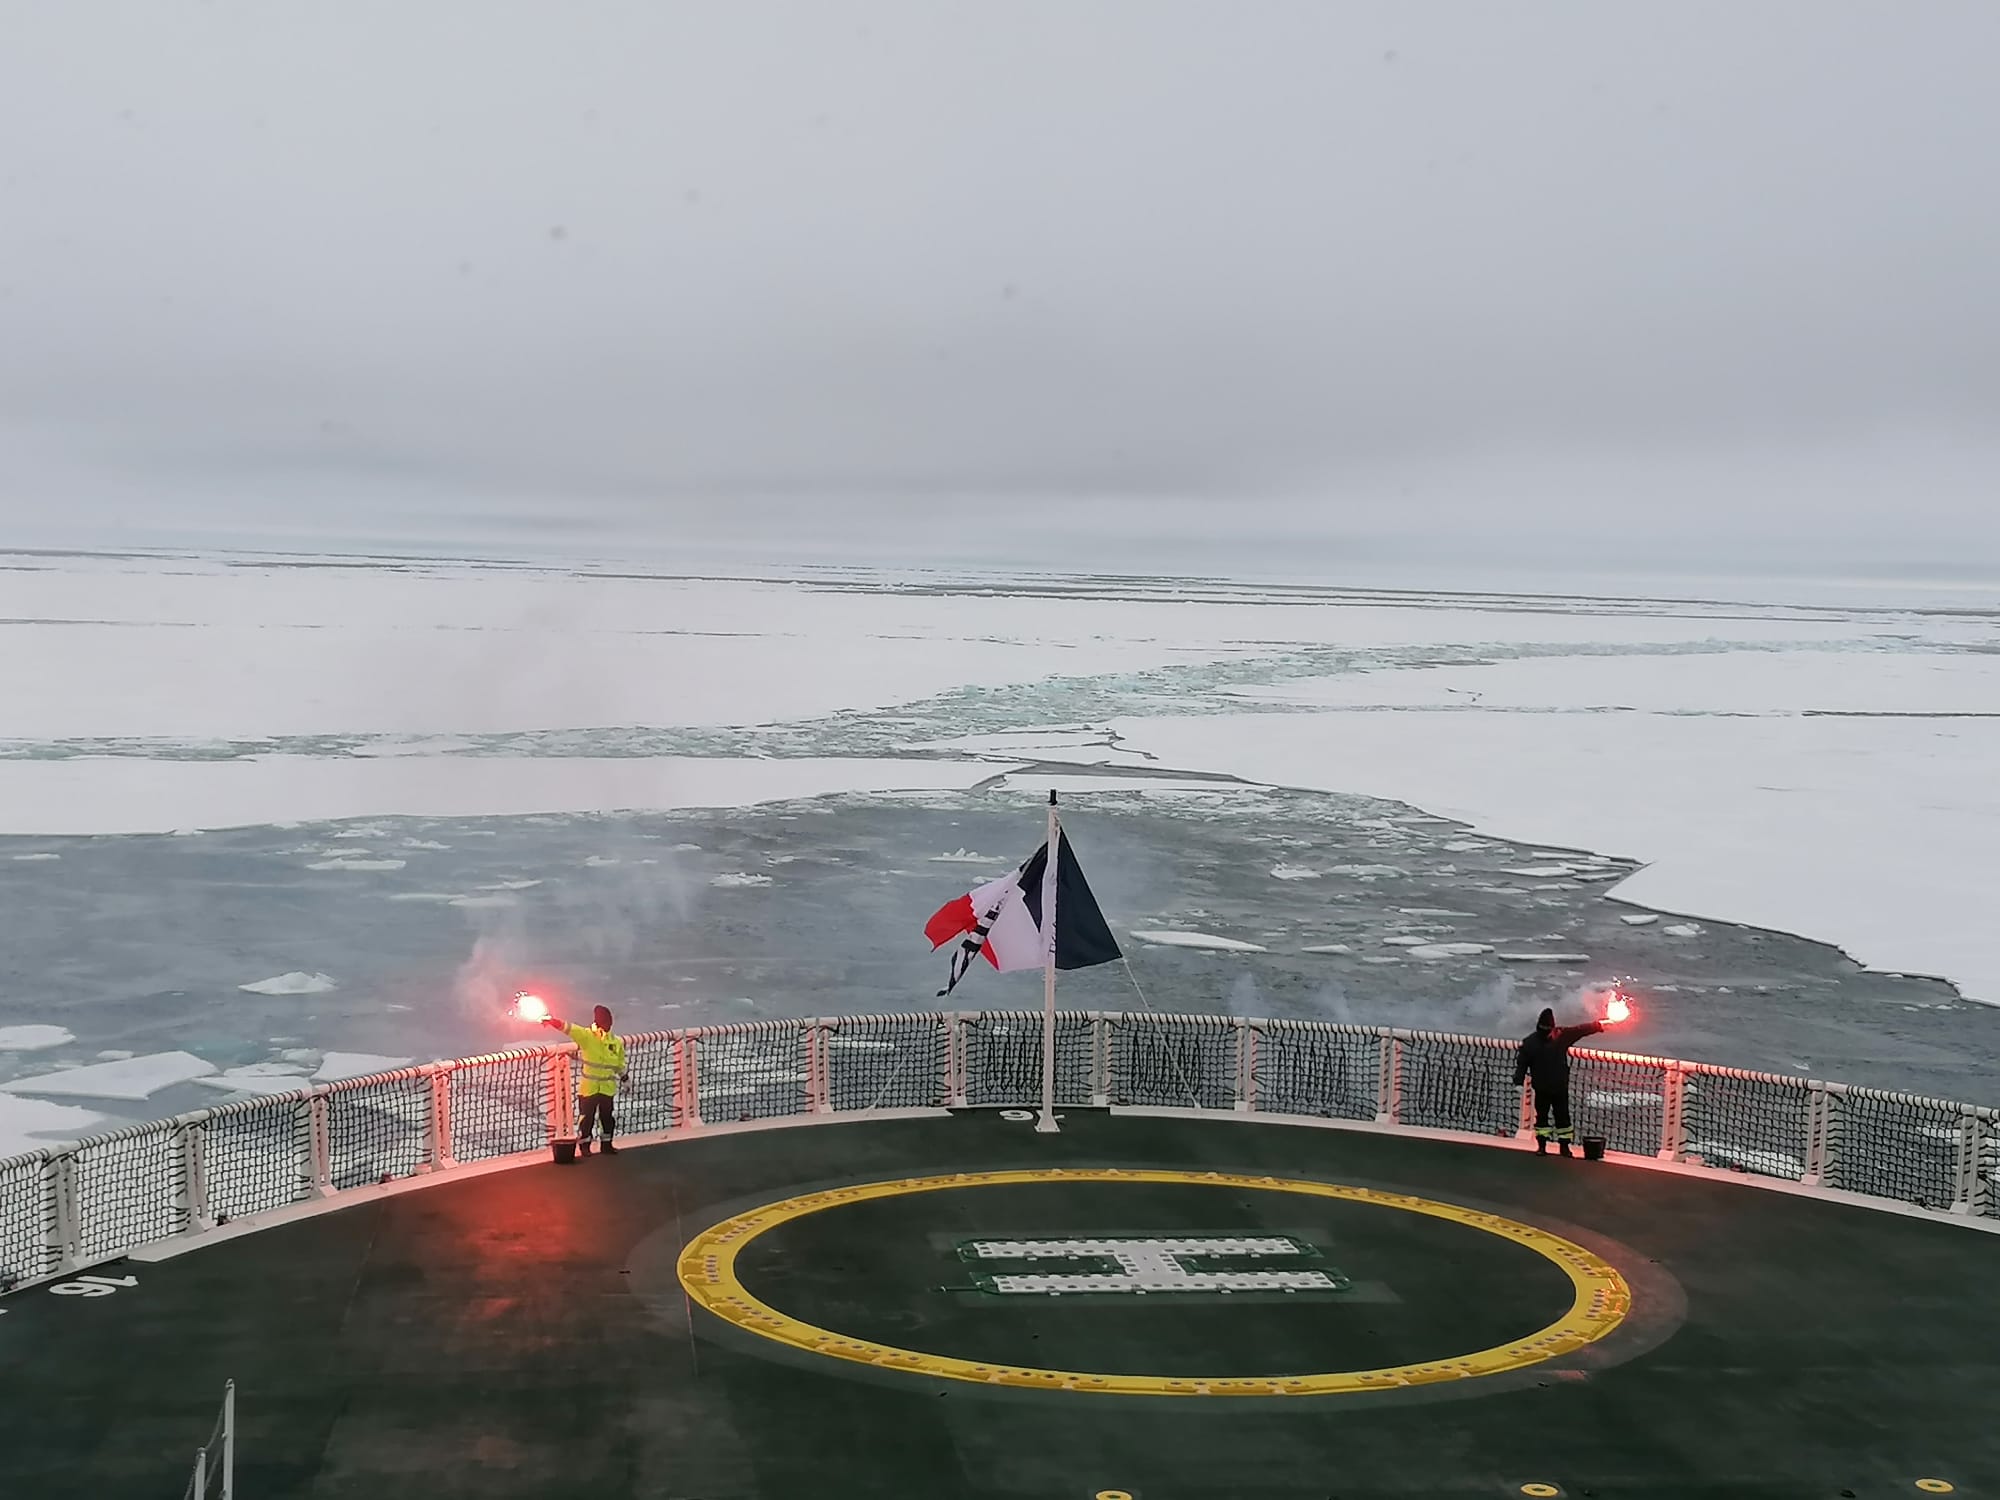
The Swedish icebreaker Oden has recently been exploring the area between northern Greenland and the North Pole as part of the Synoptic Arctic Survey expedition:
Here are the measurements of water temperature it has recorded over the past few days:
Ranging between -0.4 °C and -1.0 °C it doesn’t look as though the 2021 refreeze will be starting in the Wandel Sea just yet.
That shows plenty of old ice still left in the Beaufort Sea. However ice mass balance buoy 52460 now appears to floating free of its ice floe at 75.56 N, 165.99 W:
[Edit – September 14th]
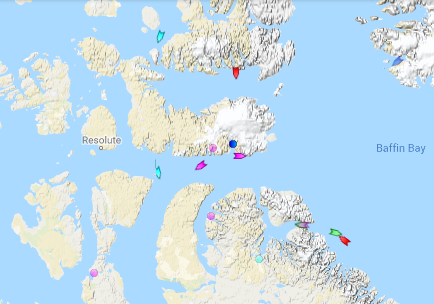
“New ice” has started to appear in previously open water on the Canadian Ice Service charts. See area E south east of Resolute:
Volume calculated from the thickness data currently show that 2021’s minimum was reached on September 7th at 4.64 thousand km3, which is the 8th lowest value in the Polar Science Center’s record.
[Edit – September 23rd]
NASA have just announced a new paper about clouds in the Arctic. Highly relevant given their recent overview of the 2021 melting season!
Clouds are one of the biggest wildcards in predictions of how much and how fast the Arctic will continue to warm in the future. Depending on the time of the year and the changing environment in which they form and exist, clouds can both act to warm and cool the surface below them.
For decades, scientists have assumed that losses in Arctic sea ice cover allow for the formation of more clouds near the ocean’s surface. Now, new NASA research shows that by releasing heat and moisture through a large hole in sea ice known as a polynya, the exposed ocean fuels the formation of more clouds that trap heat in the atmosphere and hinder the refreezing of new sea ice.
The findings come from a study over a section of northern Baffin Bay between Greenland and Canada known as the North Water Polynya. The research is among the first to probe the interactions between the polynya and clouds with active sensors on satellites, which allowed scientists to analyze clouds vertically at lower and higher levels in the atmosphere.
The approach allowed scientists to more accurately spot how cloud formation changed near the ocean’s surface over the polynya and the surrounding sea ice.
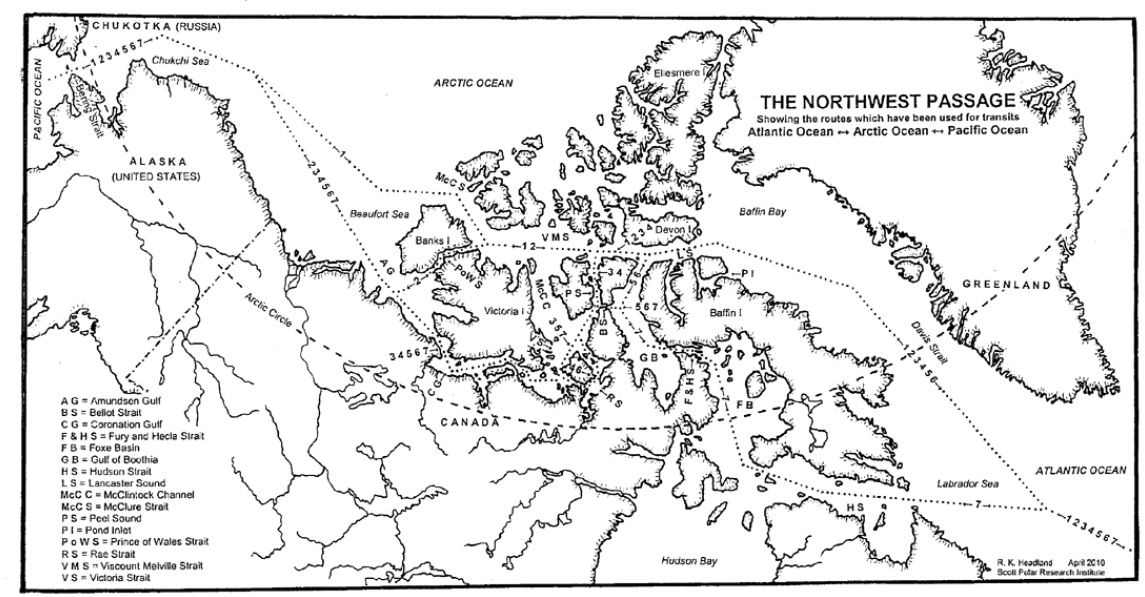
Prompted by a comment on the Northwest Passage thread from last year I’m opening the 2021 equivalent earlier than usual, in part because there’s already a lot going on of interest. First of all let’s get our bearings with the help of this map of the area:
and another map detailing the routes through Canadian Arctic Archipelago that have previously been successfully traversed:
The forecast high pressure has arrived and the skies have cleared over the Beaufort Sea, which reveals that the land-fast ice off the Mackenzie Delta has started breaking up:
In addition the snow has been melting along the valley of the Mackenzie River, and the resulting increased flow at the mouth of the delta is flooding the fast ice:
A detailed dissection of the 2020 minimum of various Arctic sea ice extent metrics can be found on a dedicated thread. All other Arctic news in September will be found below. As is usually the case, let’s set the ball rolling by taking a look at Wipneus’s visualisations of the August PIOMAS gridded thickness data:
together with the computed volume:
and anomaly graphs:
PIOMAS volume at the end of August was still firmly in 3rd place behind 2012 and 2019.
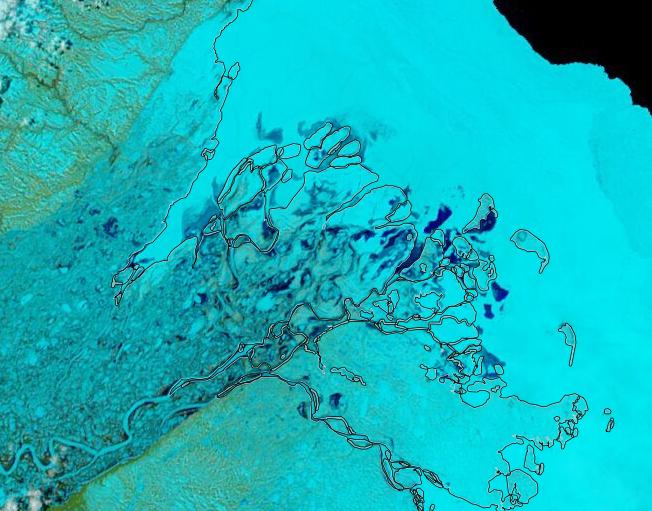
Whilst we await the PIOMAS volume numbers which generally arrive around the 5th of each month, and before we look at graphs of extent, with the refreeze well under way some “measured” thickness maps are coming back! Here’s the first SMOS map this autumn:
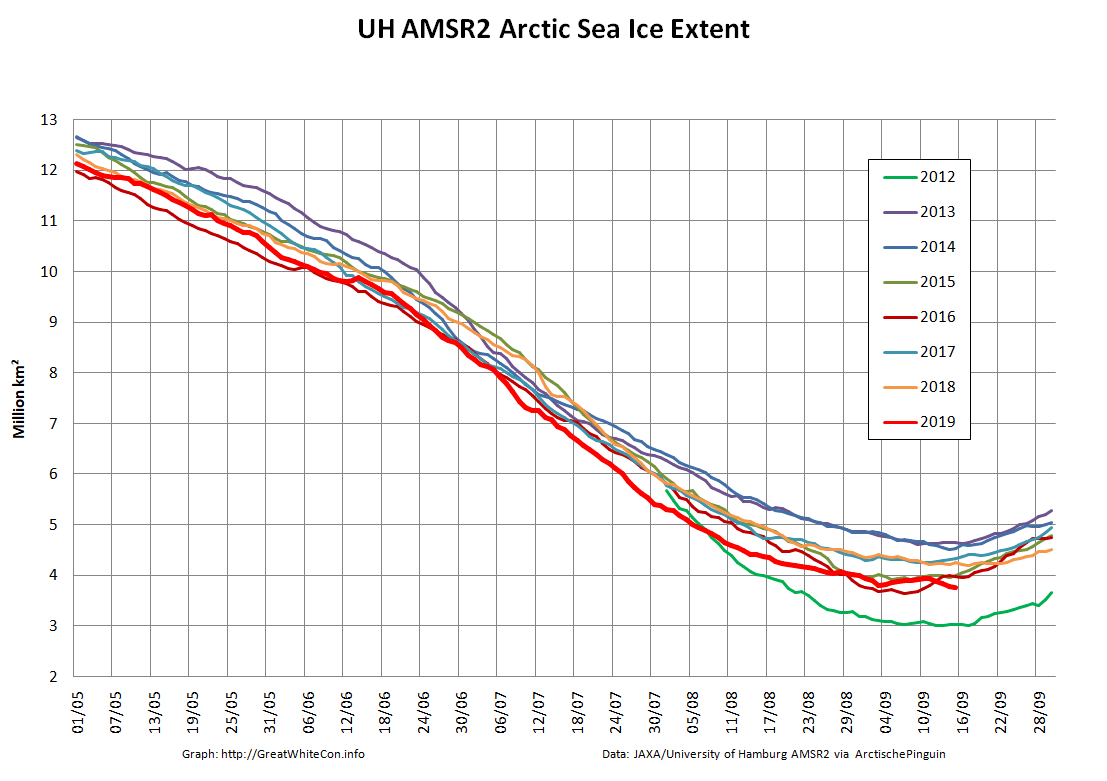
Then of course there’s our usual Arctic wide high resolution AMSR2 area and extent graphs:
They reveal both metrics currently still second lowest (in the brief AMSR2 record) after 2012. It looks as though that may well change soon, particularly area.
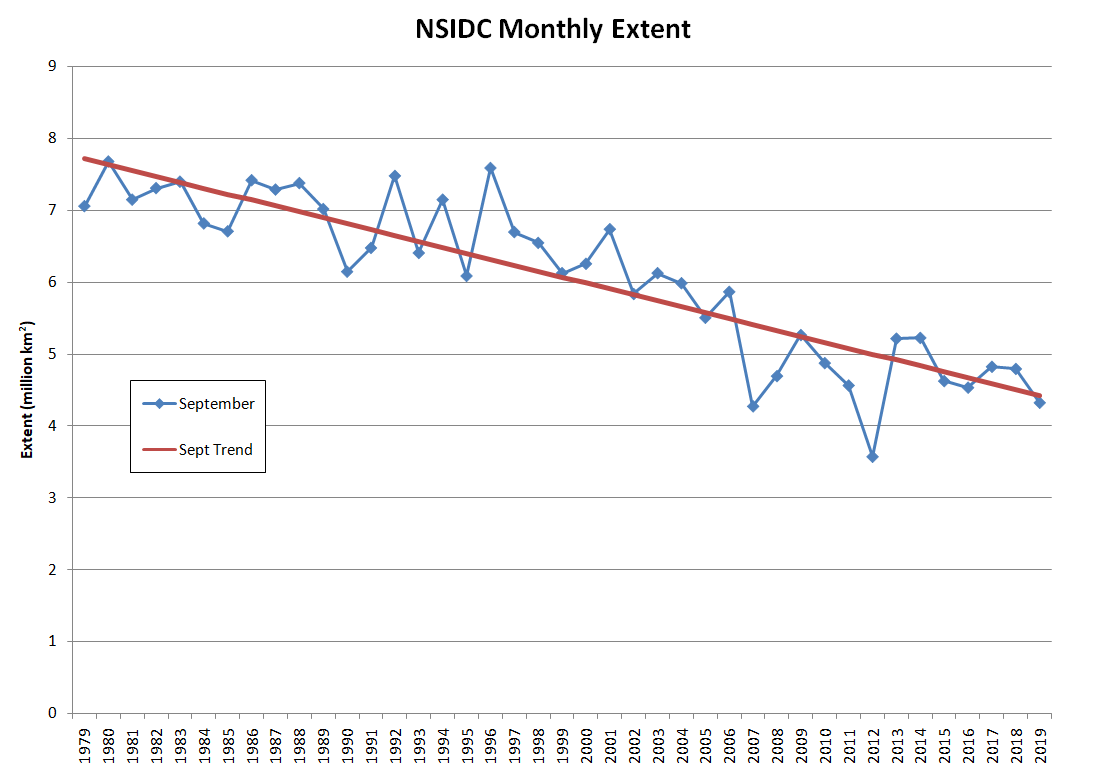
The near real time NSIDC monthly extent for September is 4.32 million km². Here’s the graph:
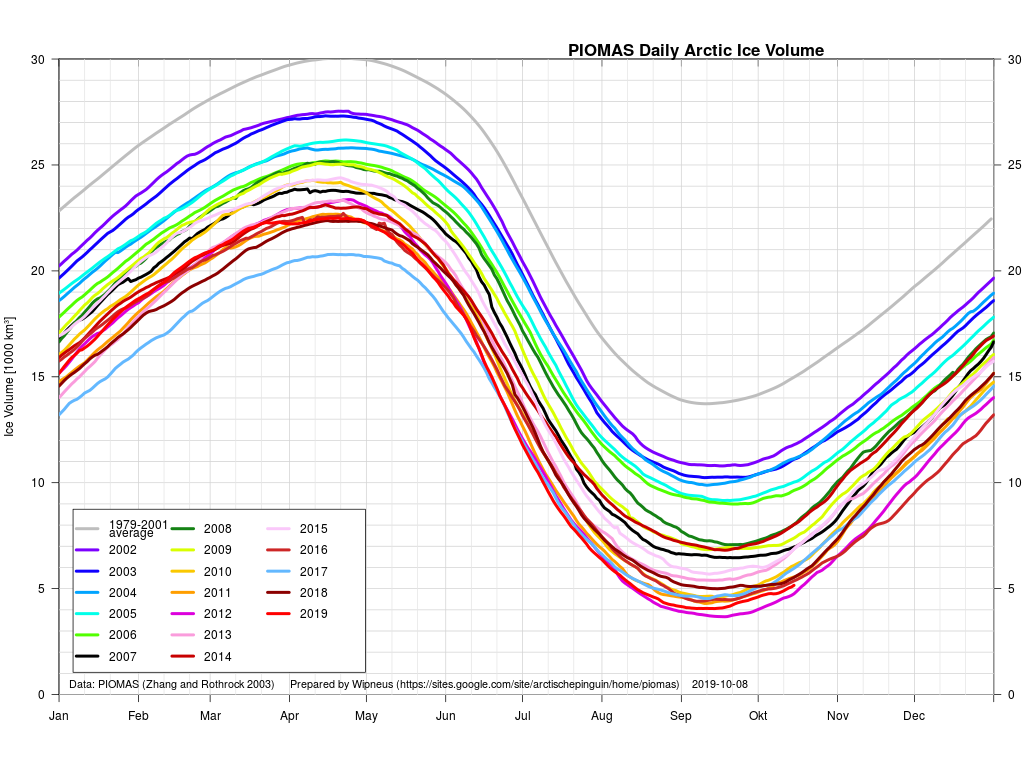
We’re eagerly awaiting the first ice mass balance buoy “near real time” data, but for now the 2019 PIOMAS minimum volume is expected to be revealed real soon now, so:
[Edit – October 5th]
As previously perfectly predicted, the PIOMAS numbers have arrived over at the ASIF. Here’s the thickness map for the end of September:
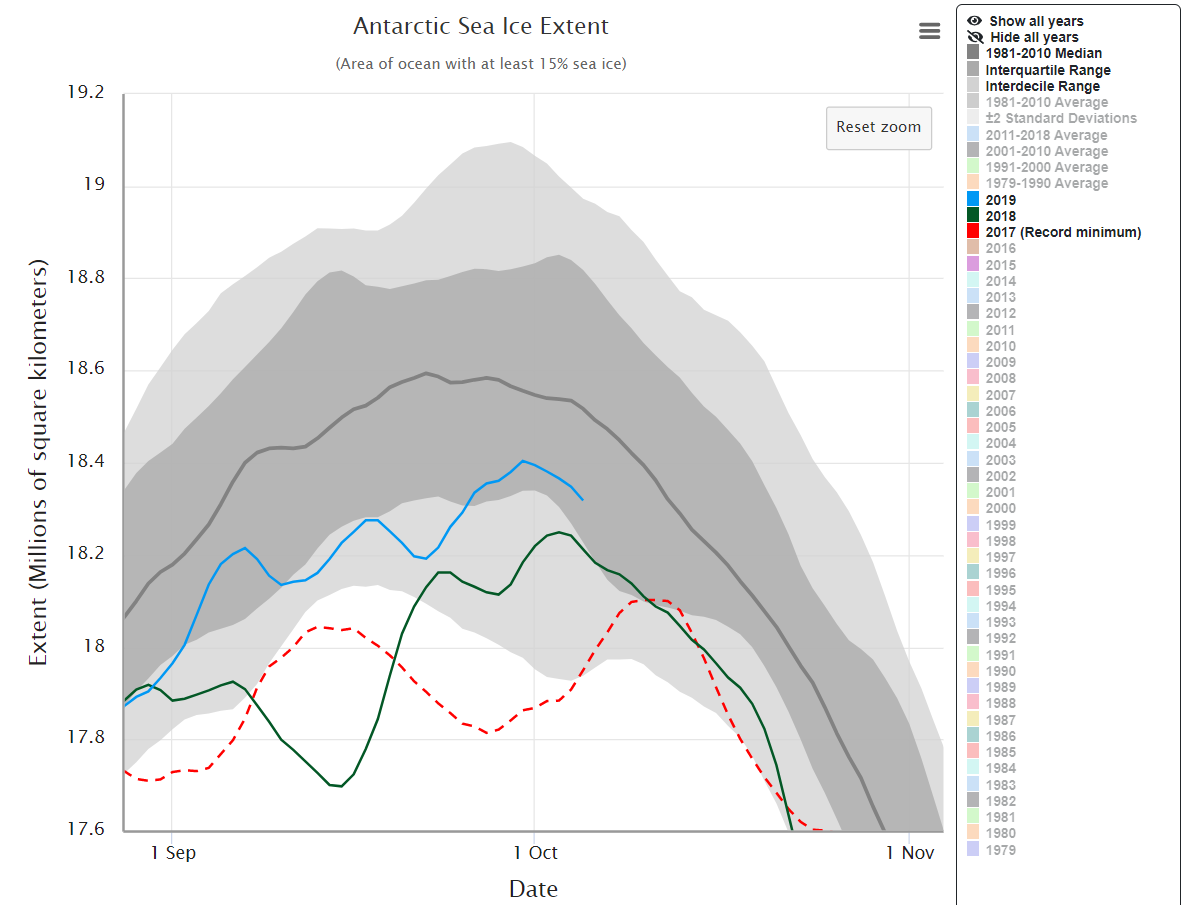
A marginally off topic excursion down under. The NSIDC 5 day average Antarctic sea extent looks to have peaked at 18.40 million km² on September 30th:
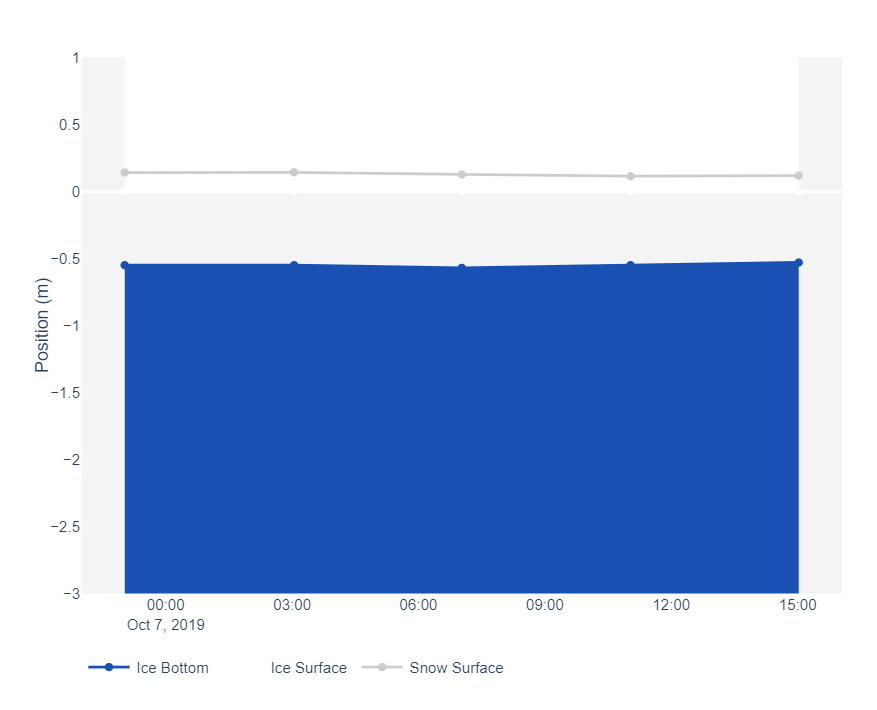
[Edit – October 7th]
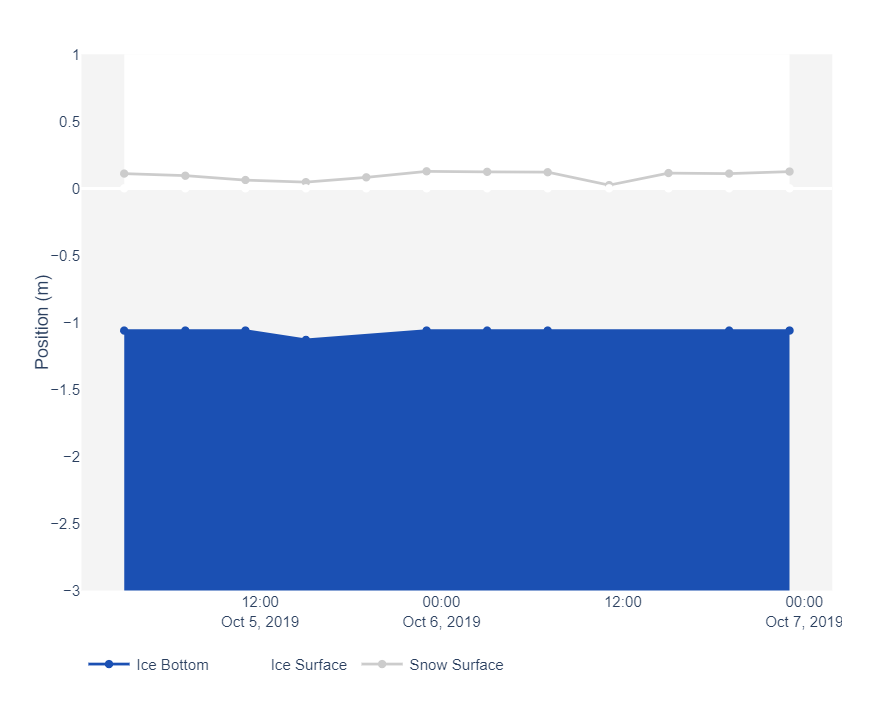
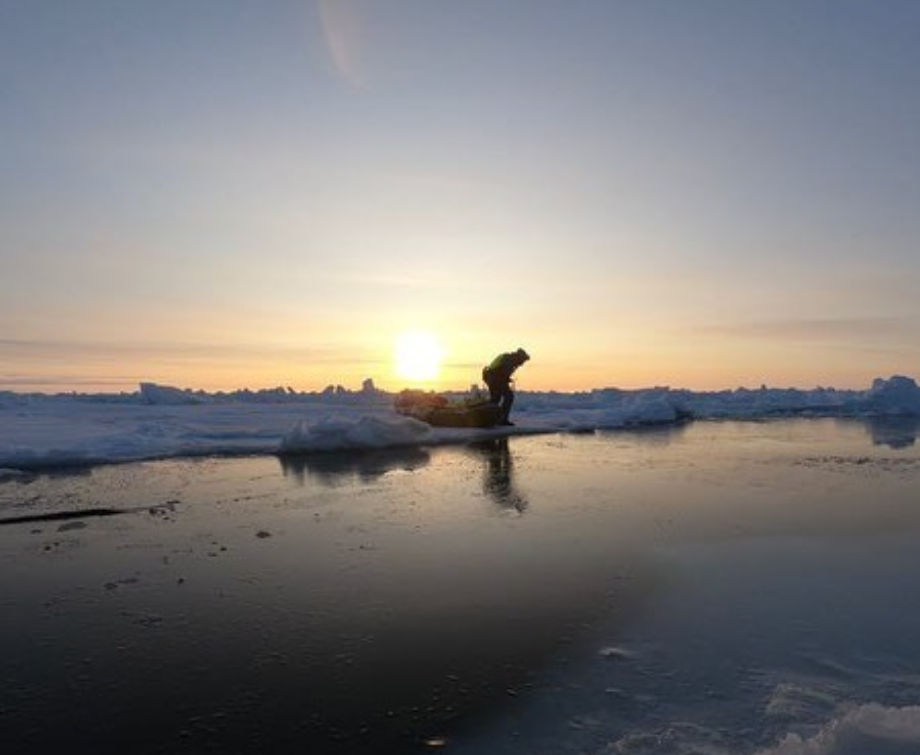
The first of the MOSAiC Expedition’s Ice Mass Balance buoys has been installed, presumably on the ice floe Polarstern is moored to. It reveals sea ice that is currently just over 1 meter thick with a sprinkling of snow on top:
P.S MOSAiC IMB buoy #3 has gone live today too:
There’s currently only 0.5 meters of ice under this one.
[Edit – October 9th]
Here’s the latest annual PIOMAS “ice cube” animation from Andy Lee Robinson:
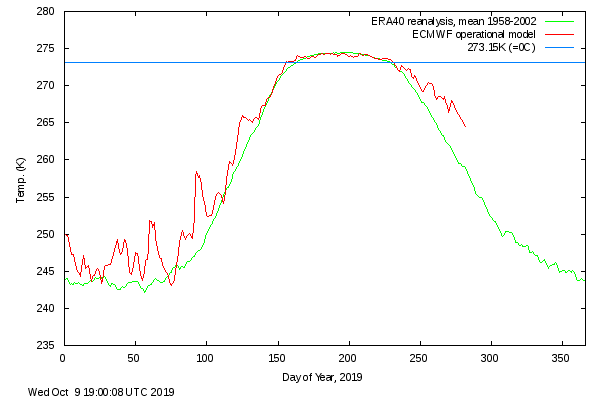
[Edit – October 10th]
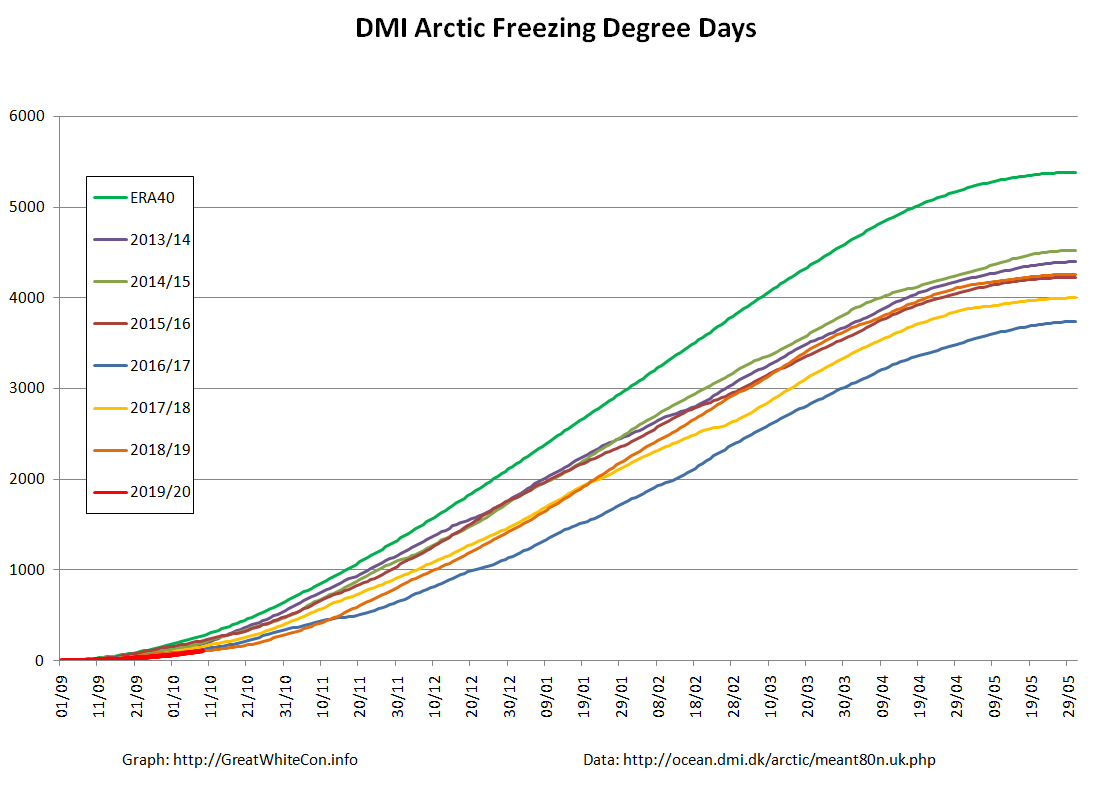
Here’s the latest DMI “high Arctic” temperature graph:
Needless to say that means the DMI Freezing Degrees Days graph is tracking the lowest readings in the DMI’s records:
[Edit – October 11th]
MOSAiC IMB buoy #2 has now been installed and is beaming back data:
The sea ice at this location is decidedly on the thin side at present. A mere 20 cm or thereabouts!
[Edit – October 12th]
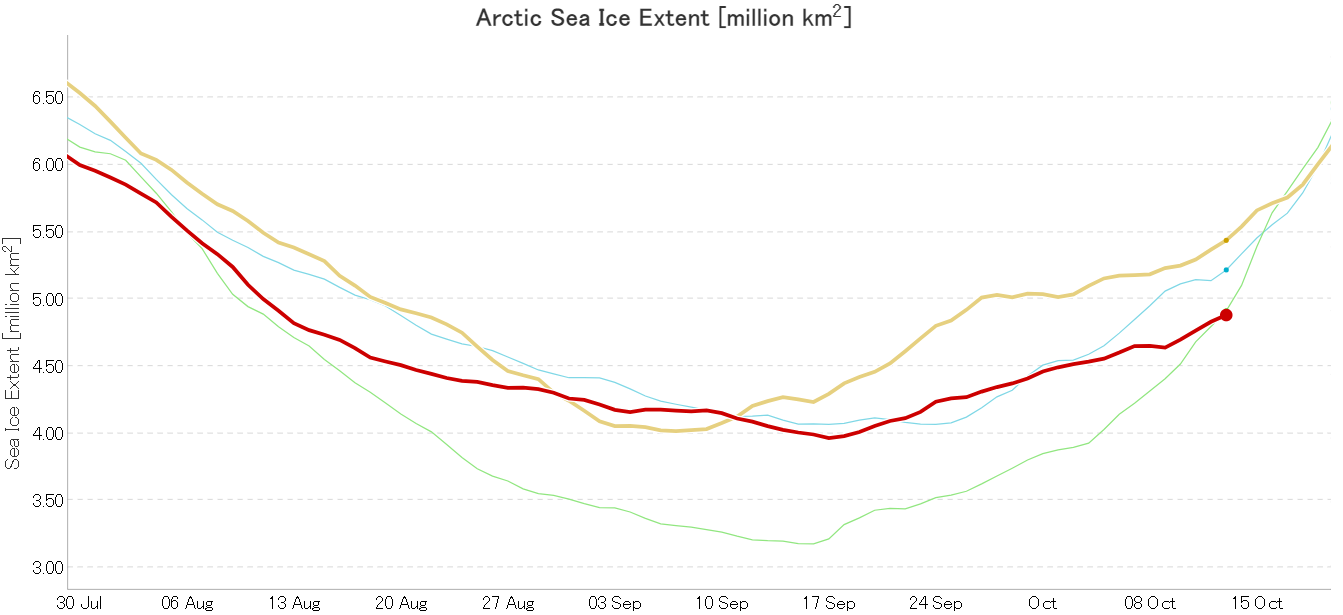
The JAXA ViSHOP web site is down at the moment, so by way of a change here is the University of Bremen’s AMSR2 based extent graph instead:
2019 Arctic sea ice is extent is now once again “lowest for the date” (since AMSRx satellite records began).
[Edit – October 14th]
The JAXA/ADS/ViSHOP web site is back online after being down over the weekend, presumably due to the effects of Typhoon Hagibis:
Sure enough the Japanese flavour of AMSR2 based extent is also now “lowest for the date”.
Mike and Borge’s current position was reported yesterday as: 89°35′51″N 140°30′32″E
[Edit – October 15th]
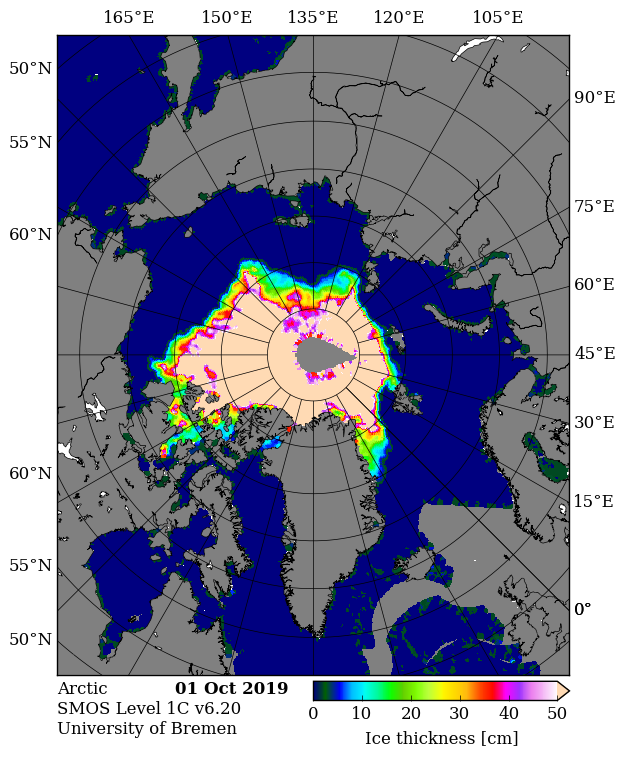
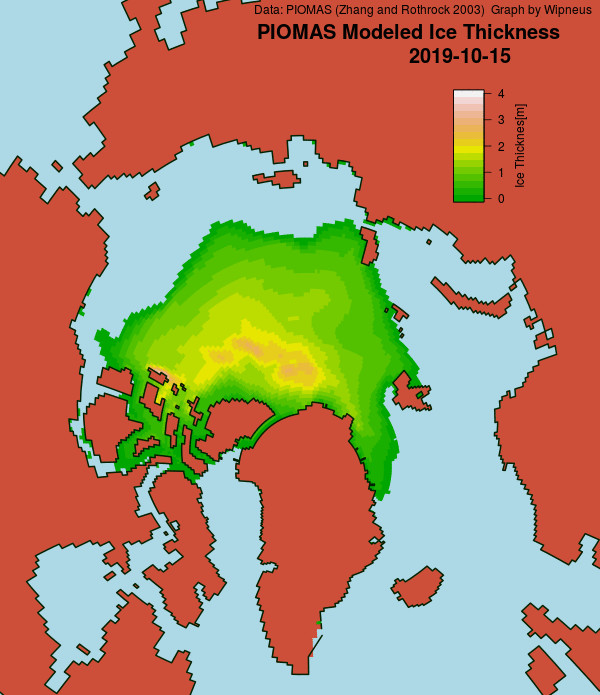
The latest SMOS Arctic sea ice “thinness” map shows sea ice starting to form on the shores of the Laptev Sea:
[Edit – October 16th]
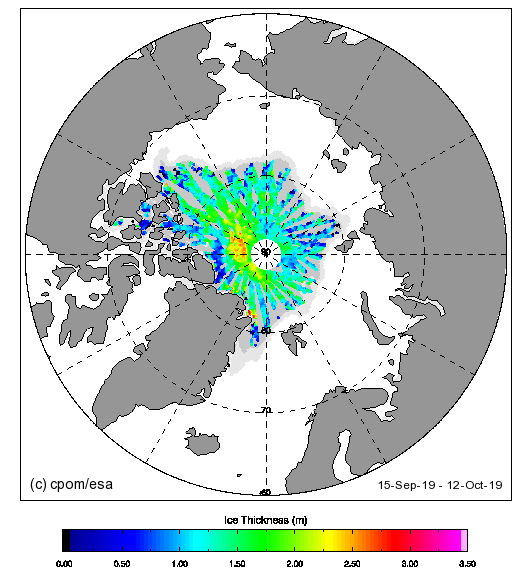
The Centre for Polar Observation and Monitoring (CPOM) have just published the first CryoSat-2 Arctic sea ice thickness map of the 2019/20 freezing season:
Note in particular the dark blue area north of the Canadian Arctic Archipelago.
[Edit – October 20th]
Wipneus has just crunched the October mid month PIOMAS numbers. Here are the results. Not only the modelled Arctic sea ice thickness map:
but also the Arctic sea ice volume graph:
[Edit – October 21st]
Over on Twitter Judah Cohen suggests that:
Maybe I will discuss more in the next blog but the #Arctic sea ice growth season on the North Pacific side of the Arctic is just nuts, like it is drunk! Looks unprecedented to me. This needs to be watched through the #winter. Already had 2 unprecedented winters in the Bering sea pic.twitter.com/sAVoZXgNAX
I have been trying to bring the implications of this to the attention of the denizens of Judith Curry’s “Climate Etc.” blog, thus far with remarkably little success! This is the gist of my argument:
“Summer solar heat absorption by the surface waters has increased fivefold over the same time period, chiefly because of reduced sea ice coverage.”
“The effects of an efficient local ice-albedo feedback are thus not confined to the surface ocean/sea ice heat budget but, in addition, lead to increased heat accumulation in the ocean interior that has consequences far beyond the summer season.”
“In the coming years, however, excess Beaufort Gyre halocline heat will give rise to enhanced upward heat fluxes year-round, creating compound effects on the system by slowing winter sea ice growth.”
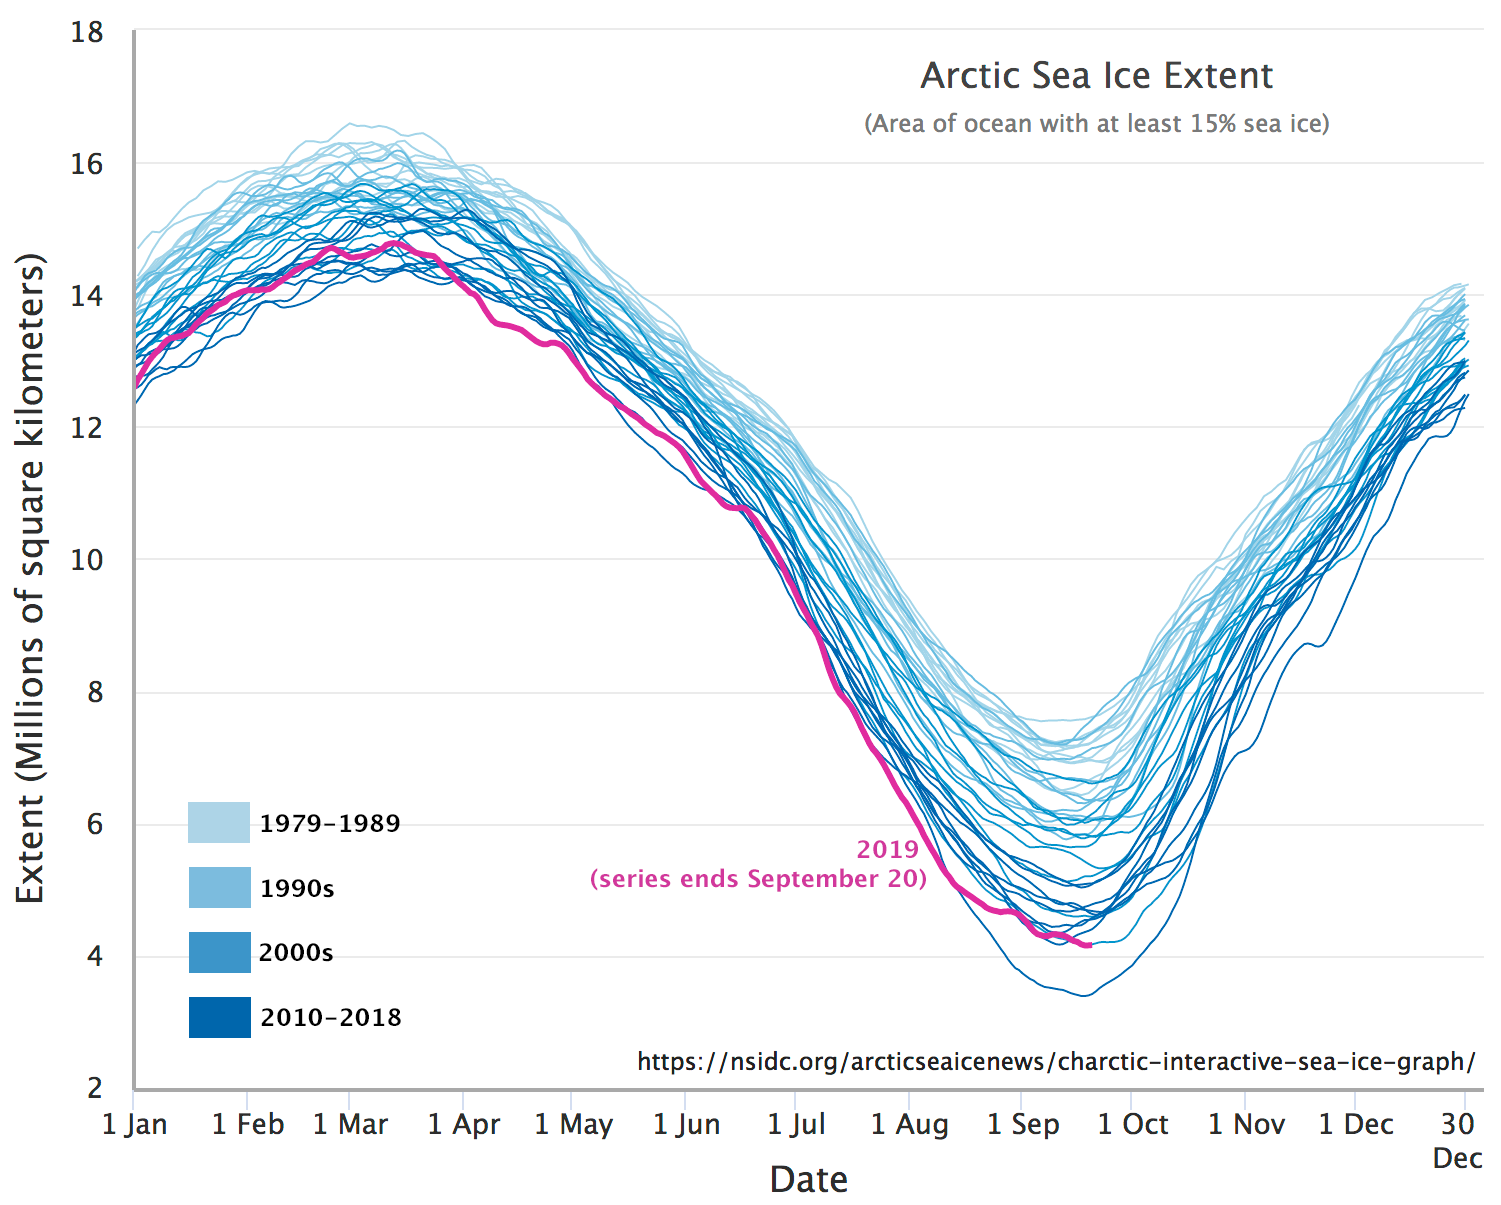
September is here once again, so the assorted minima of a variety of Arctic sea ice metrics will be reached soon, if they haven’t happened already!
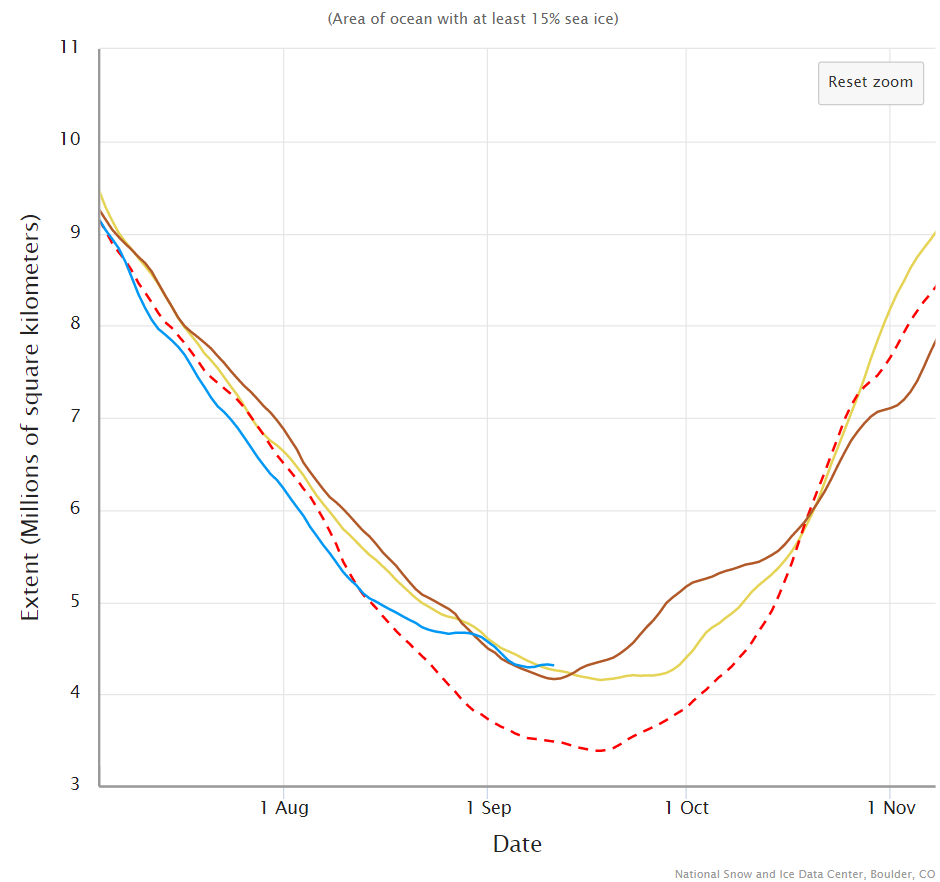
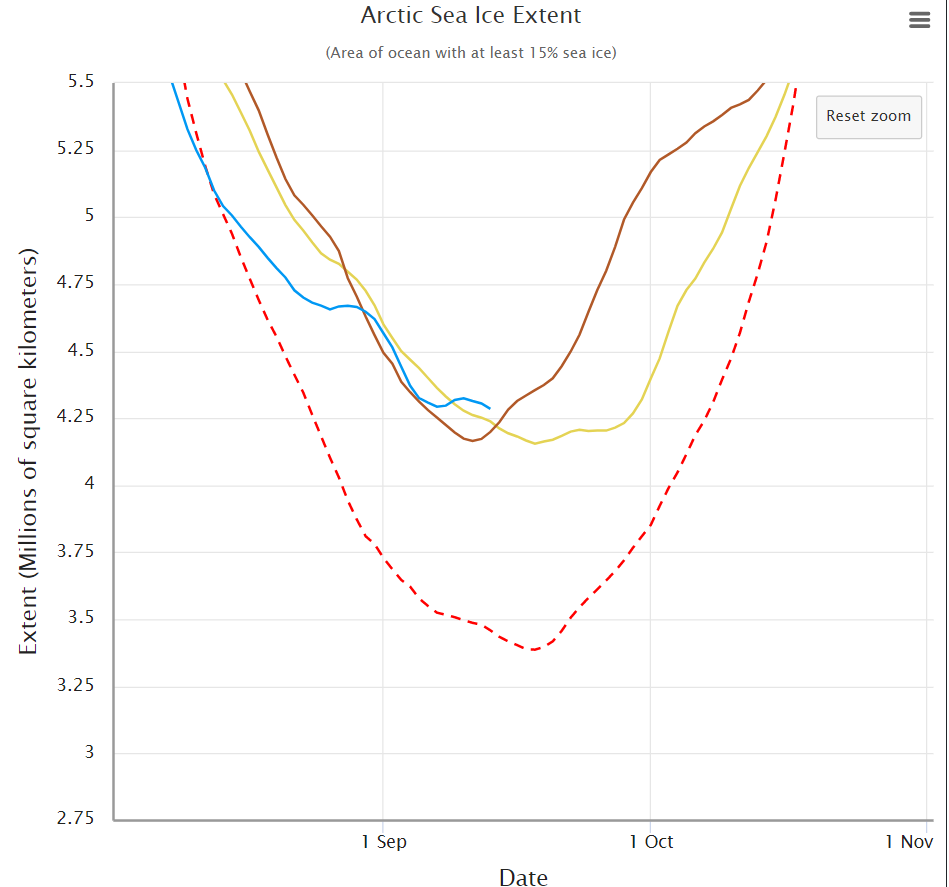
In the latter category let’s first take a look at the NSIDC’s 5 day averaged SSMIS based Arctic sea ice extent:
It looks entirely feasible that the current minimum of 4.29 million square kilometres on September 7th will hold for the rest of the calendar year. The daily NSIDC number is currently 4.24 million km² on September 4th.
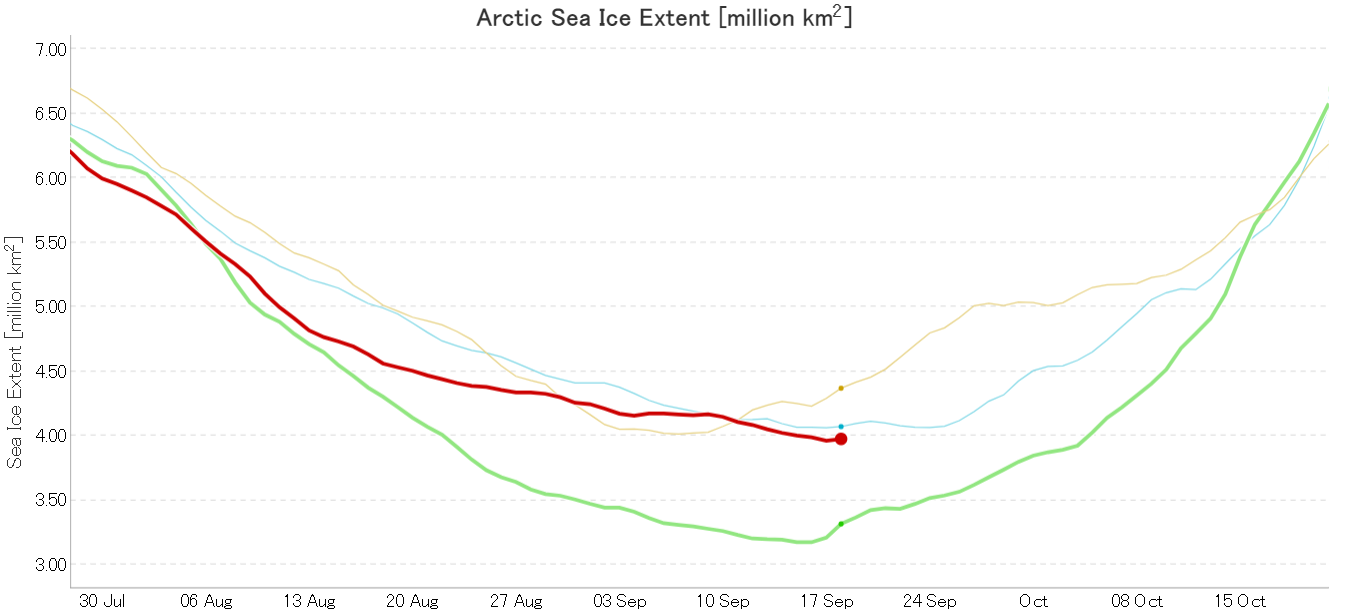
By way of contrast the JAXA/ViSHOP AMSR2 based extent hit a new low of 4.11 million km² yesterday:
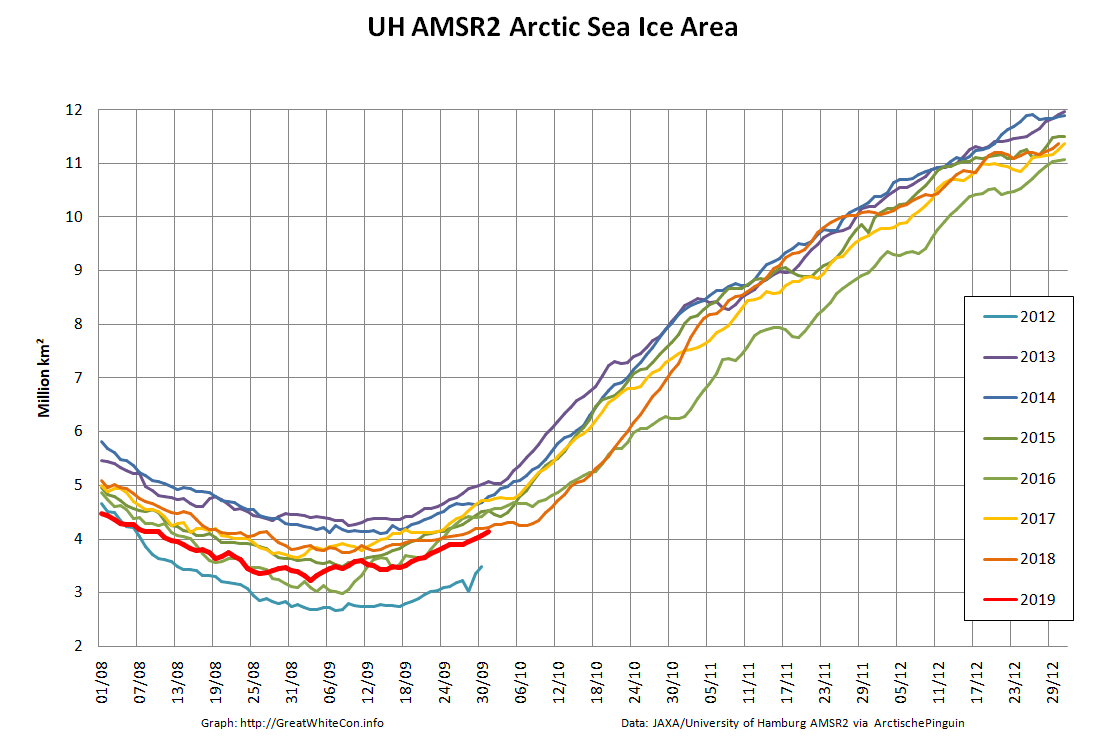
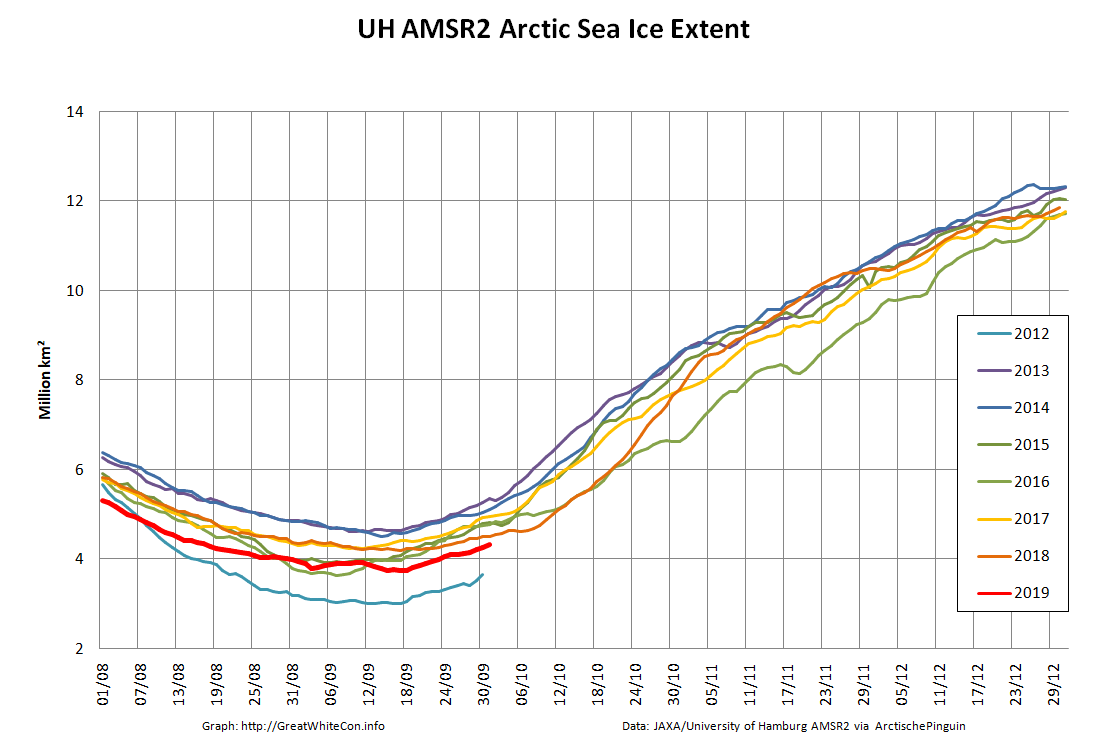
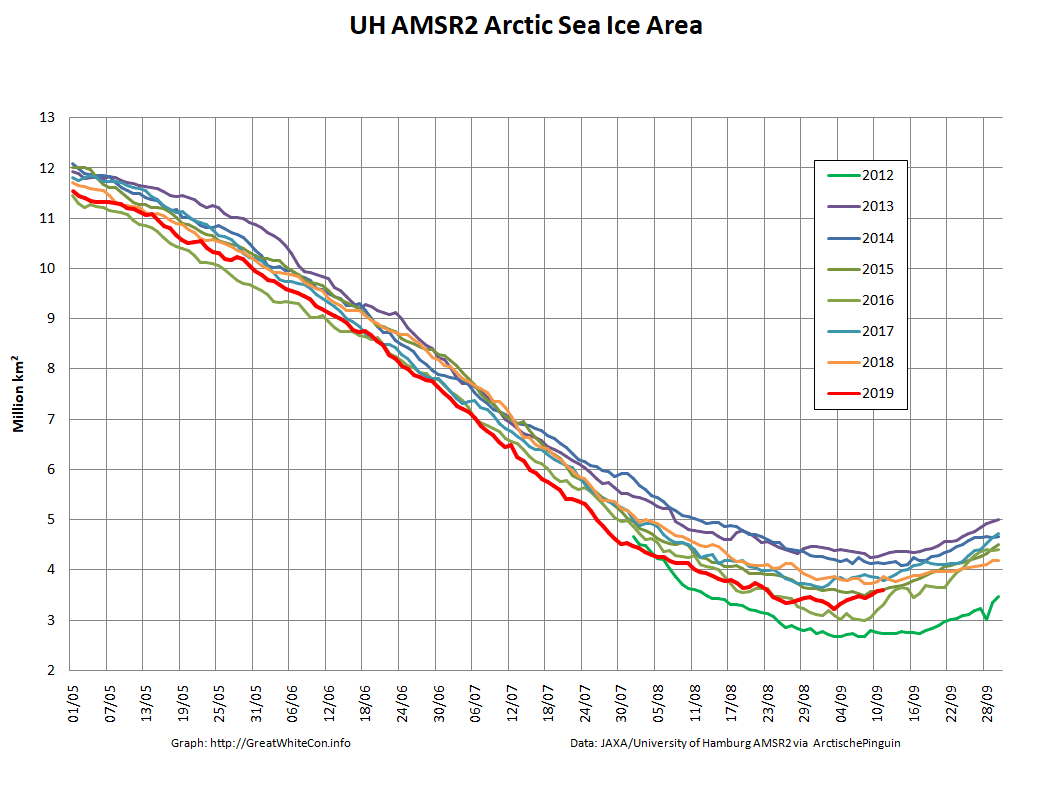
And what of our much beloved high resolution AMSR2 metrics derived by “Wipneus” from the University of Hamburg’s AMSR2 concentration data? Area certainly looks to be past the minimum for this year, whereas extent is still conceivably capable of another push lower:
The provisional minimum extent for 2019 is 3.80 million km² on September 3rd.
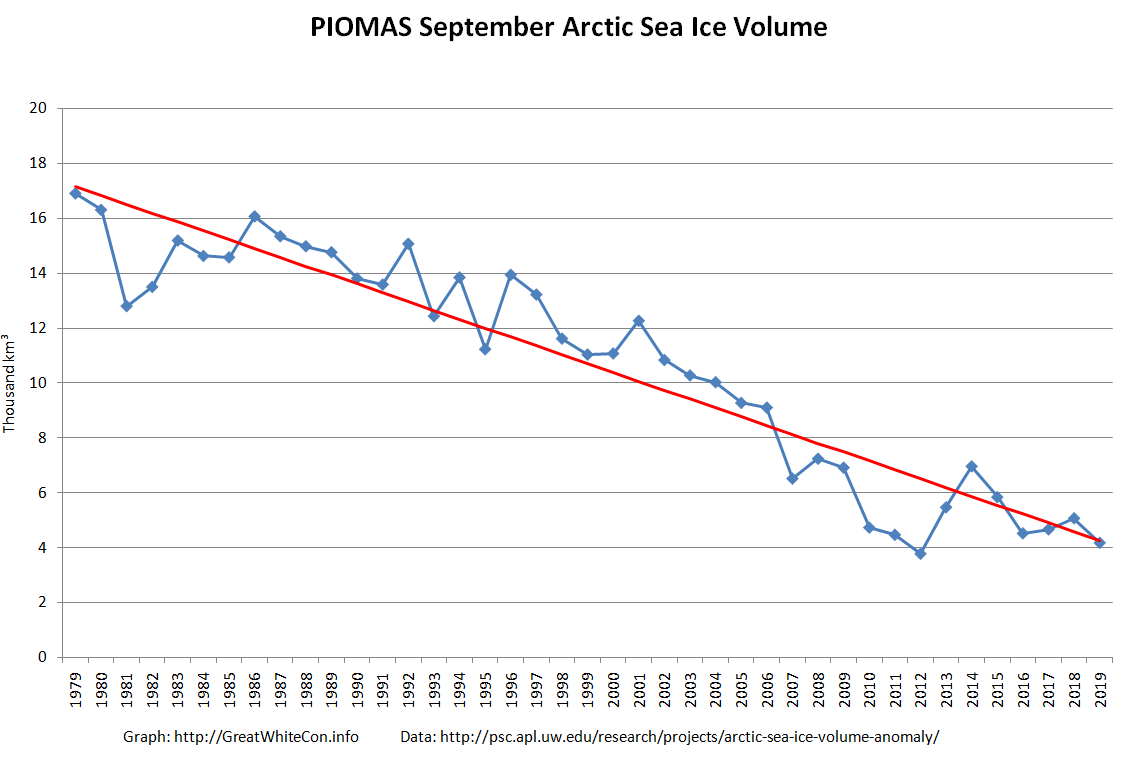
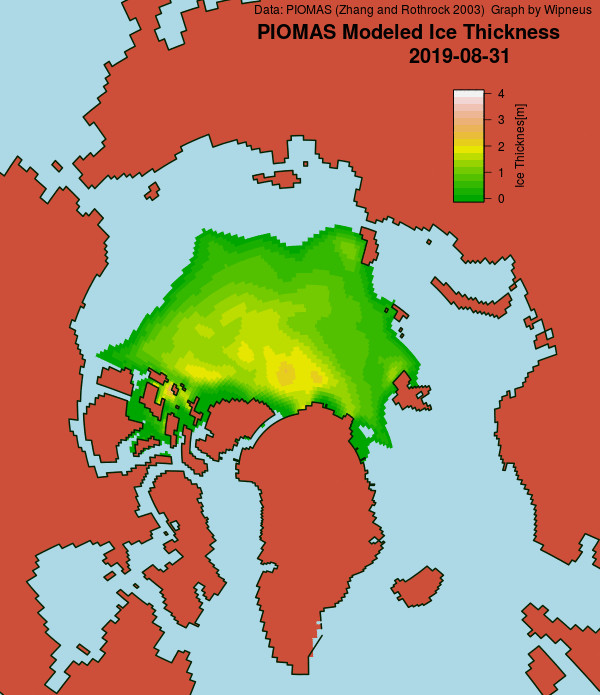
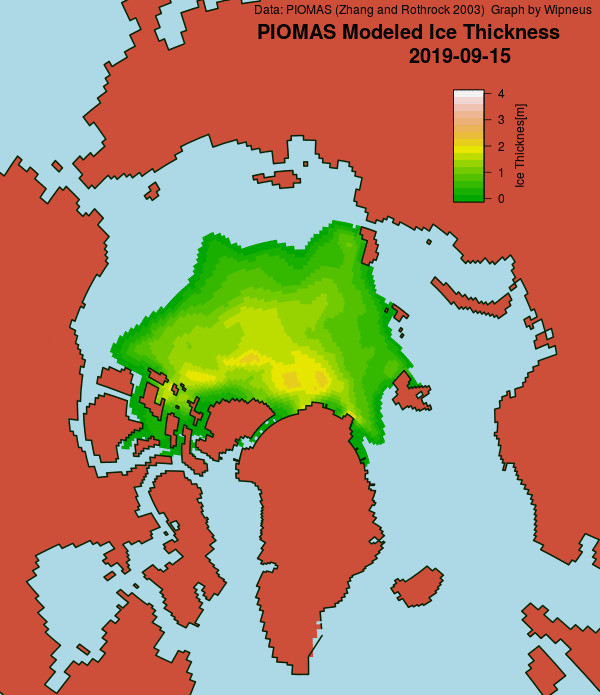
The minimum Arctic sea ice volume generally occurs slightly later than area or extent. The data certainly arrives later! Here’s the PIOMAS graph up to August 31st:
Note that Arctic wide modelled volume is only slightly higher than in 2012 at the same time of year, but there is a noticeably greater percentage gap in extent. That implies that average ice thickness across the Arctic is lower in 2019 than in 2012.
Note also that the thickest ice is no longer located along the north coasts of Greenland and the Canadian Arctic Archipelago. Here are the equivalent maps for previous years for comparison purposes:
Perhaps JAXA extent will head still lower over the next few days? Perhaps PIOMAS volume will sneak below 2012 before the peripheral refreeze begins?
[Edit – September 13th]
JAXA Arctic sea ice extent has reached a new minimum of 4.09 million km².
NSIDC daily extent is currently 4.28 million km², still just above the September 4th minimum.
[Edit – September 14th]
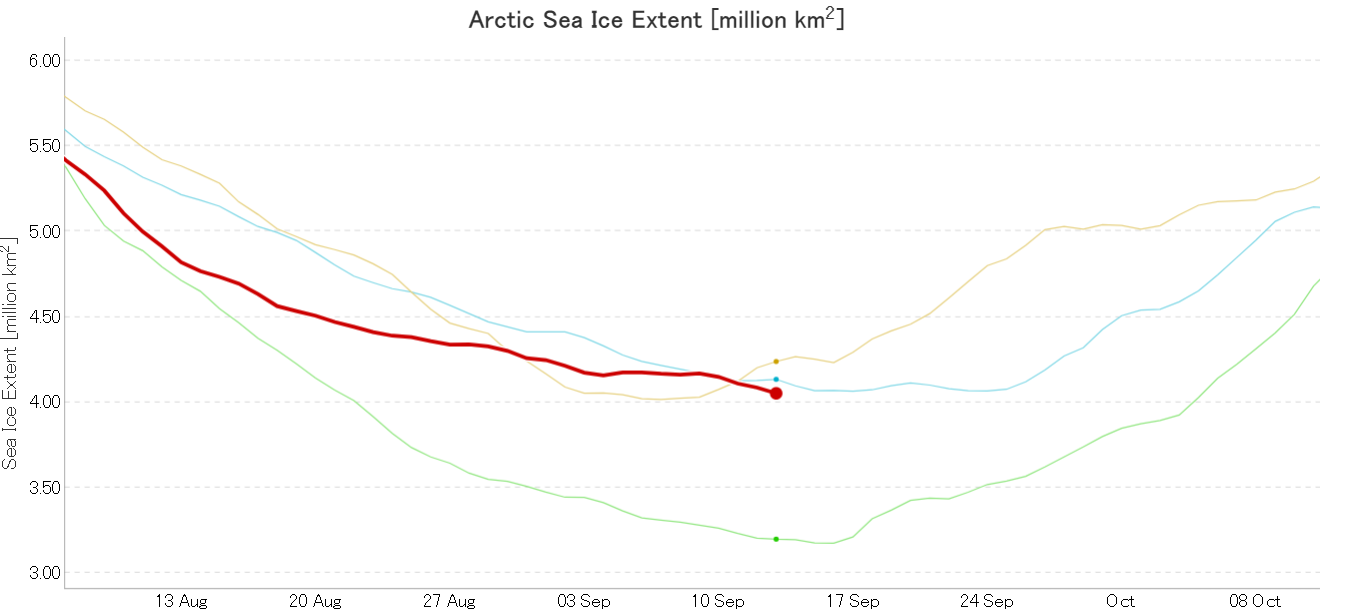
JAXA Arctic sea ice extent has reached a new minimum of 4.05 million km², which now puts it below the 2007 minimum that occurred somewhat later in September:
[Edit – September 14th PM]
NSIDC 5 day averaged extent has also (by a whisker!) reached a new minimum for the year of 4.285 million km²:
The daily number fell to 4.21 million km².
[Edit – September 15th]
I have somewhat belatedly discovered that in the build up to the forthcoming MOSAiC Expedition the Alfred Wegener Institute recently announced that:
The sea-ice extent in the Arctic is nearing its annual minimum at the end of the melt season in September. Only circa 3.9 million square kilometres of the Arctic Ocean are covered by sea ice any more, according to researchers from the Alfred Wegener Institute and the University of Bremen. This is only the second time that the annual minimum has dropped below four million square kilometres since satellite measurements began in 1979.
[Edit – September 16th]
JAXA/ViSHOP extent has dropped below the 2016 minimum, and now measures 4.01 million km²:
Only 2012 left to beat!
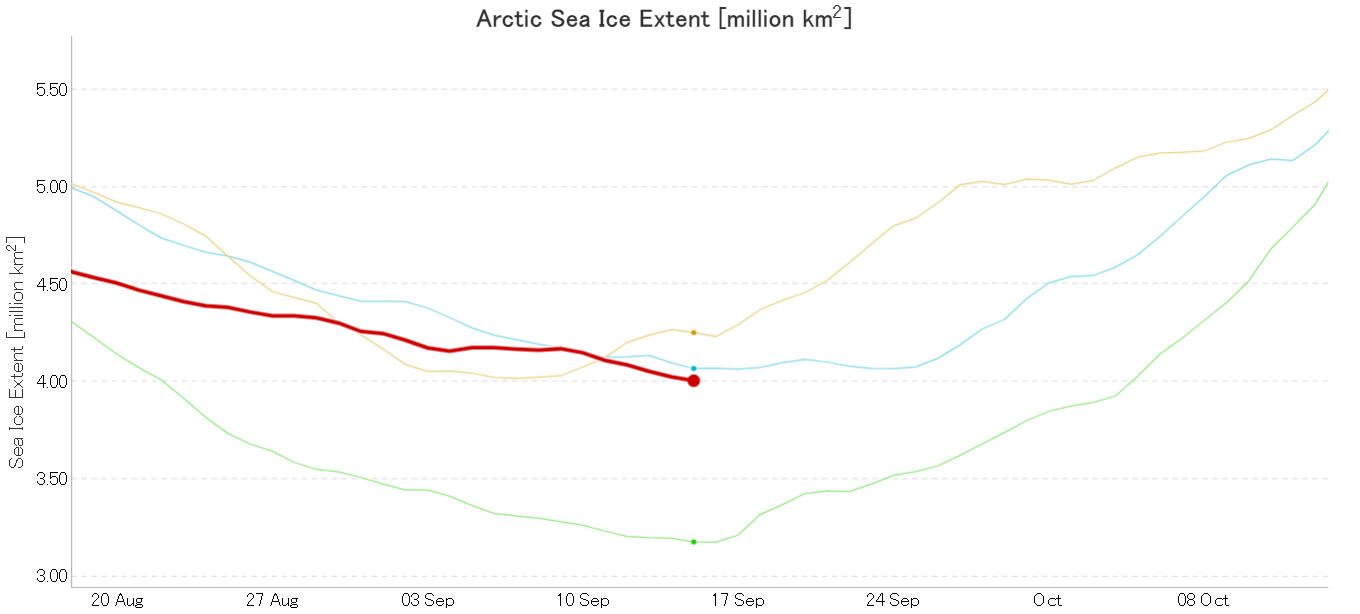
Wipneus’ high resolution AMSR2 extent has also posted a new low for the year, but still has a little way to go before passing 2016:
Area is also currently declining, but is still well away from a new minimum for 2019:
[Edit – September 19th]
After some more modest declines JAXA/ViSHOP extent has just increased marginally from the previous day, and now measures 3.98 million km²:
That puts the (very!) tentative minimum for 2019 at 3.96 million km² on September 17th.
[Edit – September 20th]
The mid month PIOMAS gridded thickness and volume numbers have been released:
As anticipated given recent extent values, the volume difference from 2012 has increased somewhat over the last two weeks.
[Edit – September 23rd]
The National Snow and Ice Data Center have called the 2019 minimum in their latest edition of Arctic Sea Ice News:
On September 18, 2019, sea ice extent dropped to 4.15 million square kilometers (1.60 million square miles), effectively tied for the second lowest minimum in the satellite record along with 2007 and 2016. This appears to be the lowest extent of the year. In response to the setting sun and falling temperatures, ice extent will begin increasing through autumn and winter. However, a shift in wind patterns or a period of late season melt could still push the ice extent lower.
[Edit – September 24th]
To summarise the assorted minimum extent metrics for 2019:
University of Bremen – 3.77 million km² on September 18th, 2nd lowest behind 2012. JAXA/ViSHOP – 3.96 million km² on September 17th, “Statistical tie” with 2016 for 2nd lowest. NSIDC 1 day – 4.10 million km² on September 17th, “Statistical tie” with 2016 for 2nd lowest. NSIDC 5 day – 4.15 million km² on September 18th, 2nd lowest behind 2012.
[Edit – October 1st]
Two sides of the same coin? Sea ice area on the Pacific side of the Arctic has been at historic lows for most of the melting season:
whereas on the Atlantic side:
[Edit – October 7th]
The September monthly numbers have arrived from the NSIDC, together with some intriguing annotations by Walt Meier:
The time has come to start speculating about if, and when, the Northwest Passage will become navigable for the host of small vessels eager to traverse it this summer. Almost one month later than in 2017!
Whilst the eastern and western entrances to the assorted routes through the Canadian Arctic Archipelaga have been empty of sea ice for quite some time, the central section between Bellot Strait and Gjoa Haven and/or Cambridge Bay is still chock a block:
In the east here is a drone’s eye view of Cumming Inlet, courtesy of the Polish team of Michał and Ola Palczyński aboard S/V Crystal:
created by dji camera
It’s not entirely clear when that picture was taken, since according to Michał’s blog:
The waters beyond the Bellot Strait are covered with impassable ice, and the ice in the Beaufort Sea has 90% concentration in some places and reaches up to the shore. In this difficult situation, by 15th August two yachts have already given up and turned back to Greenland (including Blue Peter from our cove).
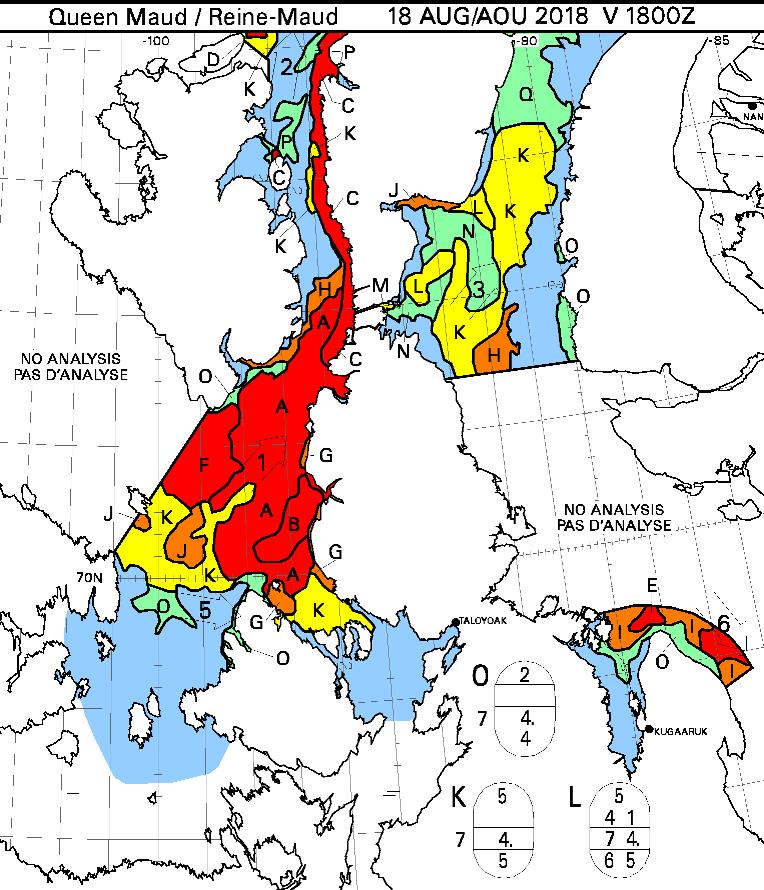
Here’s what lies ahead of Crystal and her remaining companions, according to the Canadian Ice Service:
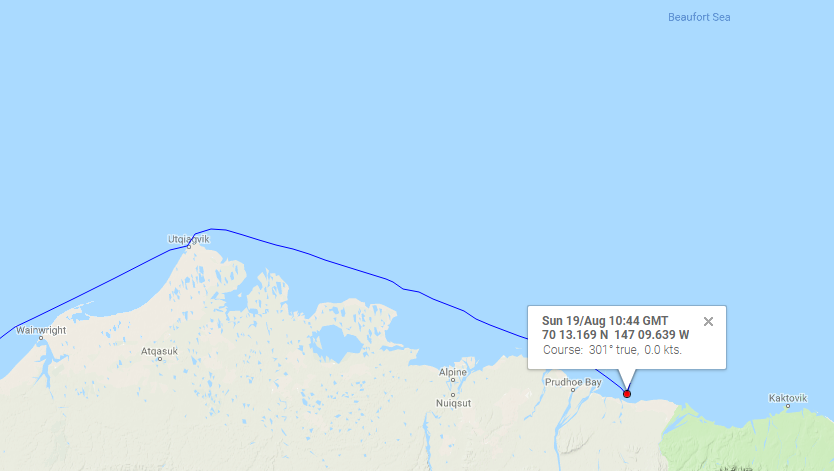
Meanwhile in the Beaufort Sea S/V Dogbark has been battling her way through that “90% concentration” sea ice. Dogbark has now made it as far as Mikkelsen Bay, just past Prudhoe Bay in Alaska:
What does 7/10ths ice mean? We don’t want to know! It is more ice than we want to try and pass, that’s for sure. But the ice charts we look at refer to ice by % of sea coverage, so 7/10ths would look like water mostly covered by large, immovable objects. 5/10ths was as much as we have seen, and we got out of there as fast as we could with some help from our flying eyeball. See Dogbark’s Facebook page for a quick snippet of less dangerous ice.
Meanwhile the Canadian icebreaker CCGS Amundsen has sailed past Arctic Bay and Resolute:
I cannot help but wonder what vessels might be closely following in his wake?
[Edit – September 7th]
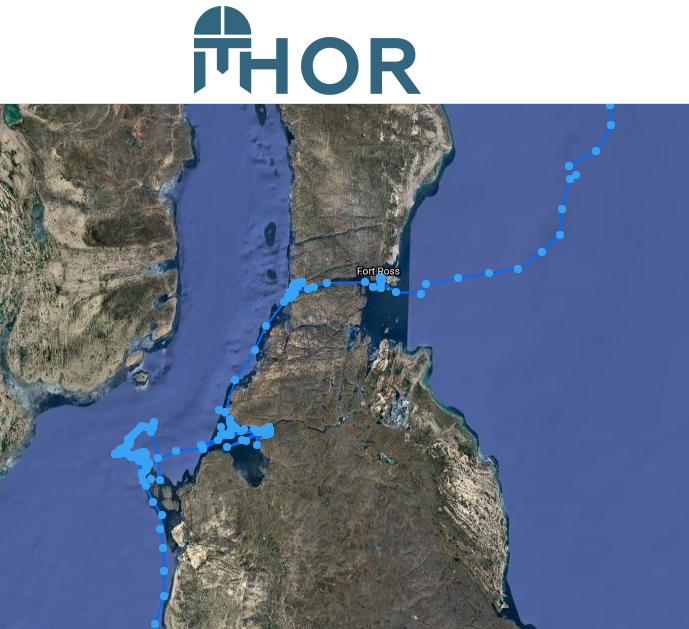
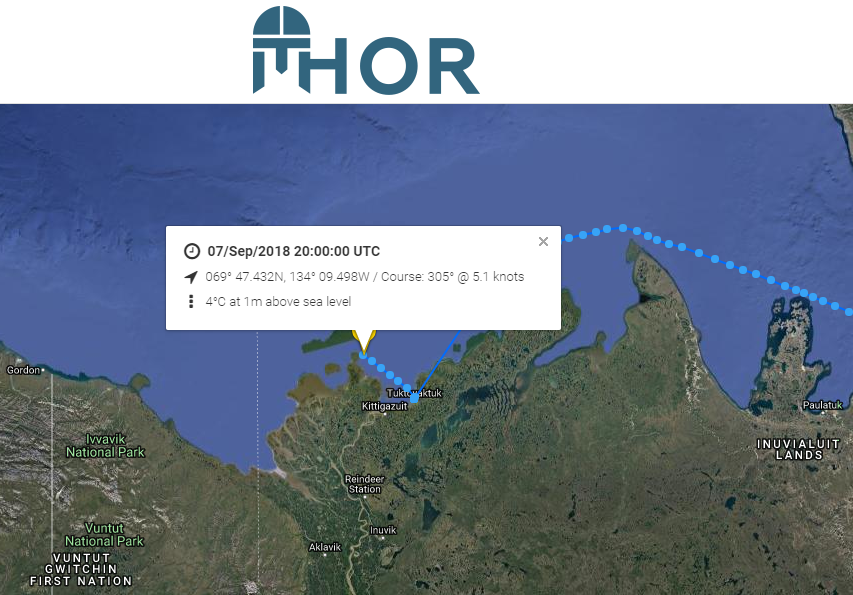
Finally there comes news that a “pleasure craft” has made it through the Canadian Arctic Archipelago from east to west as far as Tuktoyaktuk. I’d been wondering which vessel it was that seemed immobile near the western end of the Bellot Strait on the MarineTraffic maps. This one’s from August 19th:
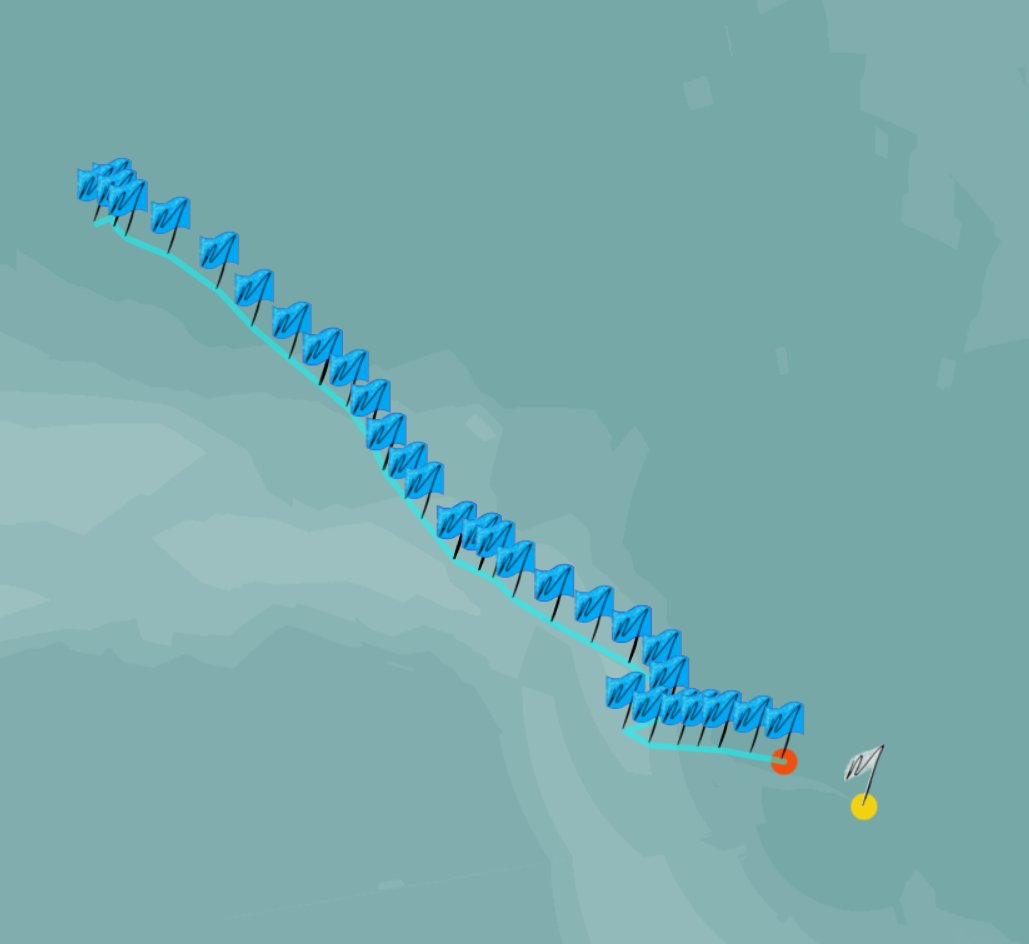
Now I know! Thanks to a heads up on the Arctic Sea Ice Forum I’ve discovered that it’s the S/V Thor. Here’s the tracking map of his efforts to get through all the old ice in the vicinty.
The map reveals that Thor made it through the Bellot Strait on August 6th, but didn’t manage to make significant headway out of the Franklin Strait until August 28th.
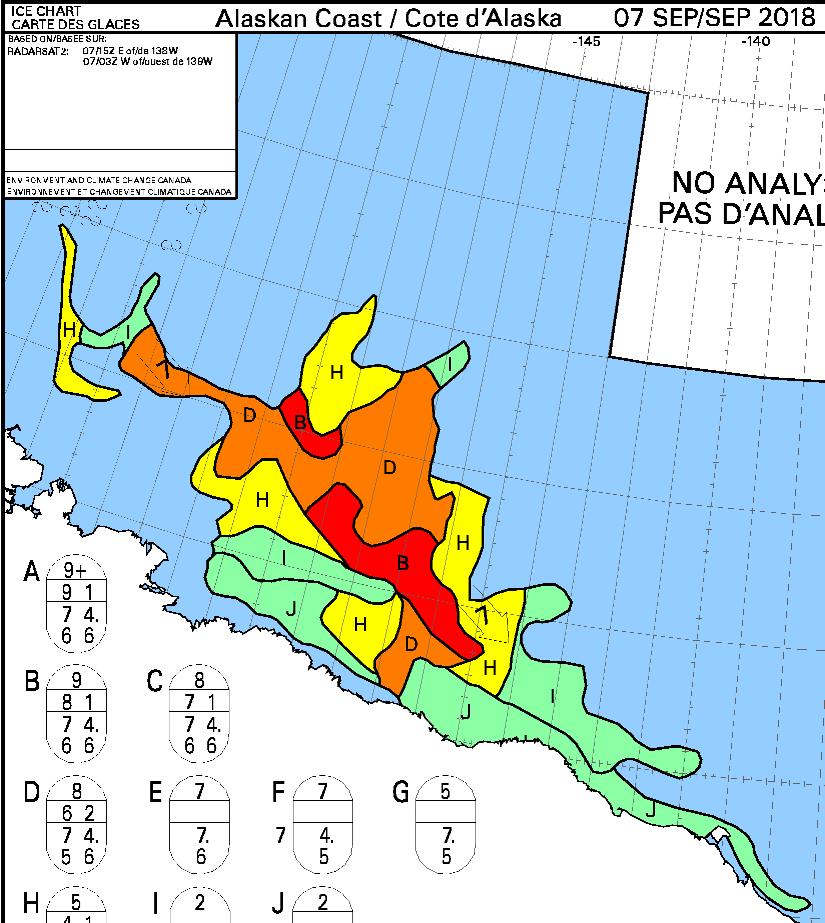
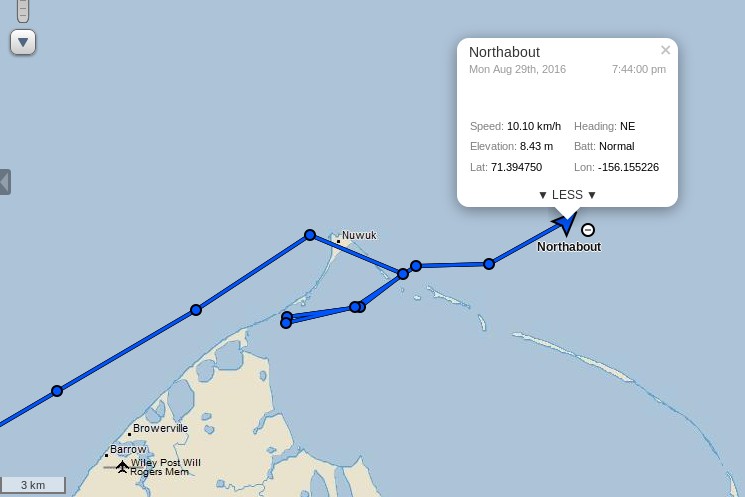
After the briefest of stops in Elson Lagoon behind Point Barrow Northabout is on the move once again:
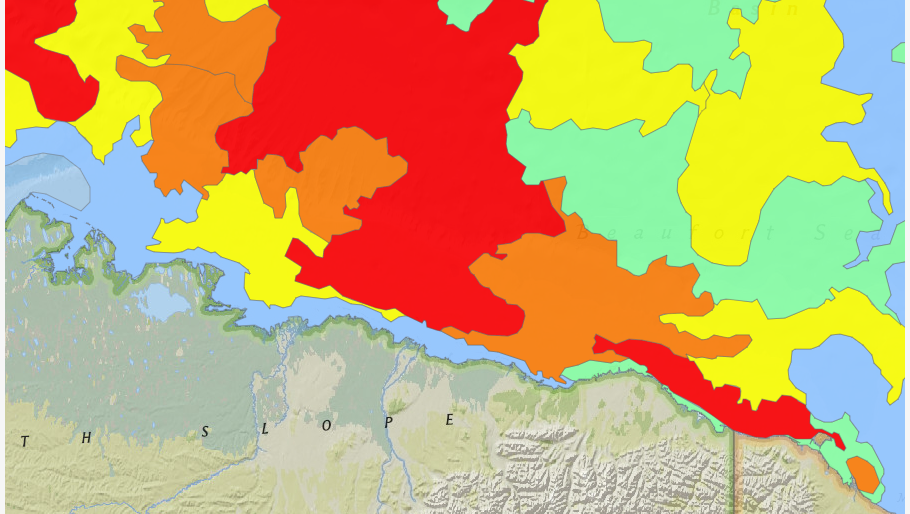
She’s currently heading out into the Beaufort Sea before following in the giant footsteps of the cruise liner Crystal Serenity in the direction of the Amundsen Gulf and the Canadian Arctic Archipelago. Here’s the United States National Weather Service’s current ice chart for Alaskan waters:
There looks to be far less to worry about ice wise on the next leg of the Polar Ocean Challenge than on the previous one! The weather forecast isn’t too bad either, with high pressure over the Beaufort Sea and a fair bit of sunshine. Here’s the Weather Underground forecast for Ulukhaktok, Crystal Serenity’s first port of call in the CAA:
There is currently a “small craft advisory” warning in effect for the Beaufort Sea coast:
CAPE HALKETT TO FLAXMAN ISLAND-
207 PM AKDT MON AUG 29 2016
…SMALL CRAFT ADVISORY IN EFFECT FROM TUESDAY MORNING THROUGH
TUESDAY AFTERNOON…
TONIGHT
E WINDS 20 KT. SEAS BUILDING TO 4 FT.
TUE
E WINDS 25 KT. SEAS 5 FT.
TUE NIGHT
E WINDS 20 KT. SEAS 6 FT.
WED
E WINDS 20 KT. SEAS 6 FT.
WED NIGHT
E WINDS 20 KT. SEAS 5 FT.
THU
NE WINDS 20 KT. SEAS 4 FT.
THU NIGHT
NE WINDS 15 KT. SEAS 4 FT.
FRI
N WINDS 10 KT. SEAS 2 FT.
SAT
N WINDS 15 KT. SEAS 3 FT.
All in all it looks like fairly plain sailing for the foreseeable future, with only occasional moderate headwinds to contend with.
[Edit – August 30th]
It seems my “fairly plain sailing” conclusion was overly hasty. According to the latest “Ship’s Log“:
The weather forecast is pants. A 30/35 knot headwind along the coast . No one has the appetite for it, so we are heading North, slacker winds, staysail out, still a choppy sea and uncomfortable, but not as bad as 30 knots. Hopefully no ice tonight on my watch.
This is the end result:
As Phil points out below:
Our next stop along the North West Passage is Tuktoyaktuk. That’s when we can use a pontoon, get rid of our rubbish, fill the tanks, do the laundry and have a shower. 500nm away.
[Edit – August 31st]
The Polar Ocean Challenge team report via Twitter:
They have some more to carry out in Tuk too. Despite the great “groove” displayed above Ben Edwards reports that:
Joy of joys, the auto-helm’s stopped working. Dad (Steve Edwards, crew), thinks he knows why so we’ll hopefully be able to fix it in Tuk. In the meantime we’re back to helming by hand. This is a mixed blessing, on the one hand it’s really irritating to have to helm in large swells and with a strong headwind because any movement you make is at first ignored, and then exaggerated by, the wind. So it’s hard to keep a decent track and it makes it harder to look out for ice. On the other hand, moving and putting effort into the steering keeps you warm which is nice and it means you don’t have to put as many clothes on which is also nice because when you go down stairs and it’s twenty four degrees it can get quite uncomfortable.
We all had our job lists, ice lights, bilge pumps, laundry, shopping but the man who gets the Vodka Salute is unquestionably Steve.
I dropped him off wth Willard. Two peas in a pod. They made a broken Pilot Spigot. That sounds quite easy but it took the whole day in a machine shop in a container, working to fine tolerances, and many modifications. Fitting it in the bowels of the Lazzerette in cold weather and driving rain. It worked first time. Brilliant effort.
Issued 07:00 AM MDT 04 September 2016
Today Tonight and Monday
Wind – Northwest 15 knots diminishing to light late this morning then becoming northwest 15 Monday morning.
Waves
Seas – 1 metre.
Weather & Visibility – Chance of showers changing to periods of rain near noon then to chance of showers tonight and Monday. Fog patches dissipating early this evening.
My famous last words? Plain sailing by the look of it!
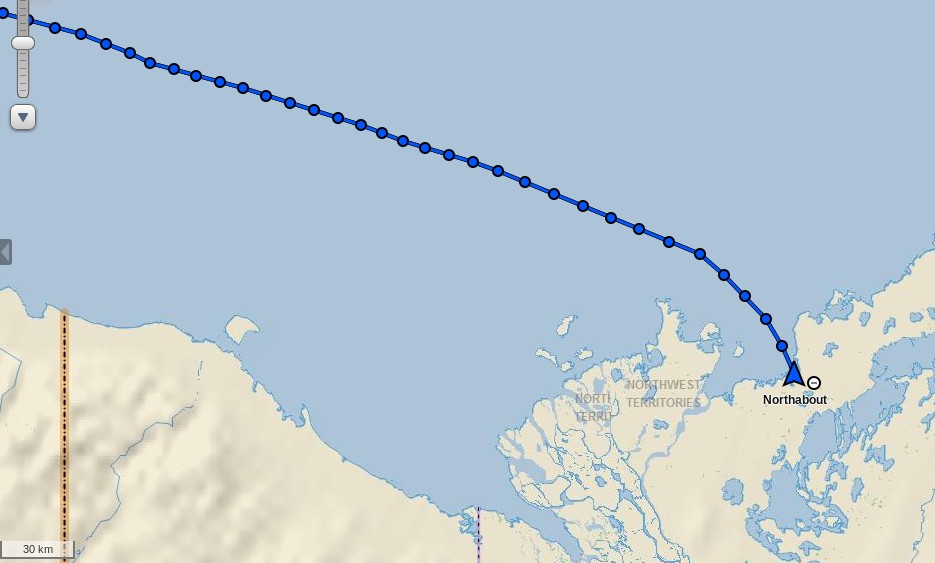
[Edit – September 5th]
Northabout has just rounded Cape Bathurst, the northernmost point of mainland Northwest Territories:
I wonder if her crew will take a close look at the nearby Smoking Hills?
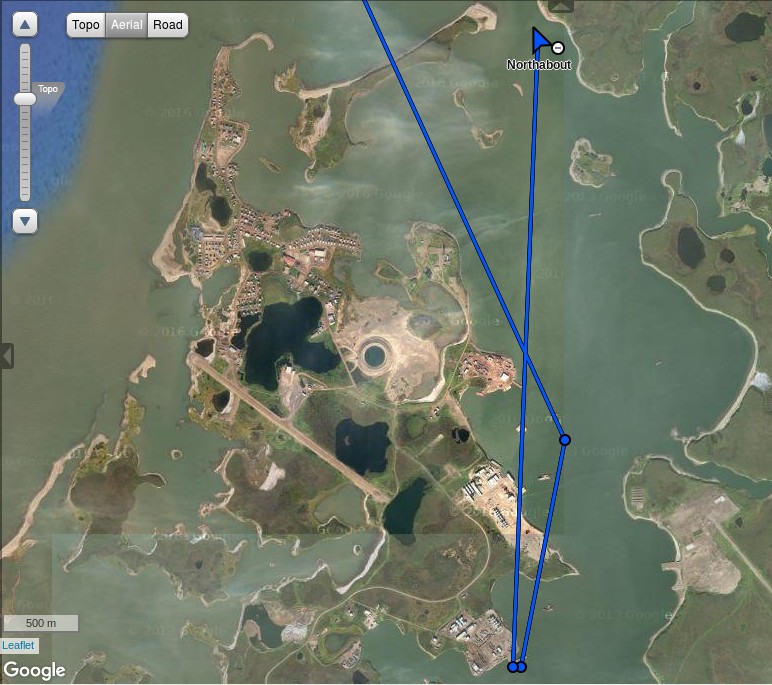
[Edit – September 6th]
Northabout gave the Smoking Hills a miss and headed strait for Cape Parry. She has already crossed the Amundsen Gulf and is heading into the Dolphin & Union Strait:
In light of the lack of ice and in the spirit of saving time we’ve decided not to stop in Cambridge Bay or Pond Inlet and go straight on to Upernavik in Greenland before doing our crew change. Looking at the ice maps at the moment it seems we’ll be able to get through with little or no trouble, though this is almost bound to change, if it stays that way we’ll reach Upernavik in about fourteen days. I’m looking forward to it!
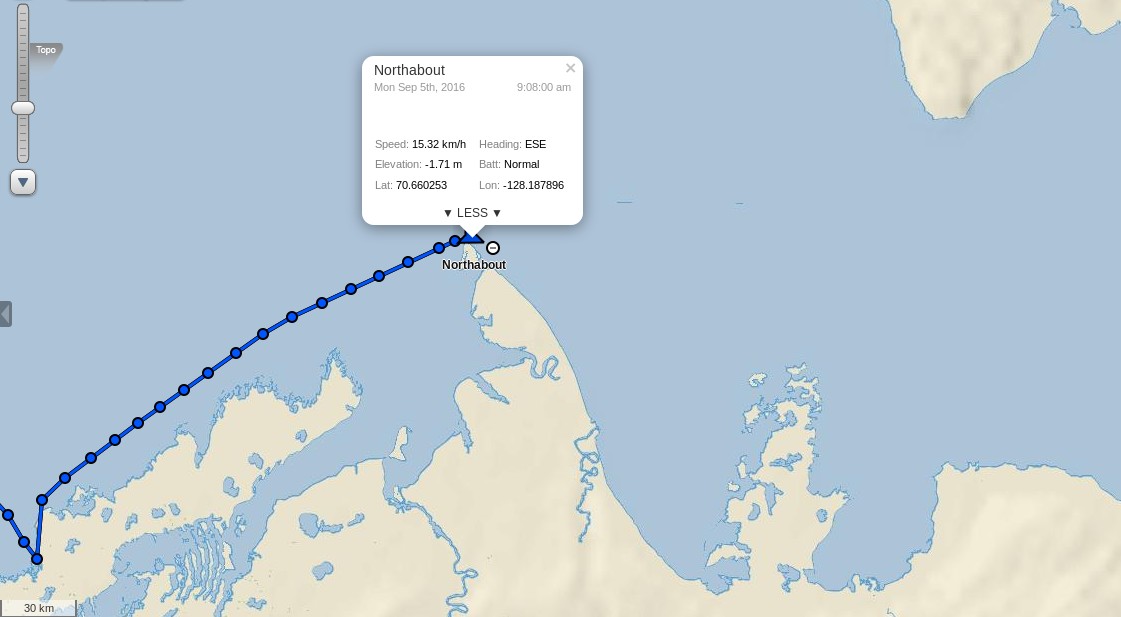
This morning Northabout is rapidly approaching the western entrance to Bellot Strait:
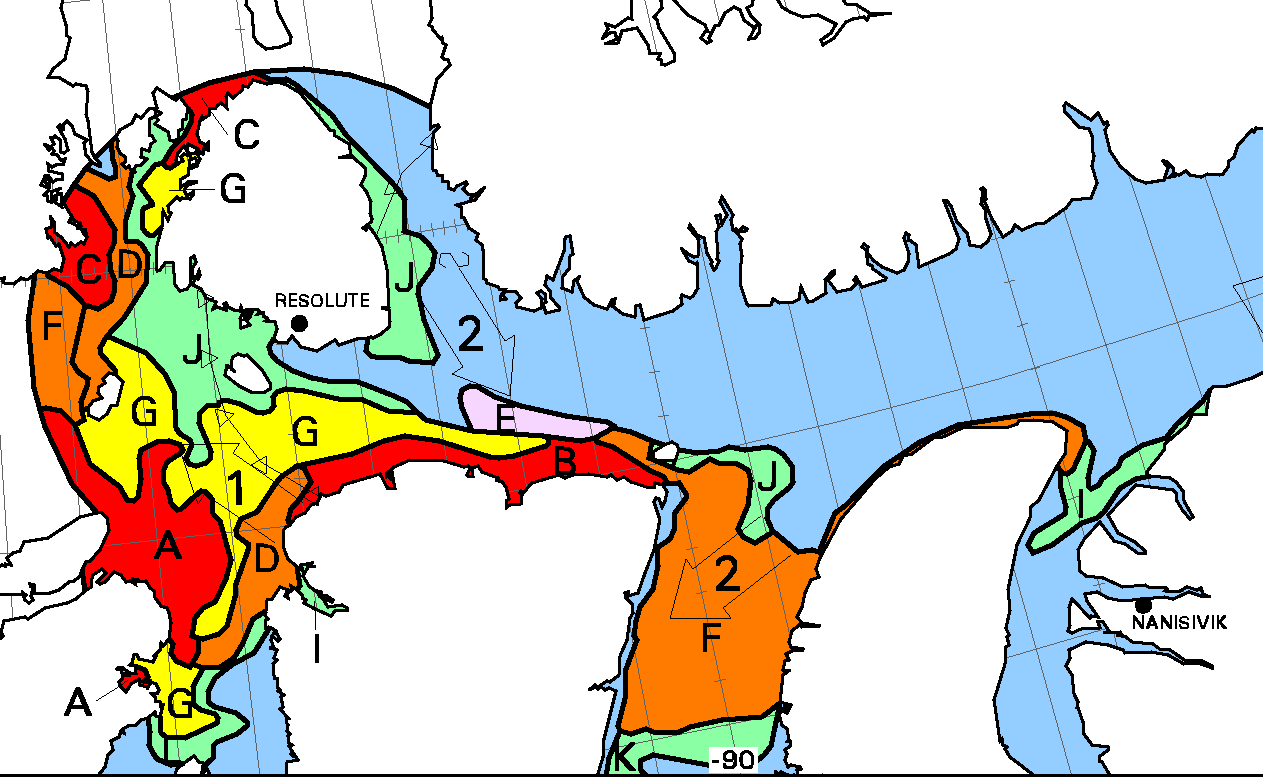
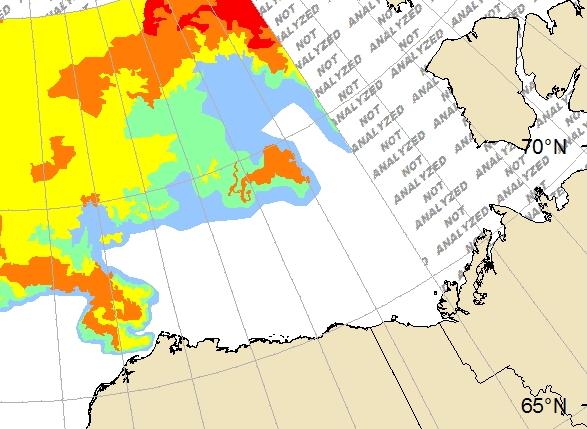
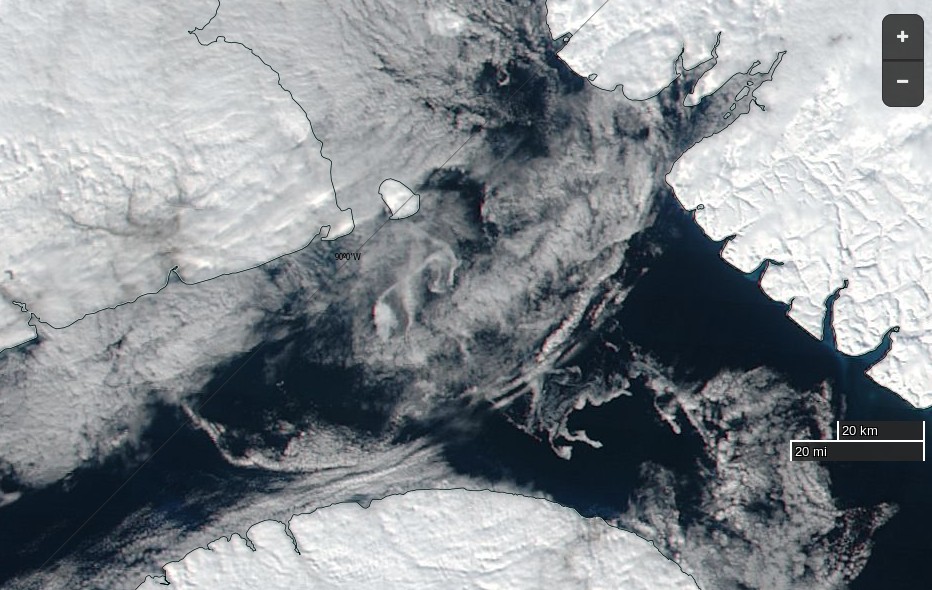
Their stated intentions are to head past Pond Inlet and across Baffin Bay to Upernavik in Greenland. Assuming they initially follow the same route as Crystal Serenity they will soon to need to pick their way past some bergy bits in Prince Regent Inlet before negotiating some currently “wispy” areas of sea ice as they enter Lancaster Sound. Here is the current Canadian Ice Service chart for the area:
plus a rather cloudy “visual” image:
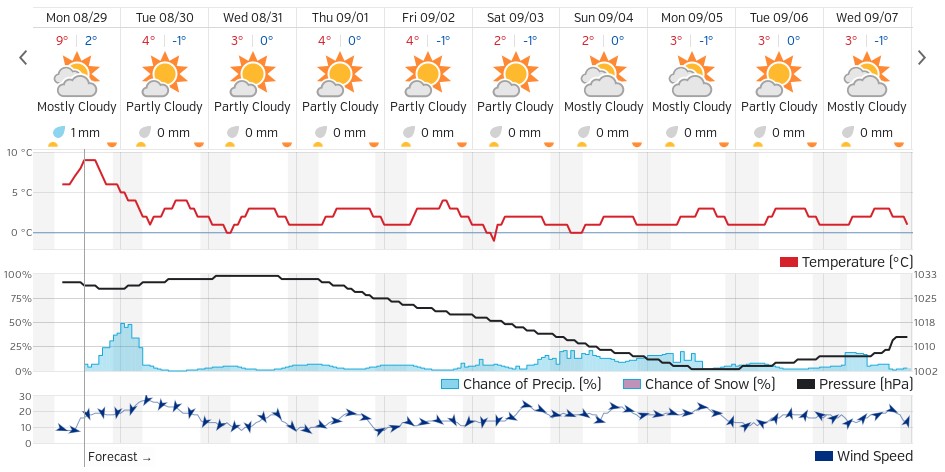
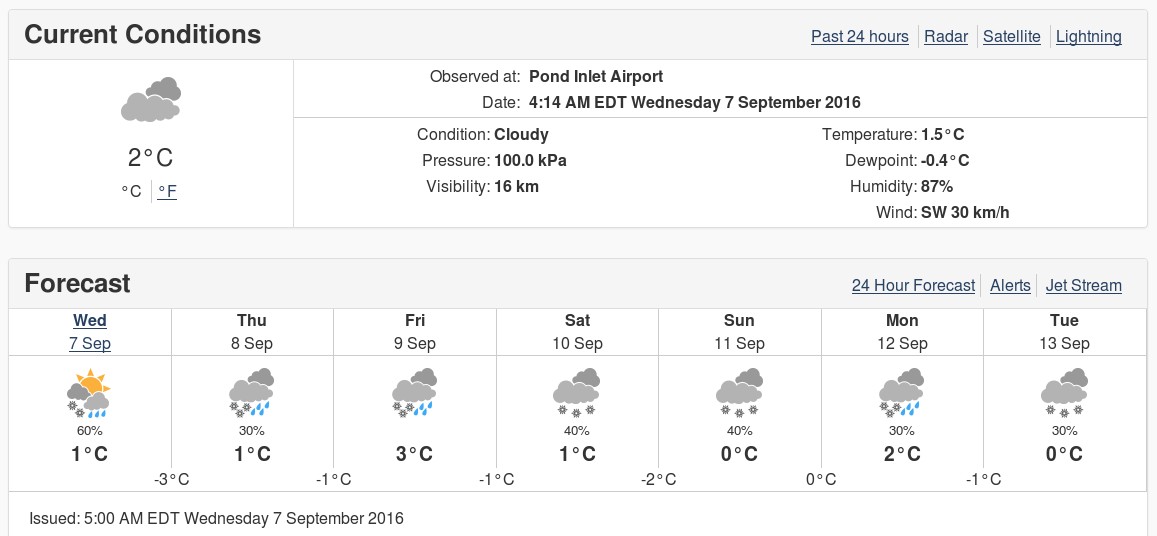
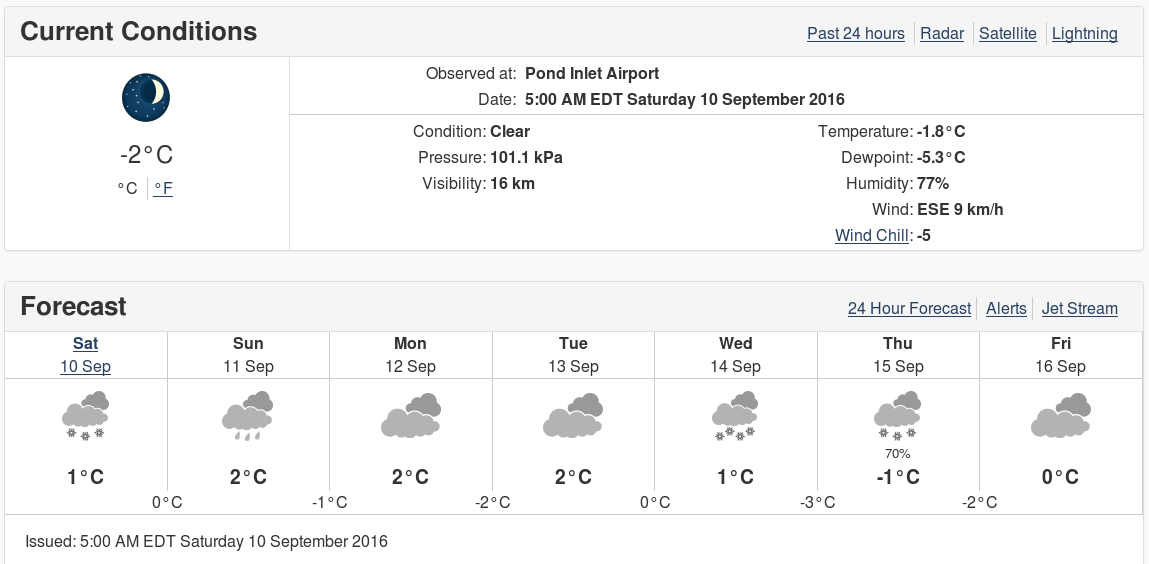
The current weather forecast for Pond Inlet doesn’t suggest the parts of the Northwest Passage still on Northabout’s route are going to start refreezing just yet:
Currently there is an obvious passage past the existing ice, but that may of course have changed by the time Northabout gets there.
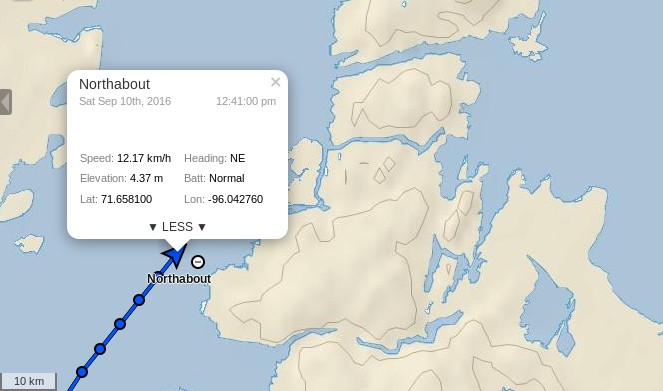
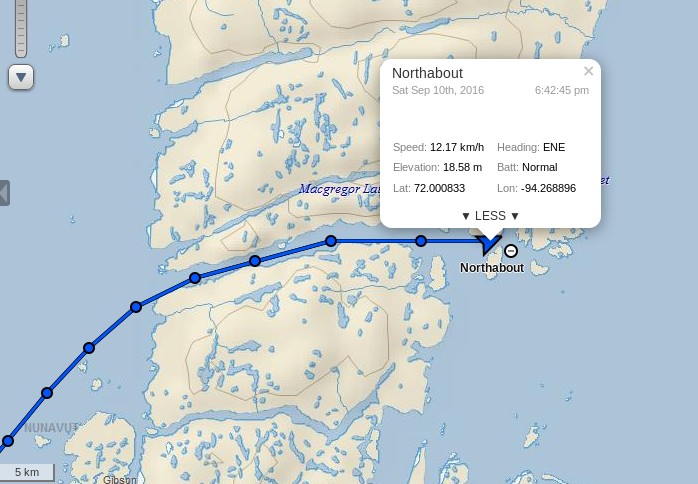
[Edit – September 10th PM]
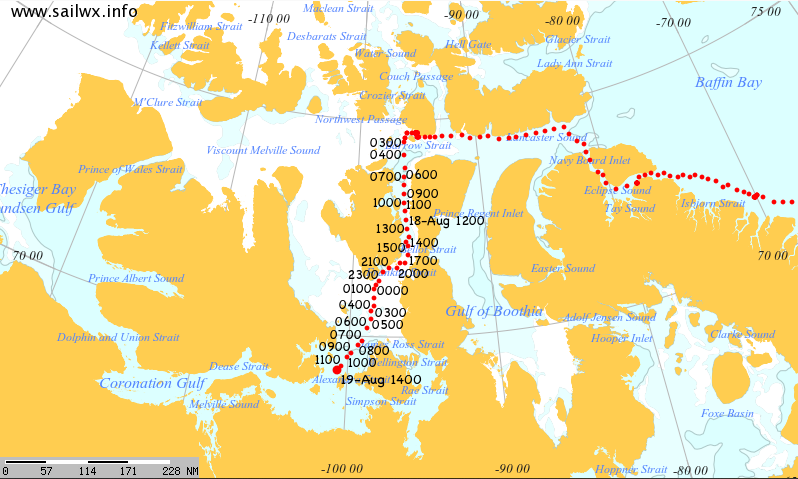
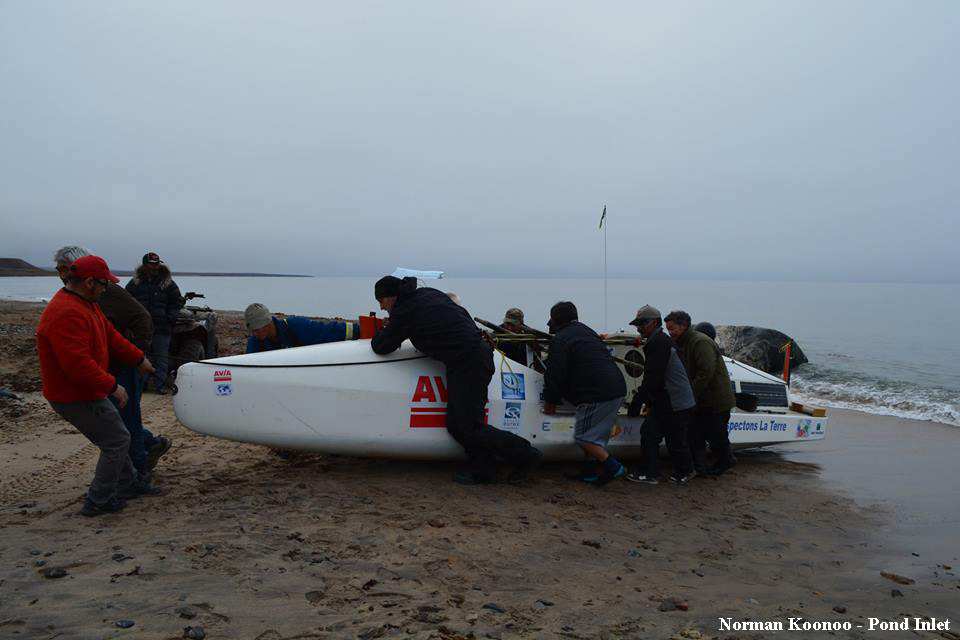
Northabout has just emerged safely from the eastern end of Bellot Strait:
I wonder if her crew will stop to make a new entry in the visitors book at Fort Ross?
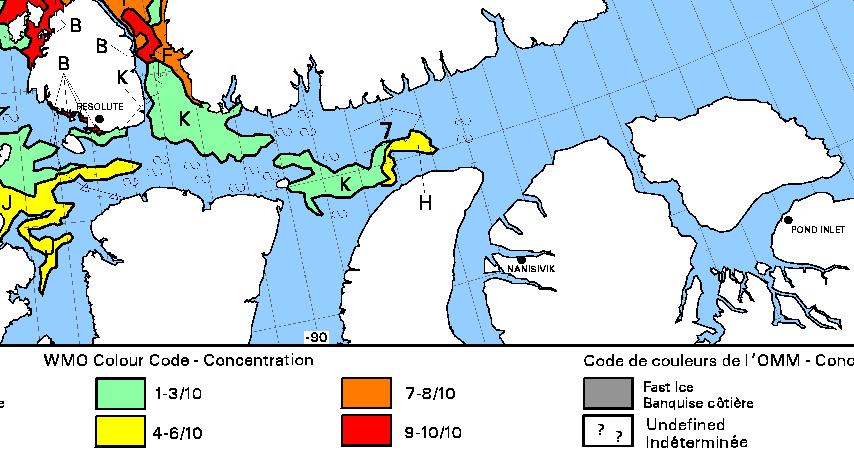
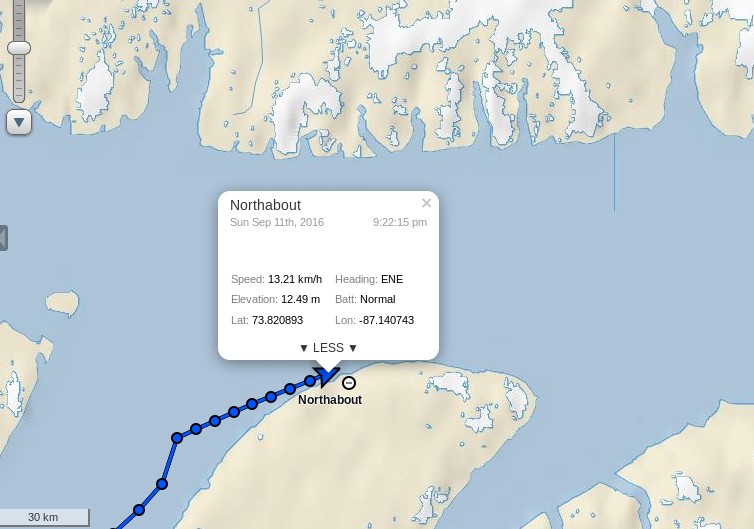
[Edit – September 11th]
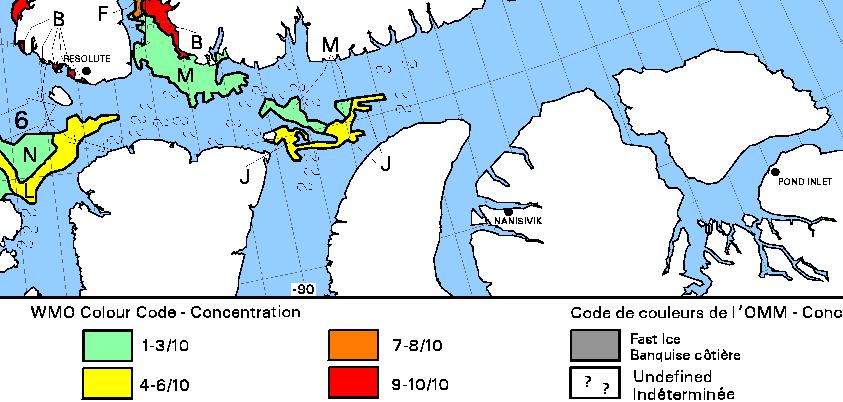
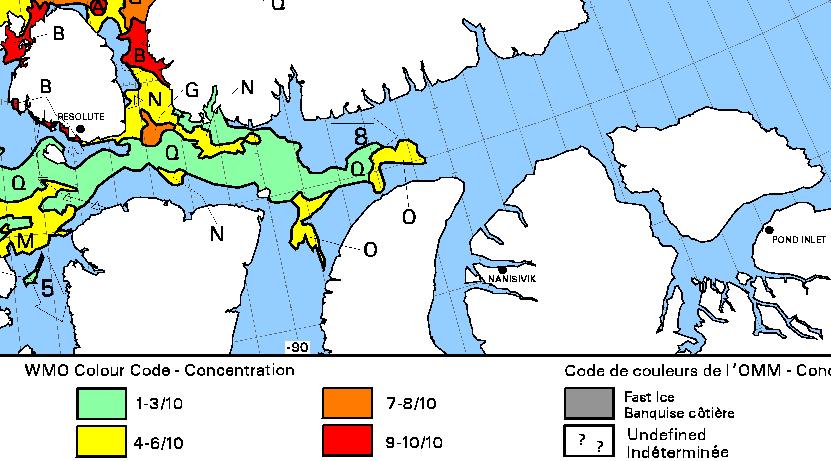
Here’s the latest CIS ice chart:
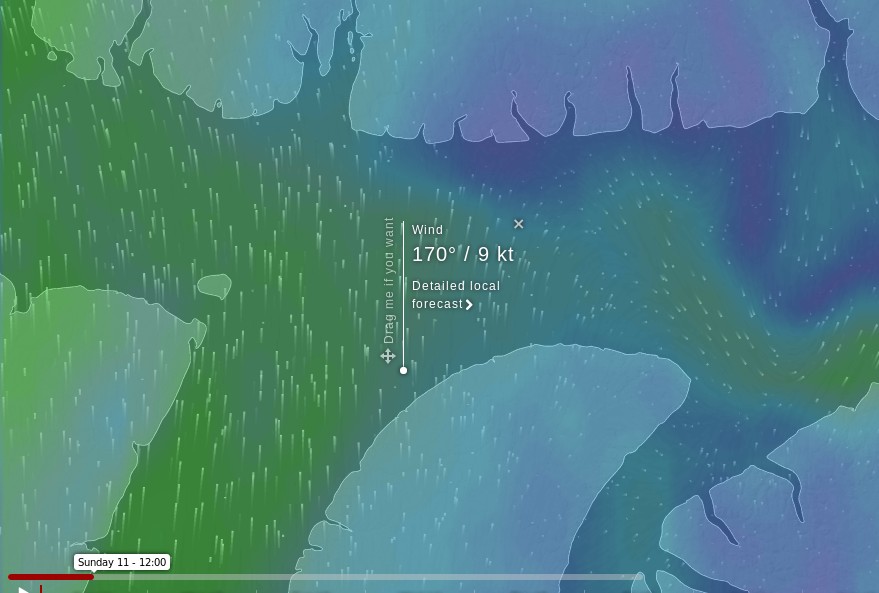
The gap between the coast and the yellow area of 4-6/10 concentration ice has closed considerably, and there’s now a broad expanse of 1-3/10 ice which Northabout may be forced to try and wend her way through. A change in wind direction would come in very handy, and that’s just what the ECMWF forecast at Windyty is suggesting for Sunday 11th:
Just what the doctor ordered?
[Edit – September 11th PM]
Video shot from Northabout’s drone of her ice-free passage through Bellot Strait:
However the passage from Prince Regent Inlet into Lancaster Sound has not proved to be ice-free!
Northabout is obviously endeavouring to skirt around the eastern edge of the 4-6/10 old ice in her path:
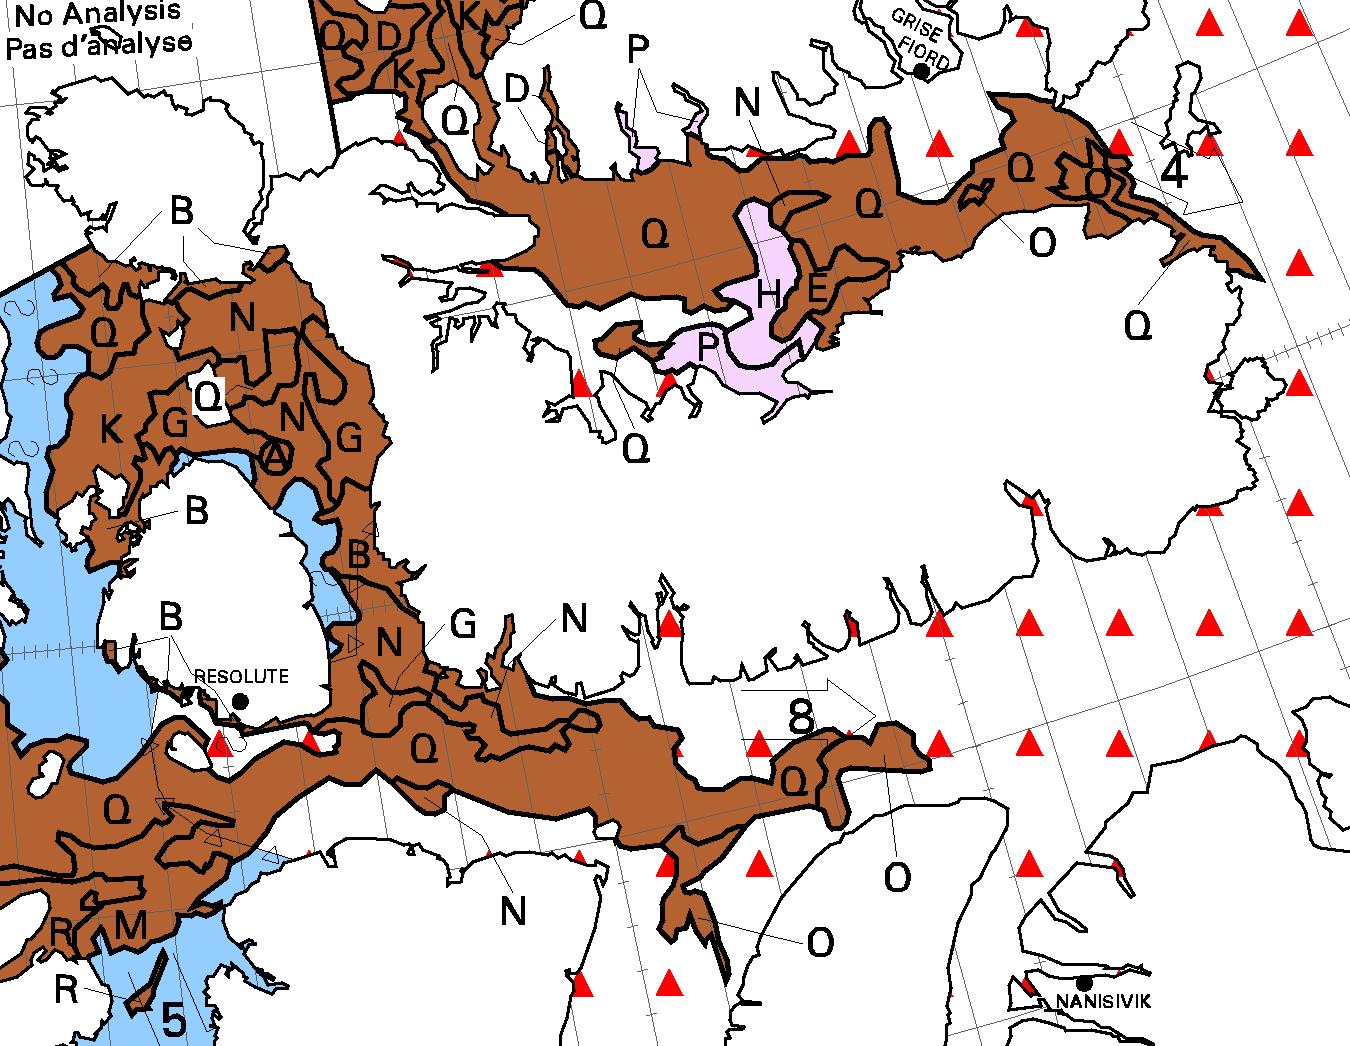
Today’s CIS ice concentration chart suggests there isn’t much room to spare:
The stage of development chart does reveal some new ice, but it’s well to the north of Northabout’s route through Lancaster Sound to Pond Inlet:
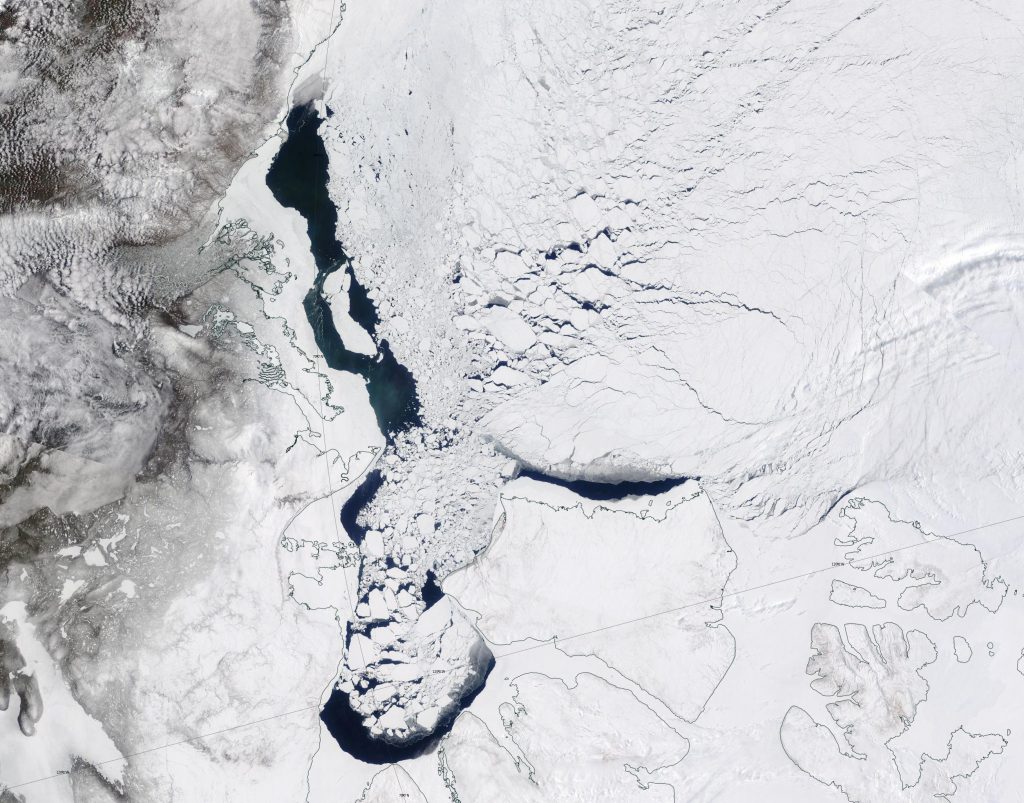
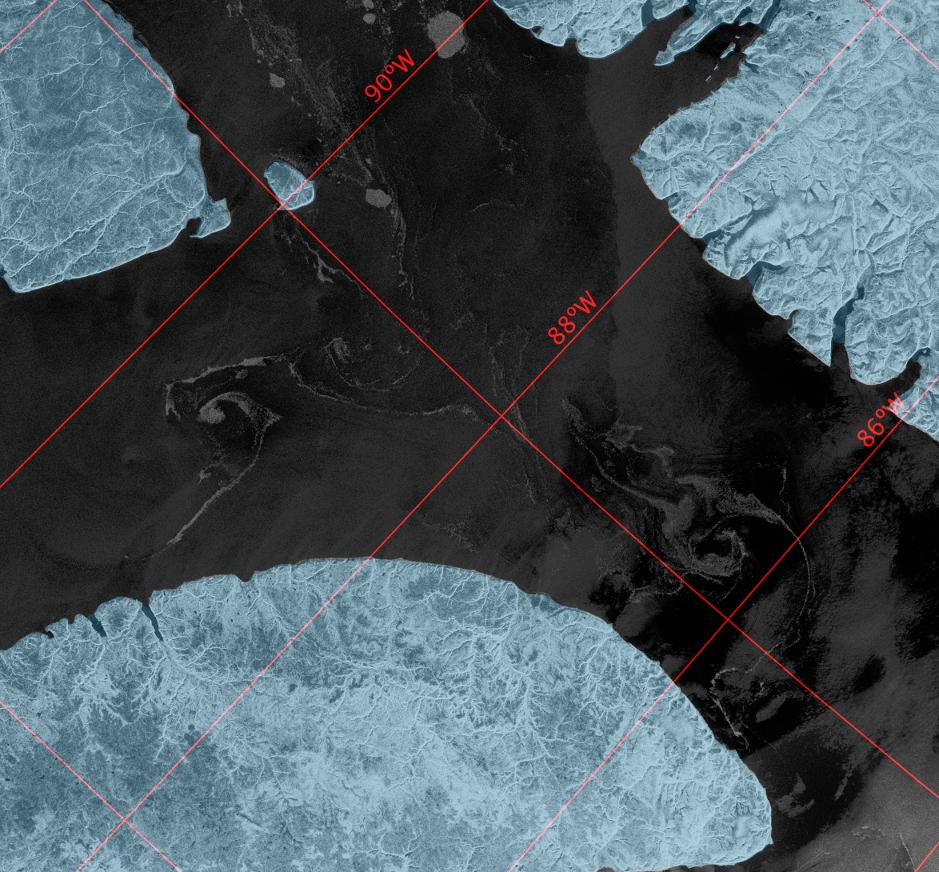
Somewhat belatedly, here’s a Sentinel 1A synthetic aperture radar image of the sea ice Northabout is squeezing past as we speak:
[Edit – September 12th]
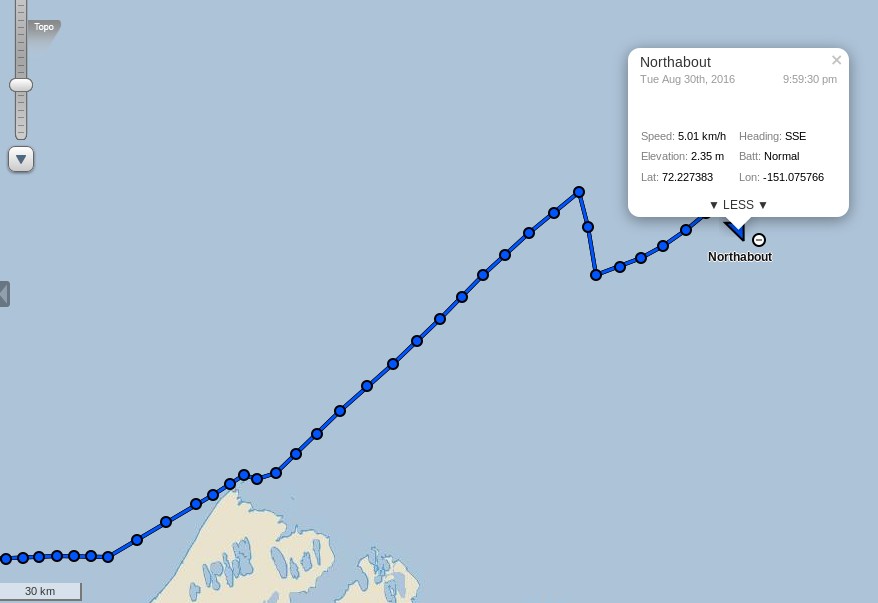
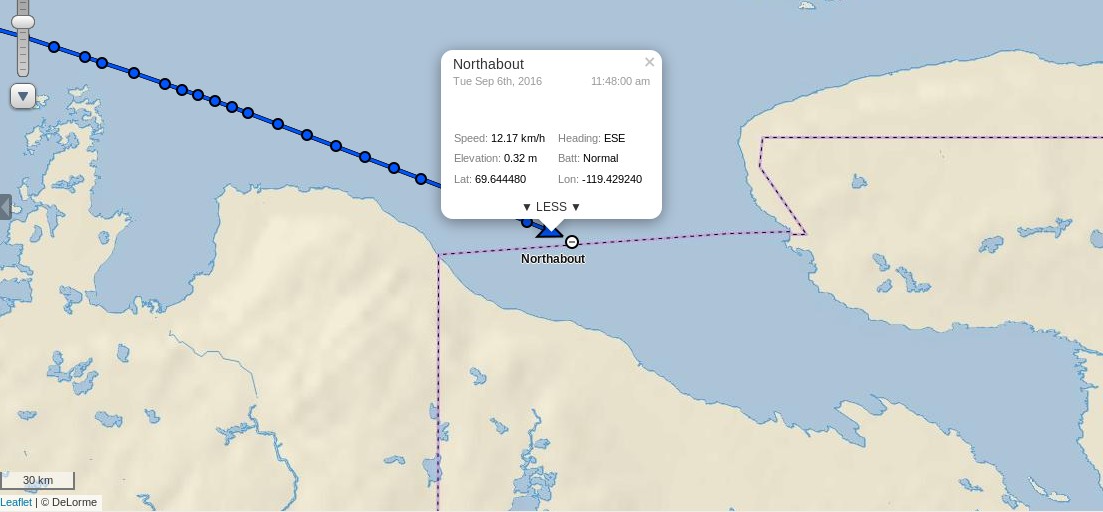
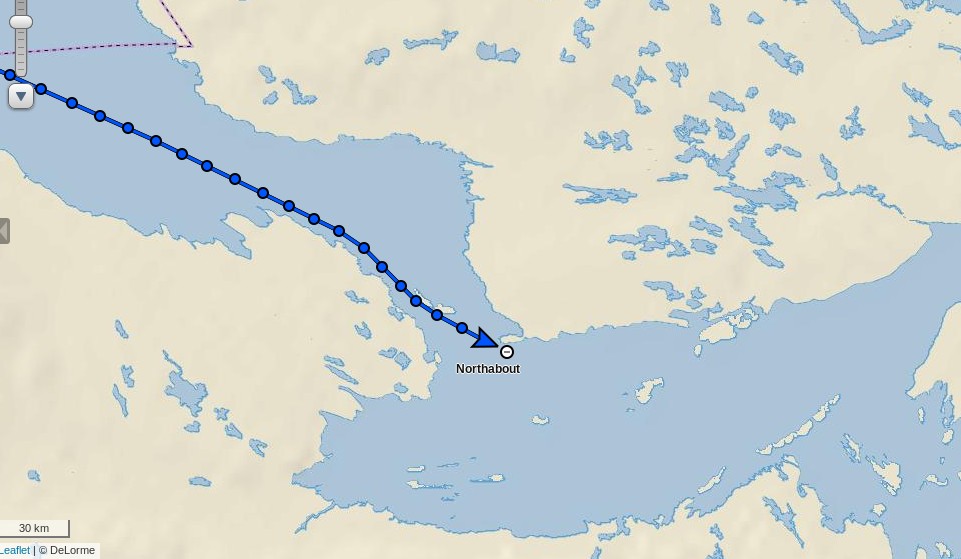
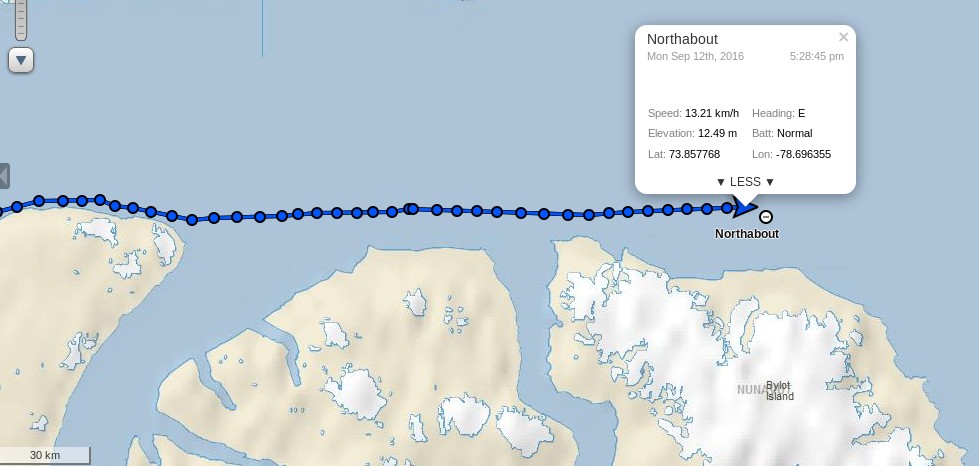
Northabout has emerged safely into Lancaster Sound, and is bypassing Pond Inlet in order to head strait across Baffin Bay:
Here are a couple of videos of some remnants of sea ice on her once again eastward travels:
There are several more on the Polar Ocean Challenge web site.
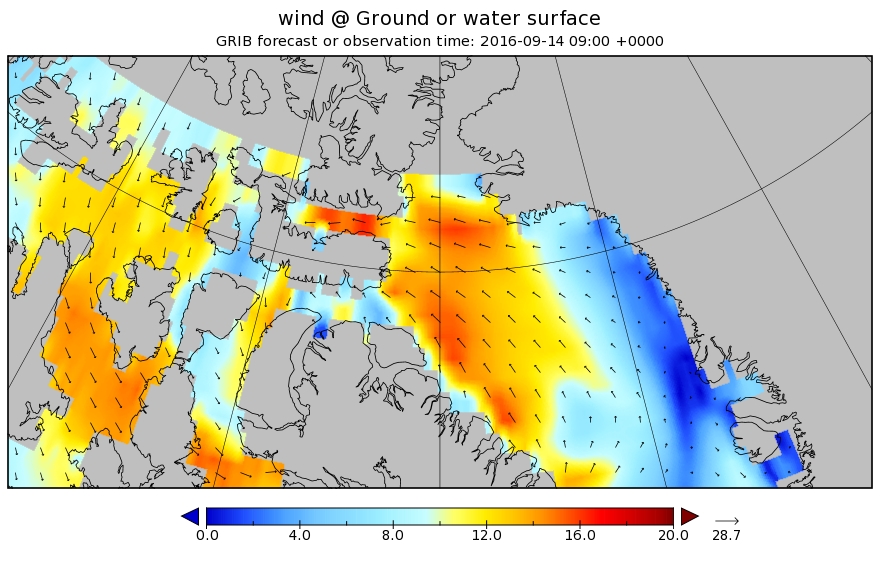
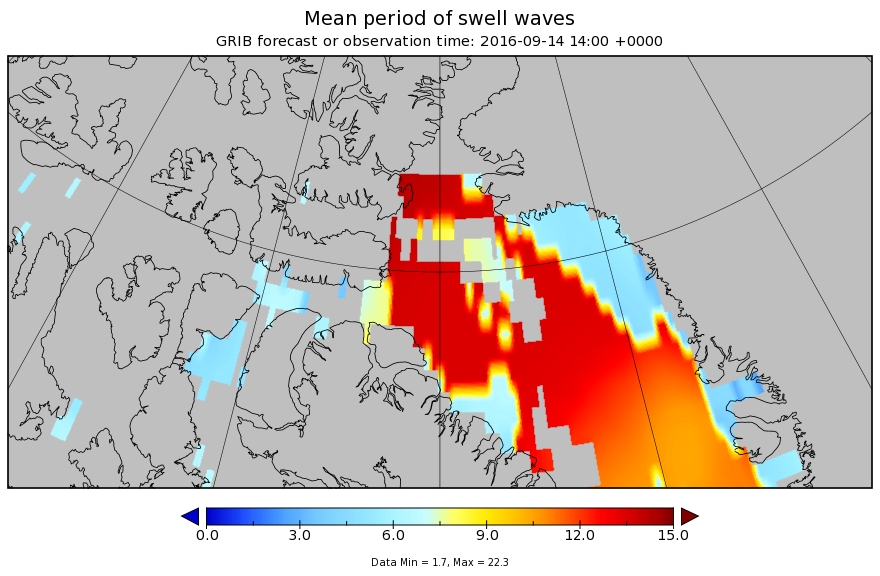
With all that ice now safely behind her Northabout has new dangers to face. Wind and waves! Let’s take a look at the WaveWatch III “surf forecast” for Baffin Bay over the next few days. A low pressure area is heading in Northabout’s direction from across the Canadian Arctic Archipelago. By Wednesday morning (UTC) the resultant wind field looks like this:
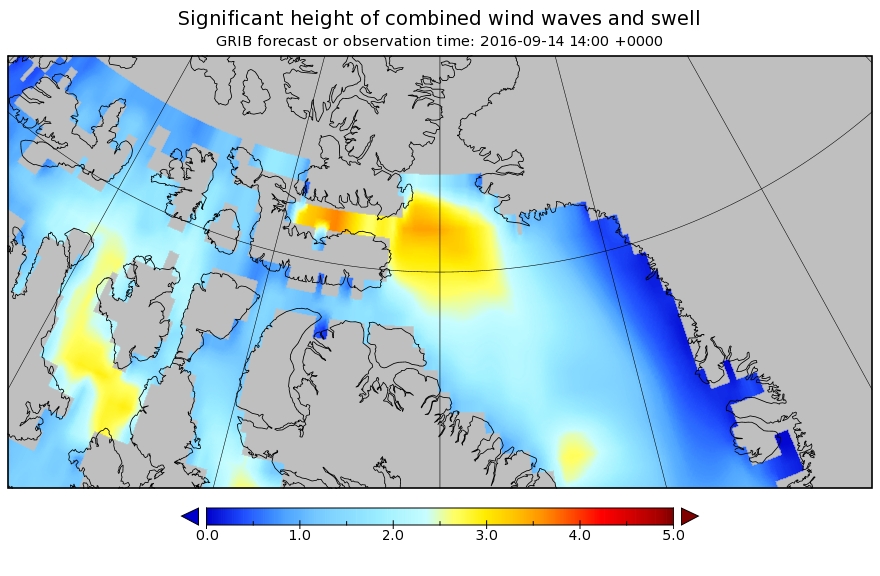
By Wednesday afternoon those winds of around 15 m/s will have produced waves in Baffin Bay that are forecast to have reached over 3 meters high:
and what’s more they won’t be just wind waves. A modest swell with a period of over 12 seconds is predicted too:
I’m sure the Polar Ocean Challenge team will be doing their level best to be safely on the opposite side of Baffin Bay by the time the worst of the weather arrives!
Our coverage of the Northwest Passage is starting somewhat earlier then usual in 2016. That’s because an educational comment of mine seems to have gone permanently missing over at Andrew Montford’s blog. Over there commenter “Golf Charlie” suggested that:
Perhaps based on rumours, or folk stories, the possibility of a North West Passage, was the answer to many peoples dreams of wealth, fame and fortune. The Franklin Expedition set off, with all confidence, knowing that there had been an unprecedented retreat in Arctic sea ice extent. They never came home. The ships then sent to rescue them, never came home either, but some survivors did.
In July 2010, due to unprecedented ice loss, a team set out to find HMS Investigator, (one of the rescue ships) and found her within 15 minutes, exactly where she was trapped and abandoned. How had she got there?
This may be just a load of boring and irrelevant history to you, but as an ice expert keen to lecture others, it just seems strange that you don’t acknowledge the fact that before man made CO2 emissions could possibly had any remote chance of shrinking sea ice, it had all happened before.
It is likely that whatever caused the ice to retreat in the 1830s/40s, may have caused the current retreat. As no attempt has been made to explain this historical retreat, it seems premature to jump to conclusions about the present. What stories and folklore convinced Franklin there was a NWP? Had it opened before? Did the Vikings circumnavigate the North Pole? No one knows for sure.
Here’s the beginnings of my by now expanded reply:
I am already very familiar with the sorry tale of Franklin’s ill fated expedition. By way of some more recent Northwest Passage history, were you previously aware that Charles Hedrich completed his own multi-year voyage through the NWP last summer? His vessel was much smaller than Franklin’s:
“He is now, the first man to have rowed solo the North-West Passage.”
It’s not terribly clear, but apparently Charlie thinks his “unprecedented ice loss” in the Summer of 2010 had a precedent in the 1840s and/or 50s. Perhaps he will pop in and elucidate? Whilst we wait to see what transpires in that regard, here’s an animation of sea ice concentration across the Northwest Passage last summer:
My missing comment also referenced (by way of example!) a 2015 academic journal paper entitled “Ice thickness in the Northwest Passage“. Amongst its other conclusions can be found this:
Global climate models with their coarse resolution likely have difficulty capturing intricate sea ice dynamic processes within the narrow channels of the CAA. Specifically, the import, survival, and thickness of MYI are difficult to predict and may in fact increase during the transition to a sea ice-free Arctic with more mobile ice conditions in the Queen Elizabeth Islands which are located between the Arctic Ocean and NWP. Presumably, MYI from the Arctic Ocean will be more heavily ridged and thicker than locally formed MYI, posing greater danger to transiting ships than locally grown MYI.
Whilst we look forward to the prospects of the “transition to a sea ice-free Arctic”, what about the prospects for the Northwest Passage in the summer of 2016. As you can see from the video there wasn’t much in the way of multi-year sea ice left there by the Autumn of 2015, and there doesn’t seem to have been much transport of ice into the Canadian Arctic Archipelago over the winter either.
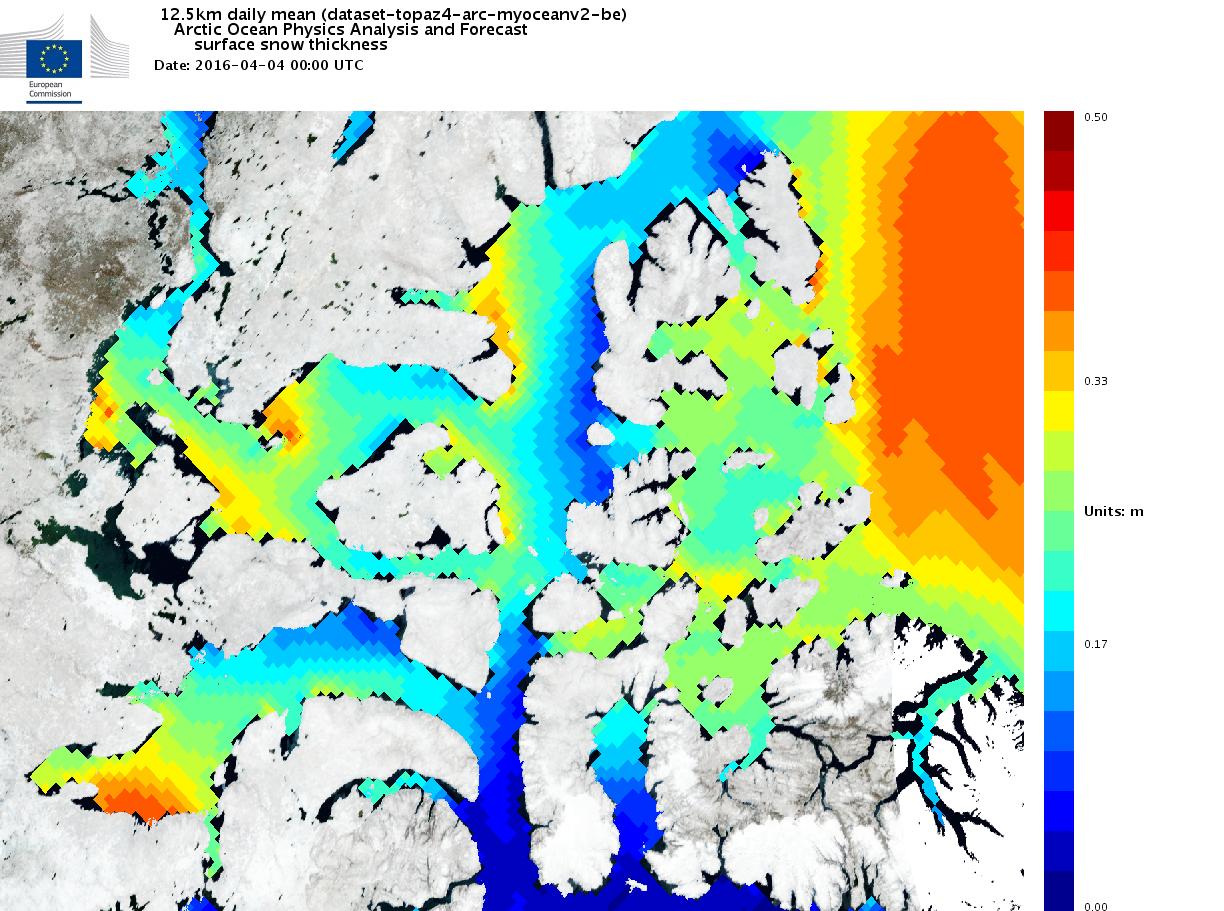
On top of the ice there will of course be some snow by now. Here’s how the Topaz 4 snow cover map of the area looks at the moment:
All in all it looks to me at this early stage of the 2016 Arctic sea ice melting season as though one or more of the assorted routes through the Northwest Passage will be open again this coming summer. Do you suppose that will look like yet another “unprecedented retreat” to “Golf Charlie’s” eyes?
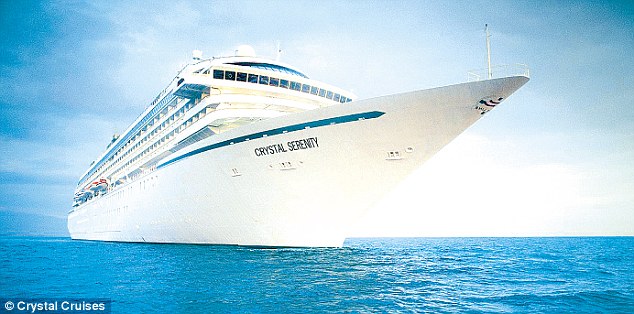
It seems as though a large commercial organisation sees things that way too. Crystal Cruises have concluded that in 2016 the Northwest Passage offers:
The ultimate expedition for the true explorer!
Anchorage to New York on Crystal Serenity
DATES : August 16 – September 17, 2016 (32 Days) CRUISE-ONLY FARES FROM : $21,855 Per Person
More than 18 months of careful planning and analysis has already gone into this project from January 2013 to July 2014, and will continue up to, and through, departure.
There will not be shore-based cell phone signals along the transit, except in the communities and towns we will be visiting. However, guests are requested to not use this signal when in port, as it will overwhelm the local system and disrupt the communication within the community.
While communication channels may be temporarily limited or unavailable to guests, the ship’s Captain and crew will always have operational and emergency communication throughout the entire voyage.
This website uses cookies to improve your experience. We'll assume you're ok with this, but you can opt-out if you wish. Cookie settingsACCEPT
Privacy & Cookies Policy
Privacy Overview
This website uses cookies to improve your experience while you navigate through the website. Out of these, the cookies that are categorized as necessary are stored on your browser as they are essential for the working of basic functionalities of the website. We also use third-party cookies that help us analyze and understand how you use this website. These cookies will be stored in your browser only with your consent. You also have the option to opt-out of these cookies. But opting out of some of these cookies may affect your browsing experience.
Necessary cookies are absolutely essential for the website to function properly. This category only includes cookies that ensures basic functionalities and security features of the website. These cookies do not store any personal information.
Any cookies that may not be particularly necessary for the website to function and is used specifically to collect user personal data via analytics, ads, other embedded contents are termed as non-necessary cookies. It is mandatory to procure user consent prior to running these cookies on your website.


