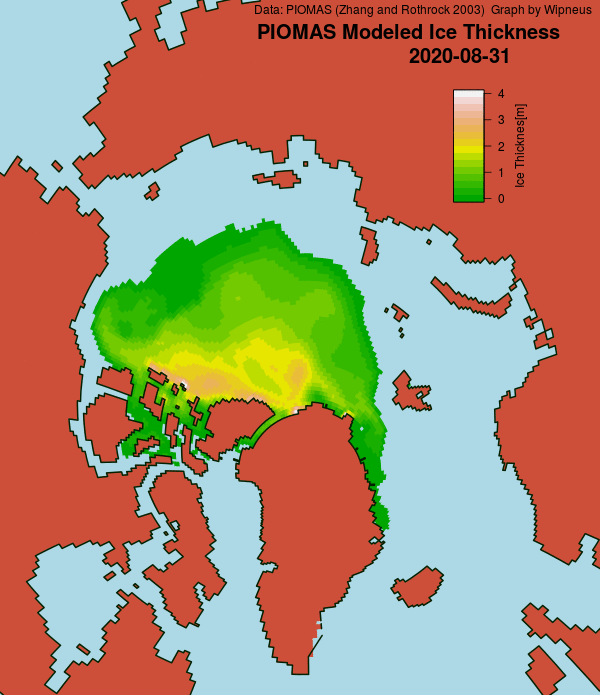
A detailed dissection of the 2020 minimum of various Arctic sea ice extent metrics can be found on a dedicated thread. All other Arctic news in September will be found below. As is usually the case, let’s set the ball rolling by taking a look at Wipneus’s visualisations of the August PIOMAS gridded thickness data:
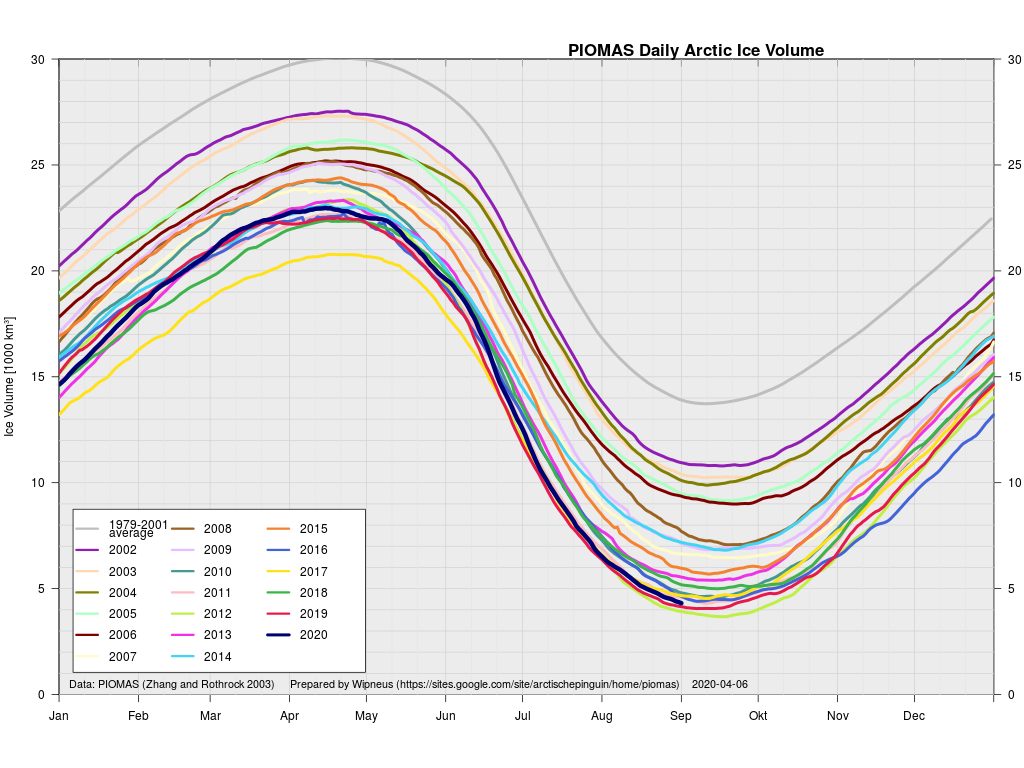
together with the computed volume:
and anomaly graphs:
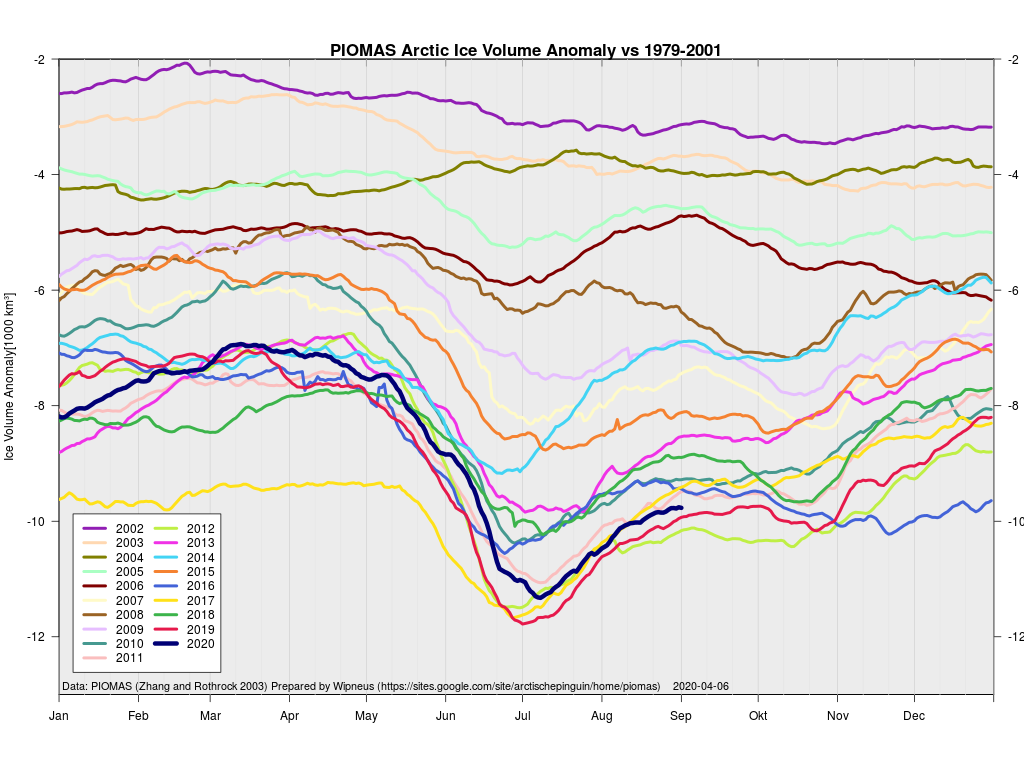
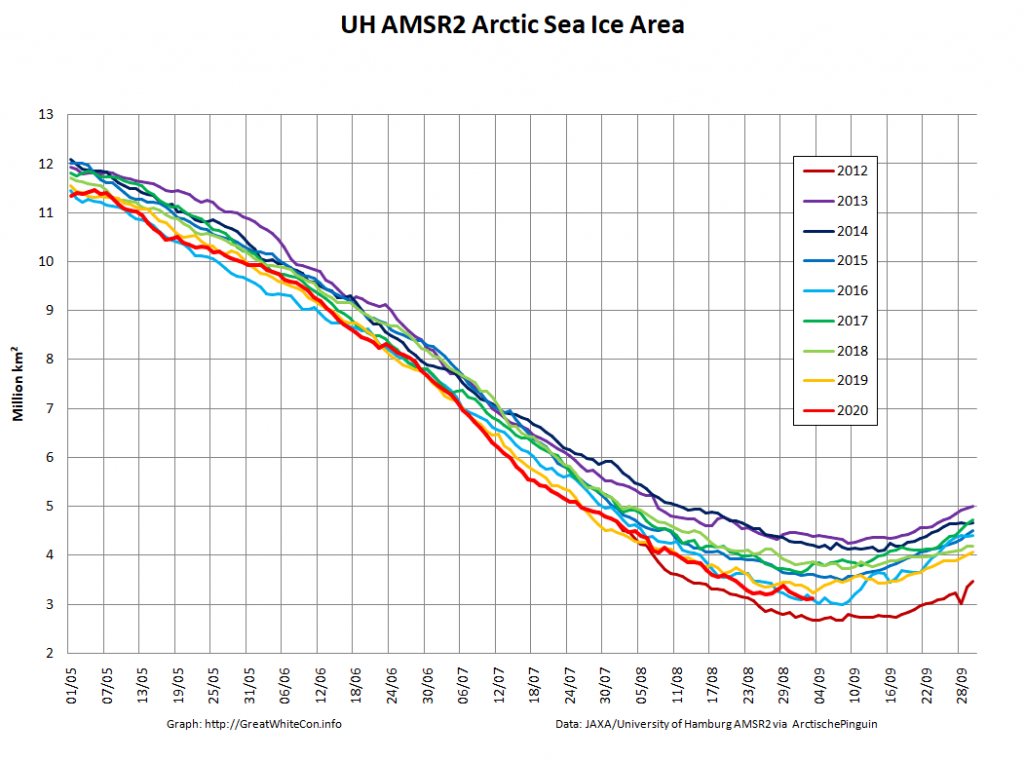
PIOMAS volume at the end of August was still firmly in 3rd place behind 2012 and 2019.
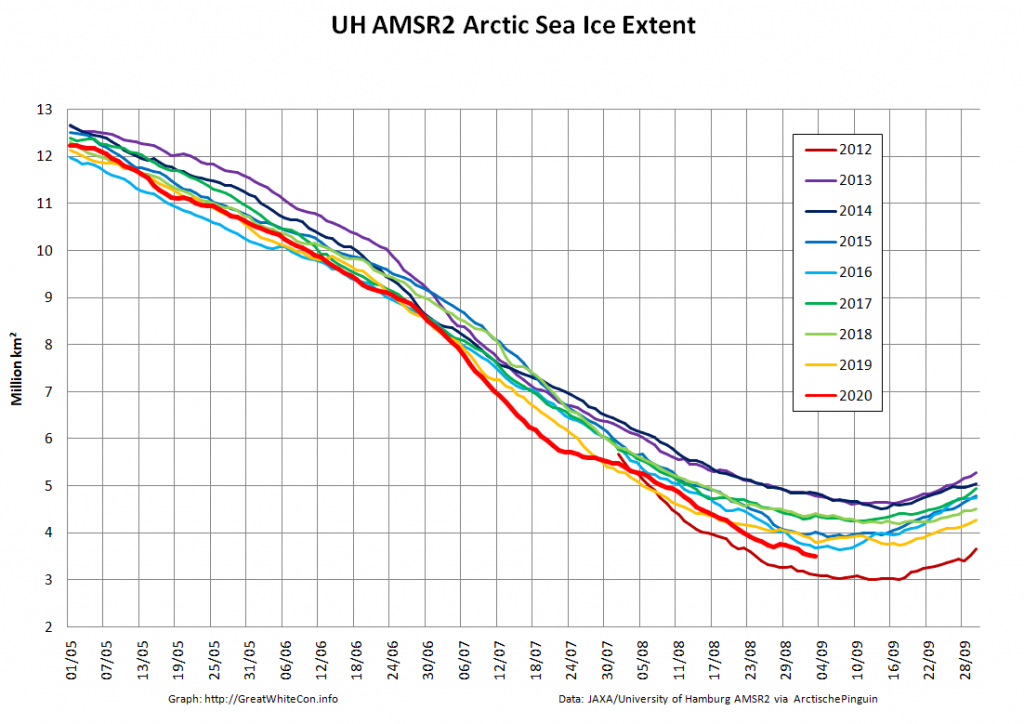
However Arctic sea ice extent is firmly in second place behind 2012, although that does not also apply to area:
This is the first appearance of some “new ice” on one the Canadian Ice Service’s “stage of development” charts covering the Canadian Arctic Archipelago:
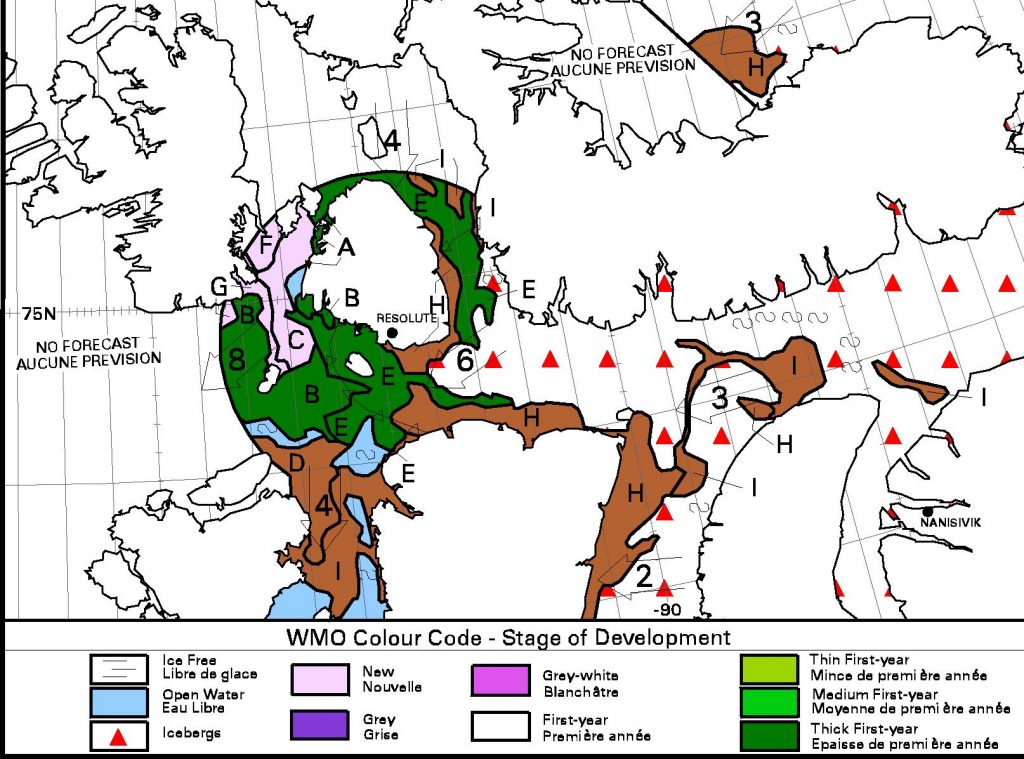
In this case in McDougall Sound to the west of Cornwallis Island.
The mid month PIOMAS gridded thickness numbers have been released:
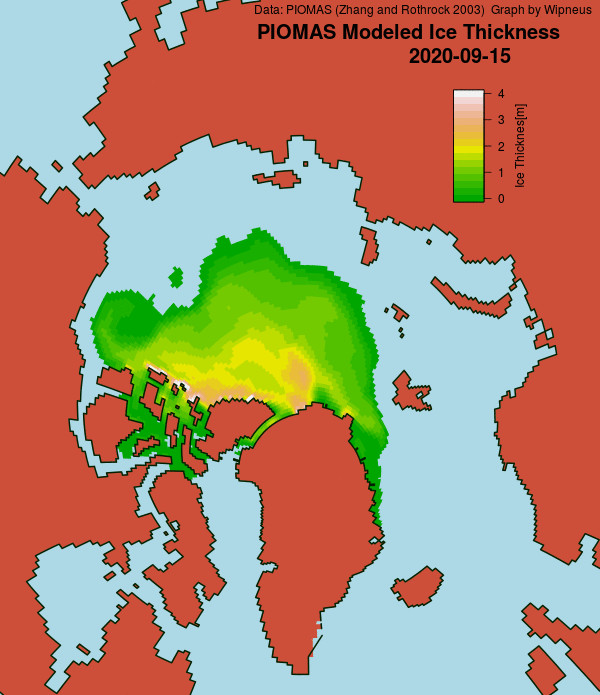
The computed volume is now in second place below 2019:


The minimum volume so far is on the last day of the available data, so we’ll have to wait another 2 weeks or so before coming to any conclusions about 2020 minimum Arctic sea ice volume.
One curiosity has struck me. The PIOMAS model shows Lancaster Sound almost full of sea ice on September 15th, whereas the Canadian Ice Service chart still does not:
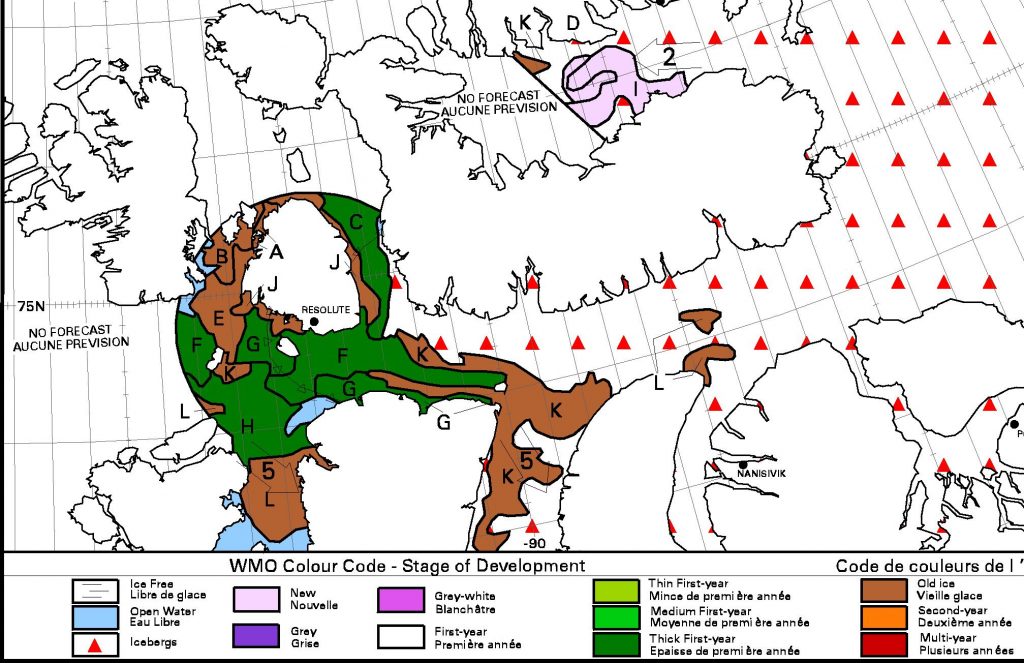
Watch this space!
Jim, this is a graphic: could you please display it?
[Done – Mod]
(Maybe you could tell me how to do that myself?)
–> My questions regarding this graphic are;
– Firstly: Why is Farenheit being measured in degrees…
– and Secondly: Why is 59C ever mentioned in the text that follows the graphic?
Sorry, it doesn’t appear to work, it’s the opening graphic from this page:
https://www.theverge.com/2020/8/21/21395621/hottest-temperatures-verification-research-death-valley-wmo-record
To get an image to display you need to put the link to the picture inside an <img> tag. For an example see:
https://www.w3schools.com/tags/tag_img.asp
1) You’ve lost me. Surely Fahrenheit is always measured in degrees?
2) Looks like there’s a bug in the temperature display? That being the case it’s a less than ideal choice of illustration for that article!
How about this one instead?
Whoah, that’s better… but I still don’t believe Fahrenheit is measured in degrees…
Seriously?
https://en.wikipedia.org/wiki/Fahrenheit
i reckon kelvin temperature is not measured in degrees?
some people also say degrees centigrades, which is wrong, i think.
Come on, snap out of it.
Degree Defined:
“Any of various units of measurement, especially of temperature or angles, usually shown by the symbol ° written after a number:
a difference of three degrees
Water boils at 212° Fahrenheit and 100° Celsius/Centigrade.
A right angle is an angle of 90°.
New York is on a latitude of 41°N and a longitude of 74°W.”
https://dictionary.cambridge.org/us/dictionary/english/degree
Now knock it off, please.
Thanks!
What about Kelvin?
(You might be right Jamil?!)
Hi, Jim,
Thanks for all the postings.
La Niña starting?
Though area has been cooling for past months.
In the last two years we have see rapid recovery from very low summer extent area volume to levels much higher, temporarily 12 -14th lowest ranking.
Twice lucky or will we see it again?
Heading for second hottest year on a lot of records yet at the same time going into a colder than recent winter season?