It’s going to be more difficult to follow traffic on the Northern Sea Route this year, because the Russian authorities are no longer publishing daily position information for ships using the route.
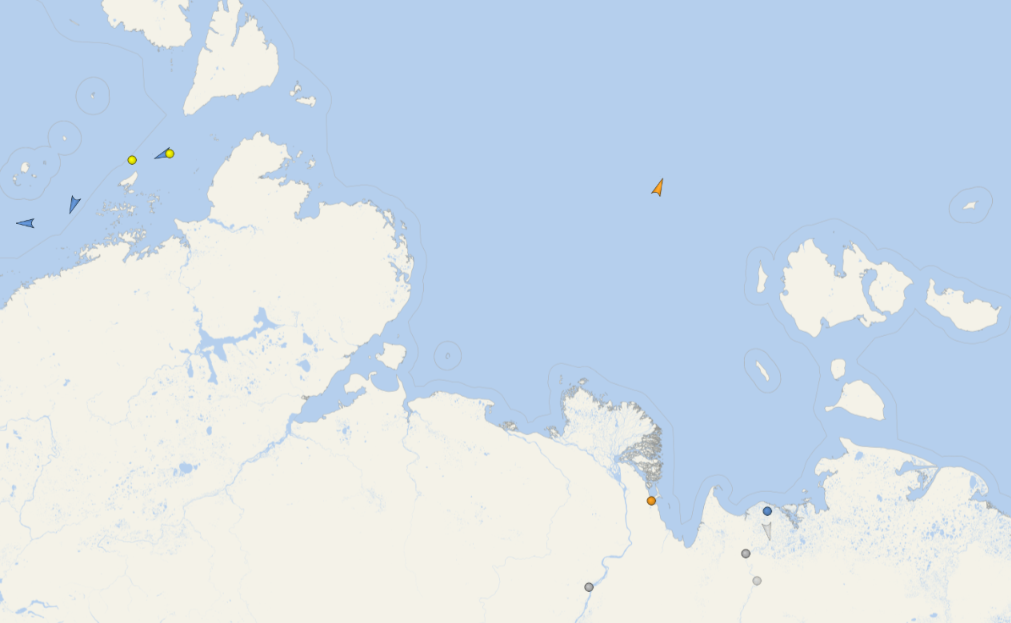
However other sources revealed that things got underway early this year. On May 29th the nuclear icebreaker Ural led LNG tanker Christophe de Margerie through the Vilkitsky Strait into the Laptev Sea:
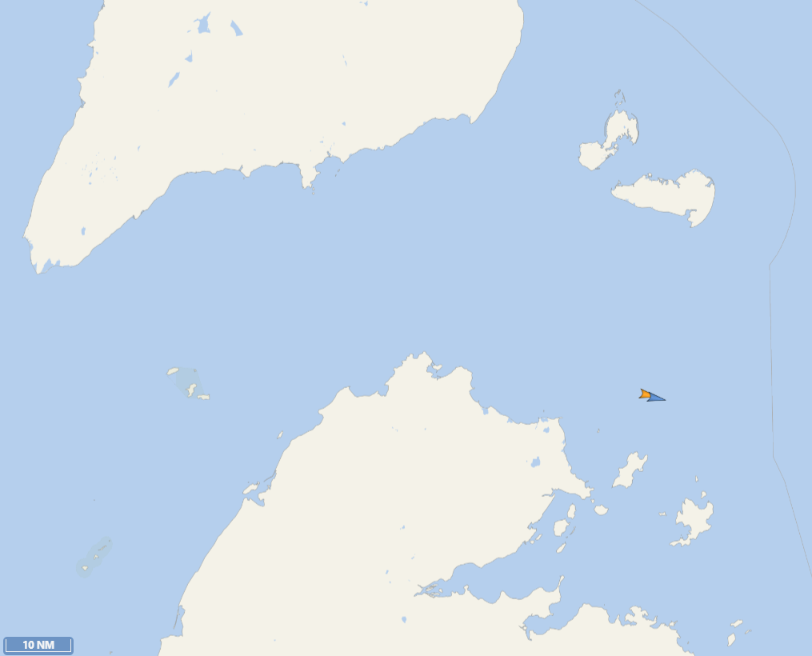
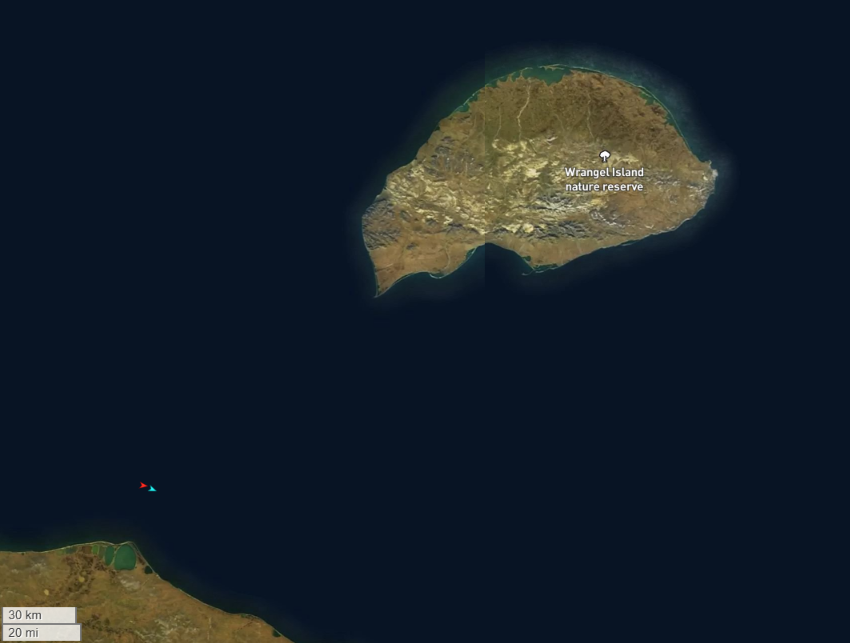
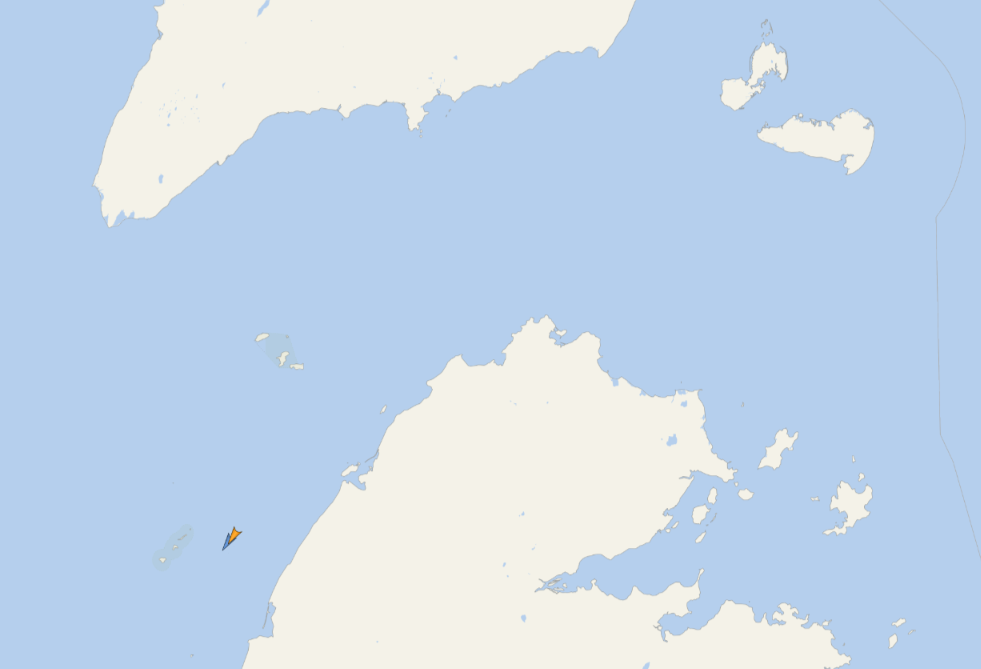
On June 5th the modest convoy is about to pass Wrangel Island into the Chukchi Sea:
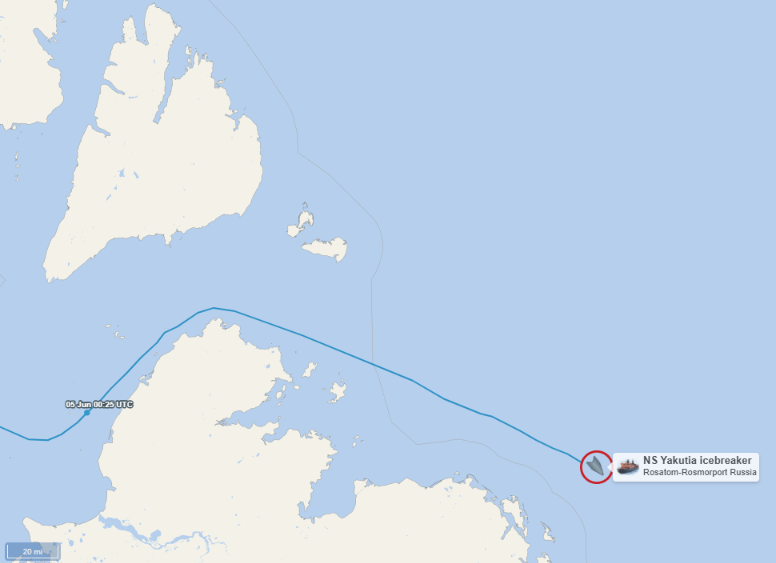
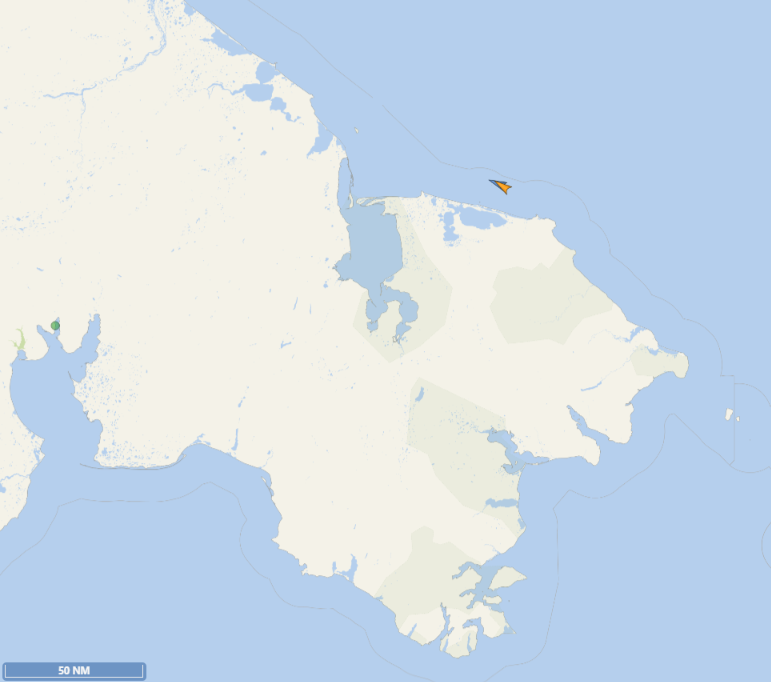
Another nuclear powered icebreaker, Yakutiya, has also just made its way through the Vilkitsky Strait heading east:
If Yakutiya is leading a convoy of one or more other vessels through the pack ice in the Laptev Sea they have all got satellite AIS turned off!
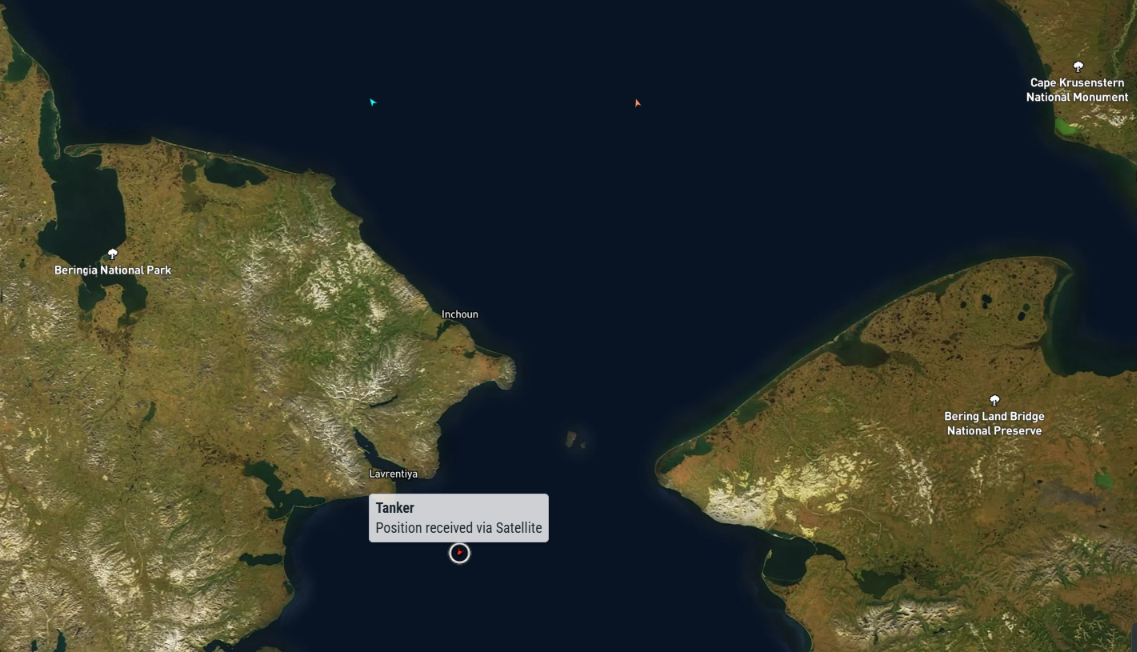
[Update – June 8th]Christophe de Margerie has passed through the Bering Strait, and thus completed the first west to east voyage through the Northern Sea Route this year. Ural has been left behind in the Chukchi Sea:
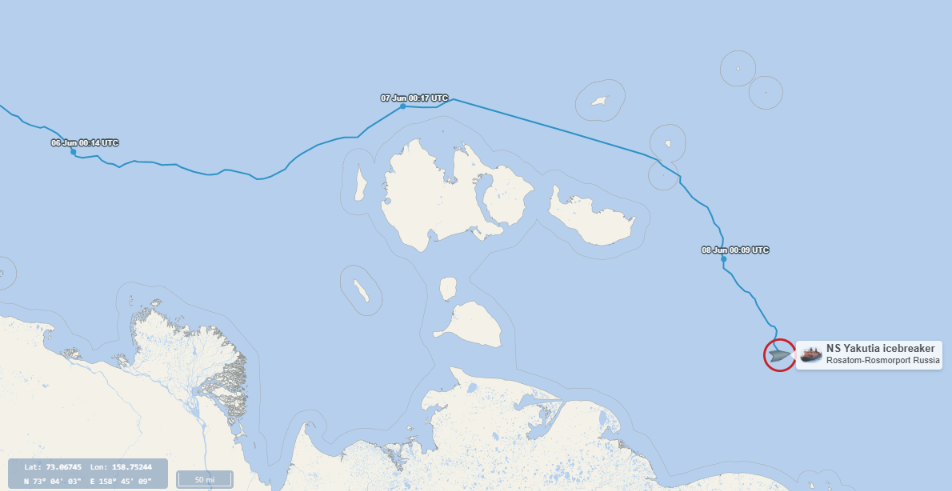
Yakutiya has travelled north of the New Siberian Islands and entered the East Siberian Sea:
Christophe de Margerie has just passed through the Bering Strait heading north on a return journey through the NSR. This time around Yakutiya is leading the way:
Yakutiya and Christophe de Margerie have just passed through the Vilkitsky Strait heading west:
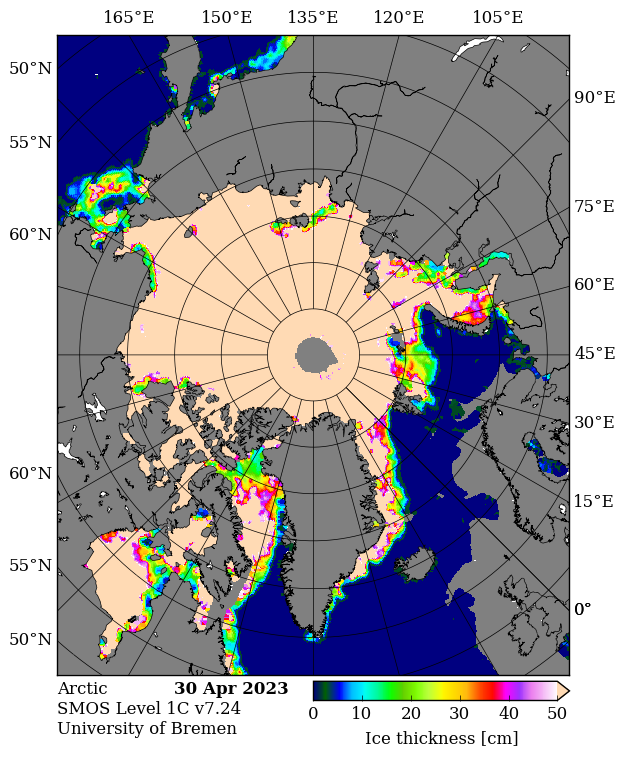
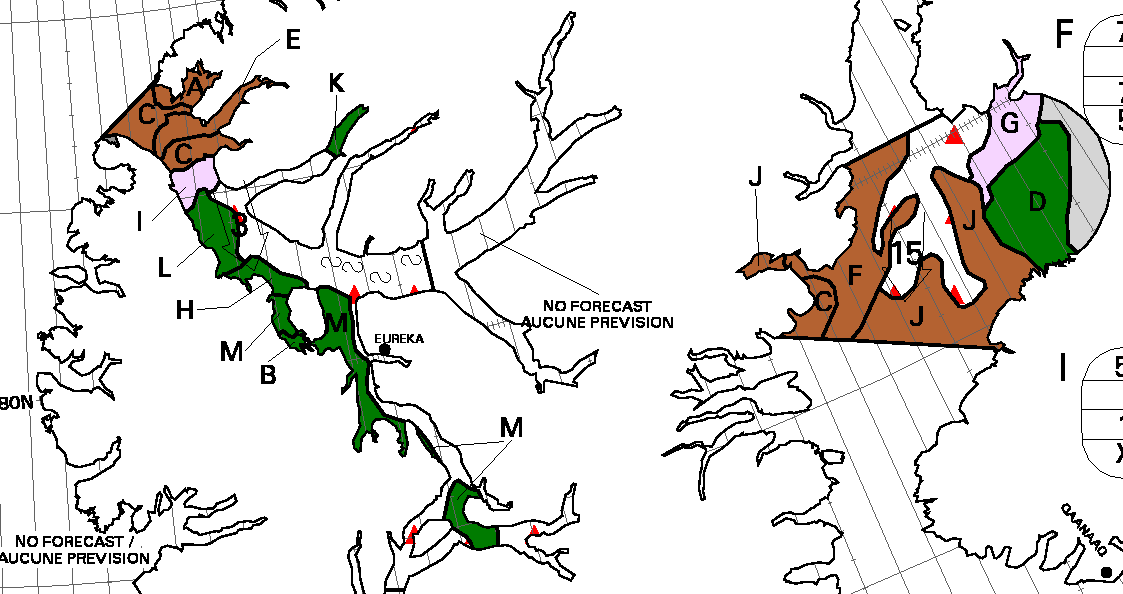
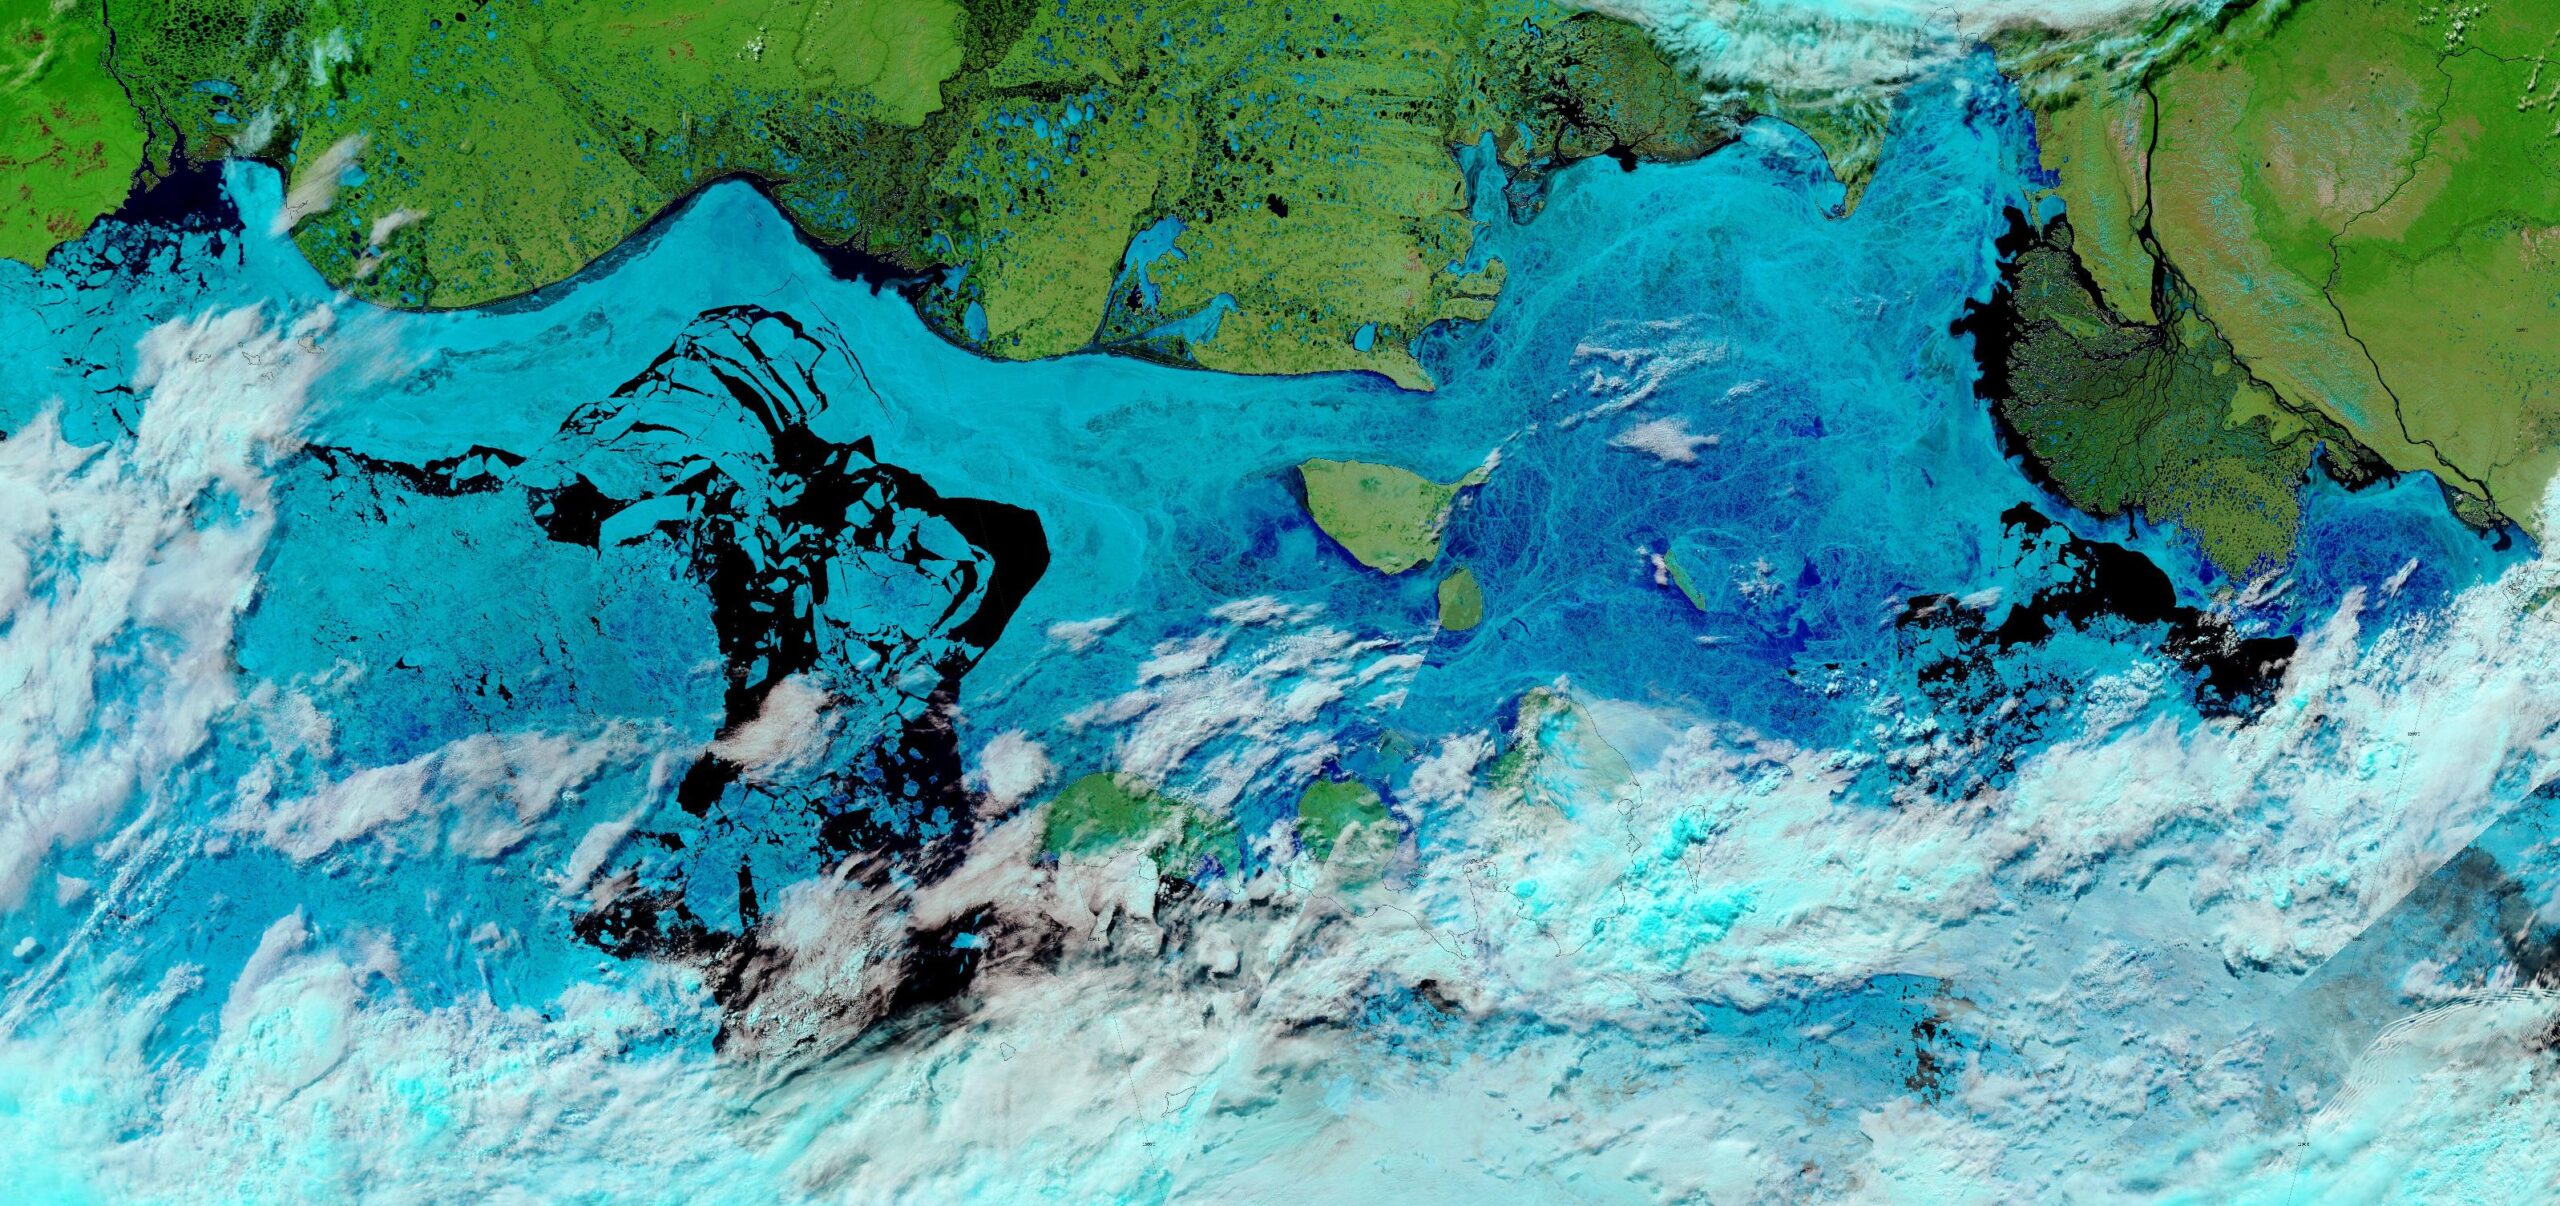
The skies were fairly clear over the central Northern Sea Route this morning, revealing the fast ice breaking up in the East Siberian Sea and plenty of melt ponds in the Laptev Sea:
Christophe de Margerie is back in the Laptev Sea heading east, this time accompanied by Boris Davydov, another LNG tanker. The nuclear icebreakers are all in the Kara Sea, on the other side of the Vilkitsky Strait:
Watch this space!