The results of the ARCUS Sea Ice Prediction Network August call have been released, and here is the outlook for the 2021 minimum September mean Arctic sea ice extent:

The median prediction for the mean sea ice extent during the month of September 2021 is 4.39 million km2. According to ARCUS:
As of 22 August 2021, the Arctic sea-ice extent was 5.58 (compared with 25 August 2020 value of 4.43) million square kilometers. Arctic sea-ice extent in 2021 remains well below the climatological median and has closely followed the 2012 values for much of the summer but has diverged to higher sea-ice extent starting in early August. The forecasts continue to support September 2021 mean sea-ice extent being well above the September 2020 value. July sea-ice retreat has been greatest in the Eurasian seas, particularly in the East Siberian Sea, making the 2021 ice edge well north of the long-term median edge in Eurasia. Sea ice retreated since the end of July along the northern coast of Alaska, although the ice edge is near its climatological position, which makes the Beaufort and Chukchi sea ice extent the largest at this time of year since 2006. A tongue of sea ice that has been present all summer continues to extend close to land in the Kara Sea, making the northeast passage likely to remain blocked for the first time in several years. Half the models which provide spatial data to the SIO predict that the tongue is likely to survive.
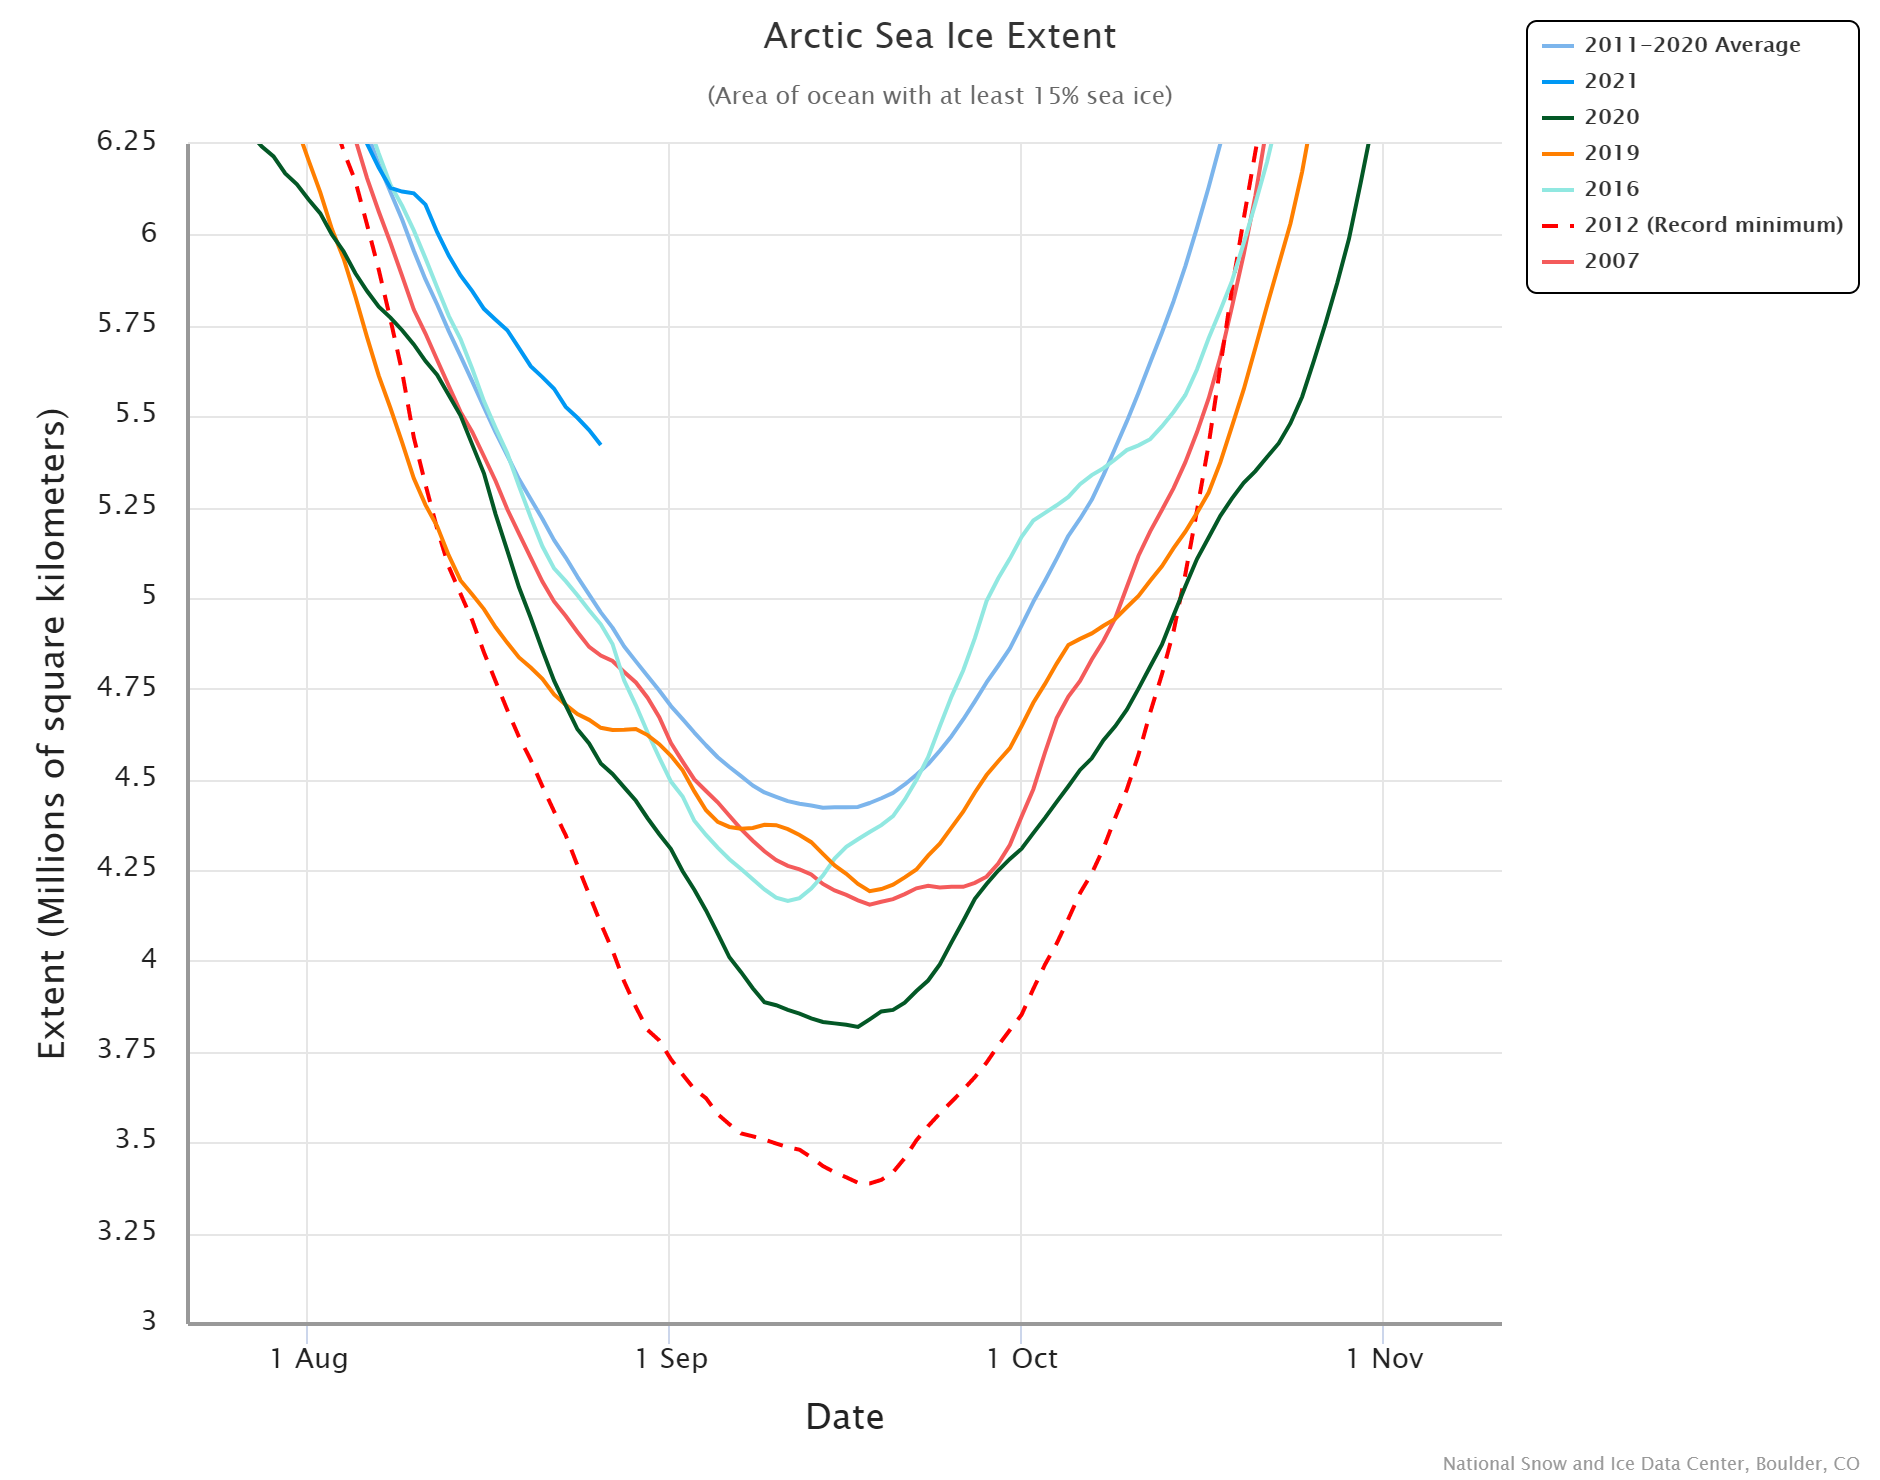
Now let’s take a look at a range of assorted extent measurements. Here’s the NSIDC’s 5 day average extent:
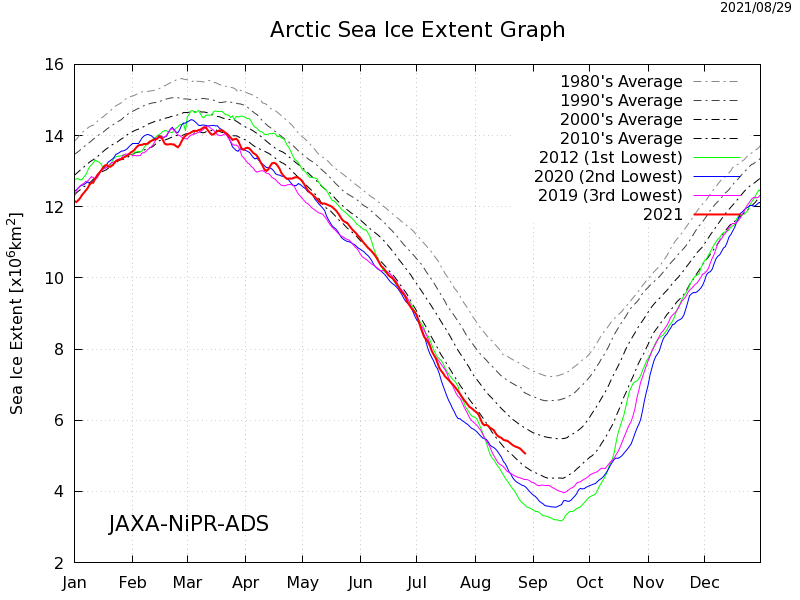
Next here’s JAXA/ViSHOP extent, generally assumed to be a “2 day average”:
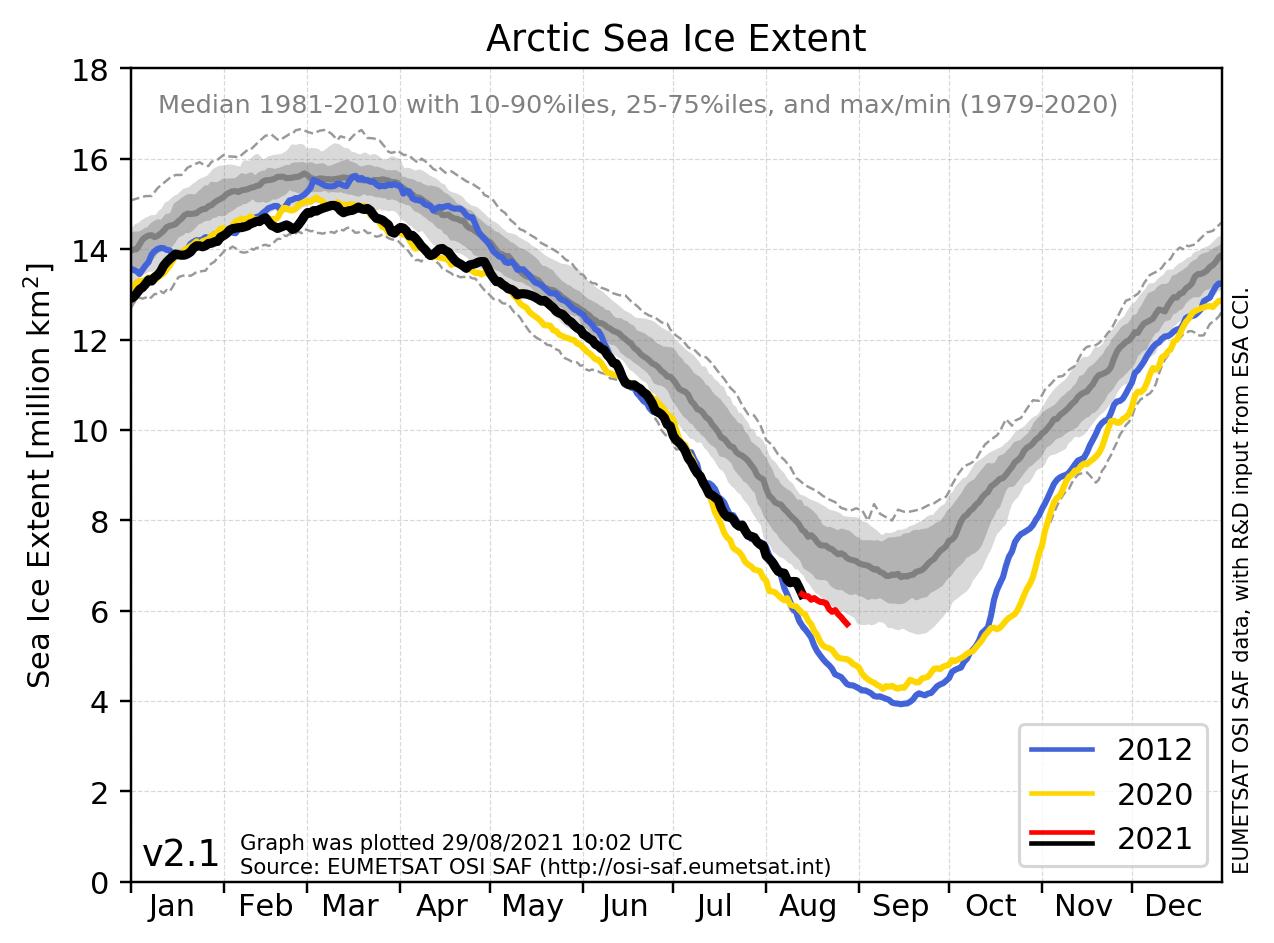
Then there’s the EUMETSAT OSI-SAF version:
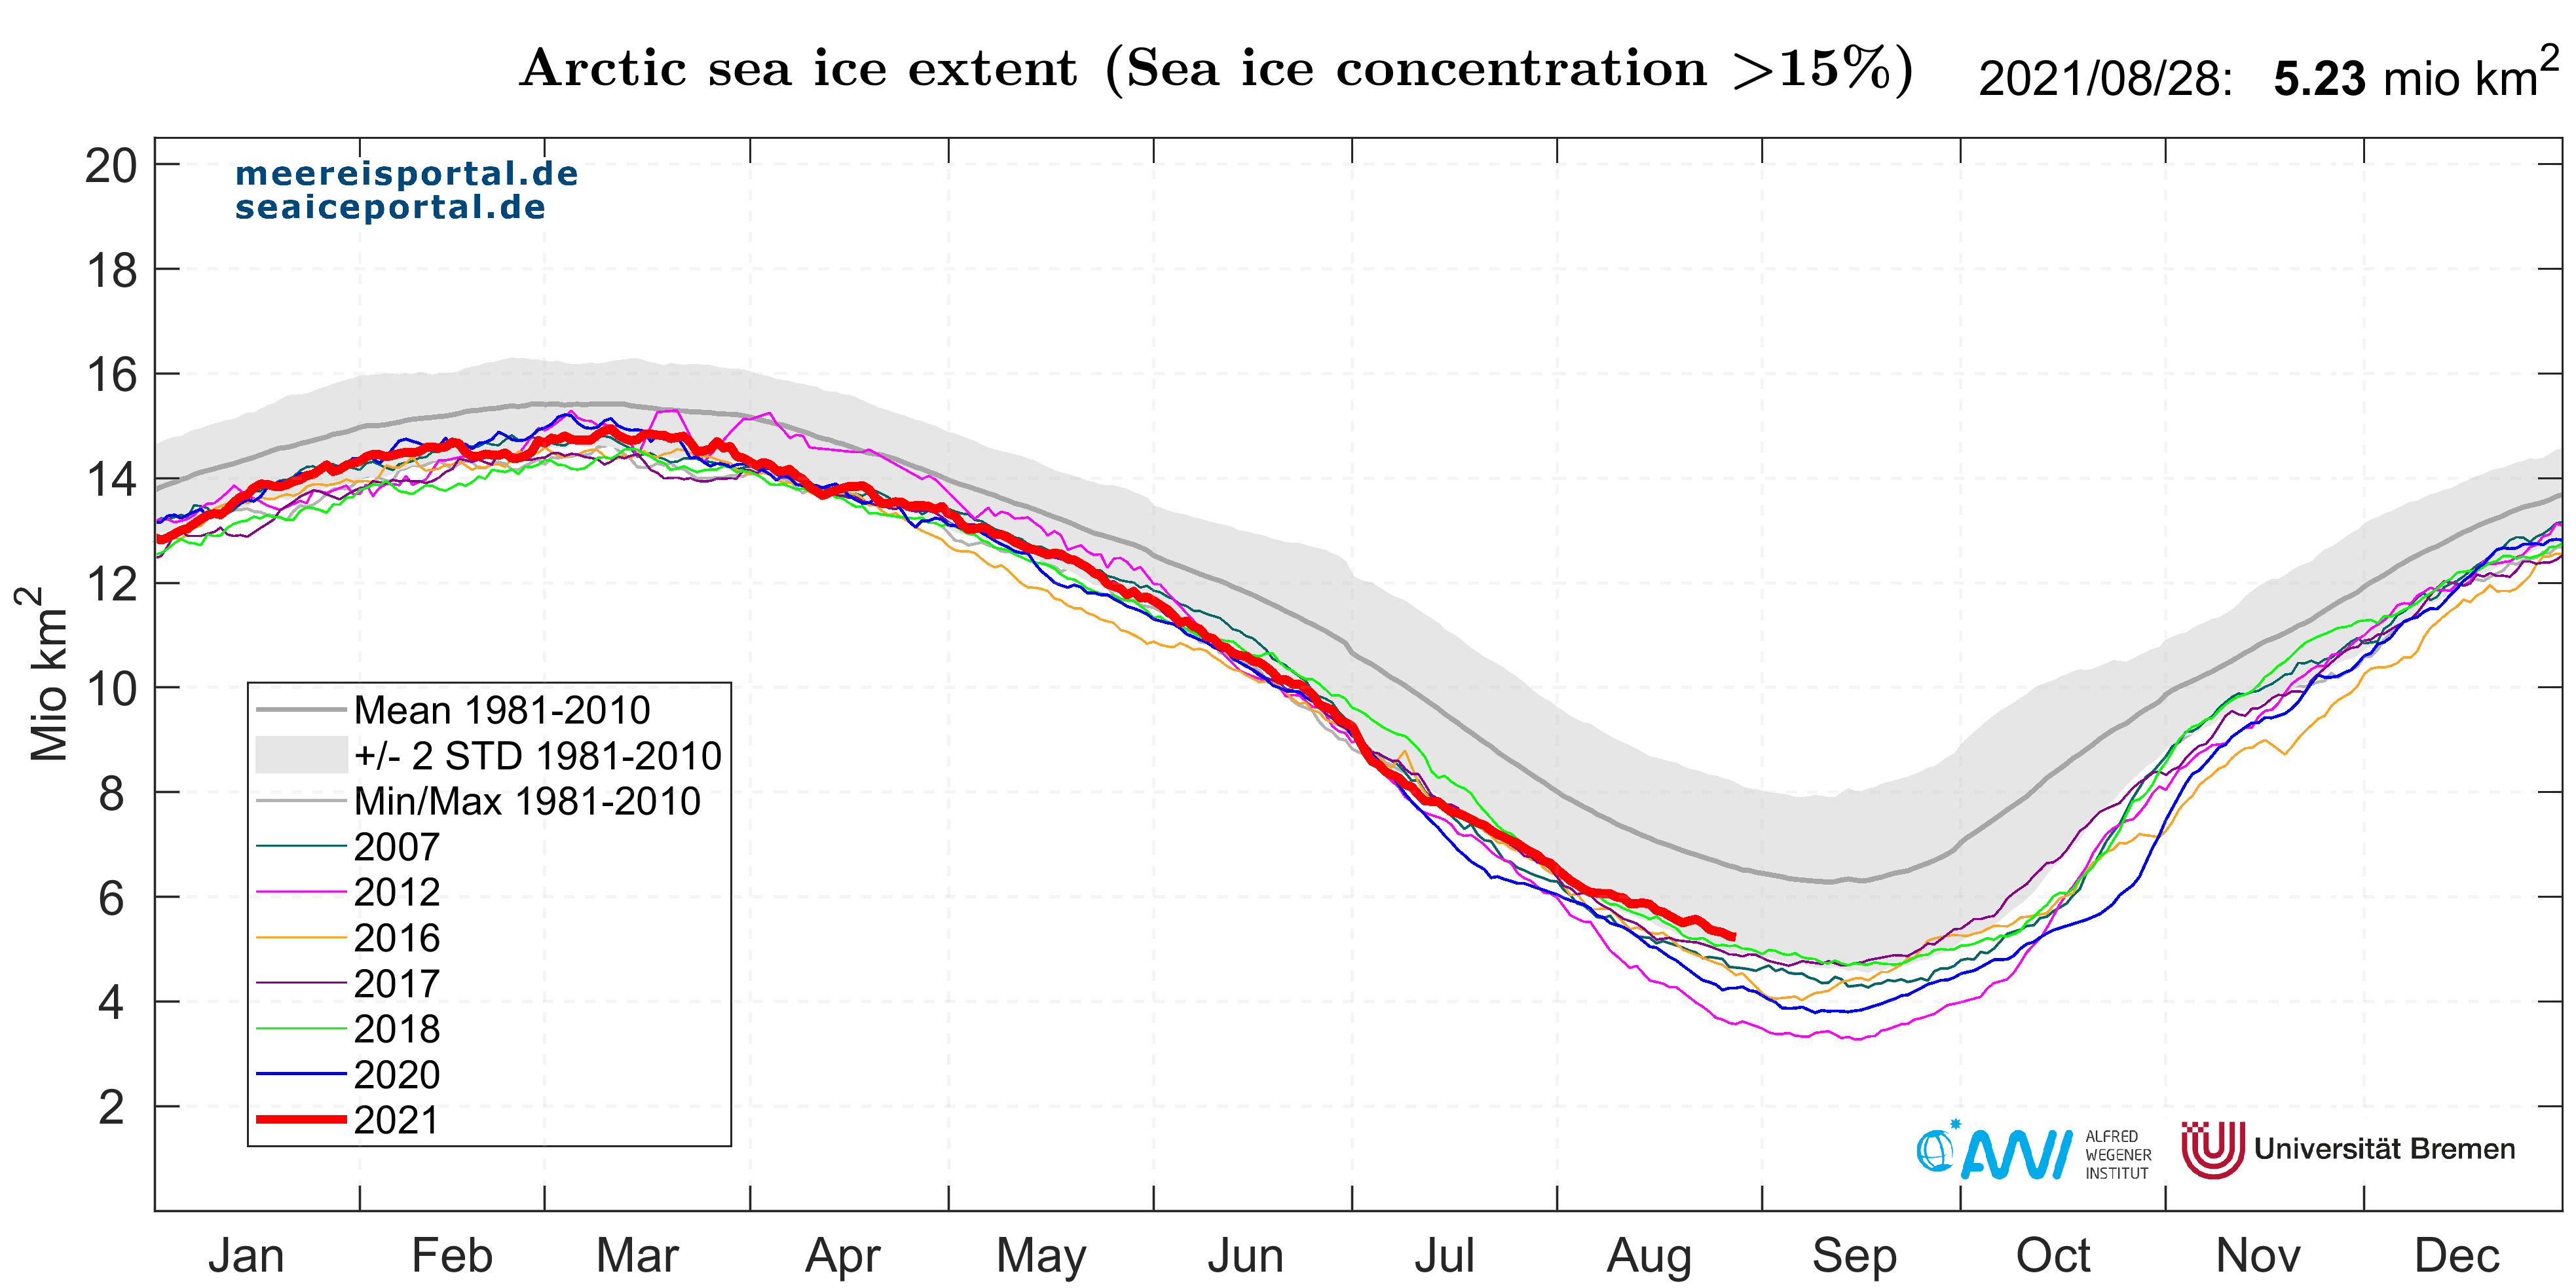
and finally, for the moment at least, here is the Alfred Wegener Institute / University of Bremen version:
With September 1st only 3 days away all the assorted extent metrics are above the 5 million km2 level. Will one or more of them manage to get below the SIPN predicted 4.39 million km2 monthly average by September 30th? Will the current “tongue of sea ice” in the Kara Sea survive the summer? How about the multi-year ice still surviving in the Beaufort and Chukchi Seas?
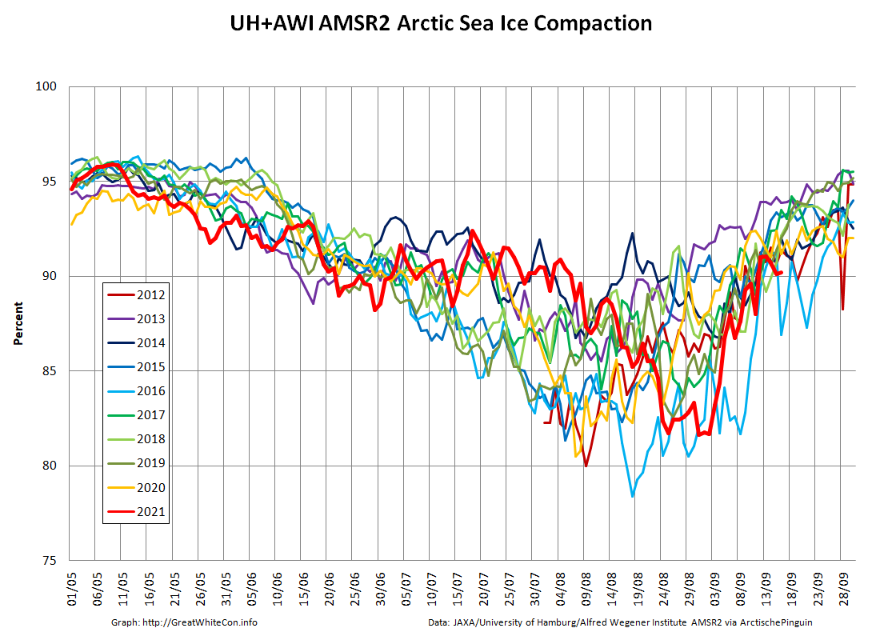
[Edit – September 1st]Here are the end of August numbers for the “high resolution” AMSR2 metrics:
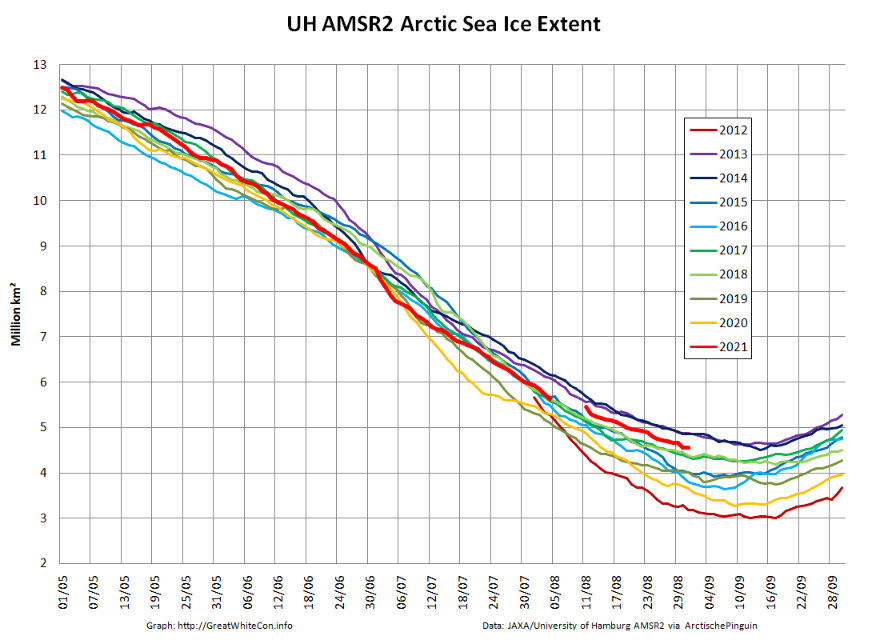
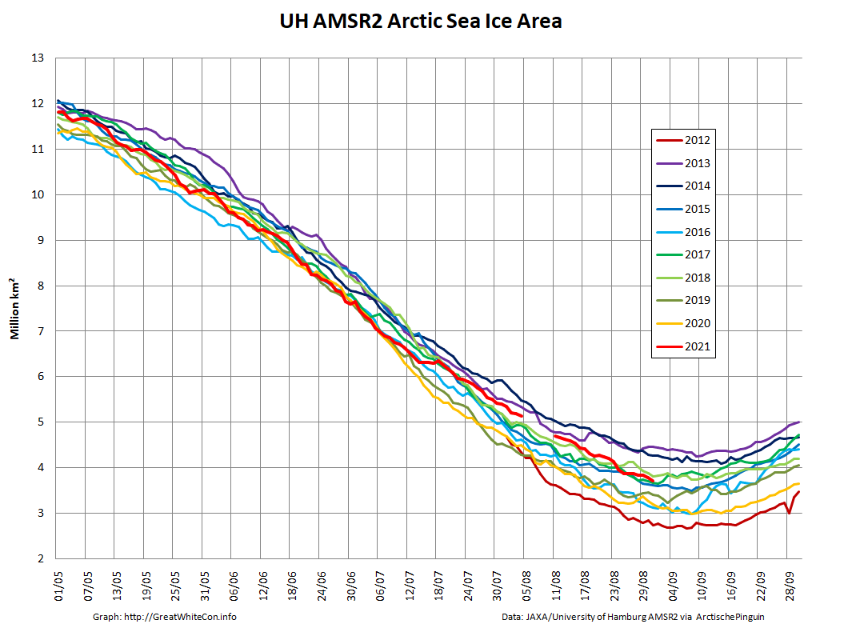
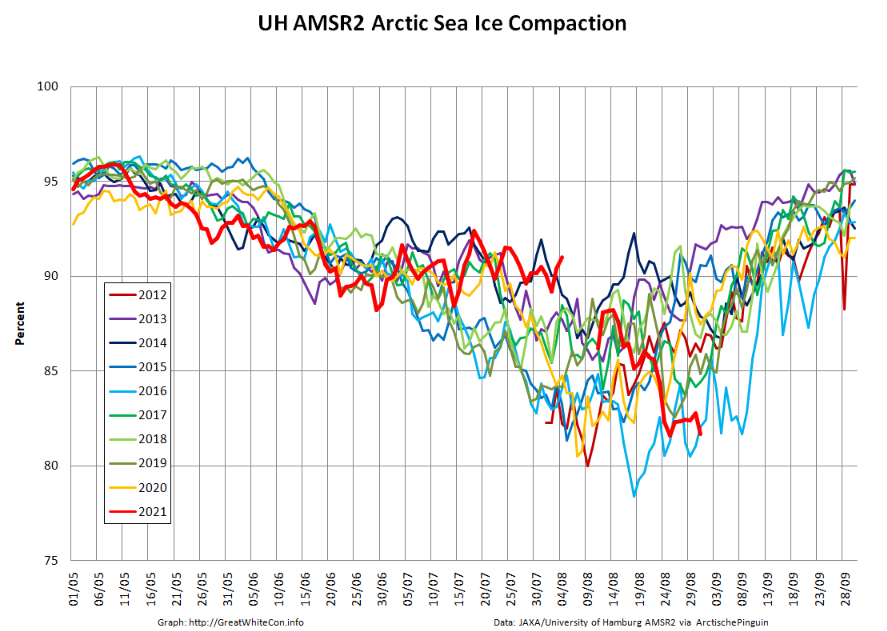
Extent on August 31st is 4.55 million km2. Unlike JAXA’s AMSR2 extent metric, which has been almost flat for the last couple of days, this one has taken a bit of a tumble. Compaction is currently lowest for the date in the AMSR2 record. Unlike extent!
[Edit – September 15th]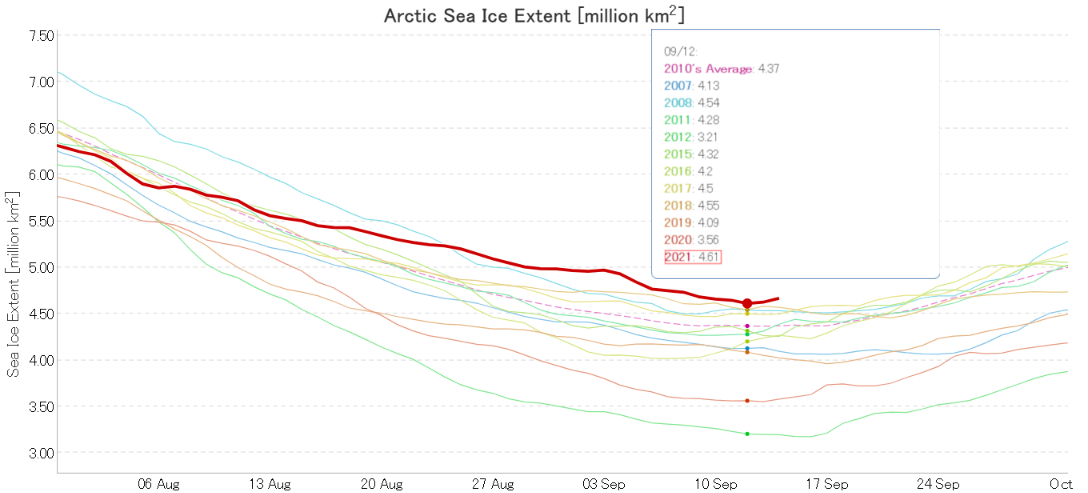
A very tentative minimum is now visible on the JAXA/ViSHOP extent graph. Barring any further declines minimum extent for 2021 was 4.61 million km2 on September 12th.
[Edit – September 17th]In the continuing Google enforced absence of our favourite UH derived metrics I’ve grafted the newly available AWI high resolution AMSR2 area/extent data onto the existing UH numbers. Here is the result:
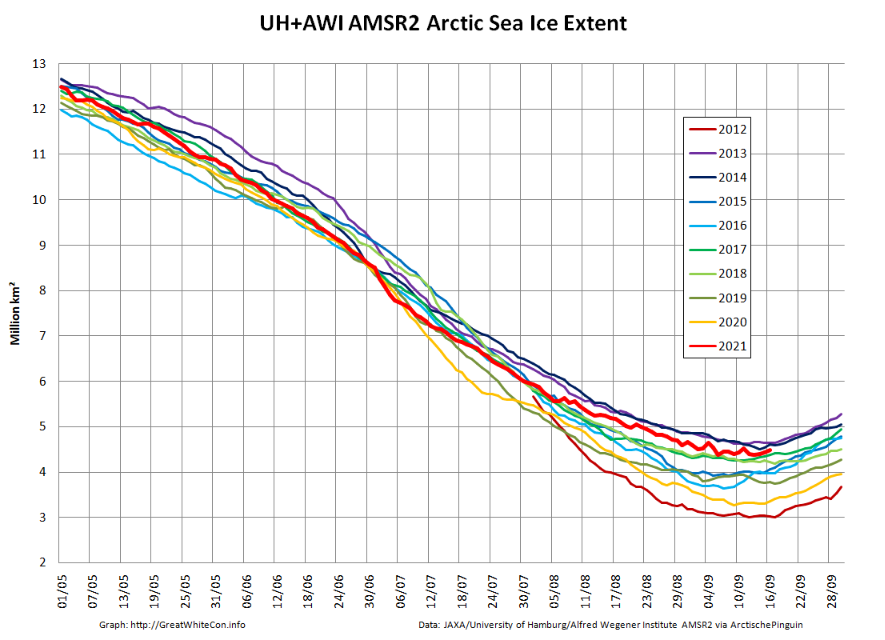
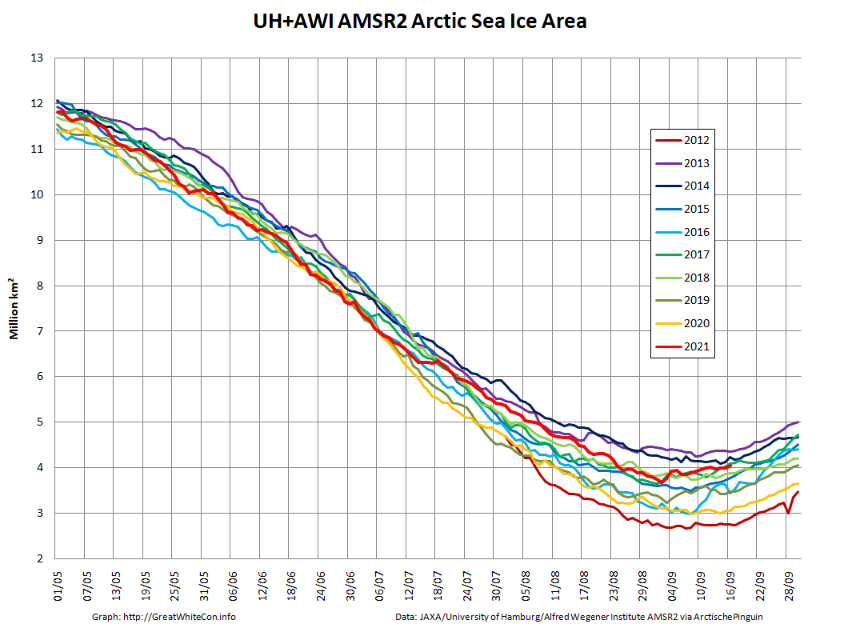
The join is invisible, and the high resolution AWI AMSR2 minimum Arctic sea ice extent for 2021 currently stands at 4.38 million km2 on September 13th.
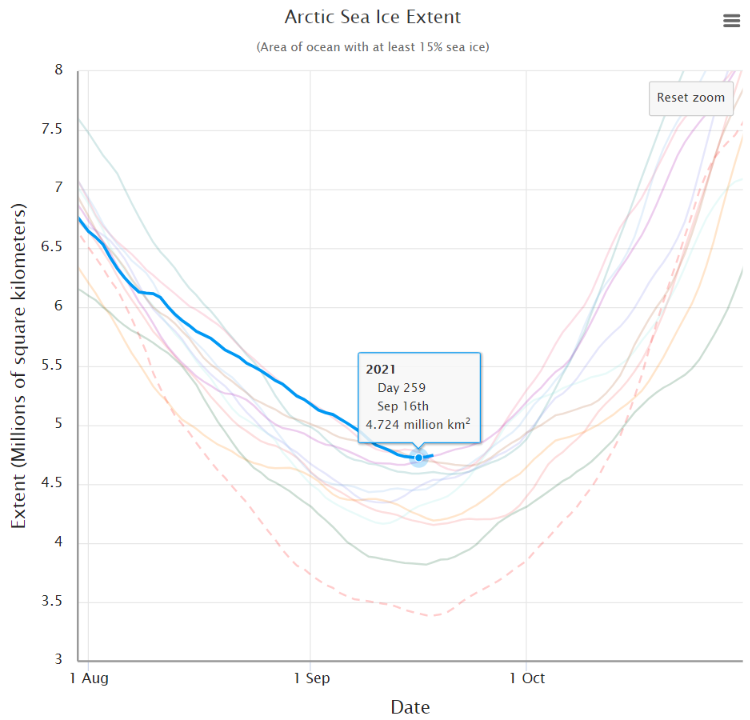
[Edit – September 19th]Barring any unanticipated surprises the NSIDC 5 day averaged Arctic sea ice minimum extent for 2021 was 4.72 million km2 on September 16th:
In a new development this year the ARCUS Sea Ice Prediction Network have just published their September outlook for the 2021 minimum Arctic sea ice extent. Here is the abstract:

September is not yet over of course, but it seems certain that the observed 2021 mean for the month will be significantly higher than the SIO median value of 4.39 million km2!
[Edit – September 23rd]In their usual somewhat hesitant fashion the NSIDC have now called the 2021 minimum:
On September 16, Arctic sea ice likely reached its annual minimum extent of 4.72 million square kilometers (1.82 million square miles). The 2021 minimum is the twelfth lowest in the nearly 43-year satellite record. The last 15 years are the lowest 15 sea ice extents in the satellite record. The amount of multi-year ice (ice that has survived at least one summer melt season), is one of the lowest levels in the ice age record, which began in 1984…
Please note that this is a preliminary announcement. Changing winds or late-season melt could still reduce the Arctic ice extent, as happened in 2005 and 2010. NSIDC scientists will release a full analysis of the Arctic melt season, and discuss the Antarctic winter sea ice growth, in early October.
Almost simultaneously Alek Petty and Linette Boisvert from NASA have published an overview of the 2021 melting season:
The stage for this year’s sea ice minimum was set last winter. The Arctic experienced an anomalous high pressure system and strong clockwise winds, driving the thickest, oldest sea ice of the Central Arctic into the Beaufort Sea, north of Alaska. Sea ice scientists were taking note.
Summer melt began in earnest in May, a month that also featured multiple cyclones entering the Arctic. This increased sea ice drift but also kept temperatures relatively low, limiting the amount of melt.
The extent and pace of melting increased significantly in June, which featured a predominant low-pressure system and temperatures that were a few degrees higher than average.
By the beginning of July, conditions were tracking very close to the record low set in 2012, but the rate of decline slowed considerably during the second half of the month. Cyclones entering the Arctic from Siberia generated counterclockwise winds and ice drifts. This counterclockwise ice circulation pattern generally reduces the amount of sea ice moving out of the Arctic through the Fram Strait, east of Greenland. This likely contributed to the record low summer sea ice conditions observed in the Greenland Sea.
This ice circulation pattern also increased ice export out of the Laptev Sea, off Siberia, helping create a new record low for early summer ice area in that region. The low pressure system also increased cloudiness over the Arctic. Clouds generally block incoming solar radiation, reducing sea ice melt, but they can also trap heat lost from the surface, so their impact on sea ice melt can be a mixed bag.
There is plenty more where that came from, at the link above. NASA have also produced this video:
Watch this space!
JAXA extent has breached the 5 million km² barrier:
Hi Jim,
Interesting times
Daily high arctic albedo warming potential anomaly a little lower this year. Very surprised and happy to see a new refreeze, even if only temporary.
14 days of melting left but very low today.
Hi Angech,
“Very low melting” according to JAXA perhaps, down to 4.97 mio km² on September 1st. However see also the latest “high resolution” update above.
The NSIDC’s 5 day averaged extent has also now broken the 5 million km² barrier:
4.98 million km² on September 7th to be precise. JAXA extent is now down to 4.75 million km².
And MASIE bounced up to 5.3 today and DMI has been wiggling up around 5.6-5.8 lately. So what is the right number with the right error bars? Or do we just get to pick our favorite that reinforces our hopes (high or low)? Jim, you seem to favor JAXA – is there a good analysis somewhere as to why that’s better/more reliable? I truly want to know. Has someone published a review of all the different approaches to this one metric?
There is no “right number” Taylor, and I don’t particularly favour JAXA. I do however recommend looking at a wide variety of data/metrics. If I have a “favourite” for concentration/extent it’s the University of Hamburg’s high resolution AMSR2 product. Not only because it uses a 3.125 km grid compared to the NSIDC’s 25 km, but also because (when Google allows!) Wipneus publishes a regional area/extent breakdown.
There’s a wide range of analyses of the pros and cons of assorted sensors and algorithms. Here’s one from 2014:
“Retrieval of Arctic Sea Ice Parameters by Satellite Passive Microwave Sensors: A Comparison of Eleven Sea Ice Concentration Algorithms”
and another preprint that’s only just been published:
“Satellite Passive Microwave Sea-Ice Concentration Data Set Inter-comparison using Landsat data“
Useful studies Jim, thanks. I note with interest that NSIDC seems to have bottomed at 4.9, DMI is showing signs of a rebound over the last few days, and MASIE is off its low as well. And it’s that time of year. When do you think you’ll be ready to call the minimum here? Who do you think will have the lowest min, and who the highest? Any prediction on the final spread (date/amount)?
Actually I already tentatively called the minimum yesterday, but Windows 10 decided it needed updating without me having saved the update. Fortunately WordPress auto-saved my words of wisdom!
https://GreatWhiteCon.info/2021/08/the-2021-arctic-sea-ice-minimum-extent/#Sep-15
JAXA extent is up again today, but the NSIDC’s 5 day average hasn’t turned the corner yet.
A minor correction: the Sea Ice Prediction Network (SIPN), through their Sea Ice Outlook (SIO), collects predictions for the September *mean* extent, not for the daily minimum. But it’s true that the predictions by this summer’s SIO contributors are looking mostly too low. In correspondence, Walt Meier of NSIDC (and SIPN) offered the following observations:
“One thing is that conditions really moderated after mid-July, which slowed ice loss. In early July, extent was at a record low for that time of year. So at least June and July Outlooks would probably come in rather low. In theory, August should be better and there is some improvement there, but still low. I think there are a couple possible reasons:
(1) People just carried through their June or July Outlooks – i.e., submitted the same value in August as earlier month, so no adaptation to changing conditions.
(2) Inertia in the methods – i.e., the methods are not sensitive enough to change fast enough to respond to the weather changes
(3) The most impactful weather changes occurred after August 1, so the methods would not include those changes.
My method – which simply extrapolates the rate of extent loss from the start of the month suggests #3 may be the biggest factor. You can see the big jump – 500,000 sq km – from August to September. Here are my Outlook values for September monthly, daily minimum:
Jun: 4.65, 4.53 million sq km
Jul: 4.42, 4.30
Aug: 4.50, 4.38
Sep: 5.00, 4.88
This seems to suggest (perhaps) a limitation of predictability when there are sudden changes in weather patterns.”
Thanks very much Larry,
I thought I’d made it clear that the SIPN numbers were for the month and not the daily minimum. I’ll go and double check forthwith….
Yup. Cut’n’paste error above the graphic, albeit correct below.
I was slightly surprised that more entries didn’t pick up on the change in the weather, even for the new September call. When would those have been submitted?
One thing to note about the SIO contributions is that there is the ability to “carry over” estimates from the previous month. This is the first year that the SIO has collected September Outlooks (i.e., based on conditions on 1 September). Given that this was new this year, it is an extra effort the additional month, and I suspect there were several such carry-over submissions that didn’t take into account the changing conditions during August.
Walt Meier
NSIDC
SIPN Leadership Team
Thanks Walt, Long time no speak!
Despite the passage of time I still find it necessary to point out to “skeptical” fellows (almost always it seems) the limitations of MASIE for long term comparisons on a regular basis.
I note that Nico Sun’s “amateur” entry fared reasonably well this year. What do you make of his Albedo-Warming Potential concept? Of course then you have come to a view about how much of that “potential” will ultimately be realised by mid September.