A selection of graphs, images and videos from the Northwest Passage and Canadian Arctic Archipelago.
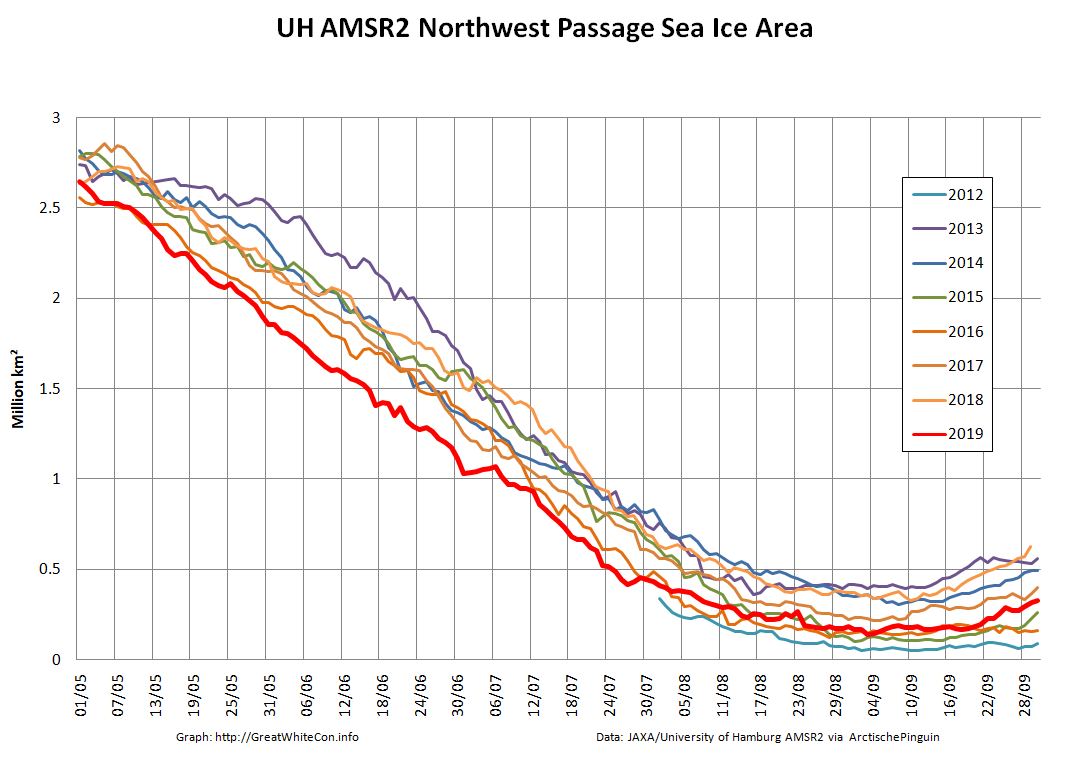
Northwest Passage Sea Ice Area
Northwest Passage Sea Ice Concentration
AMSR2 Canadian Arctic Archipelago sea ice concentration from the University of Bremen
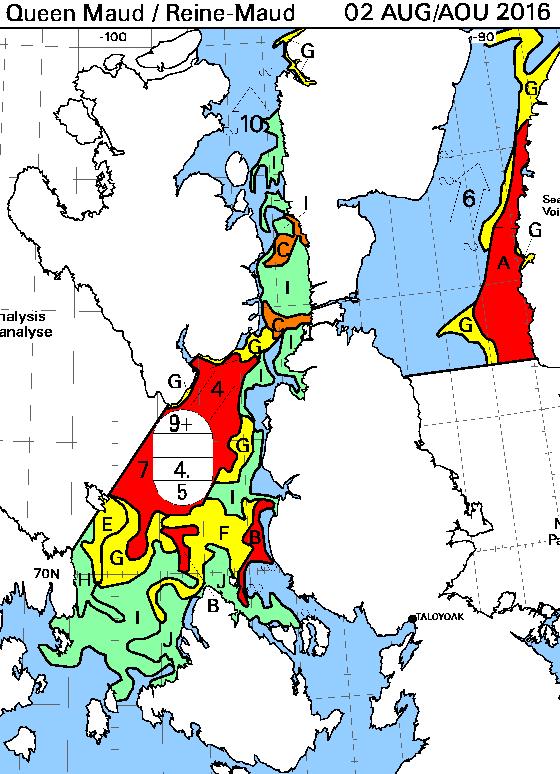
Canadian Arctic Archipelago Sea Ice Stage of Development
The colour scheme and “egg code” is explained here.
Canadian Ice Service sea ice stage of development on July 10th 2017NASA Worldview “true-color” image of Victoria Strait and Larsen Sound on July 10th 2017, derived from the MODIS sensor on the Terra satellite
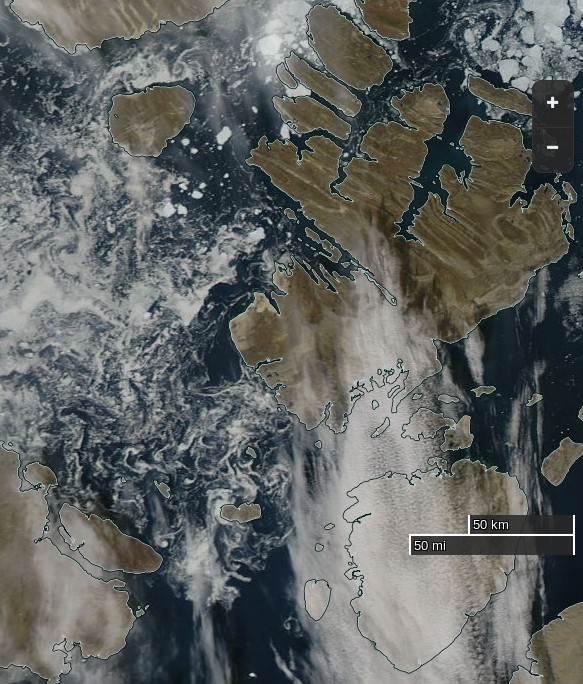
NASA Worldview “true-color” image of Larsen Sound on August 2nd 2016, derived from the MODIS sensor on the Aqua satelliteThe Canadian Ice Service sea ice concentration chart for the Queen Maud Gulf on August 2nd 2016
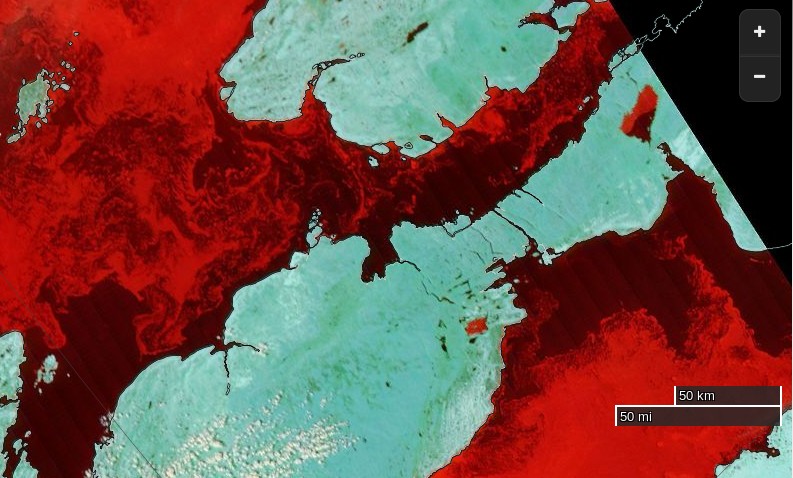
NASA Worldview “false-color” image of the Parry Channel on August 29th 2015, derived from bands 3, 6 and 7 of the MODIS sensor on the Aqua satelliteThe Canadian Ice Service sea ice concentration chart for the Parry Channel on August 29th 2015
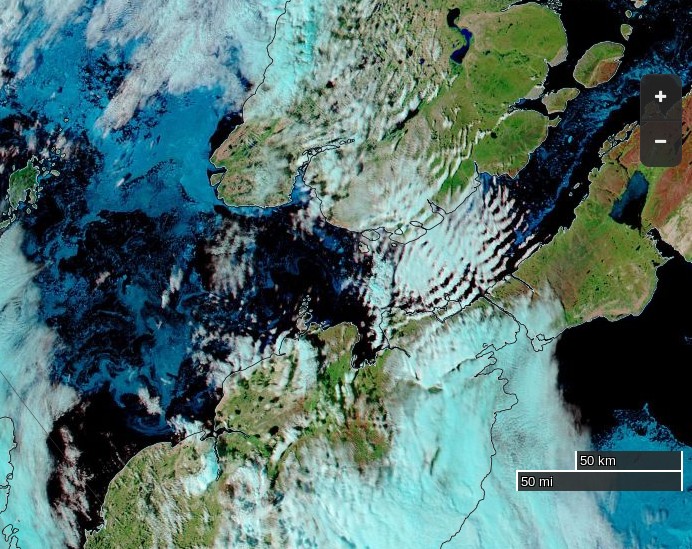
NASA Worldview “false-color” image of the Northwest Passage on August 13th 2015, derived from bands 7, 2 and 1 of the MODIS sensor on the Terra satellite
The Canadian Ice Service sea ice concentration chart for the Queen Maud Gulf on August 13th 2015
NASA Worldview “false-color” image of the Northwest Passage on August 12th 2015, derived from bands 7, 2 and 1 of the MODIS sensor on the Aqua satellite
Here are some animations of sea ice movement in the Canadian Arctic Archipelago from 2015 to date:
This website uses cookies to improve your experience. We'll assume you're ok with this, but you can opt-out if you wish. Cookie settingsACCEPT
Privacy & Cookies Policy
Privacy Overview
This website uses cookies to improve your experience while you navigate through the website. Out of these, the cookies that are categorized as necessary are stored on your browser as they are essential for the working of basic functionalities of the website. We also use third-party cookies that help us analyze and understand how you use this website. These cookies will be stored in your browser only with your consent. You also have the option to opt-out of these cookies. But opting out of some of these cookies may affect your browsing experience.
Necessary cookies are absolutely essential for the website to function properly. This category only includes cookies that ensures basic functionalities and security features of the website. These cookies do not store any personal information.
Any cookies that may not be particularly necessary for the website to function and is used specifically to collect user personal data via analytics, ads, other embedded contents are termed as non-necessary cookies. It is mandatory to procure user consent prior to running these cookies on your website.