As in previous years there is already a thread devoted to this year’s minimum extent. By way of a summary here are the end of August numbers for our favourite “high resolution” AMSR2 area and extent metrics:

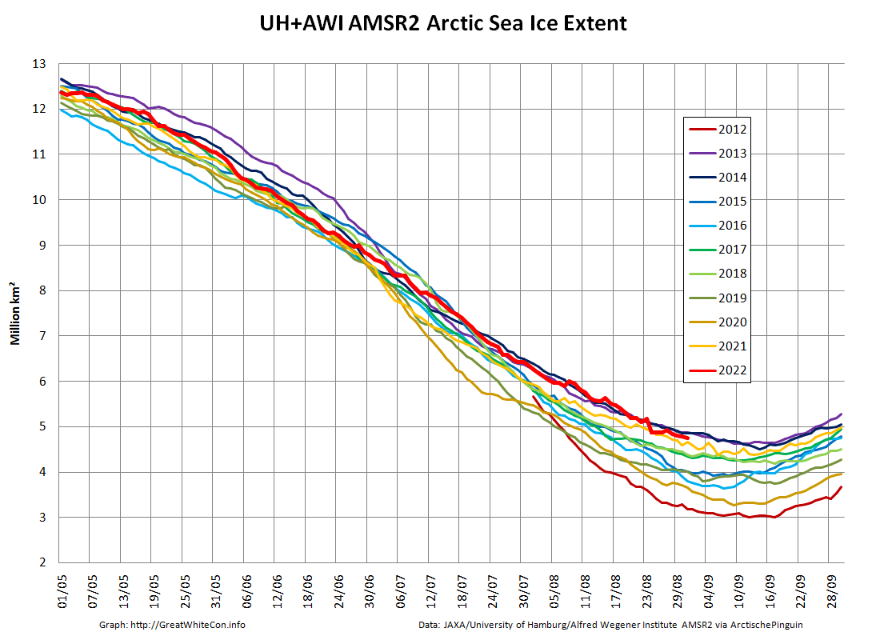
Extent is currently near the top of the range of the last 10 years.
We have now reached the stage of the “melting season” when “refreezing” has started in the Central Arctic but melting at the periphery is outpacing it. However the Canadian Ice Service stage of development charts now show the arrival of new ice in the high latitudes of the Canadian Arctic Archipelago:
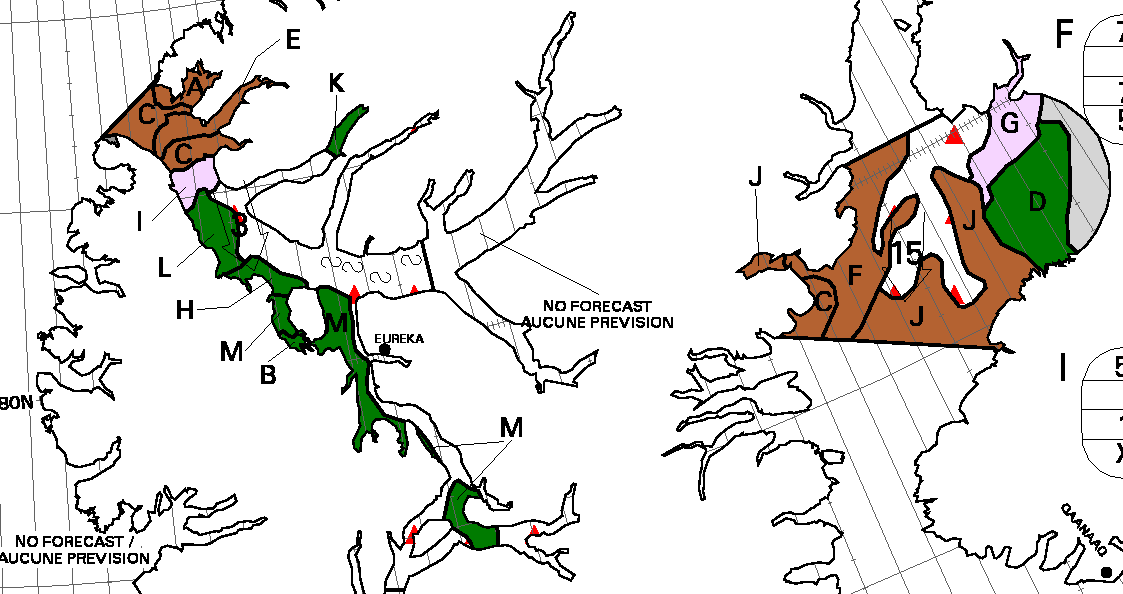
Note the areas coloured pink and labelled G and I. It also seems likely that the large areas of open water near the North Pole will start refreezing soon, if they have not already done so:
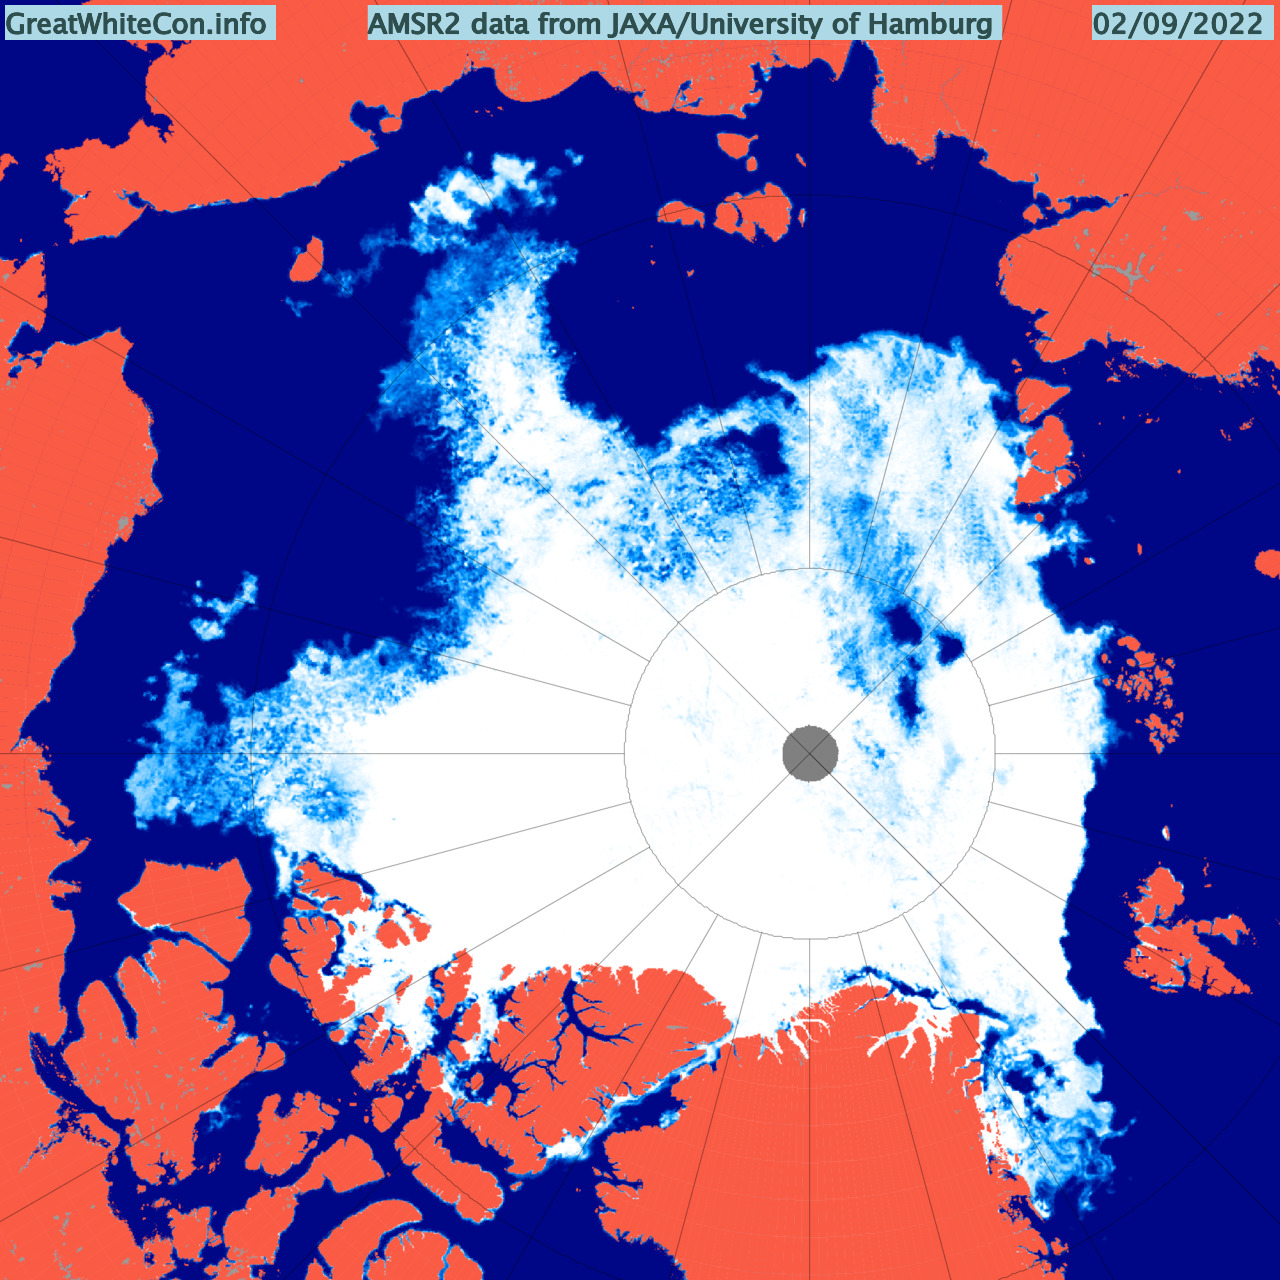
Further south in the CAA the deep water route through the Northwest Passage via the Parry Channel looks as though it is now wide open, on the AMSR2 concentration map at least! The CIS have yet to produce daily ice charts of McClure Strait, so we await the next weekly charts with great interest.
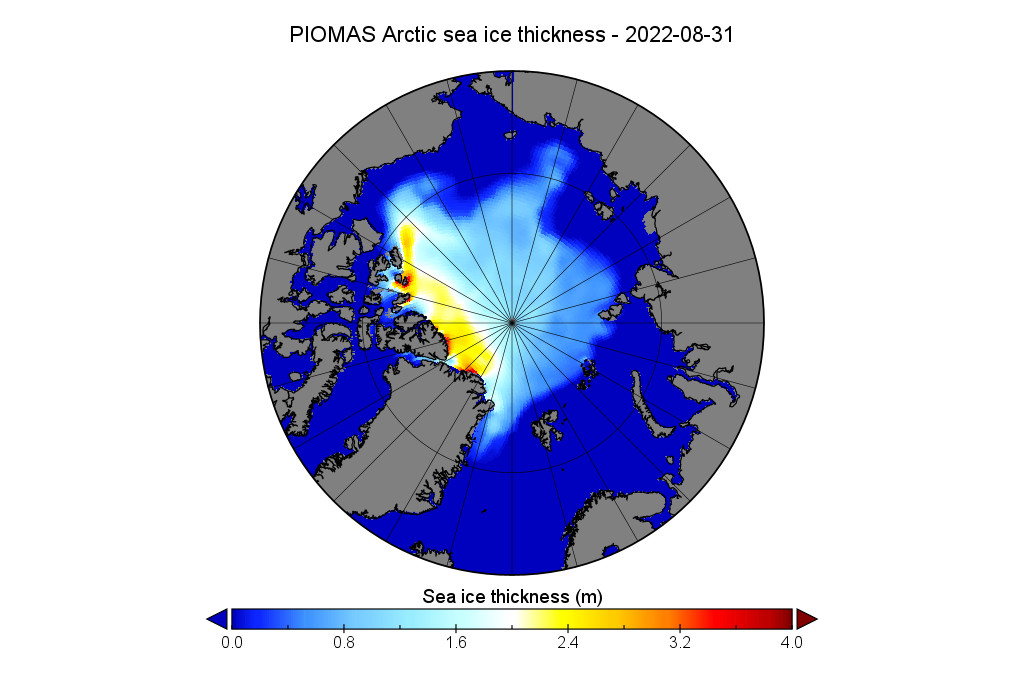
[Edit – September 5th]The August PIOMAS gridded thickness data has been released so here is the “unofficial” Arctic sea ice thickness map for August 31st:
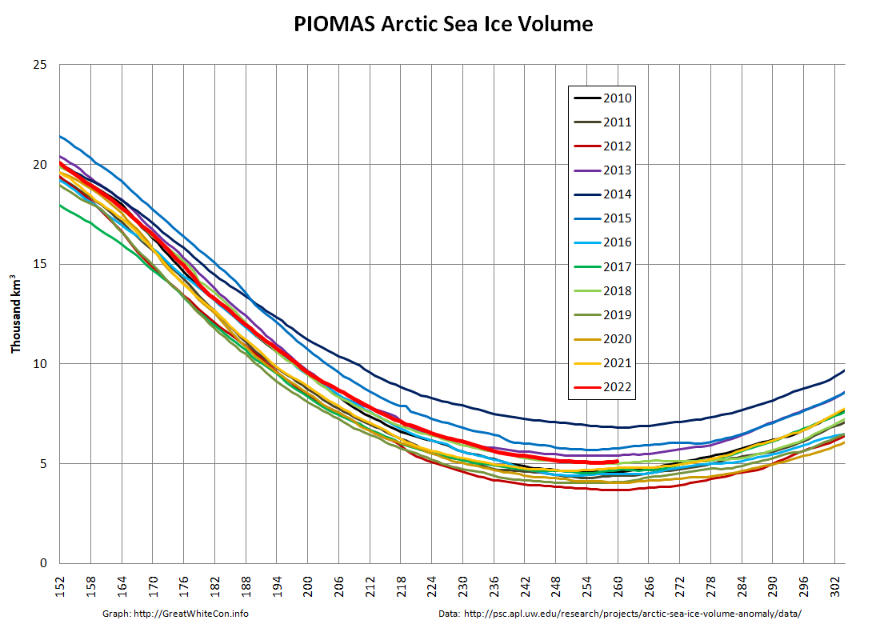
Here too is the daily volume graph:
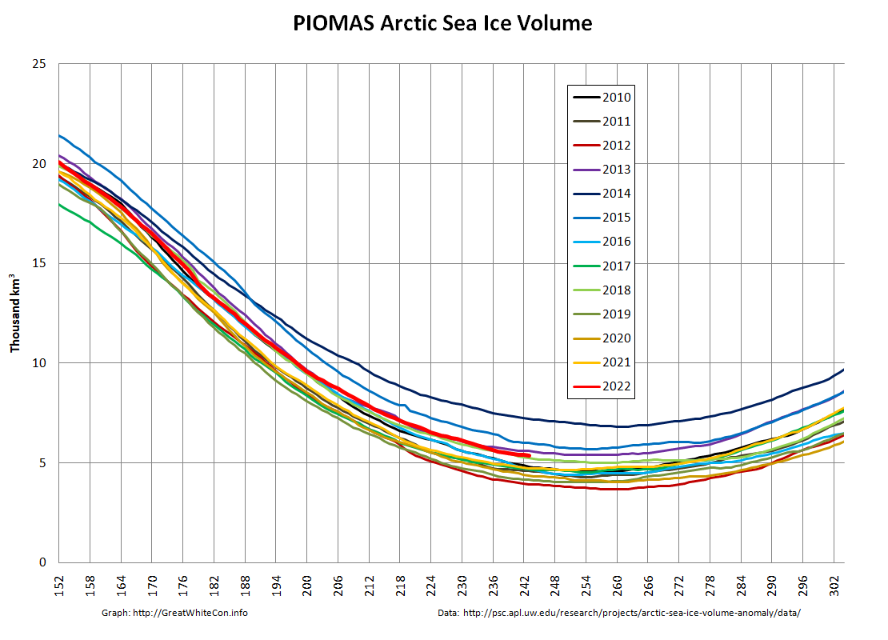
On August 31st volume was 5.367 km3, now 10th lowest in the satellite era.
[Edit – September 14th]The remains of Typhoon Merbok is forecast to bring some late melting season excitement to the Chukchi Sea by the weekend:

In other news a most interesting new paper has just been published:
“A year-round satellite sea-ice thickness record from CryoSat-2“
The paper is paywalled, but an online version can be viewed here:
Satellite observations of sea-ice thickness are currently unavailable during the crucial melt period from May to September, when they would be most valuable for applications such as seasonal forecasting6, owing to major challenges in the processing of altimetry data7. Here we use deep learning and numerical simulations of the CryoSat-2 radar altimeter response to overcome these challenges and generate a pan-Arctic sea-ice thickness dataset for the Arctic melt period.
Year-round Arctic sea ice thickness data from CryoSat-2 is now available for 2010-2020 via the British Antarctic Survey web site.
Now I cannot help but wonder when the summer 2022 Cryosat-2 Arctic sea ice thickness data will be released!
[Edit – September 16th]Merbok is undoubtedly going to give the Bering Sea coast of Alaska a hammering:
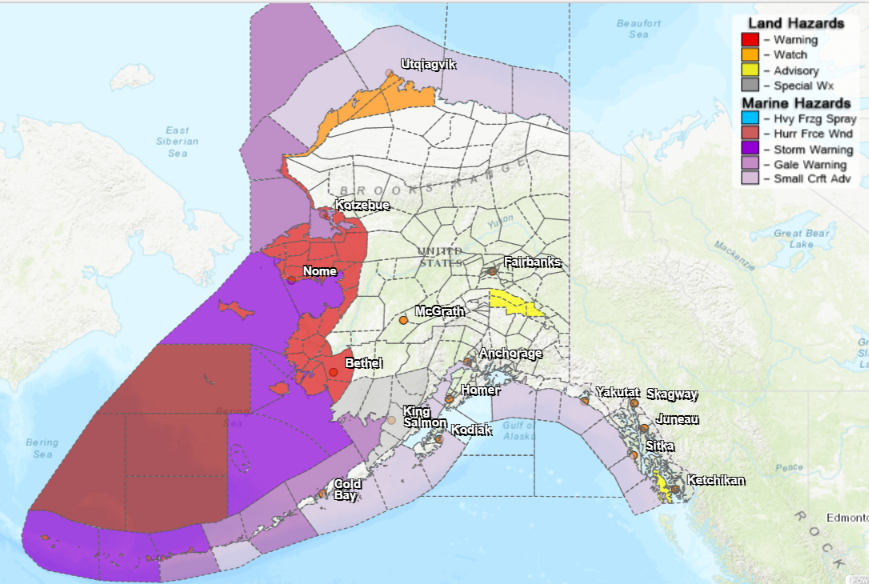
Here’s the current NWS flood warning for Nome:
* WHAT...Significant coastal flooding expected.

* WHERE...Southern Seward Peninsula Coast.

* WHEN...From 6 PM Friday to 10 AM AKDT Sunday.

* IMPACTS...Numerous roads may be closed. Low lying property
including homes, businesses, the airport, and other critical
infrastructure will be inundated. Some shoreline erosion will
occur.

* ADDITIONAL DETAILS...In Nome water levels will be 8 to 11 feet
above the normal high tide line. Areas near the mouth of the
Snake river, and upstream, will also be inundated as water
backs up in the river due to the storm surge. The Belmont
Subdivision will be significantly impacted by flooding, as
will the Airport Terminal, and some areas of the runway may be
flooded. Streets on the west side of town may also be flooded.
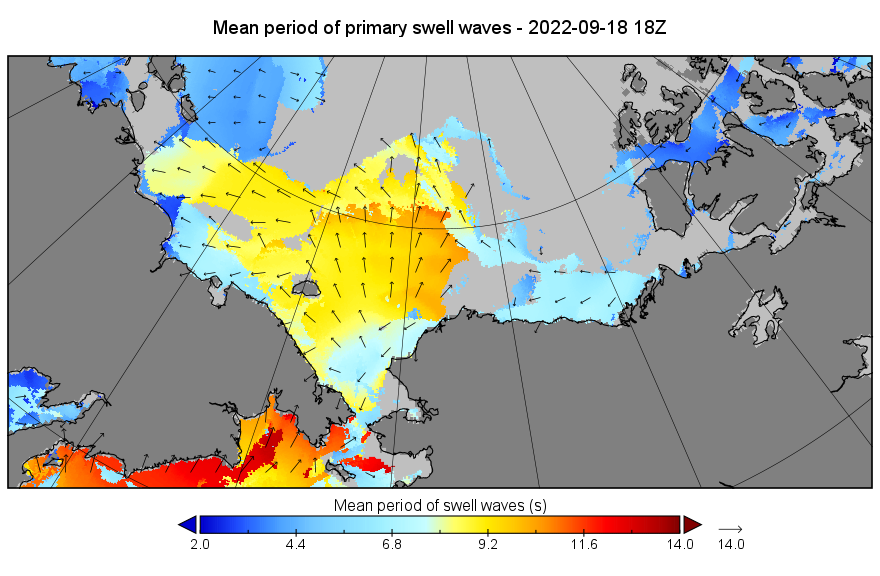
But what of further north in the Chukchi Sea? The GFS Wave forecast currently suggests a 10 second, 3 meter plus swell heading for the ice edge on Sunday:

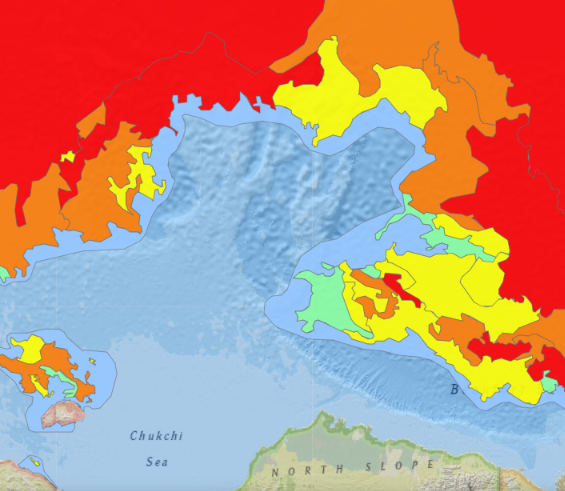
Here’s the current NWS map of sea ice concentration in the Chukchi Sea and thereabouts:
It will be interesting to see how it looks in a few days time.
[Edit – September 18th]The centre of ex Typhoon Merbok is now north of the Arctic Circle, having passed over the Bering Strait last night UTC:

The Earth’s climate is currently in the midst of a “triple dip” La Niña, but the sea surface temperature anomaly map shows that the North Pacific is currently anomalously warm, which perhaps explains how a typhoon can find enough fuel to reach the Arctic:
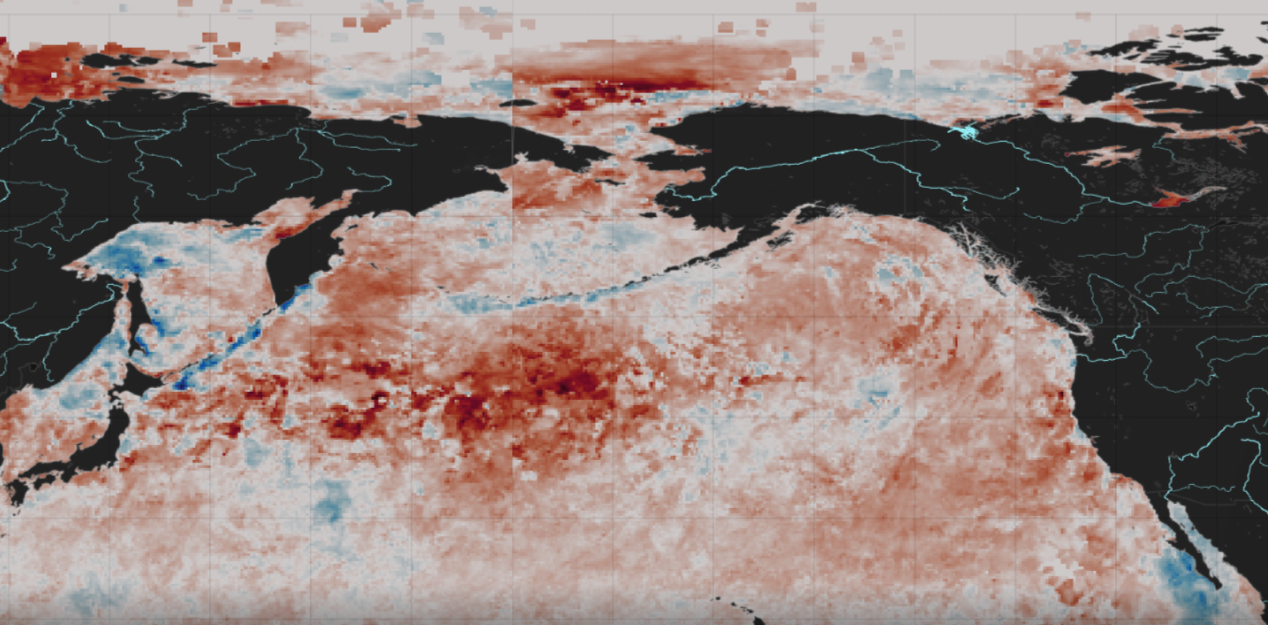
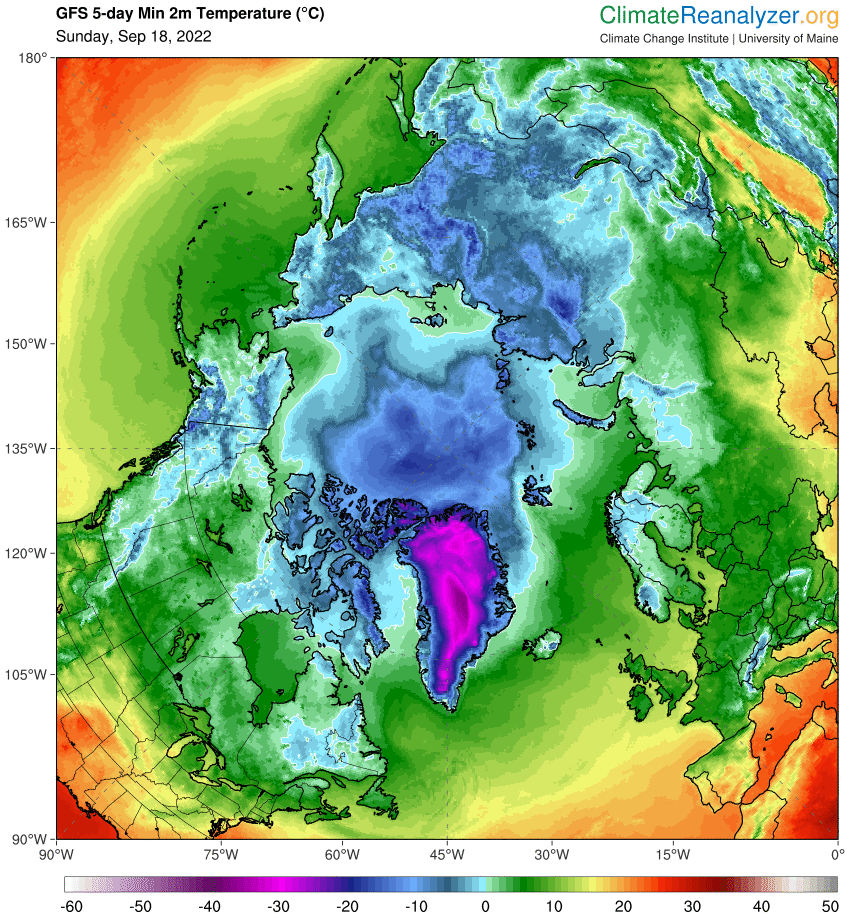
Sea temperatures in the Chukchi Sea are also anomalously warm at the moment, and now look set to stay that way for some time. Here’s the GFS forecast Arctic minimum air temperature map for the next 5 days:
Here’s an animation of the last few days sea ice concentration on the Pacific side of the Central Arctic:
[Click to animate. Updated to September 20th]
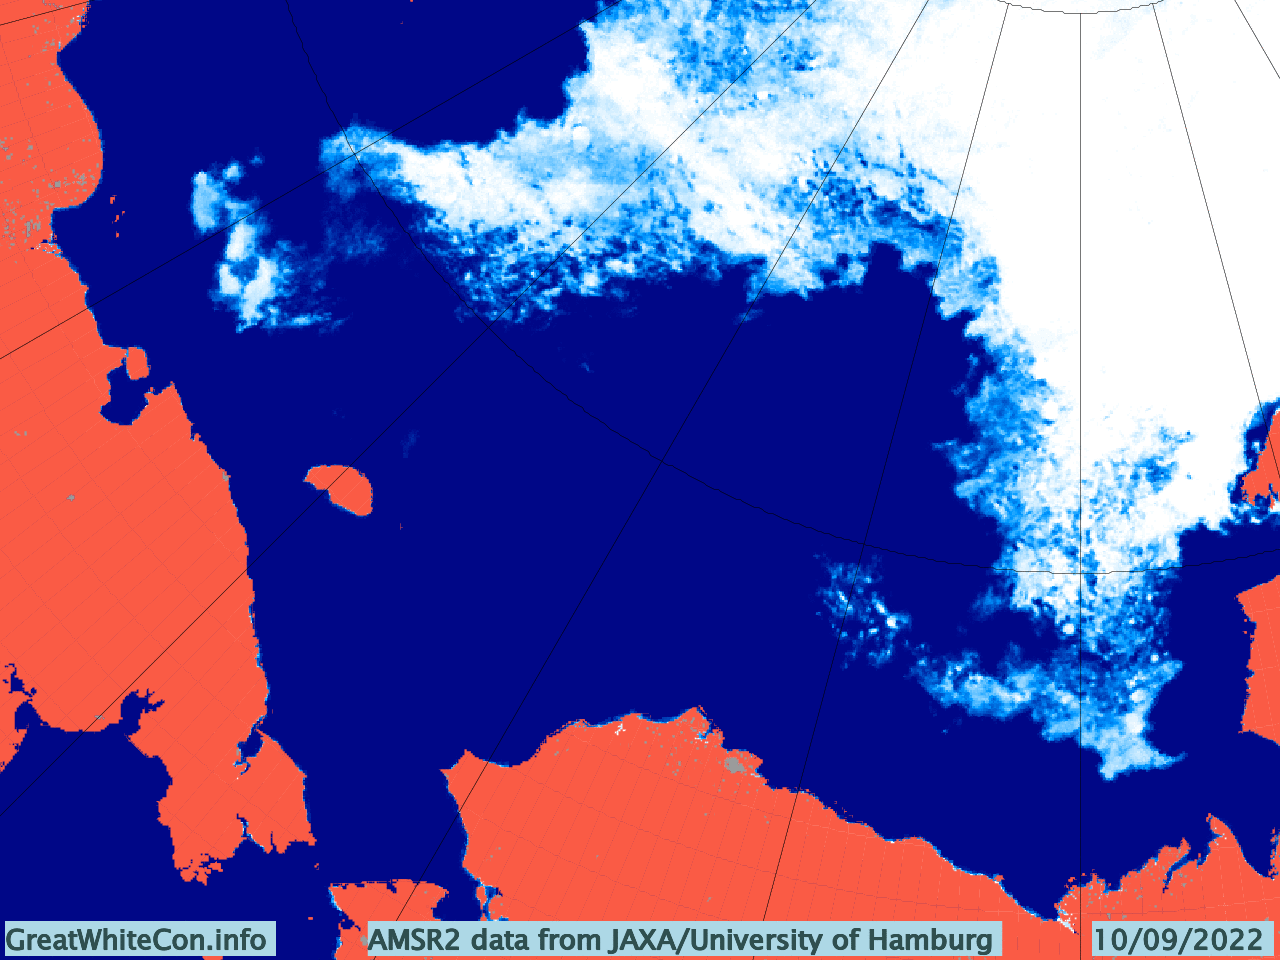
There is enough open water in the Chukchi and East Siberian Seas to allow a significant ocean swell to develop. JAXA Arctic sea extent showed an extremely modest uptick yesterday, but will that trend continue?
[Edit – September 19th]What remains of Typhoon Merbok is still spinning strongly over the Chukchi Sea:
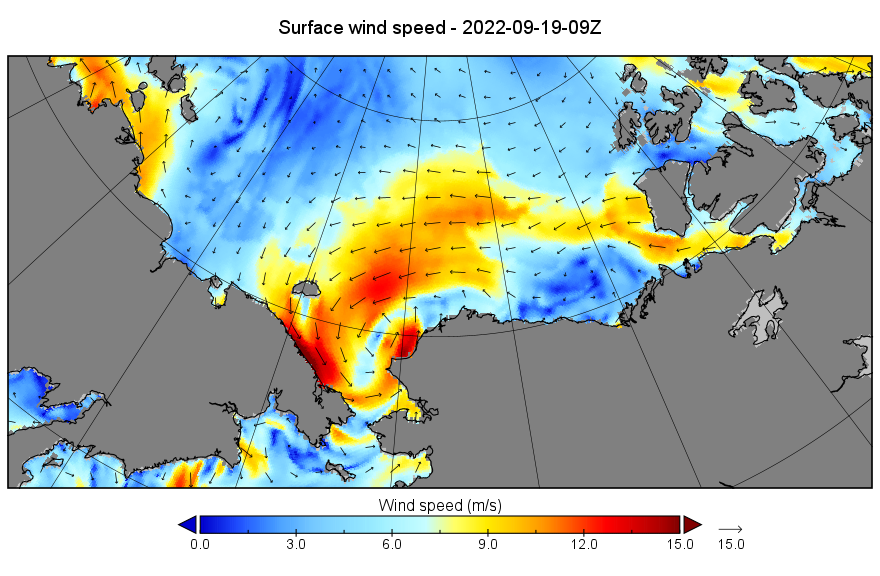
The storm has generated plenty of wind waves:
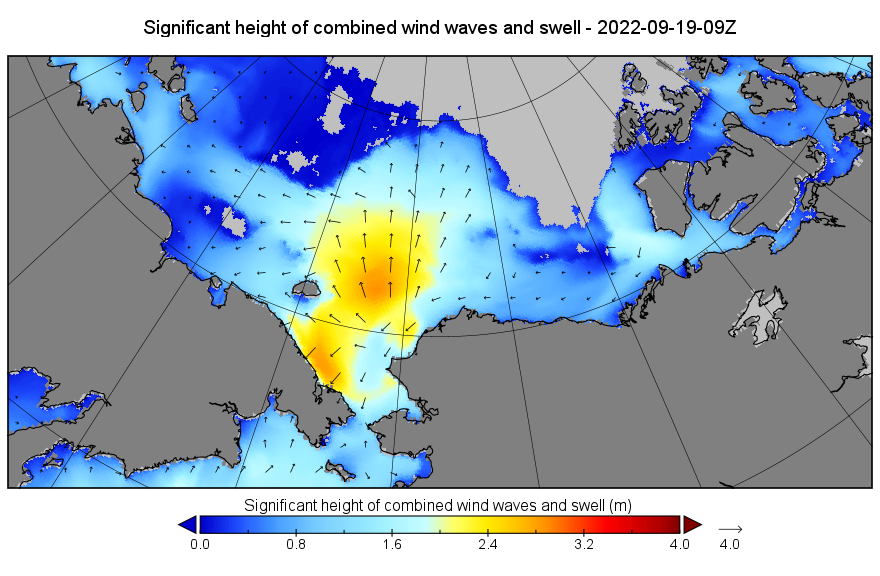
There is also enough open water on the Pacific side of the Arctic Ocean to allow a modest long distance swell to be generated:
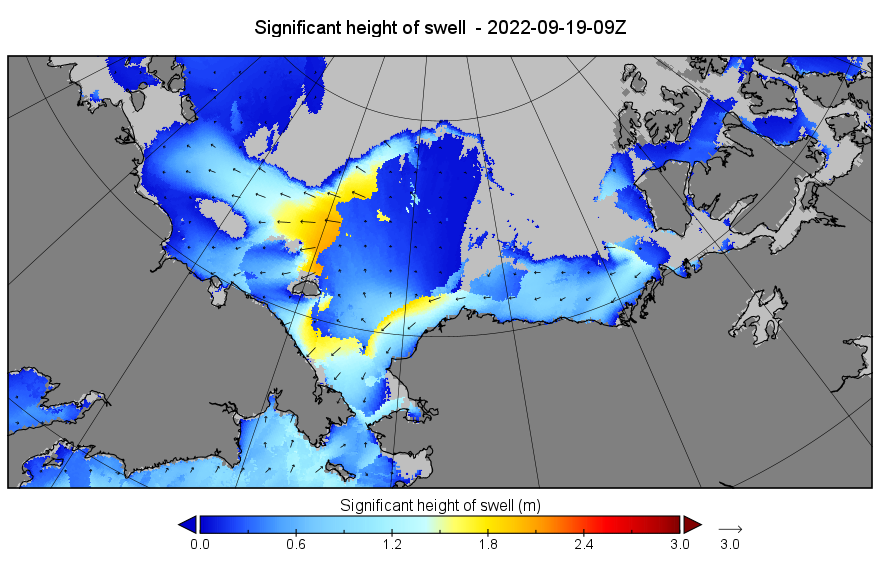

It is currently heading in the direction of the arm of sea ice extending down into the East Siberian Sea, so I for one will be keeping a close eye on that area for the next few days.
[Edit – September 20th]The PIOMAS mid September gridded thickness data has been released so here is the “unofficial” Arctic sea ice thickness map for September 17th:
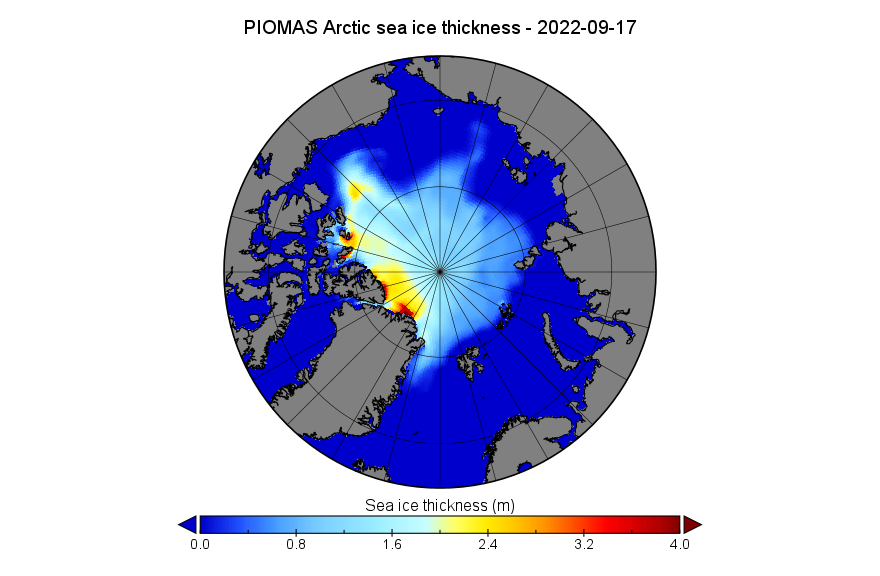
The volume graph is now rising, so barring any unanticipated surprises the (unofficial!) 2022 volume minimum was 5,060 km³ on September 13th:
Further news is now available on the October open thread.
Interesting. Your AMSR2 concentration map shows no ice in Victoria Strait and none within a 100 km of the north Alaska coast, but our friends at DMI show considerable ice in Victoria Strait and some on the Alaska coast on their volume map. Is that a function of different resolution or a different metric, or some other factor? Otherwise they are flatly in disagreement. I would think someone trying to pass the Strait or get to Anchorage from the east would know the truth…
AMSR2 does miss some ice visible on the official charts. Here’s the CIS chart for Victoria Strait:
The total volume is negligible. There is also plenty of space along the Alaska coast:
See the Northwest Passage thread for details of numerous vessels of assorted shapes and sizes that have made it from the Amundsen Gulf to Point Barrow or vice versa without icebreaker assistance.
If I had to guess,.. I’d say it’ll finish around the same ballpark as 2018
Unexpected Ice…
Where?
NASA: “Unexpected ice..Sea ice in the Southern Ocean defies predictions…If Earth’s temperatures are getting warmer and sea ice in the Arctic has been shrinking fast, why then is sea ice in the Antarctic slowly INCREASING?”
See article Unexpected Ice. Sea ice in the Southern Ocean defies predictions. by Natasha Vizcarra. earthdata [dot] nasa [dot] gov
“Ship of Fools” got STUCK in THICK ICE-The Caitilin Expedition-ABANDONED-“colder than expected” Also “Ship of Fools II-“Curtailed”—“UNEXPECTED ICE”–Amazing how ICE in ARCTIC KEEPS getting in way of GLOBAL WARMING !!!
As others have suggested, you seem to be several years behind the Antarctic curve?
FYI: https://www.carbonbrief.org/guest-post-deciphering-the-rise-and-fall-of-antarctic-sea-ice-extent/
Dear Mr Hunt.
That was really just a comment, i meant to be funny a little but not serious with ‘unexpected ice’.
Why would ice be unexpected? Personally, there is clearly a control knob in the Sky that is the Sun. There is no god and no free will. We all try to fulfill necessity, be physiological or intellectual, as said Schrodinger, a biologist himself with all credits.
Humans that think they are not automatons, seem really ridiculous almost…
If there is no God who made the sun?
We’re here to discuss sea ice, not philosophy. Or religion!
Please, lets be adults here. Religion is like myth , right? Anyways, I adore the Sun, it seems there is too much ice in Greenland
PIOMAS just raised its hand to chime into the conversation. They posted an August update (July conditions) without any notation as to why there was never a July update for June. Nothing particularly unexpected as far as I can see. Will be interested in your take.
Looking a bit further south, by this time last year, Antarctic ice had begun its decline from a significantly high peak, but this year, per NSIDC. It’s still chugging along, albeit not yet in the decile range. If current trends continue, it’s possible we could have an ‘average’ or slightly below average extent year. I personally have no prediction to offer.
JAXA Antarctica sea ice extent was lowest in the satellite era for 65 days this year, it has increased more than average since the start of September though.
In contrast to the Arctic this year.
Per NSIDC, Antarctic sea ice extent has just reached the interdecile range of the base average for the first time this season. Extent gain this month is much greater than the average gain rate. Could we see a near-normal peak this year?
Antarctica is a continent surrounded by water.
Not even Greenland is at the pole and it’s 6 times bigger. It will never melt. When it had trees it was a different landmass with equatorial waters flowing around it.
The latest NWS Merbok storm surge forecast:
Ex Typhoon Merbok is currently creating some huge waves in the central Bering Sea.
Here’s some graphs of recent conditions, recorded by the National Data Buoy Center’s wave buoy 46035:
Waves 16 meters high with a period of 19 seconds are not to be trifled with!
Merbok’s storm surge has reached Nome:
Also there’s already a noticeable surge at Red Dog Dock on the Chukchi Sea coast of Alaska:
I assume if this storm hit the ice pack it would be too late to cause major extent loss like 2012 or 2016?
It looks as though some swell will “hit the ice pack”. There might be a modest extent loss, and a delayed minimum as a consequence. However I don’t foresee another 2016 or 2020, and certainly not a 2012!
The storm surge on the Bering Sea coast of Alaska appears to have peaked:
Red Dog Dock on the Chukchi Sea coast is still rising, albeit at a much lower level:
Meanwhile the the Japanese oceanographic research vessel Mirai is fearlessly heading into the heart of the storm whilst assorted other vessels still seek shelter:
The centre of ex Typhoon Merbok has managed to thread the Bering Strait needle and is entering the Chukchi Sea:
SV Draco reached the Aleutian Islands just in time to avoid the worst of weather in the Bering Sea.
Earlier today a flood warning was issued for the Chukchi Sea coast of Alaska:
...COASTAL FLOOD WARNING NOW IN EFFECT UNTIL NOON AKDT MONDAY...* WHAT...Significant coastal flooding expected.
* WHERE...Chukchi Sea Coast.
* WHEN...Until noon AKDT Monday.
* IMPACTS...Low lying areas could flood. Some critical infrastructure may be inundated. Some shoreline erosion may occur.
* ADDITIONAL DETAILS...Water levels will slowly fall through Noon Monday as the low weakens near Cape Lisburne.
However the storm surge at Red Dog Dock is subsiding:
On the other side of the Bering Strait the cruise ship L’Austral is on the move once again, but Silver Wind remains in Port Clarence Bay:
As expected (see other post on Minimum), there was a record-setting spike in SMB for Greenland on the 23rd (8 gigatons). Likely this is moisture driven northward by Fiona, which is making its way as a ‘post-tropical Storm’ up the west coast of Greenland in the next few days. Will be interesting to see if the SMB increases continue at this pace…
And just exceeded (10 gigatons) on the 24th. SMB year for Greenland off to a roaring start! May close the month in record territory.
But what of the total mass balance?
I’m assuming you are asking how much ice is calved off glaciers, etc. since SMB is net of melt and runoff. I don’t think DMI tracks that, but if you have a source, I would be happy to know about it. Last (ice) year, the SMB increase was over 450GT, so for there to have been a net decrease in total ice, Greenland would have had to shed that much, I.e. 450 cubic kilometers of ice. That’s a lot of ice…
DMI does track it. See:
http://polarportal.dk/en/greenland/mass-and-height-change/
However the graph hasn’t been updated for 2022 as yet.
My bad, Jim. Thanks for the link. However, it will be good to see the Grace-2 numbers for this past year. To keep up with the roughly -200 GT/year, Greandland would have had to shed 650GT from glaciers. Again, a lot of ice…
You say PIOMAS ice volume is 20th lowest on record but why not say Arctic ice volume has been about the same since 2012
Wrong image!
However the NASA ice extent graphic shows that since extent reached the lowest ever recorded in 2012, ice extent has been trending upwards.
Here is the piomas record showing that volume has remained the same since 2012
Hi Peter,
Something seems to be adversely affecting your eyesight?
At one point I did say “now 10th lowest in the satellite era.”
Thank you for your first graphic, which according to my ageing eyes states:
“Rate of change -12.6 percent per decade”
Your second one states:
“Anomaly Trend -3.0 +/- 1.0 (1000 km³ / decade)”
Best wishes for a full recovery,
Jim
Jim, you’re being factious. You’re reading the long-term trend and Peter’s referencing the shorter term trend (signaling a trend reversal? A pause before continuing down?). Who knows for sure, that’s the point. I could (with a little research) cite the trend since the end of the Younger Dryas, but I’m not sure what that would really prove. I think you’re better than to take such a cheap shot at a poster…
Peter is filling the comment section with tired “skeptical” tropes that look like they’ve been lifted straight out of “Steve Goddard’s” echo chamber.
I have too many other things to do to argue that toss at the moment:
Here’s my Judy Curry impersonation:
https://twitter.com/jim_hunt/status/1574795623995514884
1. PIOMAS Arctic ice volume has remained about the same since 2012.
2. Since 2012 Arctic ice extent has been trending upwards.
My eyesight is fine
So why did your brain think a ‘1’ looked like a ‘2’?
If you keep coming out with these stale “skeptical” tropes you will find yourself back in moderation.
Perhaps try reading the commentary here? FYI:
https://GreatWhiteCon.info/2022/09/the-2022-arctic-sea-ice-minimum-extent/#comment-642253
I seem to remember reading somewhere, the 2016 annual average extent was lower than that of 2012.
2020 was a bit lower again than 2016
You can’t pick trends versus a single year.. you pick trends from an average of 30 years..
Where did you go to school?
From OSISAF….I think this is MASIE
Seems not much has changed since 2006
Peter – Please desist from this nonsense.
Try watching this illuminating video instead:
A lot has changed since 2006 Peter.
Please do your due diligence.
Or else.
From wiki….Average Arctic ice has decreased from about 11.5 million km2 to about 10 million km2 in 42 years which is under 3%/decade.
“Arctic ice” is 3 dimensional Peter.
Jim, I’m not giving an opinion, I am just showing that Arctic ice extent average has only reduced by about 12% over 40 years, if it is wrong please correct me.
For 3 dimensional information the PIOMAS graph above shows that ice volume has remained about the same since 2012. Once again this is not my opinion and if it is misleading please let me know.
I am no expert on these matters and just seek the truth.
Once again, read the “Slow Transition” stuff, Bitz & Roe op cit
I read the Bitz and Roe paper and couldn’t find anything about “slow transition”
Could you briefly explain what it means?
That when most of the multi-year ice in the Arctic has melted away the rate of decline of both volume and extent will slow down. For a while!
Quoting the abstract from that paper:
Arctic sea ice average extent has reduced from 12 to 10 million km2 in 43 years which has followed temperature rise.
Global temperature has plateaued since 2016 (after El Niño) and so has ice extent so I can’t really understand the significance of the “slow transition” effect.
So you know more about this stuff than Cecilia Bitz?
Thanks for posting Bitz & Roe, Jim. Other postulated negative feedbacks include the significant loss of heat when there is open water after a low-ice Summer. Nature has plenty of equilibrium-seeking feedbacks, or we’d have run off the rails long ago.
However, an observation. This paper must have come as quite a shock to the good professor Wadhams. He seemed convinced that Arctic Ice was on a one-way trip to oblivion, and some people used that belief to scare other people. Hopefully cooler heads will prevail (and publish!)
Is that in summer or winter?
I wonder how this happens? Sounds interesting!
Wadhams had repeatedly predicted the demise of summer Arctic ice since about 2007 but after every failed production he reissues the warning with an updated timeframe.
You keep coming up with these “skeptical” talking points Peter! Why is that?
The other Peter (Wadhams) is way outside the mainstream of Arctic sea ice scientists. See for example:
https://GreatWhiteCon.info/2015/07/is-time-running-out-for-arctic-sea-ice/
Jim,
You belittle Tony Heller but following are a list of newspaper clippings he assembled that show Arctic demise hysteria was rampant in the early 2000’s.
Can you discredit any of them?
Once again, since 1979 average Arctic ice extent has only diminished by about 15% and has been trending slightly upwards since 2012, the year of lowest extent.
Arctic ice volume has not decreased since 2012 and RSS, UAH, hadcruts, DMI and others show that Arctic temperature has remained about the same since 2016.
These are all easily verified facts but you dismiss me as a denier for daring to quote facts while you can only refer to opinions of Arctic demise.
I am a sceptic with an open mind and engaged with you to see if you could show me something that indicates the Arctic is in peril, but you haven’t.
Scientists have shown that 1000 years ago the Vikings cultivated barley in southern Greenland on ground that today is permafrost so Arctic must have been far smaller than today for at Least 200 years.
But you have called me a denier and threatened me with moderation and refer to opinions, not the actual data.
Engaging with you just strengthened my opinion that the who,e issue is just a great white con.
Cheers,
Peter
[Link to climate change denial echo chamber redacted – Mod]
Peter,
There you go again!
I’ve refuted Mr. Heller’s blatherings numerous times over the years. Your due diligence would seem to leave an awful lot to be desired?
Here you go:
https://GreatWhiteCon.info/tag/tony-heller/
You also appear to have no conception of the significance of the title of this web site?
Thanks for the heads up Peter.
I’ve just written an entire article especially for you! Please see:
https://GreatWhiteCon.info/2022/10/rewriting-the-arctic/