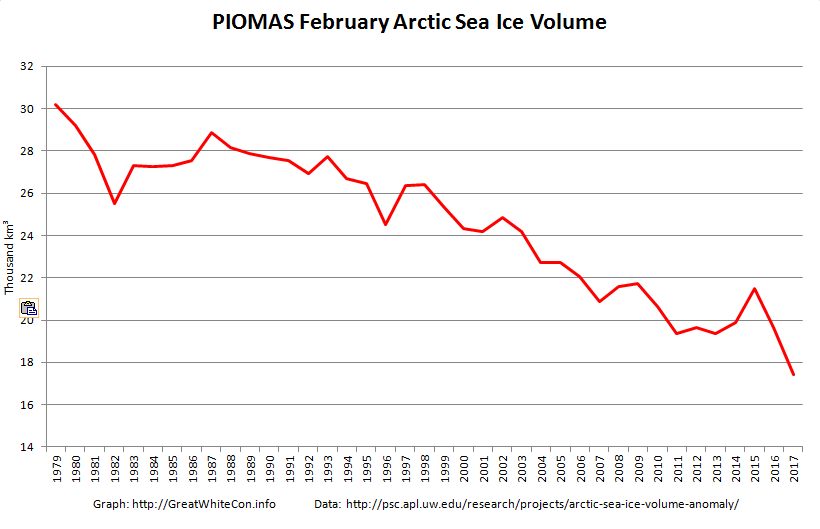
The February 2017 PIOMAS Arctic sea ice volume numbers are out. It’s no longer surprising to report that they are the lowest ever for the month of February in records going back to 1979:
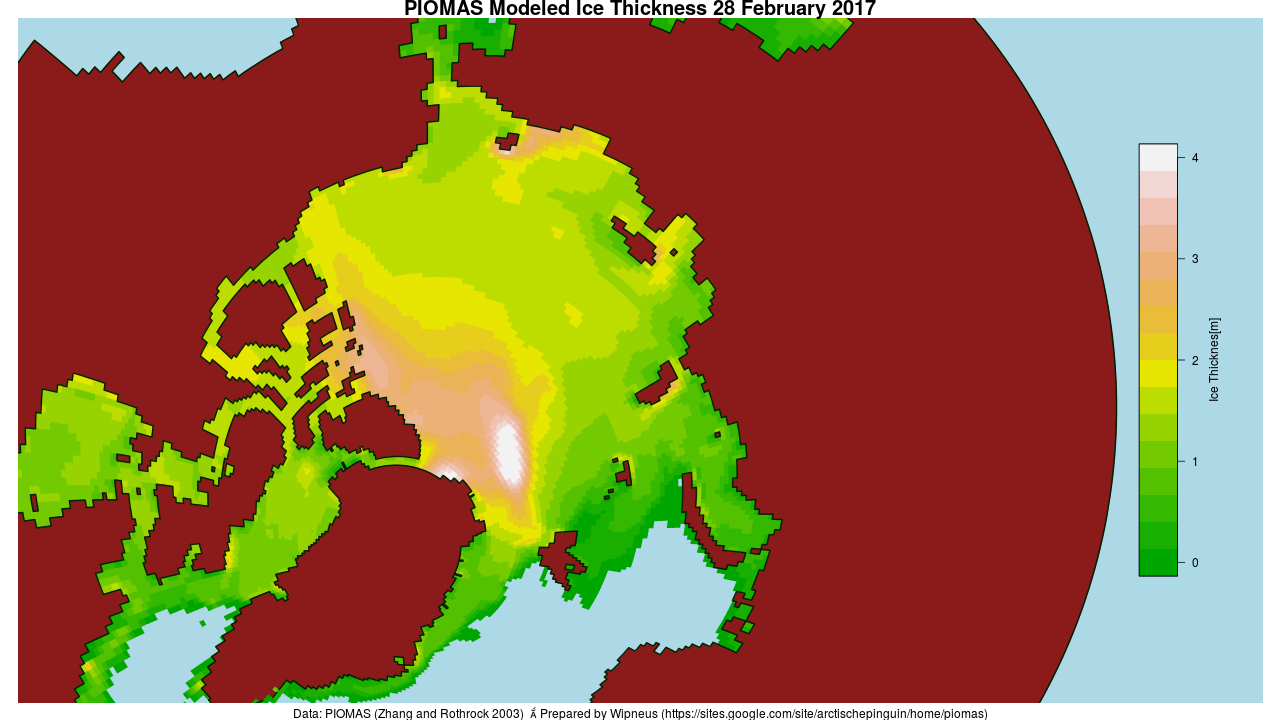
Here’s the PIOMAS gridded thickness map for February 28th:
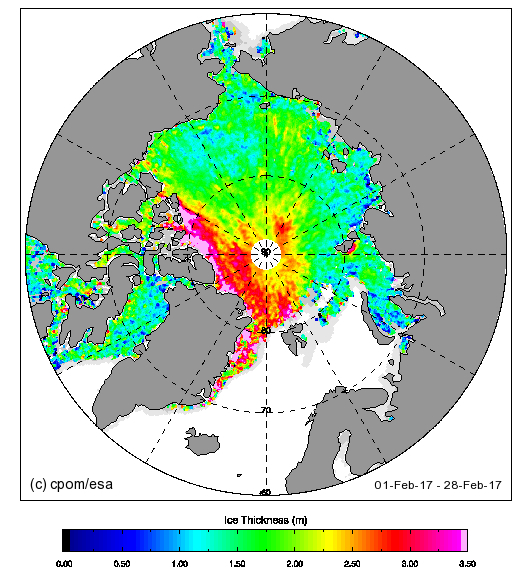
whilst here’s the latest CryoSat-2 thickness map:
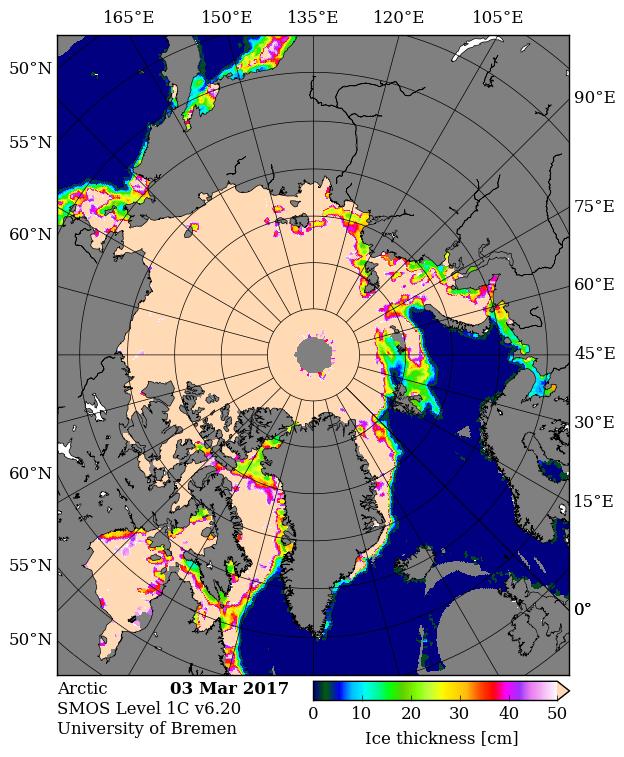
and here’s the latest SMOS thickness map from the University of Bremen:
Lars Kaleschke suggests via Twitter this revealing SMOS thickness animation:
@GreatWhiteCon If you want to quantify the recent dramatic #Arctic sea ice decay with SMOS, better use this data pic.twitter.com/UTgDzYWEV7
— Lars Kaleschke (@seaice_de) March 4, 2017
There does seem to be a small patch of slightly thicker ice in the East Siberian Sea off Chaunskaya Bay, but there’s still a much larger area of sub 0.5 meter thick ice in the Laptev and Kara Seas.
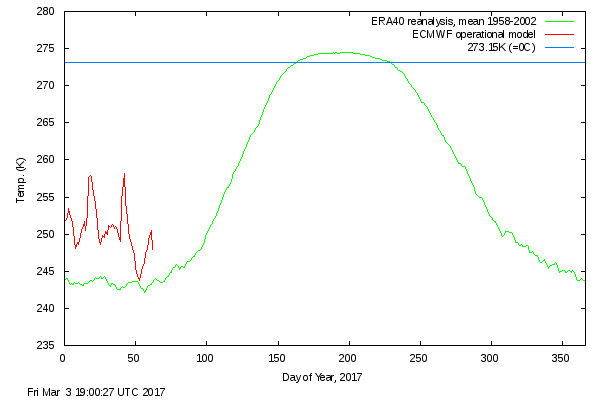
The Danish Meteorological Institute’s temperatures for the “Arctic area north of the 80th northern parallel” graph shows somewhat more “normal” readings in February 2017, but still without falling below the ERA40 climatology this year or in 2016:
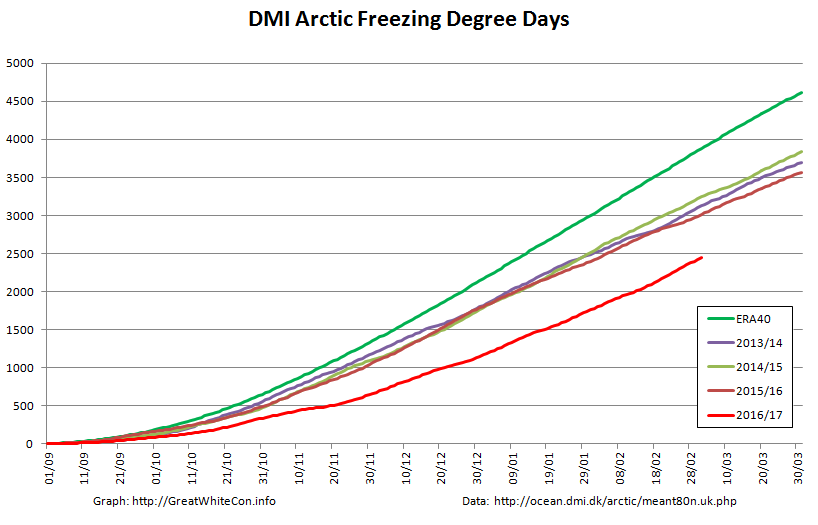
The graph of cumulative Freezing Degree Days (FDD for short) is still far below all previous years in DMI’s records going back to 1958:
Finally, for the moment at least, here’s the high resolution AMSR2 Arctic sea ice area and extent:
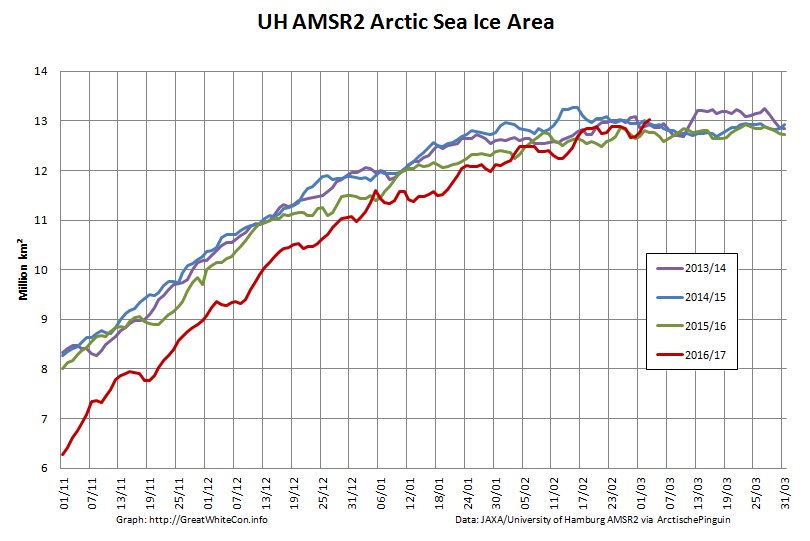
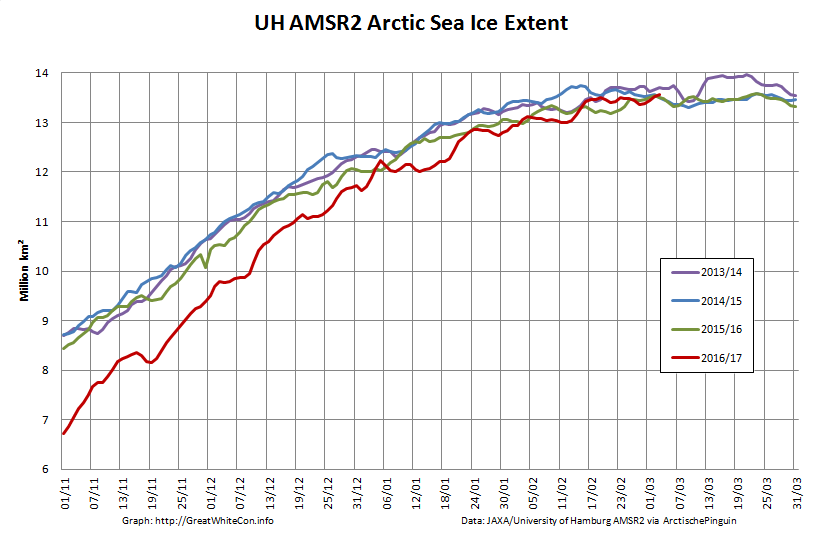
I’m going to have to eat some humble pie, or crow pie as I gather it’s usually referred to across the Atlantic, following my tentative “2017 maximum prediction” a couple of weeks ago. Both area and extent posted new highs for the year yesterday, with area creeping above 13 million square kilometers for the first time this year.
Commenter Michael Olsen suggests that “thicker ice being pushed into the Alaskan and Russian parts of the Arctic Ocean”. Here’s some evidence:
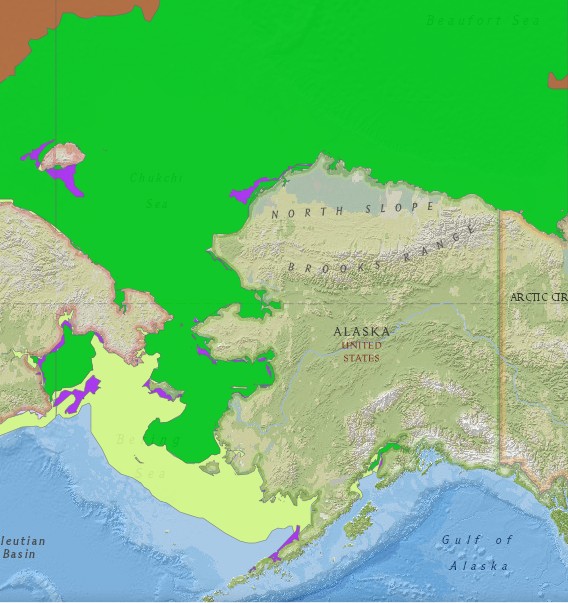
The United States’ National Weather Service current sea ice stage of development map for Alaskan waters:
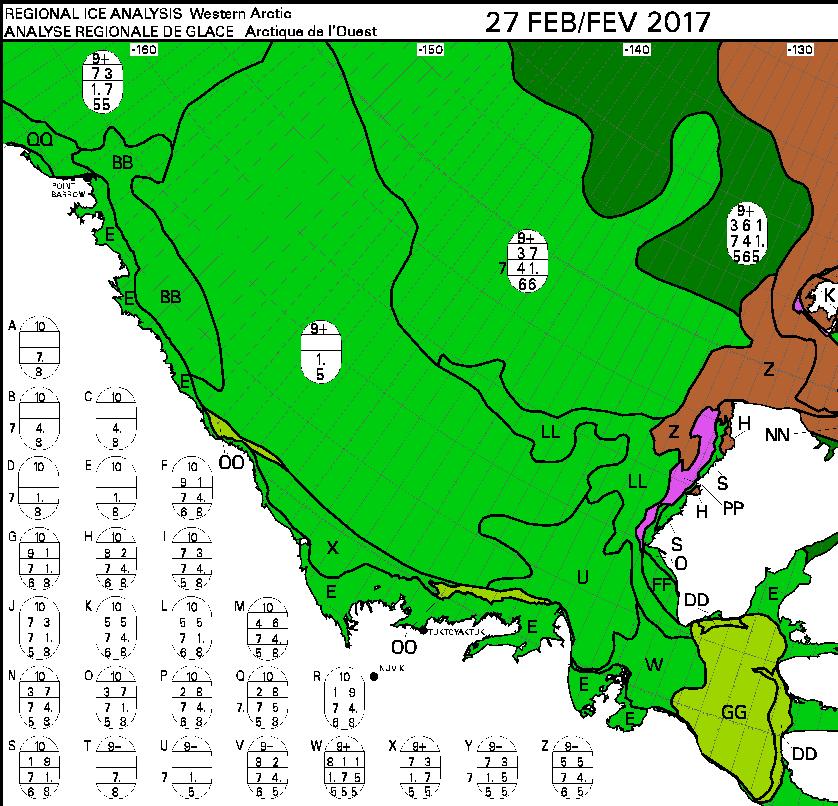
This week’s Canadian Ice Service sea ice stage of development map is expected later today, so for now here’s last week’s:
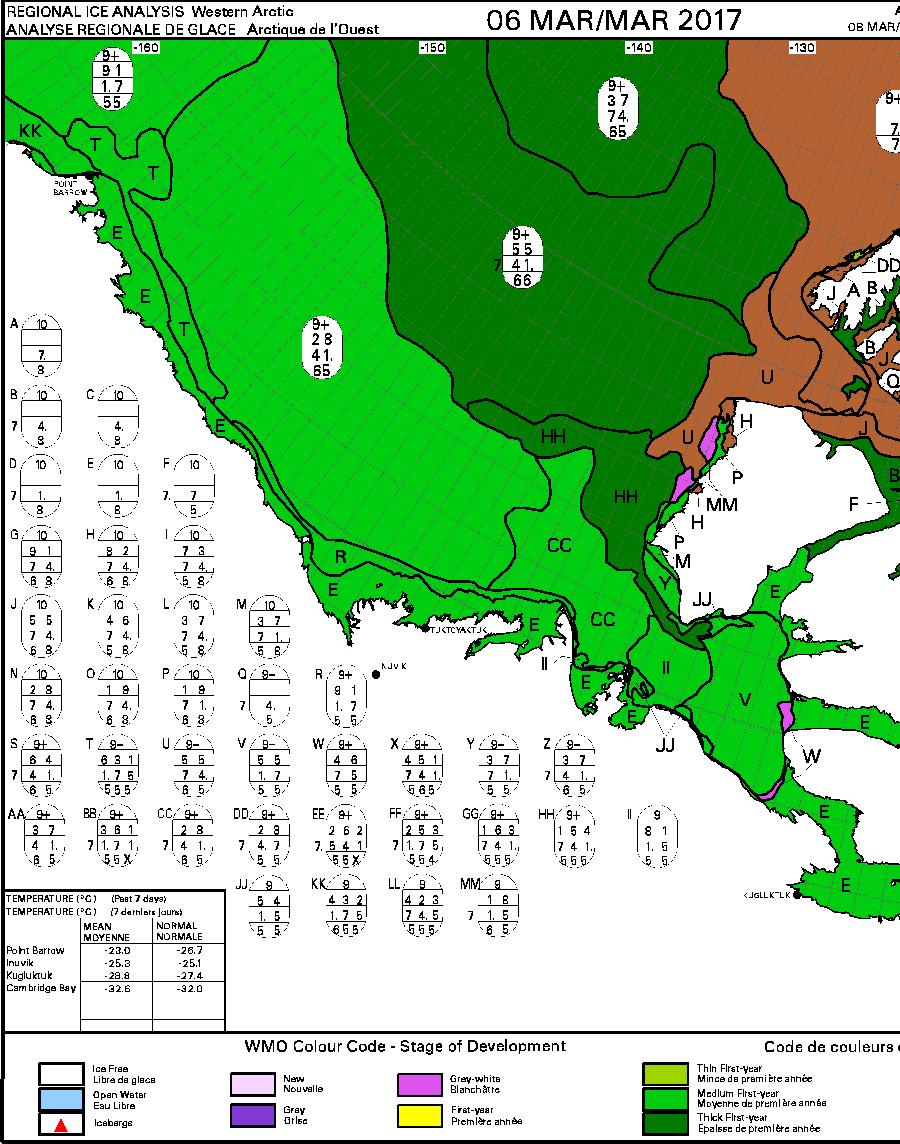
and here’s the latest version:
Similarly this week’s Russian Arctic and Antarctic Research Institute ice chart is expected soon has been published:
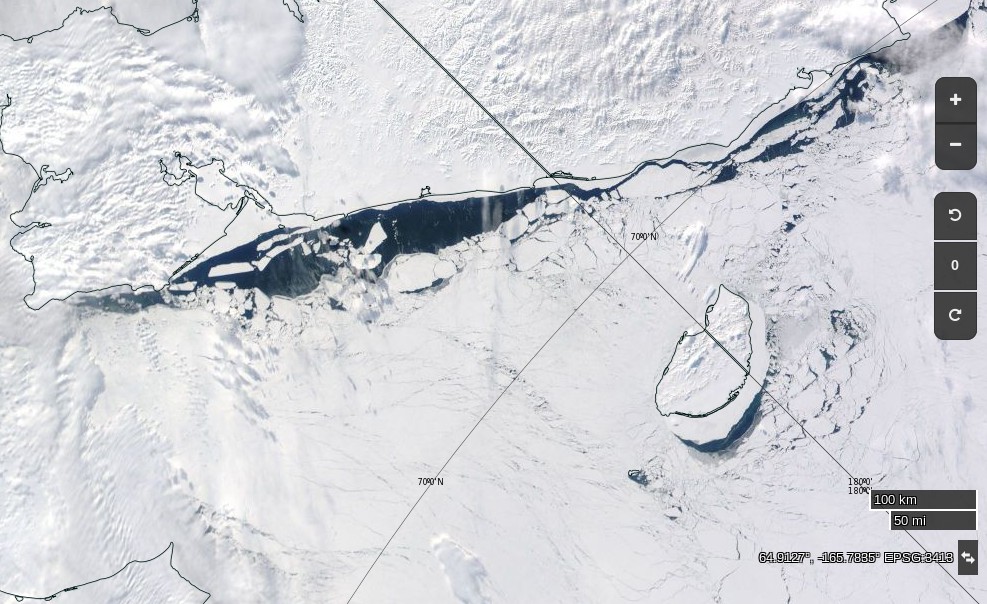
Especially for Michael, a visual image of all the “thicker ice [that’s been] pushed into the Russian parts of the Arctic Ocean” courtesy of the nice folks at NASA:
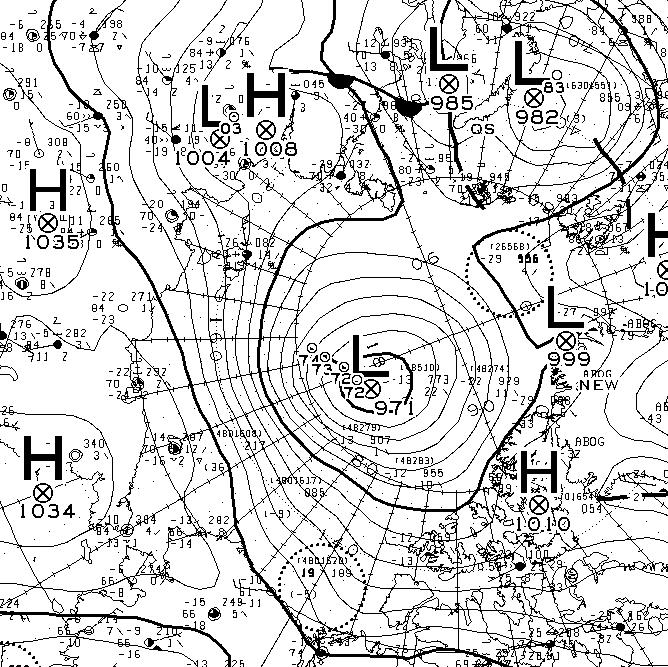
Yet another strong Arctic cyclone has been battering the sea ice in the Arctic Basin. According to Environment Canada this one bottomed out at 971 hPa at 06:00 UTC today.
In my reading, I have understood that the primary cause of the declining minimum Arctic sea-ice extent in summer, and the decline of multi-year ice, is the export of multi-year ice through the Fram Strait, and not atmospheric warming (apparently, at least from 1989 to 2003: note Rigor et al. 2002; Fowler et al. 2004; and Belchansky et al., 2005). This conclusion seems to be supported by the fact, gleaned from ships’ logbooks, etc., that there is no difference in summer sea-ice extent in the Canadian archipelago since the mid-19th century, which was much colder than today (Wood and Overland, 2003). Curious your views. Thanks.
A few bedtime reading suggestions for you Michael:
https://greatWhiteCon.info/2016/11/nasa-researches-storm-frank-in-the-arctic/
https://greatWhiteCon.info/2016/12/arctic-sea-ice-news-from-agu/
https://greatWhiteCon.info/2016/08/northabout-braves-the-northwest-passage/
Thank you. Interesting reading. In your graphs UH AMSR2 — Arctic Sea Ice Area and Arctic Sea Ice Extent, there are declines and increases throughout each ice season. The decline for the period you note for the major cyclone (i.e., late December 2015 to early January 2016) does not really stand out.
By contrast, there was a noticeable decline in sea ice area and extent toward the end of November 2015. Was that caused by another major cyclone? If so, did NASA report on that one, too? If not, why not? If it was one, it seems to have had a much greater impact.
I accept that weather will have short-term impacts on sea ice area and extent, and I followed the Northabout’s voyage keenly. Going back to my original questions, to your knowledge, is there any peer-reviewed research that corrects the studies I cited regarding the primary cause of minimum summer sea-ice extent (at least from 1989-2003) or the lack of change in summer sea-ice extent in the Canadian archipelago from the mid-19th century to now? I appreciate your help in getting to the bottom of this.
Thanks again.
Michael – You’ve confused me somewhat!
The point of the Northabout link was to provide empirical evidence that summer sea-ice extent in the Canadian Arctic Archipelago has changed in recent years. Do you know of any peer reviewed research that suggests otherwise?
The second half of November is the time when in recent years expanding sea ice in the Arctic Basin meets anomalously warm water on both the Atlantic and Pacific sides of the Arctic. I don’t recall a strong cyclone in the second half of November 2015, but adding a bit of wind driven compaction to the resultant “slowdown” could lead to the effect you describe?
The point about the anomalously low FDD’s this winter is that they will prevent sea ice thickness from increasing as much as it would in a “normal” winter. This won’t have a noticeable impact on the extent metrics in the middle of winter, but I would expect it to do so by the end of a “normal” summer in 2017.
Jim, I seem to recall Northabout’s success last summer being a near-run thing: another day or two would have seen them blocked in the Canadian Arctic for the winter. I hesitate to interpret that as “peer-reviewed research” about trends in sea-ice extent — unlike Wood and Overland, which I mentioned.
I have a different perception about what sea-ice extent will be this summer — I think it’ll be higher than last year. Happy to engage in a friendly wager, if you wish.
In any case, I will keep looking for a refutation of the articles I cited — about the export of multi-year ice through the Fram Strait, and not atmospheric warming, as the primary cause of declining sea-ice extent (at least up to 2003).
Cheers.
Your recollection is mistaken Michael. See for example:
https://greatWhiteCon.info/2016/09/is-the-northwest-passage-freezing-or-melting/#Sep-27
Northabout “escaped” into Baffin Bay on September 13th 2017. The refreeze in Lancaster Sound started on September 26th. Wood and Overland dates from 2003.
For Nikolai Litau’s reflections on the changes in the Arctic over the last 15 or so years see:
http://arctic.ru/analitic/20161116/491430.html
I do partake in the occasional “friendly wager”, but only longer term ones!
https://greatWhiteCon.info/2015/05/the-new-normal-in-the-arctic/#comment-209003
What’s the reasoning behind your “higher than last year” prediction?
The article nicely summarizes data for the “Arctic in March 2017”, per the subject line. But I think the “news” value is in the Piomas decline. In reading the post, it seemed like to switch to information about freezing degree days and area and extent, mildly reduced the impact of the Piomas results (which is stunning). However, regardless of whether my suggestion is valid or not, thank you for a very readable, nicely presented and informative post on the Arctic
Thanks for your kind words Randy.
For those who follow this stuff closely the “Shock News!” came several months ago. One of my articles even got a mention in a Guardian editorial.
However that doesn’t stop the cryodenialospheric porky pie production line creating vast quantities of “alternative facts” about the Arctic on a continuing basis. Hence our “Facts About the Arctic” series.
I think it’s just “eat crow,” not sure if I ever heard of crow pie, FWIW. In any event, keep up the good work.
Thanks for putting me straight on my transatlantic terminology William. Perhaps I’ve been listening to “Four and twenty blackbirds” too much?
Will do!
Jim
Nice summary.
Maybe you can help me with something. I am trying to replicate the FDD graph and maybe even convert that into a ‘thickness added’ graph for a book I am writing. It needs to be much my own work for copyright reasons. Do you have a source for the data from the DMI site. DMI themselves don’t supply it but refer you instead to ECMWF where you would need to build it from their big data set, binning it etc. Is there an easier source?
Thanks Glenn,
I can indeed help! The DMI temperature data for 2017 can be downloaded daily from:
ftp://ftp.dmi.dk/plus80N_temperatureindex/meanT2017_running.txt
I’ve bundled up all previous years data here.
Jim.
AWESOME, that’s exactly what I need.
Ta very muchly.
Glenn
My pleasure Glenn,
In case it’s of interest there are instructions available over on the Arctic Sea Ice Forum detailing how to roll your own FDD graphs from ECMWF and/or NCEP reanalysis data:
“Mapping GeoCoded Data Sets”
Thanks Jim,
That ‘bundled up’ form and the running 2017 numbers may be just what I’m looking for for an experiment to use FDD as a predictor of September SIE.
One question about this data :
In the ‘bundled up’ form, there are plain numbers until 2002, but after that there is T511, T799 and T1279.
Is there a known offset from these numbers with the pre-2002 numbers or are they compatible as is ?
Rob – Quoting from the DMI web site:
The “operational models from the ECMWF” have changed (and hopefully improved!) over the years. However, according to that bit of the DMI web site at least, the data from 2002 onwards have not had the benefit of reanalysis, so as far as I’m aware any potential “offset” in that data remains “unknown”.
Note also the DMI’s explanation that:
Also, after this remark from DMI :
Since the model is gridded in a regular 0.5 degree grid, the mean temperature values are strongly biased towards the temperature in the most northern part of the Arctic!
I’m looking at the DMI 80N graph with renewed scepticism, since apparently they did not even “area weight” the result.
Combined with the previous findings of (possible) irregularities in starting in 2002 with T511 then later with T799 and T1279, I’m not sure how they can still claim :
The ‘plus 80 North mean temperature’ graphs can be used for comparing one year to an other.
What’s your take on all this, Jim ?
My take is that (Michael’s Danish ancestry notwithstanding!) if you’re serious about this stuff you’re better off rolling your own metric, as per my earlier comment to Glenn.
This (data from DMI) is all a bit more confusing than I anticipated.
As for the unknown ‘offset’ at, for example, 2002, here are the first lines from the old metric :
2002 1 245.060982 243.894301
2002 2 246.641686 244.023126
2002 3 250.927844 243.664103
2002 4 249.235651 243.202430
and the new ones from the new (T511) data :
20020101 246.707917 243.894301
20020102 245.51952 244.023126
20020103 246.763839 243.664103
20020104 250.929424 243.20243
The last column seems to match pretty accurately, while the middle column does not. I can’t find a legend for what these columns mean, so I’m not sure what the actual temperature was on these dates. Do you have any insights as to what we are looking at here ?
Jim, I was basing my comment on what was reported by crew member Ben on September 15: “The Northwest Passage has already frozen behind us. So it turns out we went through a very short window…. So despite the obvious melting that’s been happening we were lucky to get through.” Was he incorrect?
My perception of greater ice extent this summer is based on thicker ice being pushed into the Alaskan and Russian parts of the Arctic Ocean. Let’s see what happens.
Cheers.
Michael – Did you bother to read the information at the far end of the link in my most recent comment? Or watch the videos? At the risk of repeating myself:
What “thicker ice being pushed into the Alaskan and Russian parts of the Arctic Ocean” would that be then? If you scroll up you may notice that there’s a handy CryoSat-2 Arctic sea ice thickness map provided for your viewing pleasure. Have you looked at it yet? Please feel free to download a copy and annotate it in order to identify the “thicker ice” to which you refer.
For your additional viewing pleasure here’s a picture of yours truly with Ben Edwards:
Cheers.
Jim, the difference appears to be between Cryosat-2 and DMI. The ice thickness map of the latter supports my view, I believe. It appears PIOMAS does too, but I won’t argue that one. Curious why you don’t use DMI data (since you do on temperature), but include the University of Bremen, which seems to be an outlier.
I’m not denying declining ice extent and volume recently, I just want to understand why it’s happening. For 15 years, it appeared not to be atmospheric warming, but the export of ice through the Fram Strait. Odd how that could change so quickly, if, in fact, it did.
Cheers.
Michael – Have you read any of the learned journal articles I directed your attention towards yet?
Does this help at all?
Just in case you’re unaware of the fact, your comments all seem to come straight out of the “Steve Goddard” ClimateBall™ playbook. Why is that do you suppose?
Jim, I read a lot of things. I agree with some, disagree with others, and question things I do not understand. I hope you do the same.
By the way, I did not know Goddard mentioned the export of ice through the Fram Strait as the primary cause of sea ice decline from 1989-2003. I’ll check that out.
Cheers. Stay warm.
Michael – “Goddard” never goes into that much detail that far back. He just cherry picks an “image du jour” and spins balderdash like “Thick Arctic sea ice continues to push towards Alaska” out of it.
Good luck with your search of the (un)Real Science archives. Please let us know if you discover anything of interest. In the meantime I questioned your assertion that “thicker ice being pushed into the Alaskan and Russian parts of the Arctic Ocean”. I’m still wondering what evidence you have to back that up?
You prefer a Danish “model” to European, United States, Russian or Canadian “measurements”? Or how about a US Navy “model”?
You also say that it’s “Odd how that could change so quickly, if, in fact, it did”. Doesn’t this explanation satisfy you?
Michael,
It is worth going back to your opening comment in order to review the validity (or otherwise) of the unequivocal claims made therein.
You began by claiming that the primary cause of ice loss was by means of advection through the Fram Strait, rather than by any atmospheric heating. By way of supporting evidence, you initially cite Rigor et al. 2002.
The actual title of this paper is “Response of Sea Ice to the Arctic Oscillation”, and the second paragraph of the Abstract contains the following lines…
“Regression maps of SIM [Sea Ice Motion] during the wintertime (January–March) AO index show … and 3) a slight increase in ice advection out of the Arctic through Fram Strait.”
http://journals.ametsoc.org/doi/abs/10.1175/1520-0442(2002)015%3C2648%3AROSITT%3E2.0.CO%3B2
Perhaps you could elaborate as to how this description lends support to your claim?
Whilst pondering that claim, you might also care to look at a more recent paper titled “Changes in Arctic melt season and implications for sea ice loss” (Stroeve et al: 2014) …
http://onlinelibrary.wiley.com/doi/10.1002/2013GL058951/abstract
You also boldly state that “… there is no difference in summer sea-ice extent in the Canadian archipelago since the mid-19th century”. As supporting evidence, you offer that 2003 paper by Wood and Overland.
http://onlinelibrary.wiley.com/doi/10.1029/2003EO400003/epdf
This document (titled “Accounts from 19th-century Canadian Arctic explorers’ logs reflect present climate conditions”) has also been offered by that never-ending source of comedy – the GWPF.
I would imagine that the sentence that gets pounced upon reads …
“The extent of summer sea ice during the 19th century, insofar as it is shown in patterns of navigability inferred from ship tracks, the direct observations of explorers, and a number of native accounts, is remarkably similar to present ice climatology”.
Now, if one was incapable of using a calendar, that might sound quite convincing. However, things have moved on a little since the paper was published.
Using NSIDC average monthly extent values for September, the 10 year average for that month running from 1994 to 2003 (the year of publication) was 6.63 million sq kms.
The equivalent figure for the 10 most recent Septembers (2007 – 2016) was 4.77 million sq kms.
Using sea ice area, rather than extent, the difference is even more stark. Over the 1994-2003 period, the average September area was 4.84 million sq kms. Compare this to the 3.28 million sq kms measured across the 2007-2016 period.
Perhaps now, both your claims might seem a little questionable in light of the above?
Sorry Bill,
Your comment was stuck in “moderation” for a while due to the inordinate number of links to actual facts!
Bill, thanks for the comment and the statistics. I acknowledge the decline in sea-ice extent in the last 20 years or so.
Regarding Rigor, I think the third paragraph of the abstract (i.e., “Here it is shown…”) is important, in that it ties the second paragraph to the conclusions. I do not know if Rigor is still active; I’m tempted to reach out to him to see what he says.
Regarding Wood and Overland, I find it curious that sea-ice extent in the Canadian archipelago was “remarkably similar” from the mid-19th century to the start of the 21st century. And, this despite the fact that the earlier period was much colder. If someone can explain that — it should have been greater in the earlier period, no? — I’d sincerely appreciate it.
Also, I acknowledge some of claims are questionable. I think some of my claims are correct, though. I hope that through patient and civil debate, we’ll be able to answer more questions.
Regards,
Michael
Jim, you are inquisitive and that is great. I will answer all your questions. I ask that, in fairness, you answer mine. Assuming you agree, here we go. Your questions first:
Q1. Does the map of the Arctic (seemingly “on fire”) explain to me why sea ice extent may have declined recently?
A. Not entirely. Average annual temperature in a place like the Arctic, where the variability is so great from winter to summer, is not a great measurement. That is, it’s not like, say, England or Singapore, where the variability is less. (By the way, what is average temperature doing in England and Singapore?) So, a map that shows “departure from average” can hide a lot — unless the departure is uniform throughout the year. That is, an increase in the average winter temperature in the Arctic of 2 C will not affect ice extent all that much. For example, the average high in Cambridge Bay today is minus 27 and the low is minus 35 C. Even were those to increase to minus 22 C and minus 30 C, ice extent would not be affected very much. (Today Cambridge Bay will probably set a record low for this date: minus 46 C.)
Q2. Why do I “prefer” the Danish model for ice thickness?
A. I do not “prefer” it so much as I note it as another data point. Also, if you note my family name, maybe there’s an innate cultural pull toward DMI data….
Q3. Why do I think thicker ice is being pushed toward Russia and Alaska?
A. The DMI data seem to support that conclusion. Time will tell if my suspicions are correct. As you note, and with apologies to Monty Python and the Holy Grail, “It’s only a model.”
Now, my questions to you:
Q1. If the studies I cited (Rigor, Fowler, Belchansky) have not been refuted, do you accept that export of ice from the Fram Strait was the primary cause of declining sea-ice extent from 1989-2003? If not, why not?
Q2. If you agree that export of ice from the Fram Strait is a scientifically supported explanation of the decline from 1989-2003, do you agree that the conditions that prevailed during that period could reverse and that sea-ice extent could increase? If not, why not?
Q3. Why do you ignore DMI sea-ice data, but embrace its temperature data?
Q4. Wouldn’t temperature maps of the Arctic that showed actual temperature, rather than “departure from average” be more scientifically honest, if a little less scary, as per the example I cited above?
Thanks. I look forward to hearing back from you.
Cheers.
Michael – See also Bill’s questions for you above.
I am indeed most inquisitive. However you’ll have to do more work than merely regurgitate “Goddardisms” if you expect to be taken seriously around here!
It seems that thanks to your Danish heritage you reject all evidence that does not emanate from DMI? In which case I’ll rephrase one of my previous suggestions.
Here’s a handy DMI Arctic sea ice thickness map (+ volume graph) provided for your viewing pleasure:
https://greatWhiteCon.info/resources/arctic-sea-ice-graphs/#DMIThick
Please feel free to download a copy and annotate it in order to identify the “thicker ice” to which you refer.
Jim, please see my answers to Bill above. My apologies if I missed the DMI ice thickness chart earlier — I’m not sure how that happened.
Regarding DMI, as mentioned, I use it as another data point. I think it’s reliable, but I do not regard it as Truth.
As mentioned to Bill, I am interested in patient and civil debate on this issue. I find the biggest problem with the climate debate is the seeming inability of people on either side to admit that the other side may have a point, that their data may be interesting, or that their peer-reviewed papers may be reasonable. I find, increasingly, that websites are just echo chambers. Views that contradict the owner’s are ridiculed, no matter how they are raised.
If that’s what you intend, that’s your call. But, it’s not what I’m looking for, I’m afraid.
Kind regards,
Michael
Michael – I am interested in patient and civil debate on this issue also. I agree with you that “increasingly websites are just echo chambers”. I also have plenty of evidence that my “views that contradict the owner’s are ridiculed”! Please see for example:
“The Great White Con 2017 “New Einstein” Award”
I’ll get around to all your numbered points in due course, but there are only so many hours in a day. At the risk of repeating myself, a question for you which you still haven’t answered to my satisfaction:
Q3. Please feel free to download a copy of the handy DMI Arctic sea ice thickness map and annotate it in order to identify the “thicker ice” to which you refer.
In answer to your Q3 I suggest you read the GWC “About” page. Then show me an example of anything other than a DMI Arctic temperature graph at any of the usual suspects. Fail on Sunday, ToryGraph, GWPF, WUWT, (un)Real Science, NALOPKT, BannonBart etc. etc.
Personally I rather liked the late, great Andrew Slater’s Arctic temperature graphs. However in his absence nobody at the NSIDC seems to have picked up that baton. Should you wish to double check DMI’s version of events for yourself please see my recent comment to Glenn.
Jim, thanks.
As to “downloading and annotating” the DMI map: I’m afraid my computer skills and time are insufficient to do that. In making my comment, I “eyeballed” it. As mentioned, let’s check back in a few months and see which of us is correct. (Mark Knopfler: “Two men say they’re Jesus; one of them must be wrong.”)
As to DMI thickness and temperature: I missed your use of the DMI thickness map and concluded — wrongly — that you had been guilty of cherry-picking data. You were not, I acknowledge.
As regards your Arctic temperature map: I checked the DMI archives. There has been virtually no summer (i.e., roughly May to August) warming north of 80 degrees since at least 1958. Mean daily temperatures bump around a lot in spring, fall and winter, but have been remarkably consistent in summer for the last 60 years. I do not know a lot about “Freezing Degree Days” but, in my experience, water will freeze pretty much just as well at minus 15 C or minus 20 C as at minus 25. Therefore, surely it’s reasonable to conclude that something other than carbon dioxide/atmospheric warming is affecting sea ice?
Regards,
Michael Olsen
Michael – If you’re not prepared to put in the time to do your due diligence why should Bill and I do it for you? “Eyeballing” may cut the mustard at (un)Real Science but it wins you no brownie points here I’m afraid.
Of course “there has been virtually no [surface] summer warming north of 80 degrees since at least 1958”. There’s ice up there! What do you suppose will happen as the sea ice north of 80 degrees starts to disappear through more and more of the “May to August” period you refer to?
I’m afraid your experience with sea ice is evidently sadly lacking. Here’s the NSIDC FAQ on freezing degree days for you:
https://nsidc.org/cryosphere/seaice/processes/thermodynamic_growth.html
and here’s an intriguing graph for you to ponder:
Cheers!
Jim
The strongly positive AO, Arctic Oscillation, that slightly increased sea ice export from 1988 to 1995 has had periods of being strongly negative since then. The speed of ice export out of the Fram did slow down. However, ice volume, area and extent have continued to drop.
Cool, cloudy summers caused a brief recovery in 2013 and 2014. Yes, temperature has been the primary driver of ice loss. If the Arctic suddenly cooled we could expect to see a sea ice recovery.
Please stop playing games. You are as transparent as a pane of glass.
Michael,
As I am an old git, the memory isn’t up to much these days. I meant to also include this link specifically dealing with ice in the Canadian Archipelago.
The decline in summer ice over the last dozen or so years should be absolutely obvious to anyone.
Jim, perhaps you might want to insert that CT graphic somewhere appropriate?
No pun intended. 😉
[Image embedded – Mod]
Note that due to Cryosphere Today’s reluctance to move to DMSP F18 data like NSIDC et al. the summer 2016 CAA melting season is missing from that graph.
Here’s the high resolution AMSR2 “homebrew” CAA sea ice area graph for the last few summers:
I am reading this exchange and links with great interest, although much is over my head. I notice that the end of “El Nino” and other related conditions seems to be pushing ice levels back up a bit/but too late for this years icepack, or am I mistaken? Thanks to both sides for the info and discussion, Andrew
I think you’re right: this is referred to as a negative feedback mechanism which pulls things back to normal.
The problem we all fear is that that are too many positive feedback mechanisms- such as is reflected in statistics like FDD- that they are overwhelming the systems natural balancing acts.
A more specific example of positive feedback is that when the multi-year sea ice starts to disappear it is replaced by first year ice which is salt ridden and melts more easily: this results in more advection of heat into the Arctic and so the resulting cycle presumably can’t afford to continue like this forever…
(But who knows: we could see a whole lot of La Ninas pulling the whole thing back to normal?!!? That’s why we measure stuff in the first place!)
** I think I got some of that right!
Are some of these comments simply missing the point that export through the CAA was enhanced by warmer conditions in the Arctic because previously the ice was simply too thick to move?
More like it was too thick to move quickly. The proverbial “Oldest, thickest ice in the Arctic” used to slowly work its way into the CAA. Much of what little is left was flushed through the CAA “garlic press” last summer!
The same principle may well apply to export via the Fram Strait?
That sea ice thickness class area graph for February doesn’t bode well then.
It may have been this exact graph that gave people an early heads up that 2016 was going to be the possible demise for the MYI in the Arctic: because a lot of people seemed to know early on in 2016 for some reason….
(Then again, there was possibly a few other tools at their disposal aswell!??!)
The SMOS thickness class graph is a relative newcomer on the scene. The NSIDC’s ice age graph has been around for much longer. Here’s a related animation:
@ SML (with a Scottish accent) 😉
“… missing the point that export through the CAA was enhanced by warmer conditions …”
As Jim and I have discussed earlier, there is a somewhat confusing term (in the English language, at least) and that is “fast ice”. The confusion arises as this is actually an abbreviation of the more descriptive term “land fast ice” – i.e. ice that is firmly wedged against a shore line.
However, due to the loss of seriously thick multi-year ice (through advection, top melt, bottom melt, side melt and wave action grinding) this anchoring capability is disappearing before our eyes. In fact, the very meaning of the term “fast ice” is rapidly becoming an anachronism – to such an extent that the adjectival modifier “fast” can now be used in its more conventional fashion.
[Added link – Mod]
The March edition of the NSIDC’s “Arctic Sea Ice News” has now been published:
http://nsidc.org/arcticseaicenews/2017/03/another-warm-month-in-the-arctic/
Jim,
Hi. Me again.
“Eyeballing”: Please run the animation at DMI for ice thickness from January 8 to today, and you’ll see what I mean. The purple bits turn green and yellow (i.e., thicker). And they get closer to Russia (maybe not as much Alaska, but that general direction).
Ice pushing toward Russia: Ironically, the NSIDC mentions ice being pushed northwards from east of Greenland in its November 2016 report. Here’s what I surmise: if it keeps on being pushed northward, eventually it moves southward and approaches Russia (and, to a lesser extent, Alaska) — as I mentioned.
North of 80 mean daily temperature: If I understand you correctly, summer daily mean temperatures aren’t rising because there’s ice up there. So, why are winter daily mean temperatures rising? There’s more ice than in summer and there’s no sun. I admit I am flummoxed by this — I can’t think of a good explanation. Do you know, or any of your readers know why this happens?
Sea ice and CO2 graph: Interesting. Why did they plot 1953? How do they know how much ice there was then? We keep being told that accurate sea ice records begin in 1979. The inference, of course, is that less CO2 always means more ice. We pretty well know that not to be the case though, don’t we? (Notwithstanding, of course, the 37 data points from the satellite record.)
And please understand: these are serious questions/points. I raise them in the hope of spurring debate and learning.
Thanks,
Michael
Hi Michael – Me again.
I refer you to the NSIDC FDD FAQ once again. Arctic sea ice grows thicker in winter. Thermodynamic increase in thickness is not the same thing as advection (“thicker ice being pushed toward Russia and Alaska” in denierspeak).
Ice that is “pushed northwards from east of Greenland” does indeed turn southwards. It ultimately heads through the Fram Strait to oblivion. The Transpolar drift carries sea ice from Russia towards the Fram Strait. Not the other way around. See also the animation in this reply to SML.
Have you watched the animation over here yet?
https://greatWhiteCon.info/2016/11/nasa-researches-storm-frank-in-the-arctic/
Or read the associated academic literature? Please bear in mind that you “keep being told that accurate sea ice records begin in 1979” by the cryodenialists. For a less biased perspective see:
https://greatWhiteCon.info/2016/02/dmi-masie-and-the-sea-ice-index-an-interview-with-walt-meier/
Jim, I detect a hint of agreement from you (finally) that ice is getting thicker near Russia — did you run the DMI animation as I suggested?It’s dead easy.
I think I may have detected another pattern: that you respond to my egregiously wrong points of view, but never acknowledge the correct ones. If so, that’s okay. As with other things, though, I could be wrong.
Respectfully,
Michael
Michael – I create my own animations. Have you looked at any of them? It’s dead easy!
https://www.youtube.com/channel/UCu_W8Y3lef2EEjzU-ouiQJg
It’s still winter in the Arctic Basin. Of course the sea ice is getting thicker! The question is whether your assertion that “thicker ice is being pushed toward Russia and Alaska” is correct or not. After all, you could be wrong.
I respectfully suggest that you adopt a less patronising tone in future and present your evidence for the alleged advection, if you have any in your possession.
The first glimpse of the Fram Strait at visible frequencies in 2017:
See also the image of the Chukchi Sea above.
You have ample space to place the Western Arctic Colored Canadian map on your blog but you cut it off. Why?
Because the eastern area’s not anywhere near Michael’s “Russia and Alaska”, amongst other reasons.
I’ve already pointed out above that:
What’s your point?
Also, wrt to sea Ice Vol./Thickness/Old-Ice. It was a long time,just talk about the extent and about the coming end of ice. The most ‘serious’ prediction I could find in the lit was in 2000, then it just exploded. TonyHeller has a collection of newspapers going back to 1923/1969/1972 etc… referencing some researcher or other saying the end of arctic ice. Hence someone for about the last 100 years has been ‘chicken little’ing. The most egregious Gore and Wadham’s.
But since it didn’t materialize, the arctic researchers jumped on the volume/thickness/old-ice brigade.
The first serious ice volume/thickness was due to Thorndike et.al. in 1975.
scholar.google.com reports that citations of this work did the following;
1975-1989 95
1990-2004 199
2005-2017 327 (just 4 in 2017)
and exponential growth in citations. Why? Because it may be a better metric, but the dialogue as to the end of arctic ice (extent) was not materializing and they needed another way to project their great alarm.
Now you LEAD with Ice Volume/Thickness/Old-Ice instead of extent.
So either climate science and polar research is still in its infancy and finding itself stage or they are getting desperate.
Many interesting issues with arctic ice and claims to it deep relevance.
It was used to claim the impending doom of the booming polar bear population.
It was claimed to be the ‘canary in the coal mine’ for global warming (yes, back then).
It was claimed that the extent was crucial due to albedo modification.
It was claimed to be a ‘tipping point’.
It was claimed to be a proxy for arctic temp alarm.
It was claimed to be a protection against oil/gas exploration in the north hence an ‘important safeguard’ against mankind’s creation of C02
It was claimed we had pre-1979 sat records, but NASA et.al seems to have lost them.
It was claimed that salinity changes from the melts would change ocean circulation. (Fun Movie)
But in reality…it is now a research area of interest in its own right. Worthy of millions for models or how about millions for actual measurements? But as a sirens song for global-warming now climate change, it is doubtful.
Timo – Surely volume is a much better metric for the “amount” of sea ice in the Arctic than extent? It’s just a lot harder to measure!
When it comes to ice albedo feedback then area is more useful than extent, but again somewhat more difficult to measure.
The IPCC seem to have “underestimated” the actual decline in Arctic sea ice, do they not?
Re 1979 and all that, have you read my comment to Michael on that subject yet?
Here’s the NSIDC’s Arctic sea ice extent graph going back to 1953:
Where are your “lost records” hiding?
The fact of the matter is a graph from ipcc first draft and graphs to be found, the issue is the raw data. So if you can reference the location of the sat images converted to data THAT would be great!
As to amount, of course it is a fine measure, and in fact I said that “It may be a better metric” but my points are still the same.
Arctic Ice research is either in its infancy or lead by alarmists willing to change the game.
You completely ignore the substance of my comments. Arctic ice was suppose to be gone. It was a problem on many fronts. It didn’t turn out the way they wanted so they now switch to Old-ice/thickness/Vol. The why is clear, it continues the message. So where is the ballyhoo about the missed projections? Where is the journal articles slaying Wadham for his folly? Instead you get a two year reprieve on switching to Old-ice since it lags extent (when declining) and it must almost be entire modeled since soundings over that area are expensive.
Changing global warming to climate change
Changing sea ice extent to sea ice age/thickness/vol
Changing accelerating sea level rise to sea level rise
Changing its going to get warmer to its going to get extreme
These are all examples of worried scientists (yes probably most quite upstanding) that have put cause in front of research theory.
Instead of looking at what is happening, they are searching for what they want to see.
Another issue is articles that start with “we know global warming is but we see the opposite” so that they have paid homage to the editors but report inverse of the expectation.
Finally a quote from AR5
The annual Arctic sea ice cover very
likely declined within the range 3.5 to 4.1% per decade (0.45 to 0.51
million km2
per decade) during the period 1979–2012 with larger
changes occurring in summer and autumn (very high confidence)
Hmm… again the missing early data. Apparently it is not even correctable/adjustable?
And arctic minimum in 2012 was very low, we did not hit that.
Could you reference your IPCC underestimates comment or report?
Timo,
Much like Michael, you’re merely regurgitating “Goddardisms”. Let me assist you:
http://lmgtfy.com/?q=nsidc+nimbus
Who said “Arctic ice was supposed to be gone”? It certainly wasn’t the IPCC:
https://www.ipcc.ch/publications_and_data/ar4/wg1/en/figure-10-13.html
Re “Prof. Wadhams folly” see:
The “substance of [your] comments” is merely a long list of evidence free “skeptical” talking points. Do you actually have any Arctic sea ice evidence to offer?
Jim, this is a pretty easy game to play. Just find the most extreme prediction, then attack it. Find the scientist that’s the furthest out from the consensus and act like he represents all scientists.
Let’s face the facts. Russia’s economy depends on selling oil and keeping the price up. There are lots of Russian trolls and their little helpers doing their best to help Russia’s cause.
Including @POTUS?
Can I ask: http://polarportal.dk/en/groenlands-indlandsis/nbsp/isens-overflade/ , why does this link seem to show Greenland accumulating?
Because that page shows the “surface mass balance” of Greenland, which takes no account of calving. From your link:
For Greenland ice mass see:
https://climate.nasa.gov/vital-signs/land-ice/
Thanks Jim.
Hey, I googled wipneus- global sea ice and clicked images the other day:
What the Jebus is going on? Lucky people like your good self have an eye on such things….
[Embedded image – Mod]
Arctic area is going down fast, whilst Antarctic area is going up slowly!
Yet another Arctic cyclone drops below 970 hPa MSLP:
Here’s the ACNFS ice drift forecast for today:
A lot of old ice is heading towards the Fram Strait at high speed as we speak.
The 2017 NSIDC maximum Arctic sea ice extent is confirmed as the lowest in the satellite era:
In large part the recent swift drop in sea ice area, and hence also extent, has been driven by the Pacific periphery:
The reduction on the Atlantic side is much less evident, perhaps in part due to cyclone induced Fram Strait export:
It’s a similar story in the Baffin Bay plus St. Lawrence Gulf region too:
The Kara Sea was very slow to refreeze last year, and the 2017 melting season is already off to a flying start:
Temperatures in the area are forecast to be anomalously high for the next few days, so expect that trend to continue. Here’s how the Barents/Kara area looks via AMSR2 just at the moment:
Your x-axis is off in the first graph (UH AMSR2 Kara Sea Ice Area). I don’t think the area was that high in November. 😉
Thanks for the heads up Don. You are quite right. The “Autumn” x-axis instead of the “winter” x-axis!
Now fixed.
I ran into this collection of Arctic comments by accident. Unfortunately none of you guys have any idea about what is going on in the Arctic. As I proved in 2011, Arctic warming is not greenhoue warming which this batch of analysts imp-licitly accept. There isv no AQrctic warming or any other kind of warming that carbon dioxide can produce. Furthermore, no one seems to have an inkling that Arctic warming started at the turn of the twentieth century. Prior to that there was nothing there except for a slow, linear cooling that lasted 2000 years. This came to an end at the start of the twentieth century when a strong warming pulse appeared. The first warming waqs followed by a cold spell, apparently a temporaery return of the former flow pattern. But the cold spell was over by 1970, when warming started up again. Almost all the temperature curves shown this group start in the late seventies and they simply have no idea of what happened before. The source of the warmth and the method by which it took over the Arctic so quickly was a mystery to me at first. Eventually it became clear that what had happened w3as a rearrangement of the North Atlantic current system. As a result, the warm water of the Gulf Stream that mostly went to the North Sea was partly redirected to the high Arctic which it proceeded to warm. The Gulf Stream, as you know, originates ion the Gulf of Mexioco. From there it flows north through the Florida strait and continues north parallel to the East Coast. It used tocross the ocean and enter the Norfh Sea as Ben Franklin knew. It was that part that I susp[ected must have changed. There were no direct iobservations until Spielhagen et al. decidfedc to go on an Arctic cruise in 2010. They measured the temperature of North Atlantic water entering the Atctic Ocean directly and found it to be higher than any other observations had shown. That is what I had predicted and it made me write it up as a journal article. You will find all the details you may need or be interested in by reading my article in E&E, volune 22, issue 8, pp 1069-1083 (2011). And shame on you for putting out all the verbiage here without knowing the basic facts about the Arctic.
This is a most intriguing comment Arno! It looks like the output of a less than perfect optical character recognition algorithm. Would you like me to correct your spelling mistakes and improve the formatting for you?
As luck would have it I have the great good fortune to reside in Soggy South West England, so I am very familiar with the effects of the “Gulf Stream” as you call it. I am also familiar with the basic facts about the Arctic.
You would seem to be aware of the fact that not far below the sea ice in the Arctic there’s a vast amount of (comparatively!) warm water. What do you suppose would happen if the ice and that water met?
Finally, for the moment at least, do the words Dunning and Kruger mean anything to you?
Quoting from the abstract of the relevant E&E article…
“It turns out that satellites which have been measuring global temperature for the last 31 years cannot see any sign of current warming that supposedly started in the late seventies”
Would you care to specify exactly which satellite temperature data set this claim is based upon?
HINT(s):
It isn’t UAH ver 5.6
It isn’t UAH ver6 beta5
It isn’t RSS ver 3.3
It isn’t RSS ver 4
The above referenced paper also claims that Arctic warming is almost entirely due to an enhanced Gulf Stream. An alternative perspective on the changing strength of the Atlantic Overturning Meridional Circulation – of which the Gulf Stream forms part – is discussed in an article by Stefan Rahmstorf of the Potsdam Institute. An overview can be seen here…
https://www.sciencedaily.com/releases/2015/03/150323132746.htm
For those unfamiliar with E&E (and its editorial policy)…
https://www.theguardian.com/environment/2011/feb/25/real-climate-libel-threat
http://bigcitylib.blogspot.co.uk/2011/02/peer-review-at-e.html
https://en.wikipedia.org/wiki/Sonja_Boehmer-Christiansen
Oh, and by the way, according to another of the E&E contributors, the sun is composed mainly of iron.
An excellent view of the recently refrozen sea ice in the East Siberian Sea this morning, courtesy of the Terra satellite:
The high resolution AMSR2 maps from the University of Hamburg have been absent for a few days, whilst they moved to a new location. Wipneus has crunched all the new numbers, which reveal a few days of flatlining:
Here too is AMSR2’s view of the gaps appearing in the East Siberian Sea that we showed yesterday:
Note also the dark areas appearing in the Laptev Sea, where temperatures have been far above “normal” for a few days now.