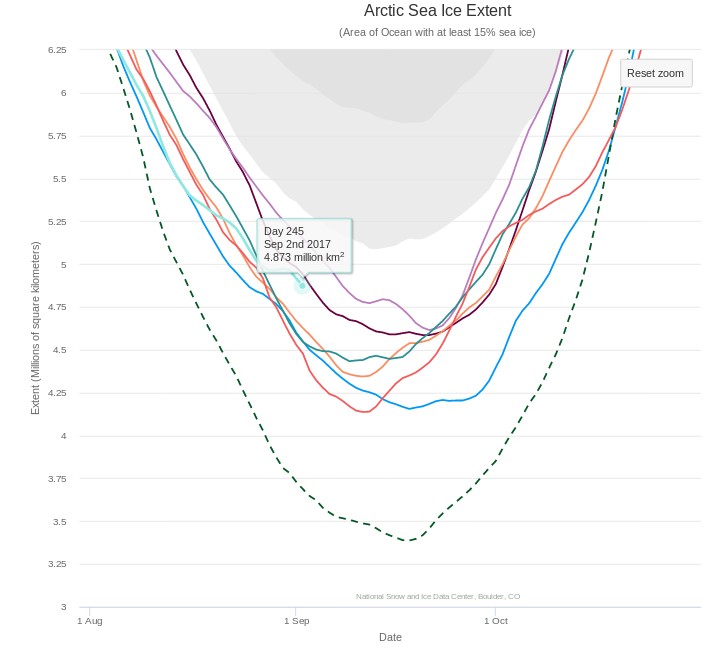
September has arrived once again, the month in which the assorted Arctic area and extent metrics (almost) always reach their respective annual minima. Now we can start to speculate about what the assorted minima will be, and on what date.
First of all let’s take a look at “Snow White’s” favourite high resolution AMSR2 metrics derived by “Wipneus” from University of Hamburg AMSR2 concentration data:
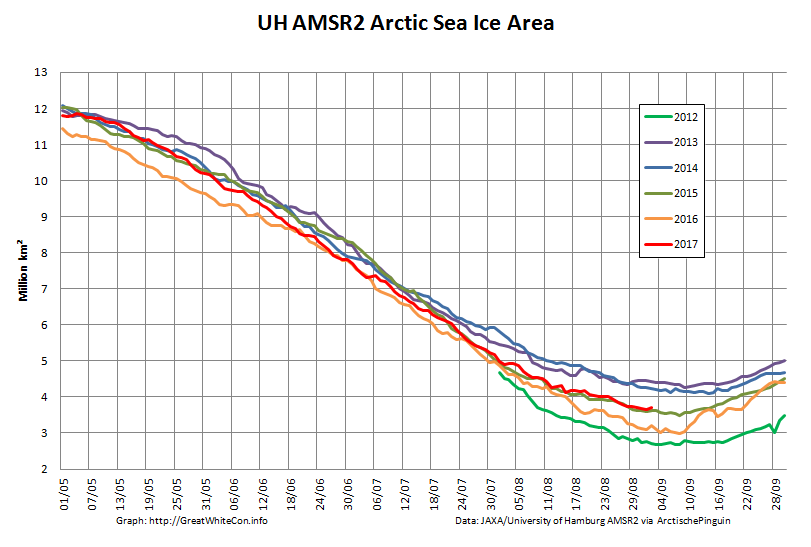
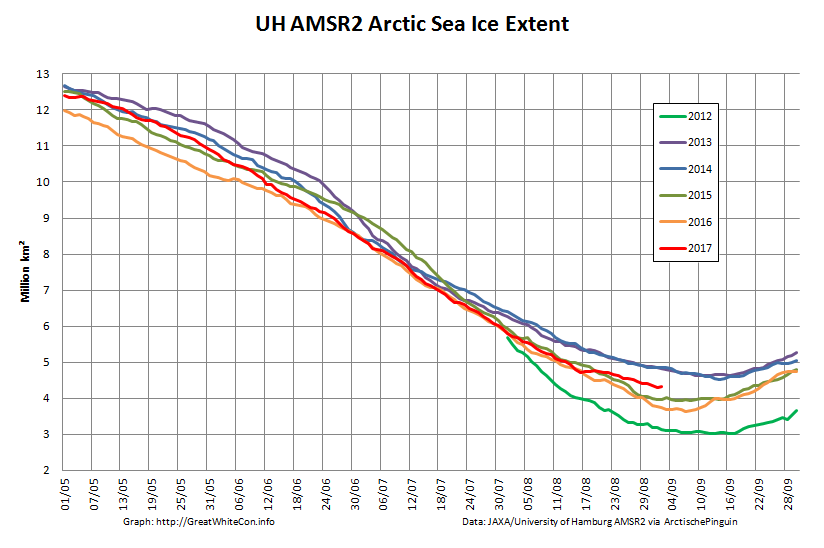
As you can see, today’s values are both higher than yesterday’s. Hence we already have potential minima to consider! In this case:
UH AMSR2 Area – 3.65 million km² on September 1st
UH AMSR2 Extent – 4.30 million km² on September 1st
Personally I don’t think those numbers will last long, and here’s one reason why. The “surf forecast” for the far North Atlantic for midday on September 6th:
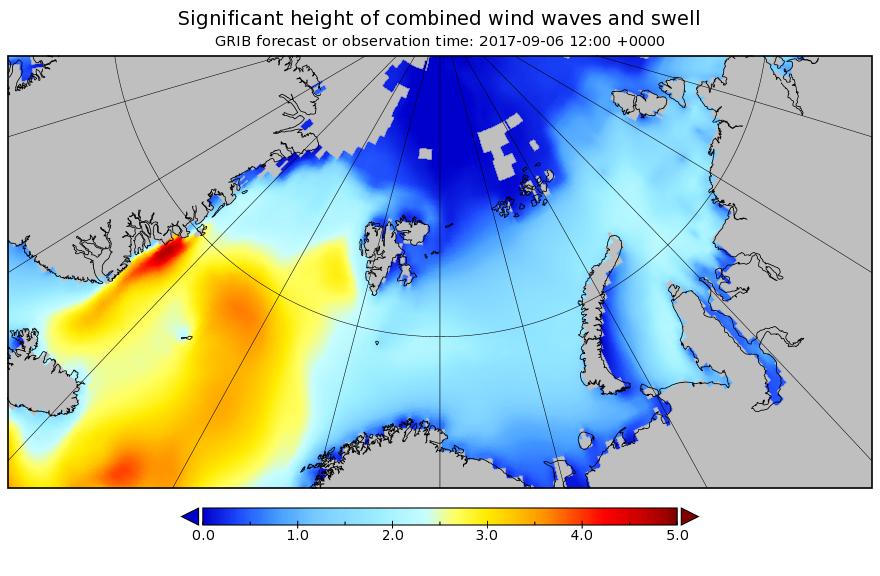
Some significant swells are currently forecast to batter the ice edge on the Atlantic side of the Arctic over the next few days.
Shock news! Tony Heller has made a prediction about this year’s minimum!! Unlike last year, this year the NSIDC 5 day average extent seems to be his Arctic metric of choice:
Tony tells his faithful flock:
The Arctic sea ice minimum this year is very likely going to be be larger than 2016, 2015, 2012, 2011 and 2007.
It is also likely that the minimum extent will be higher than 2010 and 2008.
Instead of reporting the huge gain in ice and massive failure of their forecasts, climate alarmists will report that extent was “8th lowest on record.”
All those years are on the graph above. We shall see.
Our normal Arctic sea ice extent 2017 minimum service will be restored as soon as possible. Meanwhile here is the test card:
That comes to you via the Daily Express of all places!
On the way the cruise’s resident naturalist and Smithsonian lecturer, Michael Scott, risked the wrath of Trump supporters by pointing to some of the changes Greenland is undergoing.
A Nasa map based on data between 2004 and 2014 revealed that the ice is melting across most of Greenland – an area nine times the size of the UK.
Pulling together several papers, Michael said Greenland’s summer melt season now lasts 70 days longer than in the early 1970s.
This melting is unfreezing the fringes of the permafrost, which may explain why Nasa satellites are picking up fires raging where the ice has retreated.
It is of course still to early to be 100% certain about this. However:
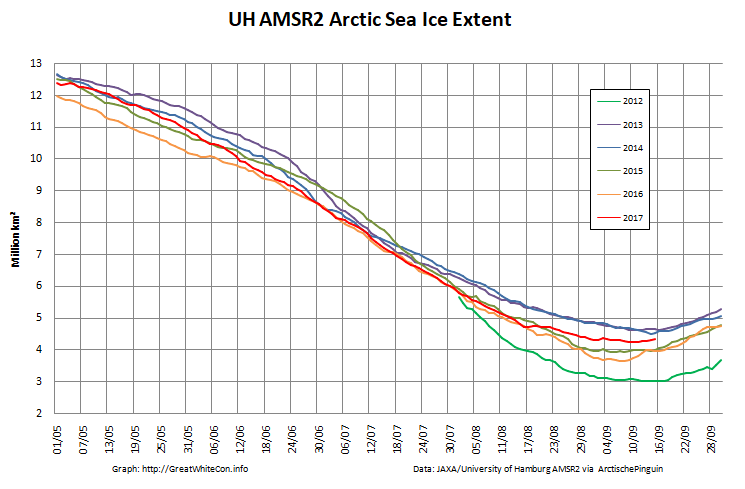
It certainly looks as though the bottom is in for the University of Hamburg AMSR2 extent: 4.25 million km² on September 11th.
It’s much the same story for JAXA extent:
4.47 million km² on September 9th and 10th.
The NSIDC have followed in Snow White’s glass slippered footsteps and tentatively called the minimum:
On September 13, Arctic sea ice appears to have reached its seasonal minimum extent of 4.64 million square kilometers (1.79 million square miles), the eighth lowest in the 38-year satellite record. The overall rate of ice loss this summer was slowed by a persistent pattern of low sea level pressure focused over the central Arctic Ocean.
Please note that this is a preliminary announcement. Changing winds or late-season melt could still reduce the Arctic ice extent, as happened in 2005 and 2010. NSIDC scientists will release a full analysis of the Arctic melt season, and discuss the Antarctic winter sea ice growth, in early October.
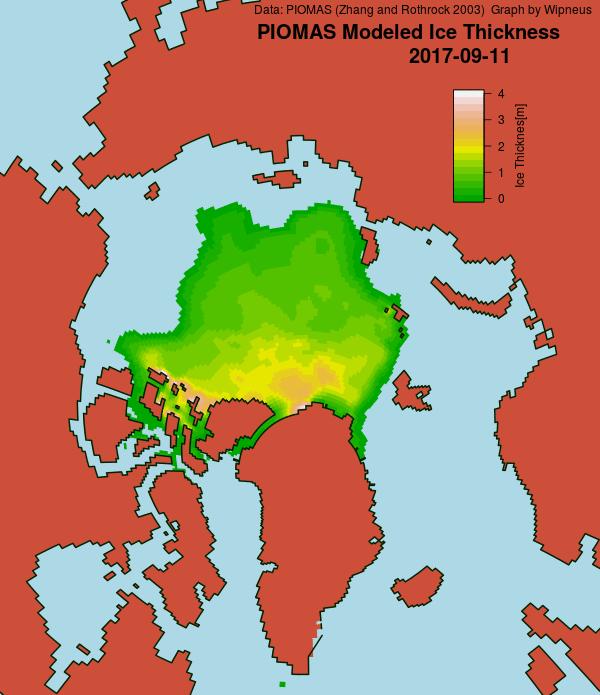
The ever industrious Wipneus has also called the PIOMAS minimum volume for 2017:
Minimum volume was reached at 11th September: 4.542 103km3, which is fourth lowest after 2012, 2011 and 2016 (resp 3.673, 4.302, 4.402) and just below 2010 (4.582).
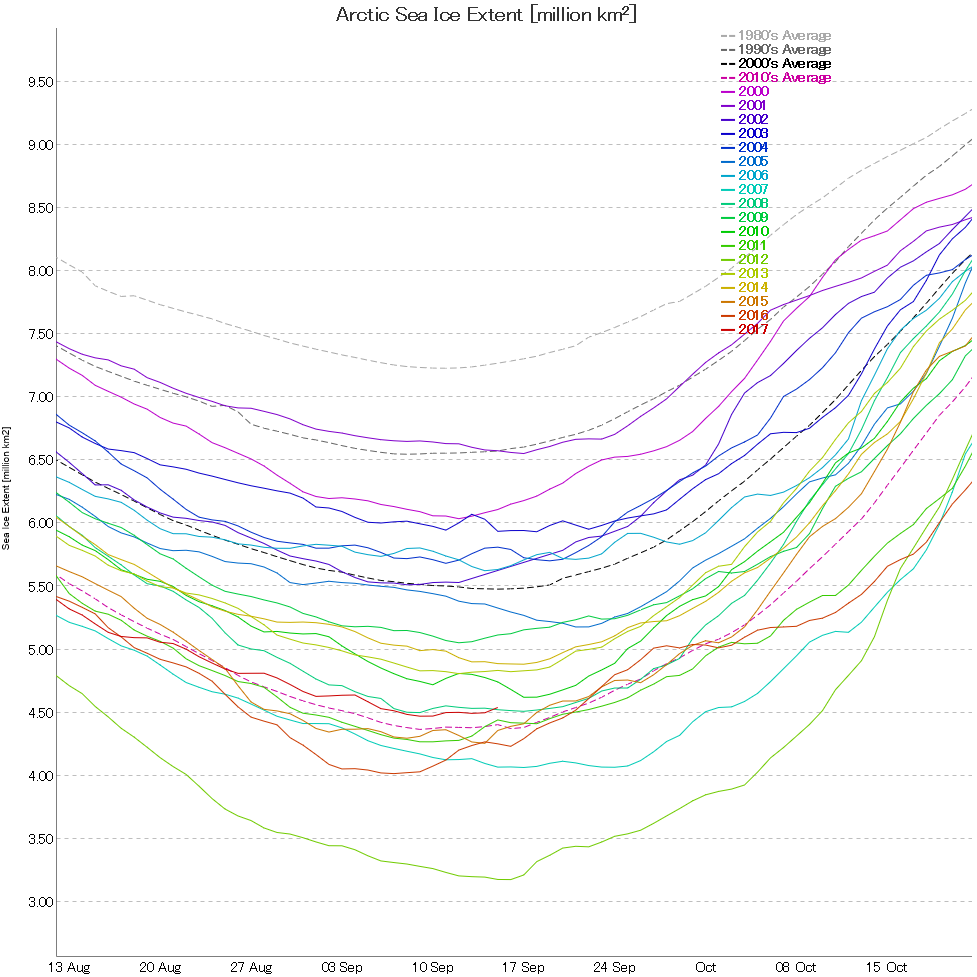
Here’s the 2017 edition of our annual NSIDC daily max/min extent graph:
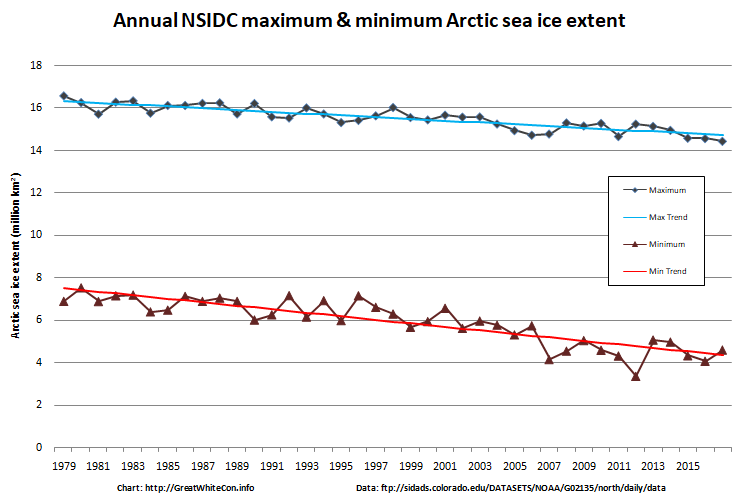
The maximum extent was the lowest in the satellite record, and the minimum was just fractionally above the trend line. For those that concern themselves with “statistical significance”, the PIOMAS minimum volume was a “statistical tie” for second place:

Watch this space!
Wow your Fukkin dumb, and a Troll..
Did Heller REALLY make a Prediction??
Is 2017 minimum ‘Likely’ to be higher than 2016, 2015, 2012, 2011, 2007??
If so what will that mean in terms of Gain, Loss..
“Very likely” sounds a lot like a prediction to me!
This site is Racist..
“WHITE Con”??
C’mon .. Insert Brown and gauge the reaction..
Grass is green Phil. Sea ice is white(ish).
It is obviously an attention getting off topic remark, as indicated by this person naming him or herself Phil Jones. I’d say you’re being punked, don’t waste your time.
Jim, minima already? The next few days will be interesting, that’s for sure. On another matter, did you see that DMI scientists say there is a good chance the Greenland ice sheet grew this year?
Minima already? I doubt it Michael, but the Arctic is full of surprises.
Which “DMI scientists” are you referring to?
Dr Ruth Mottram, Dr Ruth Mottram, Dr Martin Stendel
“Overall, initial figures suggest that Greenland may have gained a small amount of ice over the 2016-17 year. If confirmed, this would mark a one-year blip in the long-term trend of year-on-year declines over recent decades.”
Jim, I was responding to your observation that “we already have potential minima to consider”.
I wasn’t referring to your prediction that came right after (“Personally I don’t think…). I perceive you don’t countenance predictions, possibly even your own.
As to the DMI scientists, it was Ruth Mottram, Peter Langen and Martin Stendel.
It snowed – a lot. Some suggest that climate change could make this a more frequent occurence. But no doubt the trolls will make a fuss.
Matthew, “news” is, by definition, something that is novel — i.e., something that has never happened, or not in a long time. The possibility of the Greenland ice sheet gaining ice for possibly the first time this century is therefore news, regardless of the cause. The fact that few people are picking up on that, or deriding the people who do as “trolls” is perplexing.
Last November, there were many articles with the news that the Arctic was “on fire”. Even Jim chimed in, on November 20. Both events are probably of little relevance in the long-term (who knows?), but why trumpet one and bury the other?
Perhaps the irritation is that a good possibility is that it is AGW that is the cause of additional snowfall – as I mentioned on my ASIF posting on greenland 2017 melt season at end Aug.
The trolls twist anything and everything.
Matthew, so AGW causes the Greenland ice sheet to get smaller, except for the years it causes it to get bigger. Got it. Thanks.
I don’t think you have got it at all Michael.
In this instance the Carbon Brief article attributed the increased precipitation to Hurricane Nicole.
I don’t see your swells show up on ventusky. Sorry but we will have to see.
https://www.ventusky.com/?p=75;-3;2&l=wave&t=20170906/21
They are there when I look. Try “swell wave period”.
That does not show wave height….. 10 to 12 second wave periods tells nothing about the height.
But we will have to wait what happens and if at all it can make an impact.
Hurricane Irma’s path is still very unknown as well. Ventusky was first showing landfill at New York City as cat 2-3 storm, now its north/south Carolina border as cat 3-4 storm. Too many variables that constantly are changing.
After such a low maximum extent in the spring, I do believe that the arctic has shown a remarkable melt season, which has surprised many. Whether it is 8th lowest or 3rd or 4th lowest. Many had thought it would go below 2012 levels, which it clearly doesn’t seem very likely anymore.
When you said ‘many’ thought it would go below 2012 were you lying?
Off course I lied. That is what everyone does. Those that have claimed that the arctic would be ice free yearly since 2007, people like Al Gore, have been waiting for it to become ice free. It has not happened yet. This years low maximum extent and the high temperatures worldwide (2017 supposedly second warmest year on record) was the ideal scenario to set new record low extent. I am sure that those who thought the arctic would be ice free in the past, were thinking that this could be the year. Oh well there is always next year.
I’m well aware of that Henk. If you were a surfer you’d be aware that period is more important than height, especially when it comes to smashing up sea ice.
Jim, enjoyed that last comment to Henk and I didn’t know that stuff but my brother surfs so I can meditate away on what you just said….( He used to make me watch Kelly Slater videos and I did gain respect for that crazy occupation ) …
…anyways, as I was about to say, …I just looked at nsidc for ANTARCTICA: is that looking extra-ordinarily strange at the moment or not?
“Should I push the panic button or not?”, is what I’m asking!
I had dinner in the house that appears in front of Kelly at 1:02 the day after that session. At the time I had no idea what had been going on earlier!
Thanks. Good to know.
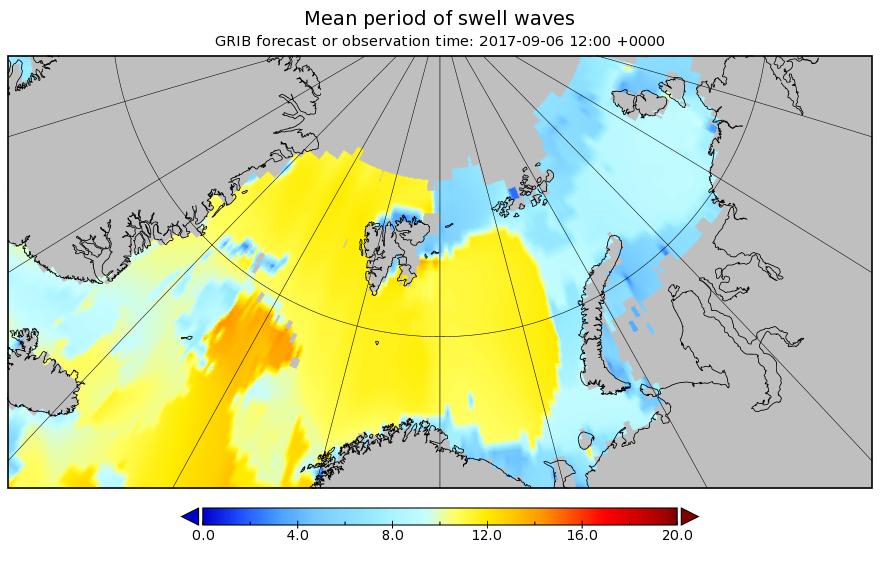
The latest forecast for tomorrow reveals an increased swell period:
I suspect Heller is using NSIDC because that is the one the annual ‘guess he minimum contest is based on. Not my favorite metric, for sure, given the 25KM resolution. I don’t enter that contest, because it’s more about guessing how far off they will be, vs what the extent will actually be. For that answer, a product like MASIE is preferred.
BTW, given the 2016-2017 results, is it time to consider that Arctic ice is somewhat self-regulating, in that more exposed water in winter leads to lower water temps, which leads to less bottom melting in summer? Given that air temps are now averaging -4C above 80 degrees north, it’s only bottom melting from here on out.
i would go further and say the wax and wane of arctic sea ice is the driver behind the amo cycle.consecutive years of high ice extent,particularly in winter prevent the arctic ocean and hence water recirculated back into the north atlantic from losing excessive amounts of heat . the reverse when extent is low.
no matter how high air or water temps appear in the arctic it has to be remembered that the air and water transported to the arctic from warmer climes can only cool .
Jim, Carbon Brief didn’t mention what Heller has shown clearly: it was a banner year for snow in much of Greenland. Saying it was all a result of one storm in October is not supported by facts. Happy 4th anniversary, by the way — all the best.
Don’t expect to receive any brownie points in here for quoting Mr. Heller.
Either he simply has no idea what he’s talking about or he deliberately pulls the wool over the eyes of his faithful flock.
No need to cite Heller re: Greenland snow/ice. DMI has Surface Mass Balance up over 400 GT this season (ending 9/1) – lots of snow and not a lot of melt. Clock is reset to zero (relative to SMB measure, so it will take a while to see if this season is a repeat or not.
And as DMI point out, but Heller ignores, SMB isn’t the whole story:
Jim, I won’t cite Heller. I’ll just use DMI words and stats (such as they are available) and, for the start of Hurricane Nicole’s impact on Greenland, publicly available reports. I make some estimates below; if anyone has better numbers that we can plug in, please let me know.
1. Hurricane Nicole (hereafter “HN”) started contributing to the Greenland SMB on Oct 19. It stopped doing so on Oct 31 (DMI, Carbon Brief post: “note the peaks in October”).
2. What is a reasonable estimate of HN’s gross impact to the SMB? 50 Gt? There were days from Oct 19-31 with major accumulations, but several with nothing special. Let’s say 70 Gt.
3. But, it normally snows in Greenland in October. What was the departure from the 1981-2010 SMB mean accumulation for the period Oct 19-31? Let’s say 40 Gt. That is HN’s net impact to the SMB increase.
4. The SMB increase last year was 544 Gt. So, seven per cent can be attributed to HN. (I.e., 40 Gt divided by 544 Gt)
6. Just looking at the SMB increase from the 1981-2010 mean, last year was up 176 Gt (i.e., 544 Gt subtract 368 Gt). So, HN’s net impact on the departure from the mean was roughly 23 per cent (i.e., 40 Gt divided by 176 Gt).
7. The increase in the SMB for Aug 2017 was about 75 Gt. The 1981-2010 average increase in August is about two Gt.
8. The Aug 2017 net impact on the SMB departure from the mean was almost twice as large as HN’s (i.e., 73 Gt divided by 176 Gt, or 41 per cent).
In summary:
a. It snowed a heck of a lot in Greenland from Sept 1, 2016, to Aug 31, 2017.
b. HN, for 12 days in Oct 2016, had an impact on the SMB.
c. The melt was, on net, on holiday in Aug 2017.
d. DMI scientists characterizing HN as the “main culprit” in the SMB increase in 2016-17 is, at best, an exaggeration.
I trust you find all this reasonable, Jim.
Well Said Michael.
It’s a shame that all these people want to do is be negative and minimize events as they took place. 2017 melt season both in the Arctic and the Greenland ice sheet have shown a remarkable different pattern from many years leading up to this year.
So instead of acknowledging this as a significant different year that is going against the trends we have seen, they make it sounds like it was not significant at all. Like I said that is a shame.
Sad thing is that these scientists that believe wholeheartedly in AGW are almost disappointed that this happening. Have not seen any positive reactions from them saying that maybe we have reached an end to the trend and that perhaps we are now going to see a recovery. And….I am not saying that one year is the start of making a recovery, but we can at least hope that this is the first in many years of better readings in ice melt and snow fall.
Henk – There is no evidence that “we have reached an end to the trend”.
You contradict yourself from one sentence to the next! We can certainly “hope that this is the first in many years of better readings”, but hoping won’t make it happen.
Have you forgotten last winter already? Here’s another reminder for you:
I assume this shows the data you’re working with?
I didn’t say that Jim. Read carefully what I said!!
I was disappointed that there never are any positive remarks.
This year is showing results better compared to other years, whether you like it or not. This could be – didn’t say that it is- the start of the recovery.
I am not making anything happen in the Arctic nor do you! We all should hope that Arctic sea ice returns to higher levels and that global temperatures are declining. Nothing wrong with hoping.
You riding your bicycle JIM, instead of your car, will do nothing to help reduce CO2 levels; just as much as me hoping doesn’t!
It seems you’ve missed the main gist of my comment Henk?
The most recent Arctic winter was by far the warmest in the satellite era. What is there to cheer about?
Me riding my bike instead of driving my car will reduce CO2 levels by a tiny amount. It will also reduce NOx and particulate levels around here by a tiny amount. As Darren points out, it also helps keep me happy and healthy!
Riding your bike definitely makes you feel better than just hoping anything though…(nothing to offer on snow or ice sorry).
I like riding my bike because I can’t surf!
But seriously: Jim, the serious recovery in PIOMAS is a bit weird isn’t it?
PIOMAS is a model, as I’m sure Mr. Heller would tell you if it suited his purposes. Personally I doubt whether it captures all the nuances of the new Arctic.
During the aforementioned warm winter it was at “all time low” levels. Following this year’s cool summer it’s now above the all time low, but still well below 2013.
Perhaps we can all be thankful that the Arctic has dodged another bullet this year?
Maybe the Arctic ‘dodged a bullet’, but I’m not so sure about the planet. That ‘warm’ winter (actually far below 0 C) cost the planet a lot of stored heat radiating to space. I suspect the first indication of that is this summer’s ice, but another repeat of that pattern could have other effects next summer. Per DMI, we’re already seeing 80 degrees north creeping back above average (and at about -5C) after being at or below average since May. Will make for an interesting Winter. Will Greenland SMB increase for a second year? Will we see more icebergs as caving takes place under the enormous pressure of that icecap? Will some see that as a sign of warming, when it’s really just the opposite? Stay tuned!
I hope we never have another el Nino….
What do you suppose the odds are on no more El Niños ever again?
…..pretty long?
I’d say nonexistent, unless there is some very serious climatic upheaval that destroys a lot of these natural cycles. Might as well ask what happens if the Gulf Stream stops – impossible to predict, but clearly bad. A more significant worry, and one that’s easier to imagine, is if we get a higher frequency of La Ninas vs El Niño’s – lot of current speculation that we’re getting into one now, if so, any idea what that might do tocurrent ice trends?
Might I bring the attention of the assembled throng to this off topic addition to the post above. The video refused to embed in a comment, but here’s the Shock News!!!
That article on “Why Greenland’s ice caps are melting” came from the Daily Express!
It’s a video from 2016 talking about the summer of 2015.
Things have changed a bit this year.
They sure have Ari!
If you’re not from the UK perhaps the significance of the video appearing on the Daily Express web site escapes you?
Refreeze occurring. Looks like a quick reconnection to the mainland in that East Siberian sea/ laptev sea region. Splitting the Arctic into two pieces which may refreeze more quickly. Your thoughts?
Hey! Do you know the reason why the link to the daily Sea ice extent on nsidc website does not work anymore?
Works for me here: http://nsidc.org/arcticseaicenews/
I did notice, however, that DMI’s Sea Ice Thickness and Volume graph hasn’t updated since 9/10/17, sometimes these auto-updating sites go wonky and then suddenly one back
Sorry, meant ‘come back’
Here ends a very bad season.
Not being a Negative Nancy here, just realistic:
North Atlantic waters seeping into the Arctic are warmer than ever, the Nares was open all year since last year, the SSTs all around are warmer, the overall Arctic Ocean volume (ignoring thick ice crushed against land) is close to the worst state on record at start of freezing season, if not the worst, the ice itself is said to be poor quality, the fire seasons are pouring more soot over the Arctic than ever, and the fire seasons are longer than before.
This next paragraph was going to be the good news. I am trying really hard to see the good news here, and the idea that ‘we dodged a bullet’ being floated all over the internet now. I don’t see it. “Extent” is not telling the true state the overall Arctic Ocean.
These general extent graphs are deceptive. I could be wrong, because I do think volume is the most important factor, and that volume in the overall Arctic Ocean to be the most important indicator, but the overall picture is very bad.
Ok, I’ll try again to find something positive …
I’m trying… help me out here. The only positive I can think of is that bigger and bigger storms in the Atlantic could cool surface waters (but that’s not very good news for those in the path of those storms). I would hope for a really cold winter over the Arctic, but that’s not likely. The only good news is there might be more snow than previous years (due to warmer air), and that could shield the ice a little next Spring. Can it help volume by next Sept.? I doubt it.
So “dodging a bullet”, or “7th worst on record”, it is not.
But wait for the science-deniers across the right-wing news to start shouting that “”the Arctic ice is in the best shape in years, and getting better.””
If anyone can think of a positive outcome from this melt season let me know. I may have missed it.
the good news is the amo is on the decline .the 5 year trend for arctic sea ice extent is up . i believe the next 5 years will also be up. this is a good time for researchers to learn something about a major ocean cycle ,let’s hope they are paying attention.
Welcome back Chilly!
Do you by any chance have any strong views on what Arctic sea ice area will do over the next 5 years or so?
area is just extent with puddles removed jim 🙂 the refreeze every year shows that .
i expect another relatively slow growth in extent this winter, exacerbating the heat loss seen last year from arctic waters .the planet loses heat from the poles far quicker than it gains it.
will be interesting to see what this downside of the amo brings over the next decade or so don’t you think.
I’m amused by all the bollocks panic about sea ice as if it’s something really bad that there is a bit less of it.
NASA said it was 8th lowest today. So what?
https://postimg.org/image/eclph0mzp/
So the minimum ice extent has come and gone and it did in fact surpass 7 of the last 11 years. In fact, if you look at a plot of the maximum and minimum extents since “An Inconvenient Truth” was published there has been no statistically valid change in either the maximum or the minimum at all.
See http://www.theblackswanblog.com/BSB_Library/arctic_ice_extent.png
It is fair to say that sea ice extent does not tell the whole story regarding any possible effects of climate change on the far north – except that the same people making those statements have been endlessly pointing out that smaller sea ice extent is definitive evidence for anthropogenic global warming. You can’t have it both ways, folks. CO2 concentrations in the atmosphere have continued to rise for the past 11 years but there has been no change in arctic sea ice extent. Maybe, just maybe, we don’t understand the enormously complex climate of this planet as well as some of us think we do.
Davis – See above.
Sea ice extent is an indicator: complex systems are measured by indicators.
It is not the only indicator.
Multi Year Sea Ice is another indicator.
This is why we know Climate Change is a problem and even Trump knows it.
AnotherJourney (if that really is your name), none of the end-of-the-world events that were to have been caused by “the problem” has happened:
South Pacific islands disappearing? Actually, many (most?) are bigger than mere decades ago.
Permanent droughts in Texas, California, Australia, etc.? Definitely not.
Arctic sea ice disappearing by 2008, 2010, 2012, 2013, 2017, etc.? Not quite: only off by at least 3.4 million square kilometres (i.e., the size of India).
Atlantic hurricanes getting more numerous and powerful? There’s no evidence of that.
The Greenland ice sheet melting? Most years, yes, but not this year, and it was close in 2013 — though you wouldn’t haven’t read that anywhere in the MSM.
As Gertrude Stein said of Oakland, California: “There is no ‘there’ there.”
I sometimes think you and your ilk are classic examples of Maslow’s Hammer: “I suppose it is tempting, if the only tool one has is a hammer, to regard everything as if it were a nail.” Your hammer is CO2.
Michael – See above too.
Jim, thanks. It seems to me that the minimum extent trend line has shifted up from 2012 — based on the results of 2013, 2014 and 2017. It may even have shifted up from 2008. Isn’t that worth pointing out? Also, how long before the “pause” in declining extent becomes statistically significant? Five years? How long before “ice volume” becomes the sole accepted metric? Next year?
What “pause” Michael. There is no evidence for such a thing.
Remember that there’s lots of “natural variability” to bear in mind.
Jim, you may have seen: the prediction of Mr. H–ler was correct, almost to the letter. So was my prediction (check your archives) of March 5 — that 2017 minimum extent would be greater than 2016. To your credit, you did not accept my wager. Cheers.
Do you recall Toto’s prediction from last year Michael?
Which hits the nail reliably on the head?
Jim, it’s an interesting graph. But it’s only demonstrating confirmation bias. I am not a statistics wizard, but I know enough to know that you can regress almosty anything against almost anything else and get a good fit.
A suggestion, as your computer skills are far superior to mine: regress, from 1979 to this year, minimum September sea-ice extent against the export of ice from the Fram Strait. That is, put down your hammer and pick up another tool.
Michael said : “regress, from 1979 to this year, minimum September sea-ice extent against the export of ice from the Fram Strait.”
You can do so yourself. And please add why that regression has any significant meaning.
Michael: you don’t get to tell other people what to do unless you’re fascistic, or….give them your rationale!
Which is it to be?
I, for one, demand your rationale for such a request!
Hey, I know: why don’t we just regress everything against everything and you can do it all for us just in case we need everything?
Michael, in other words: are you a tool?
Nice graph!
“”South Pacific islands disappearing? Actually, many (most?) are bigger than mere decades ago.””
What planet are you on.
https://www.theguardian.com/environment/2016/may/10/five-pacific-islands-lost-rising-seas-climate-change
“”Permanent droughts in Texas, California, Australia, etc.? Definitely not.”’
The precursor already happened. What planet have you been living on.
”’Arctic sea ice disappearing by 2008, 2010, 2012, 2013, 2017, etc.? Not quite: only off by at least 3.4 million square kilometres (i.e., the size of India).””
If it goes down another million k, I’m pretty sure you won’t care about the next million, because your house will be leveled by a tornado by then.
“”Atlantic hurricanes getting more numerous and powerful? There’s no evidence of that.””
What fucking planet are you on you clueless fuck.
Andrew versus Irma.
https://images1.miaminewtimes.com/imager/u/745xauto/9657002/screen_shot_2017-09-08_at_8.10.33_am.png
Now get ready for the next one coming to S. Carolina.
”The Greenland ice sheet melting? Most years, yes, but not this year””
Science much?
Get an education before you spew your ignorance on the internet.
Tommy – Your comment entered the moderation queue because you used some “bad language”. Do you suppose you could tone it down in future?
Jim, I appreciate your asking Tommy to tone down his language, but it was the lack of data to back up his rebuttal that bothered me. I had to go all Huxley on his Wilberforce in my reply….
You found a few “Islands” the size of a football field or 2 as examples. Did you check if it was sea rise or land sinking that did them in? Even NASA has average sea-rise at 0 in the last few years.
Tommy,
To rebut my claims, you supplied one Guardian article and one photograph. If you have more data, please let us all know. As I wait, I have taken your advice and done some more research:
South Pacific Islands
The Guardian article you cited was effectively retracted by the Guardian within days. (Google “headlines exaggerated south pacific”. The retraction is the first hit.) In the rectraction/correction, the study’s author, Simon Albert, said the original article, from Reuters, exaggerated and largely misinterpreted the science of the study.
On the contrary, in June 2010, Paul Kench, from Auckland University, expressed surprise at the results of his study: that, of 27 South Pacific islands studied for 20 to 60 years, 80 per cent had stayed the same size or grown larger. (Google “paul kench south pacific”.)
Permanent Droughts
You wrote, “the precursor already happened.” I have no idea what you mean. The first Google hit for those words is from The Matrix Reloaded, but I don’t think that’s what you meant.
Arctic Sea Ice Disappearing
The trend for minimum extent is sideways for the last 10 years. That is a fact. The last 3.4 million square kilometres of ice is proving to be stubborn (at this point). And, by the way, we don’t get many tornadoes where I live, nor is the frequency increasing.
Atlantic Hurricanes
I acknowledge that I used “powerful storms” as shorthand for “accumulated cyclone energy” (ACE). However, according to Wikipedia (correct me if I’m wrong), the five strongest individual hurricanes were from 1899, 2004, 2017, 1893, 2003 and 1932. I’m not sure what trend we can glean from that. So, let’s look at the graph in Wikipedia for ACE for hurricanes in the Atlantic Basin going back to 1950. I see no trend, up or down.
Greenland Ice Sheet
I’m pretty sure that, with the data available, I have already demonstrated on this website that the ice sheet grew this year. As I recall, NSIDC agrees with me, as does DMI.
I believe that’s it, Tommy. As mentioned, with all sincerity, correct me if I’m wrong.
pre·cur·sor
prēˈkərsər/
noun
a person or thing that comes before another of the same kind; a forerunner.
“”The trend for minimum extent is sideways for the last 10 years.””
I was walking the other day, and the whole landscape was flat. Therefore the Earth is not round.
“”for hurricanes in the Atlantic Basin going back to 1950. I see no trend, up or down.””
Tell that to the people of Barbuda or Puerto Rico.
You need to check not just intensity of wind of hurricanes (since there are upper limits to wind speeds on ground level) but the amount of WATER in the storms. MUCH MUCH bigger (as predicted by climate-scientists for decades.)
Excluding thick ice crushed against land, the overall Arctic Ocean itself is close to, or at, the lowest ice VOLUME on record. It’s the overall Arctic Ocean that counts, not some fjords in the north of Canada or thick ice clinging to land.
The NSIDC measures sea-ice of the Northern Hemisphere.
I look at the Arctic Ocean only to see how the Arctic Ocean is doing. It has never been in worse shape, both in volume, and it integrity.
Where do you live by the way? because if you don’t get tornados, I bet I can predict the next climate disaster coming to your door.
Michael, are you saying the Internet wasn’t designed to be used anonymously?
Hey, why don’t you tell me what religion to practise while you’re having a whinge?
https://postimg.org/image/eclph0mzp/
Tommy,
Your histerics not withstanding, the graph you linked proves our point. Note the “flat” trend line in the 80s/ early 90s that then breaks downward. However, for some reason they don’t perform the same exercise in 2007, when the trend again breaks and goes flat from then until present. That’s the 10 year “pause” referred to above. That is also the trend about which there is much speculation – Will it continue? How long would it need to last until science recognizes it as significant? What does it mean in terms of the ice dynamics or general warming trends or CO2 causation?
Hopefully this will lead to some real science vs. your uninformed hand-wringing
@Taylor.
I don’t think you understand how graphs work.
And there was no ‘pause’. That’s a myth. The oceans are heating up. That’s all that counts. You are being brainwashed. When the oceans heat up, you and yours …. are dead.
I know how graphs work, having studied and taught mathematics, and making some of my living doing (and explicating) data analysis. What I pointed out was that the graph you linked to showed a straight line trend at the beginning, then steadily declining, but neglecting to go flat again in 2007. Take a look and calculate the trend over the last 10 (now 11, since we have 2017 data) and tell me what the slope is. Compare that to the slope shown starting in 1979. This is an open book test, but you must show your work.
“”What I pointed out was that the graph you linked to showed a straight line trend at the beginning””
You really don’t understand graphs. It’s an average. It is not supposed to be a work of art. It just shows the overall picture, as is all that CAN be done.
It’s a rough guide to the reality.
You are the one disputing NOAA data, so YOU calculate the trend over the last 10 years, AND SHOW IT.
And here is my extrapolation of the data – in red.
The end result is the same —> https://postimg.org/image/isuelohut
Tommy, Tommy, Tommy,
Re: “…amount of water…” in your hurricane comment above: look up Hurricane Flora (1963). Dumped 57 inches over Haiti, then stalled over Cuba with 100 inches in one location. In the future, please argue with data, not anecdotes, and try to remember that we’ve been having weather (and climate) for a very long time, and everything that’s happening is highly likely to have happened sometime before, including nearly ice-free Arctics.
Wrong.
The amount of rain in a hurricane is not measured by how much it dumps in one or two local places.
The biggest hurricane ever seen, could arise, and dump 10 times the rain of any storm ever … over open ocean, over zero islands.
Do you see the difference?
Climate change is not about how much rain you get at your house. It’s about predictions, by scientists, that storms will get bigger, badder, stronger … even if unloading over uninhabited ocean. That was the prediction, and that is what is happening.
Get an education. Ridiculous comments you are making. Clueless.
Read it and weep:
Irma was the first Category 5 hurricane to strike the Leeward Islands, followed by Hurricane Maria only two weeks later.
https://en.wikipedia.org/wiki/Hurricane_Irma
Both Harvey and Irma were FAR bigger rainstorms over the course of their track than anything you are referring to, re. localized rainfall events.
Tommy,
Welcome back. Now that you are making more specific arguments, the discussion and rebuttal can continue. While I work on some specifics to show you how graphical trending is done, ponder the following from a former Director of the National Hurricane Service (Dr. Neil Frank) concerning the misplaced hysteria about Harvey/Irma and their power/rainfall amounts. He articulates it far better than I can summarize, and it would be difficult to argue that he’s not an expert on the subject:
https://wattsupwiththat.com/2017/09/25/enough-is-enough-stop-hyping-harvey-and-irma/
and after reading that, perhaps you can enlighten me as to how you are measuring total rainfall of a hurricane over its entire track. There is a way to estimate, per Dr. Frank, based on the ground speed of the hurricane, but I’ve never seen it used to make an estimate over water.
So while you’re at it, please give me the data – how does Harvey’s total rainfall over its entire track compare to the example I cited, Flora? For that matter, how does it compare to Irma? Please cite the answer in total inches of rain, or some equivalent metric, so I can be better informed.
[Modified link – Mod]
Taylor – If you’re a fan of Anthony Watts work perhaps you wouldn’t mind popping in to WUWT and asking him to retrieve this recent comment of mine from his cutting room floor?
Taylor said : ” in your hurricane comment above: look up Hurricane Flora (1963). Dumped 57 inches over Haiti, then stalled over Cuba with 100 inches in one location. In the future, please argue with data, not anecdotes,”
Interesting that you give an anecdote, and then tell Tommy not to use anecdotes.
Physics tells us that if the water is warmer, that hurricanes will get stronger. And this paper shows that indeed that is what is happening ; that the strongest storms are getting stronger :
http://www.nature.com/news/2008/080903/full/news.2008.1079.html#B1
Did you expect that in a warming world everything would just stay the same ?
“When the oceans heat up, you and yours are dead…”.
You mean like the Holocene Climate Optimum, when ocean (and land) temps were much higher and so were sea levels? My ancestors were just fine, thanks, as they were in every warm period (Minoan, Roman, etc. ) since. Might have been bad for the Neanderthals, but frankly, I don’t miss them, and neither, at the time, did my ancestors. Are you paid to be this misinformed, or just miseducated? There are many good arguments for AGW, as I’m sure Jim can attest, but you have yet to articulate any.
@Taylor.
The Holocene Climate changed over thousands of years, not a sudden global shift over 200 years that will cause massive upheaval and chaos, and life had time to move and adapt in the Holocene. It was MUCH more balanced change, because that is how nature on Earth works…through balance. Which human ignorance has broken.
(the US military is preparing massively for abrupt climate-change caused by human pollution, because they know the science is correct, despite your Drumpf leader)
You will not survive in a Holocene environment. You haven’t thought it through.
The world population in the Holocene era was around 4 million people, or half of the current population of London.
There were 3.1 BILLION people on the planet when I was born in 1961, and now there are 7.3 BILLION polluters.
Do you see the difference between the Holocene and now?
You and yours are 100% incapable of the hunter-gatherer life of the Holocene. Please stop thinking you are some tuff guy from the past. Or some futuristic Flash Gordon. You and yours are neither. Nature is going to smack you so hard you will be reeling in PTSD shock for years, as you watch your children and grand children flailing helplessly in front of you.
Humans can still make it, but not by any logic, learning, experience, or insight, that you can bring to the table.
Let me know where you live and I’ll educate you as to what is going to happen in your region.
@Taylor Pohlman
“” ‘Watts Up With That?’ is a blog promoting climate change denial … The blog… generally accommodating beliefs that are in opposition to the scientific consensus on climate change.”” https://en.wikipedia.org/wiki/Watts_Up_With_That%3F
The weatherman, Dr. Neil Frank, who they cite, is again talking about local events caused by the hurricane, not the actual hurricane, which had it’s track from the eastern Atlantic all the way eventually to Georgia.
Taylor: “”and after reading that, perhaps you can enlighten me as to how you are measuring total rainfall of a hurricane over its entire track. “”
It is pretty easy to see the rainfall in a hurricane.
In this animation I created from Nullschool, in the link below, you see Harvey form on the left. Light blues and white show high Total Precipitable Water. Wether that water fell over land or not is irrelevant, or even if it fell at all. The weatherman you cite is, again, only talking about local events. Not the whole animal.
https://media.giphy.com/media/xT9IgEo1b66RzjW0jC/giphy.gif
And in the link below here is a photo of the little Hurricane Claudette which Frank cites to make his point – only because it lingered over land for a bit longer than usual. That’s the only reason he mentioned it. That is why he will be remembered as a weatherman, rather than a climate-expert. Citing local events does not tell you anything about the size and power of the hurricane (just like the Flora local event you cited). Claudette, and the others Neil Frank cites, were small. He’s using local epiphenomena to try to deny climate-science. These recent hurricanes MAY not be the worst on record, but nothing you, or he cites has any relevance to that ongoing analysis. 2017 is shaping up to be the worst season on record.
‘lil ol’ Hurricane Claudette:
https://upload.wikimedia.org/wikipedia/commons/8/81/Claudette_24_jul_1979_2040Z_TN.jpg
Hurricane Irma:
http://images.deccanchronicle.com/dc-Cover-8adfl7bc7qo2c7gbvl1ah3esc7-20170911141016.Medi.jpeg
.
PS. That animation I made shows Harvey forming, and Irma, and Jose, and Maria. Forgot to mention the whole thing.
Sorry Tommy – “hysterics”, not histerics in note above (although maybe “histerics” could mean ‘really upset about the past’, which would make your condition “futueristics”
Tommy,
After some early, albeit misinformed posts, all I’m hearing from you lately is ‘crickets’ – did you run out of retorts, or was it just that the Soros check bounced?
See my answer to you above, and the other guy. And let me know what your retort is. Please use bullet points, logic, and systematic thinking. Not emotional climate-science denial. Thanks.
Looks like Pohlman is the one running away when the evidence overwhelms him.
This year’s extent graphs have very flat bottoms. JAXA has just resumed 5th place:
It looks as though the high res UH AMSR2 extent will follow suit shortly:
Jim, on a somewhat related topic, did I correctly hear that a number of ice bouys are being deployed for this upcoming winter? If so, do you have any details and sources for data?
Maybe the ailing sea ice in the Arctic will get some respite soon?
https://www.theguardian.com/world/2017/sep/24/bali-volcano-34000-flee-mount-agung-as-tremors-intensify
Good question – is there potential for a Pinatubo-scale event? If so, with quiet sun an potential La Niña, we could be in for a cold spell – not good, but certainly classic “natural variation”
Tommy,
I see you care deeply about climate change, and I applaud that.
From what I read, you have refuted none of my claims about all the climate change predictions being wrong to this point. Then again, neither has Jim or Bill or Matthew or any other reader of this blog.
You told me and Taylor to get educated. Okay. Happy to comply. Please remember, though, that just because Taylor and I (and others) disagree with you doesn’t mean we’re wrong.
Also, on blogs like this, can we keep the language civil? There’s no need for name-calling. Can we please act like gentlemen?
You asked where I live. Would you believe:
23 Mimosa Avenue, Trelew, Cornwall?
Cheers.
Jim,
I have to admit: you are indefatigable. Like in Monty Python and the Holy Grail, you are the Black Knight of climate change bloggers:
Michael: “The Greenland ice sheet likely grew this year.”
Jim: “No, it didn’t.”
Michael: “Yes, it did. NSIDC and DMI both say so.”
Jim: “‘Tis only a blip.”
Michael: “The minimum Arctic sea-ice extent is trending sideways the last 10 years.”
Jim: “No, it isn’t.”
Michael: “Absolutely, it is. Check the chart you posted on September 23 and look from 2007 to today.”
Jim: “There is no evidence of any ‘pause’ in sea-ice extent decline.”
I wonder what it’ll be next?
Sadly, while you are indefatigable, I am not….
Cheers.
Michael said “The minimum Arctic sea-ice extent is trending sideways the last 10 years.”
Only if you start in 2007. Which was a deep new minimum.
That very similar to starting temperature 1998 and then claim a temperature ‘pause’. Heck, we have seen that kind of crooked statistics before :
https://static.skepticalscience.com/pics/SkepticsvRealistsv3.gif
Why Michael ? Why are you revamping debunked statistics and apply them to Arctic Sea Ice ? Do you really think that in a warming world Arctic Sea Ice will somehow miraculously stay the same ?
Rob – Don’t forget the sterling work of our very own Bill the Frog:
https://greatWhiteCon.info/tag/bill-the-frog/
rob, what effect, if any , do you think the declining amo will have on arctic sea ice extent in the next decade ?
Michael said “Michael: “Yes, it did. NSIDC and DMI both say so.”
Jim: “‘Tis only a blip.””
The “blip” comment actually was from Dr Ruth Mottram, Dr Ruth Mottram, Dr Martin Stendel :
“Overall, initial figures suggest that Greenland may have gained a small amount of ice over the 2016-17 year. If confirmed, this would mark a one-year blip in the long-term trend of year-on-year declines over recent decades.”
The real indicator is MYI. Of course, it’s harder to measure.
“What is the state of the multi-year sea ice in the Arctic?”, will be the never ending question for this Earth from now on I’m afraid.
Jim, thanks for the tip. I’ve been on hiatus myself, somewhat, wandering attentively into US hurricanes (and the horrors of our politics of hate), noting Earth Observatory’s update on Larsen C’s Iceberg A68*, and trying to focus on my artwork for a show coming up.
* https://earthobservatory.nasa.gov/ ; especially: “Daylight Returns to Larsen C” https://earthobservatory.nasa.gov/NaturalHazards/view.php?id=90968
And I see there’s news: “Rift on Pine Island Glacier” https://earthobservatory.nasa.gov/NaturalHazards/view.php?id=91022&eocn=home&eoci=nh
We were ahead of NASA on the PIG story Susan. See:
https://greatWhiteCon.info/2017/09/pine-island-glacier-calves-again/
Good luck with your “Open Studio” event.
Dear Susan, “Take your art seriously, life never!”
I forget who said that….
Back to nuts and bolts for a second: this https://sites.google.com/site/arctischepinguin/home/global-sea-ice worries me!
Found it: https://drive.google.com/file/d/0B1HTR0ONiUmEMGowLTFRZUtCYnc/view
Freezing Degree Days recovered many many months ago, but still problematic you would have to say!
You’d have to describe this graph as exhibiting some type of trend, wouldn’t you? Or am I unable to say that with this graph and no other context?
I mean: that’s what we don’t want to see, I suppose, because then it would truly be too late to turn this fair mudball around but that is what the denialists want to see before they will admit to Houston that there is a problem !
Michael Olsen:
You asked for direct rebuttals to the following “events” you described way up yonder on September 25, yet remain miffed you never received any. Many people would describe each assertion you posed as a suspected straw man argument, and have seen similar ones for years ad nauseam. It follows they would consider such arguments as unanswerable and move on.
Michael Olsen said:
”AnotherJourney (if that really is your name), none of the end-of-the-world events that were to have been caused by “the problem” has happened:”
Did someone give a deadline for the following things you describe? Were there specific events that should have already occurred? Who said it and when did they say it would happen?
Please post at least one legitimate link to backup each of the predictions you say have been made:
MO said:
“South Pacific islands disappearing? Actually, many (most?) are bigger than mere decades ago.”
As sea level continues to rise and accelerate some islands will become submerged. Should this have already occurred?
MO said:
“Permanent droughts in Texas, California, Australia, etc.? Definitely not.”
What’s a “permanent drought?” Did somebody say there should be permanent droughts by now, anywhere, ever?
MO said:
“Arctic sea ice disappearing by 2008, 2010, 2012, 2013, 2017, etc.? Not quite: only off by at least 3.4 million square kilometres (i.e., the size of India).”
Who said Arctic sea ice would be gone by 2017, or by any of those dates?
MO said:
“Atlantic hurricanes getting more numerous and powerful? There’s no evidence of that.”
Actually, there is evidence cyclone power is increasing as the atmosphere contains more water.
MO said:
“The Greenland ice sheet melting? Most years, yes, but not this year, and it was close in 2013 — though you wouldn’t haven’t read that anywhere in the MSM.”
”Most years, yes.” You said so yourself. You have a problem with the corporate media? Welcome to the club.
Again, please provide links to back up each of your “predictions,” who made them and they said these events would happen. Links to fossil fuel industry front groups, libertarian, or sites run by engineers or TV weathermen do not qualify.
Here’s an example of a model which failed miserably:
http://news.bbc.co.uk/2/hi/science/nature/7139797.stm
12 December 2007
Arctic summers ice-free ‘by 2013’
“Scientists in the US have presented one of the most dramatic forecasts yet for the disappearance of Arctic sea ice. Their latest modelling studies indicate northern polar waters could be ice-free in summers within just 5-6 years.
[…]
Our projection of 2013 for the removal of ice in summer is not accounting for the last two minima, in 2005 and 2007, the researcher from the Naval Postgraduate School, Monterey, California, explained to the BBC.
So given that fact, you can argue that may be our projection of 2013 is already too conservative.”
10 years later we’re at the 8th lowest extent, not even close to the 2007, 2012 minima …
It is clear that on a warming planet the really long term trend for sea ice can only be down; glaciers are in retreat too. But on a year by year, decade by decade basis the situation is more complex. We just can’t tell what 2018 will bring; a new record low, or another year comparable to the recent average? Our knowledge is incomplete and so are the models. This remark in NSIDC’s Sep 2016 news (https://nsidc.org/arcticseaicenews/2016/09/) illustrates it quite well: “That September ice extent nevertheless fell to second lowest in the satellite record is hence surprising.”
Instead of ignoring everyone who points out that the last 10 years of minimum sea ice extent show no discernible trend, it would be good to acknowledge this indisputable fact, look for explanations and stop using short term trends as if they are representative of the future. Failed doomsday predictions like the one above will only backfire and hurt credibility of climate science.
Rene – I suggest you read this:
https://greatWhiteCon.info/2013/09/shock-news-why-isnt-the-arctic-ice-free/
Multi year ice is an interesting concept.
When do we measure it and what percentage do we quote?
Apparently it is nearly all multi year ice now at the end of September.
So the lowest percentage must be at the winter maximum, is that right?
Or is it in early September in a bad melting year with a lot of Fram multi year ice loss?
So we use the lowest amount of ice left from the start of this freezing season.
The only truly reliable estimate is the minimum volume each year.
So this should qualify as the 3rd or 4th lowest multi year ice??
They would not do it on extent surely.
Myi is the one: of course it’s also the hardest to measure!
The maximum extent was the lowest in the satellite record, and the minimum was just fractionally above the trend line.
Surely minimum was at an all time near average and maximum extent was slightly low?
We are dealing with only 38 years of data here.
Would like your views on MYI, definitions and treatment thereof .
It would seem after 21/9/2017 it is all technically MYI for one brief instant which then degrades as new ice forms and some old ice continues to be lost during the year. So technically the figure we use is the last one just before refreezing date which is set by decree.
Hence there is always a baseline figure ? 1979 for the satellite record which by definition must be a lot less than 100%.
By way of illustrating multiyear ice categorisation, please watch this video carefully:
Immediately following the September minimum all the ages increment by one year, and can therefore be classified as “multiyear ice”. Then the dark blue area covered by first year ice grows as the freezing season progresses.
angech: “”Surely minimum was at an all time near average and maximum extent was slightly low? We are dealing with only 38 years of data here.””
The average you are speaking of includes the last 10 years of many record low extents. If the average only included data up to Yr. 2000, then the ‘average’ (gray region) would be much higher up the chart on this graph for example —> http://nsidc.org/arcticseaicenews/charctic-interactive-sea-ice-graph/
The last decade or so has included the lowest minimums on record, and that is causing the ‘average’ to shift downward on the chart.
It’s like the drought in California, now includes the worst drought on record, 5 years, some say worst in memory, so the average for the drought seasons is now much worse than it was, say, 7-8 years ago.
There is nothing ‘average’ about the 2017 minimum. From the big.picture, it sits right alongside the worst years on record, barely discernible from them in the big picture.
I agree though, 39 years does limit the really big picture, but all the other evidence other than simple ‘extent’ graphs are abundant, and suggest the stream of low minimums in the last 10 years or so, is bad news overall. It ain’t coming back, sad to say.
.
are you suggesting there will never be another ice age by saying “it ain’t coming back” ? that’s a new one on me if so .
“bit chilly”
No. The ice ain’t coming back.
Bit chilly, who taught you about ice ages?