A detailed dissection of the 2021 minimum of various Arctic sea ice extent metrics can be found on a dedicated thread. All other Arctic news in September will be found below.
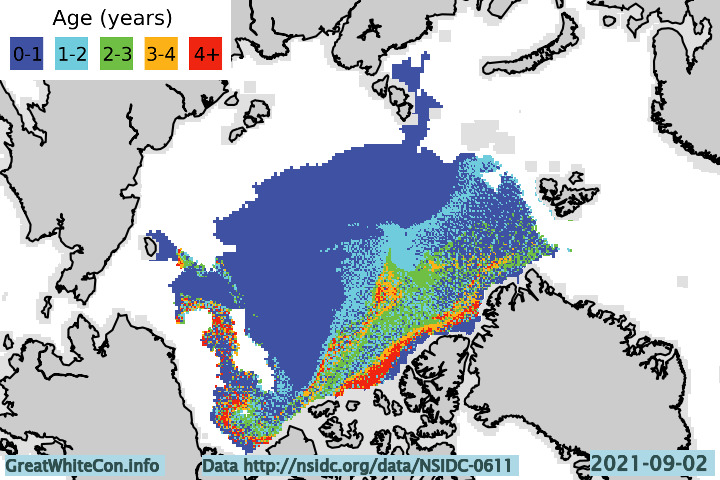
Let’s start with a map of sea ice age at the beginning of August:
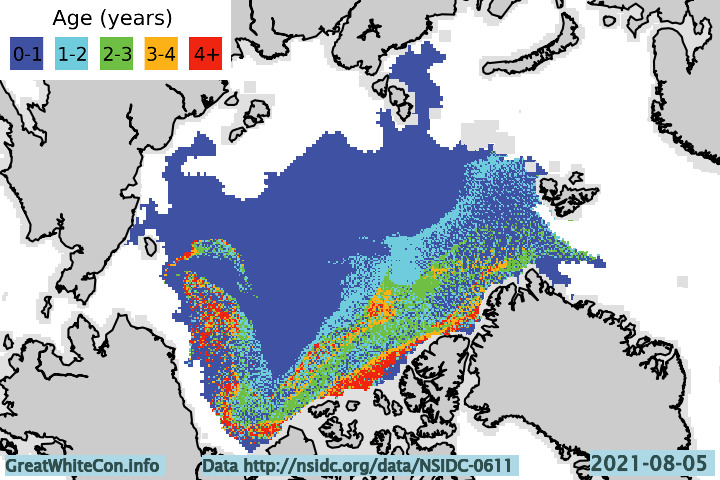
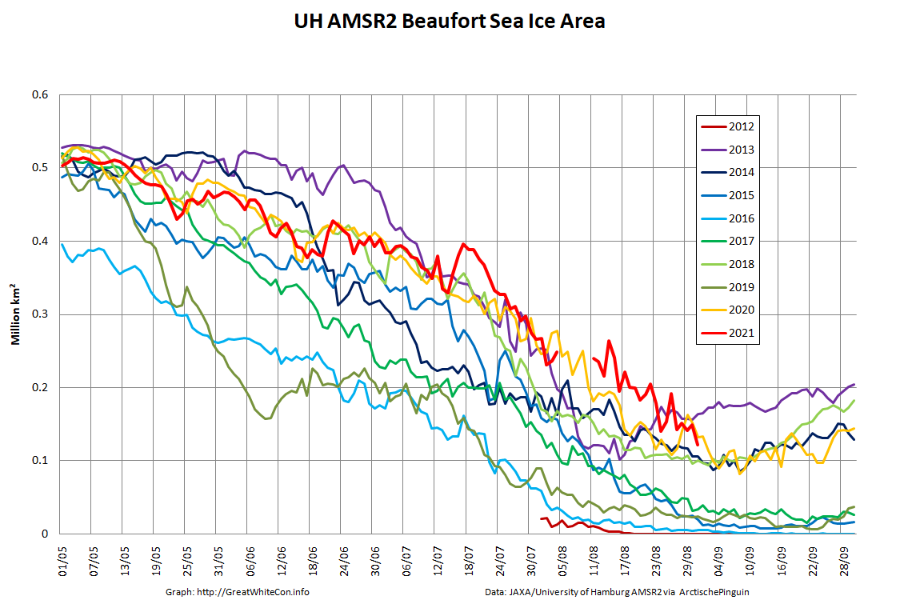
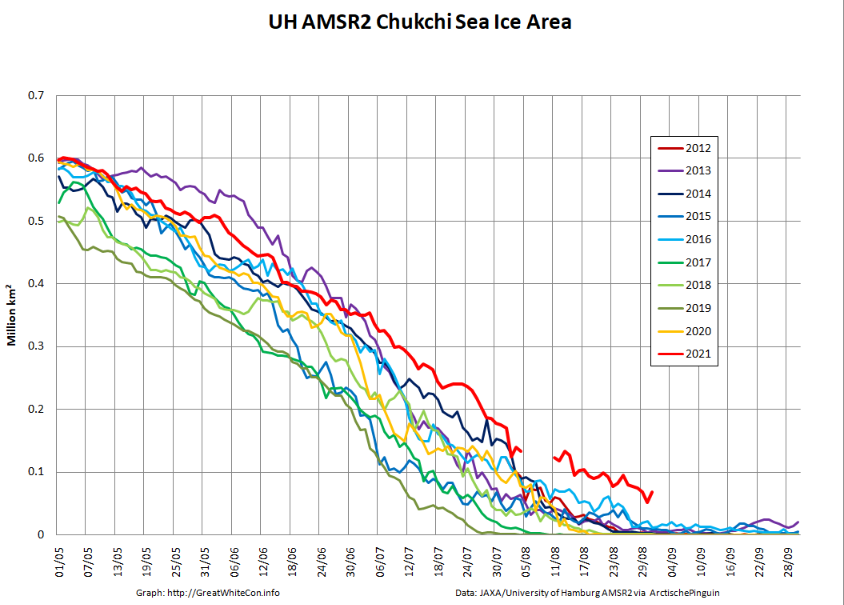
Firstly notice the absence of 3+ year old ice off the coast of north east Greenland. Also visible is a band of 4+ year old ice across the Pacific side of the Arctic Basin, which has slowed melting in the region and explains the following regional sea ice area graphs:
Next here’s the current AMSR2 concentration map:
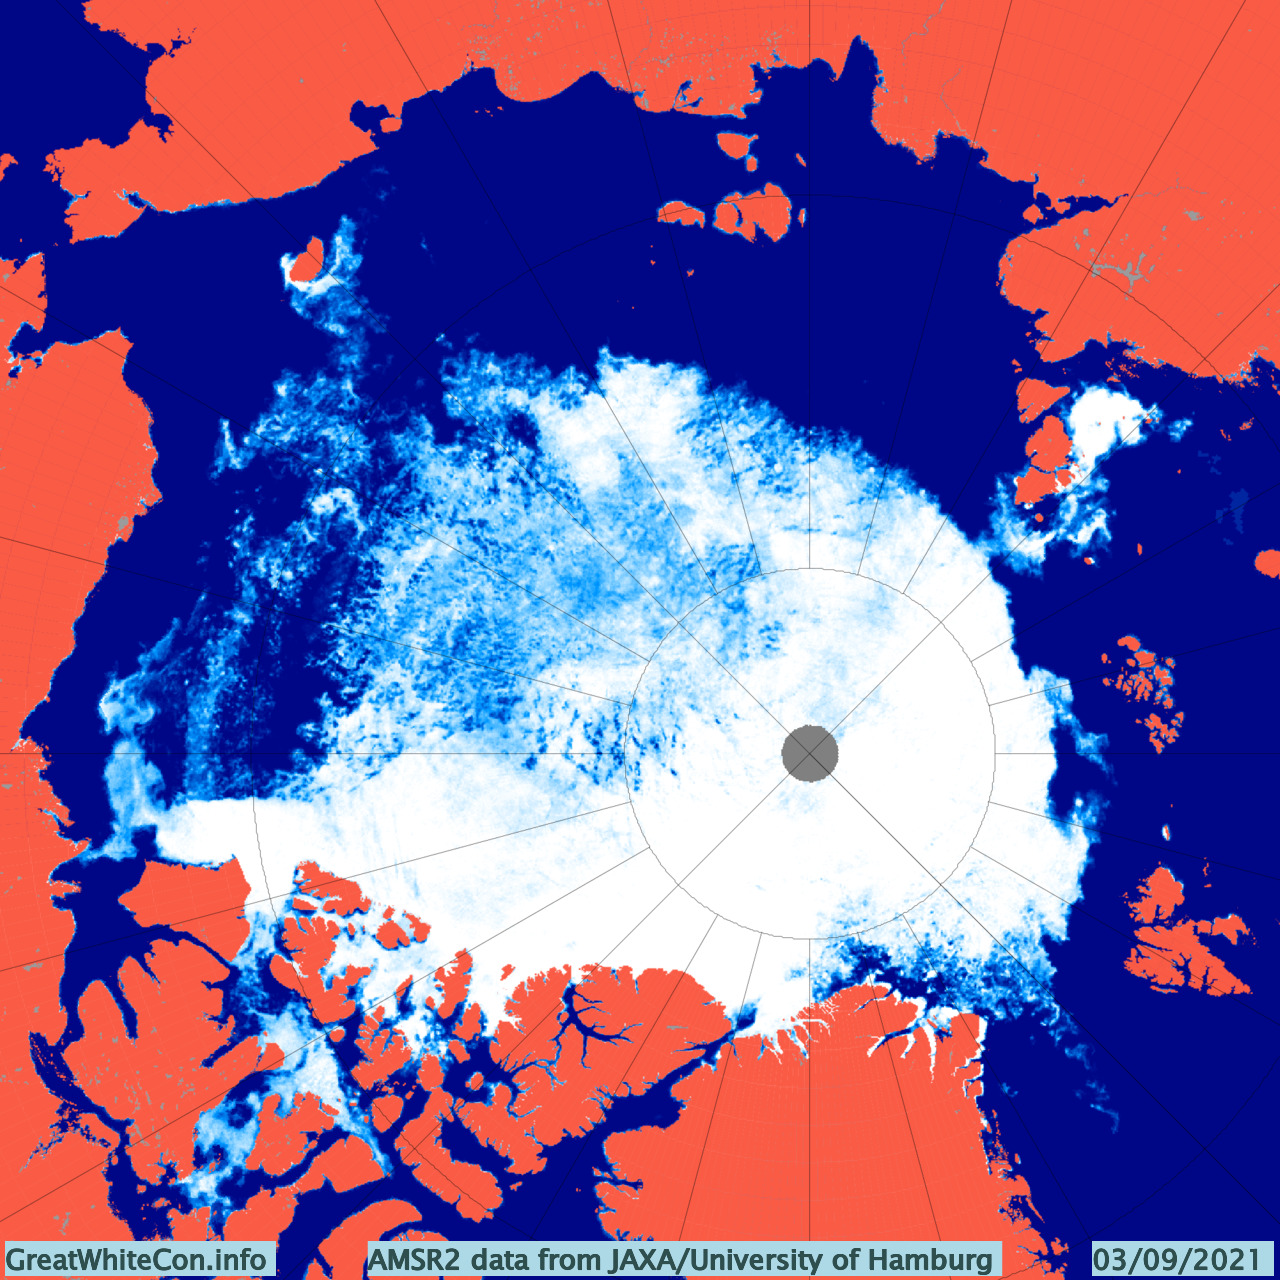
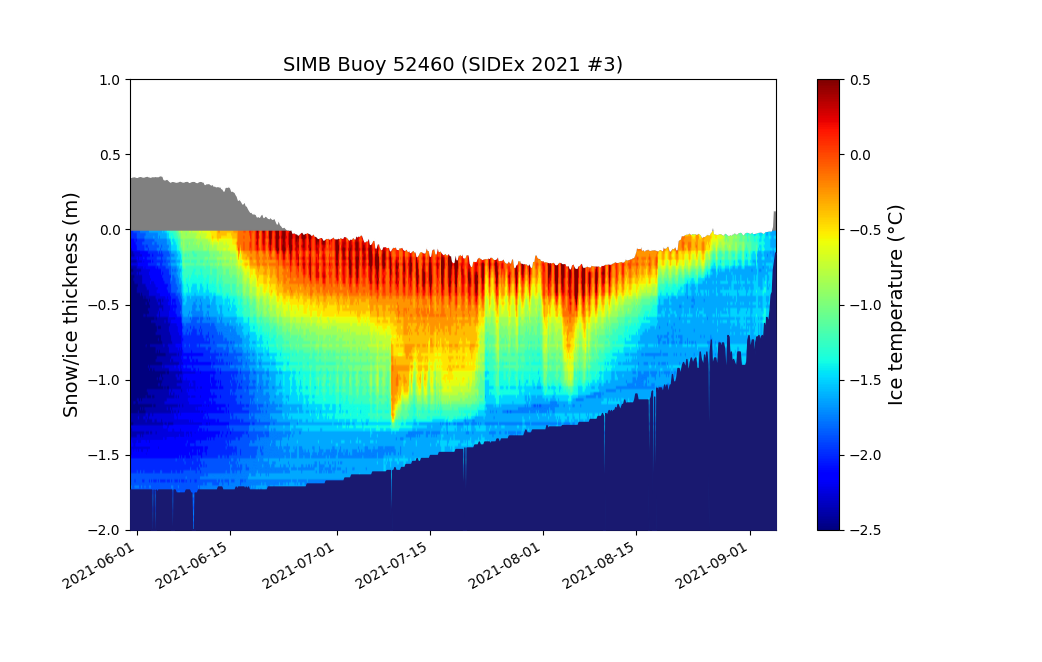
There is currently a large area of open water in the Wandel Sea to the north of Greenland. There is also an arm of old ice across the Beaufort and Chukchi Seas which is still clearly visible, but also visible is the recent reduction in sea ice concentration in the region. By way of explanation, here’s another look at the thickness of an ice floe currently situated to the north of the Chukchi at 74.84 N, 164.29 W, as measured by an ice mass balance buoy:

As the 2021 melting season draws towards its conclusion the floe is experiencing rapid bottom melt. How much longer will this floe and others like it last? Will it survive to become an “old ice” dot on next year’s ice age maps?
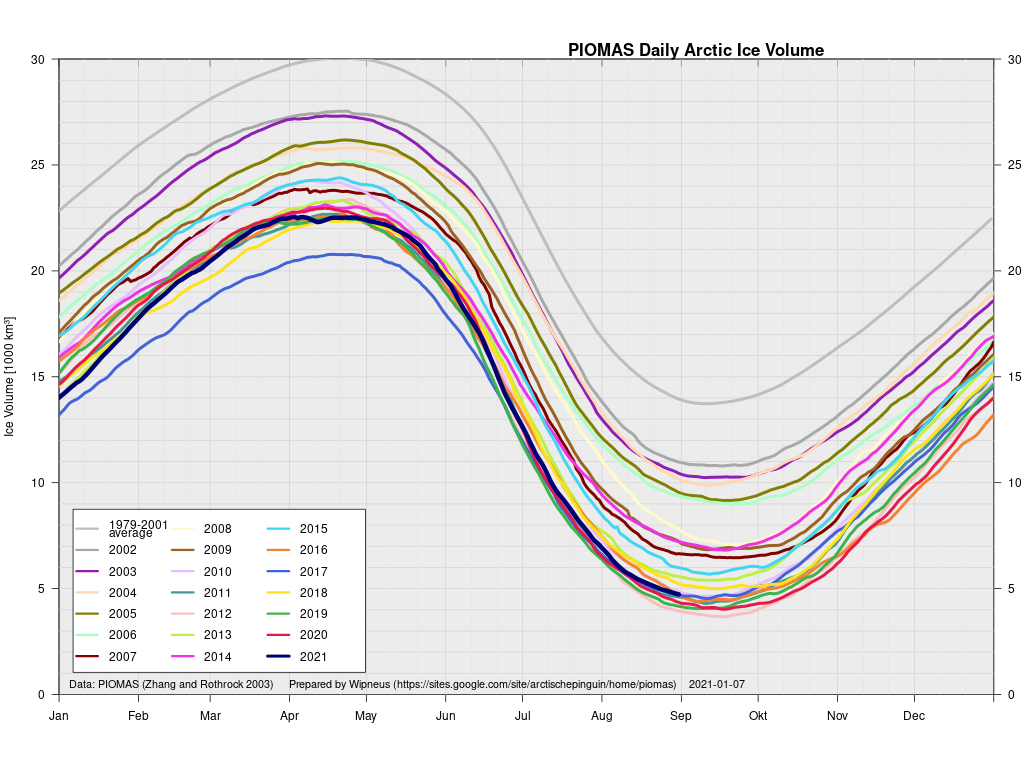
[Edit – September 6th]As Wipneus puts it on the Arctic Sea Ice Forum, “PIOMAS has updated the gridded thickness data up to the 31st of August”. Here’s the latest modelled thickness map, which shows the thickest remaining ice located north of the Canadian Arctic Archipelago rather than north of Greenland:

The accompanying volume graph shows 2021 in 7th lowest position, at 4.7 thousand km3:
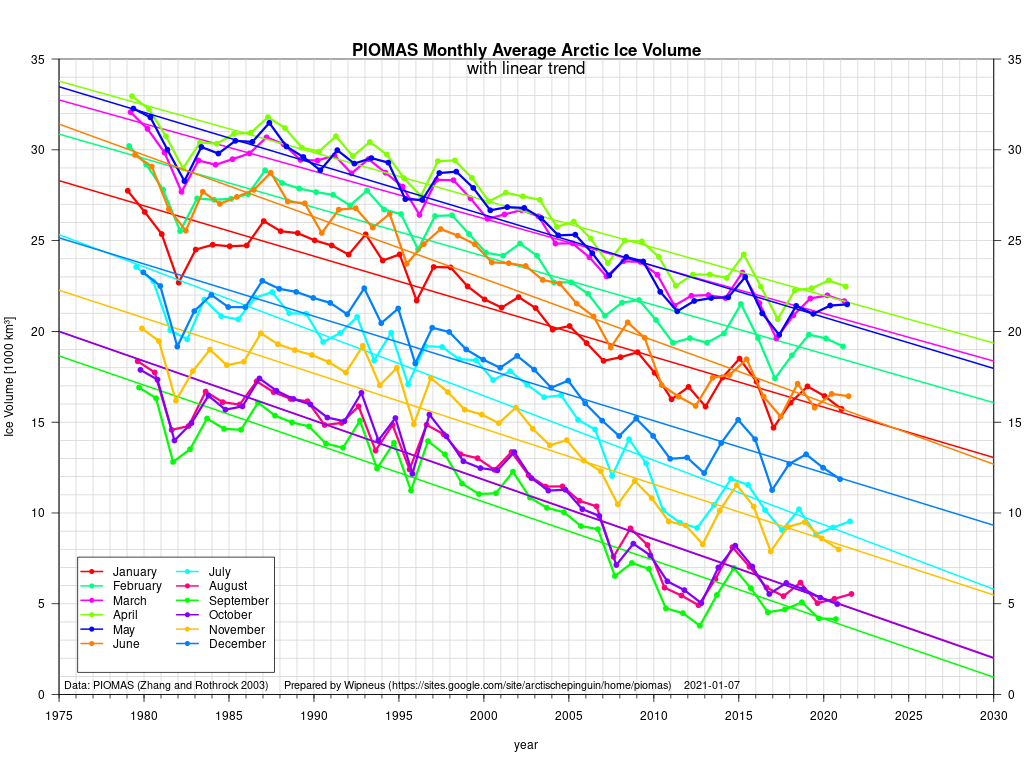
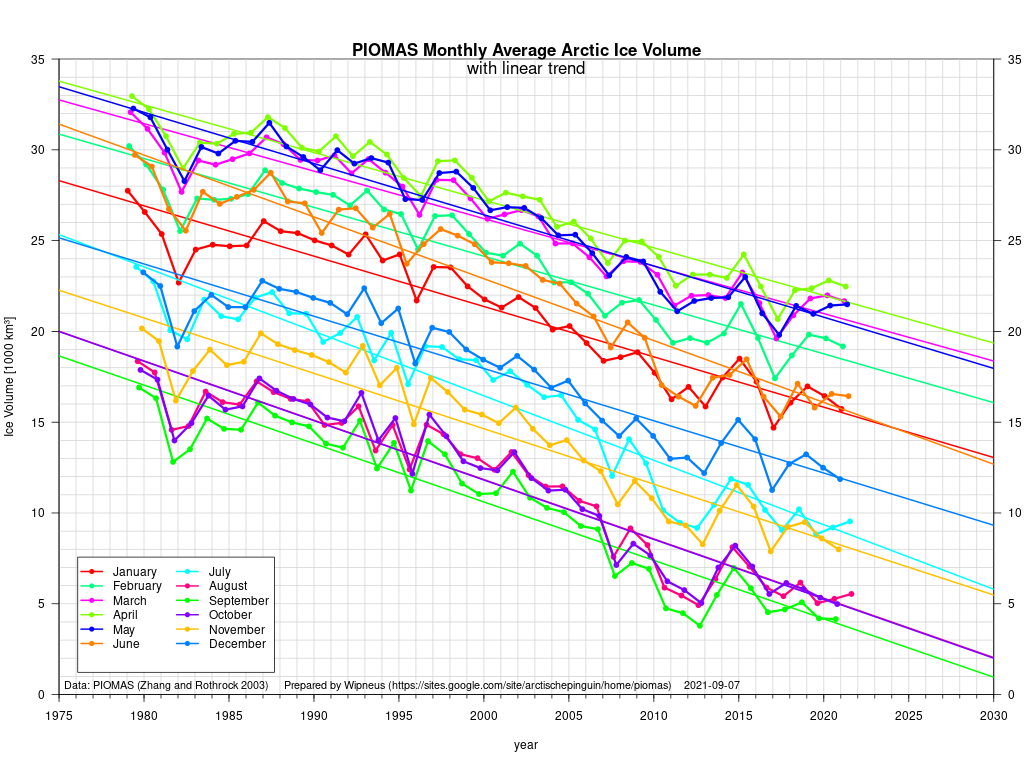
Here too are the current PIOMAS volume trends for each month of the year:
The Swedish icebreaker Oden has recently been exploring the area between northern Greenland and the North Pole as part of the Synoptic Arctic Survey expedition:
Here are the measurements of water temperature it has recorded over the past few days:

Ranging between -0.4 °C and -1.0 °C it doesn’t look as though the 2021 refreeze will be starting in the Wandel Sea just yet.
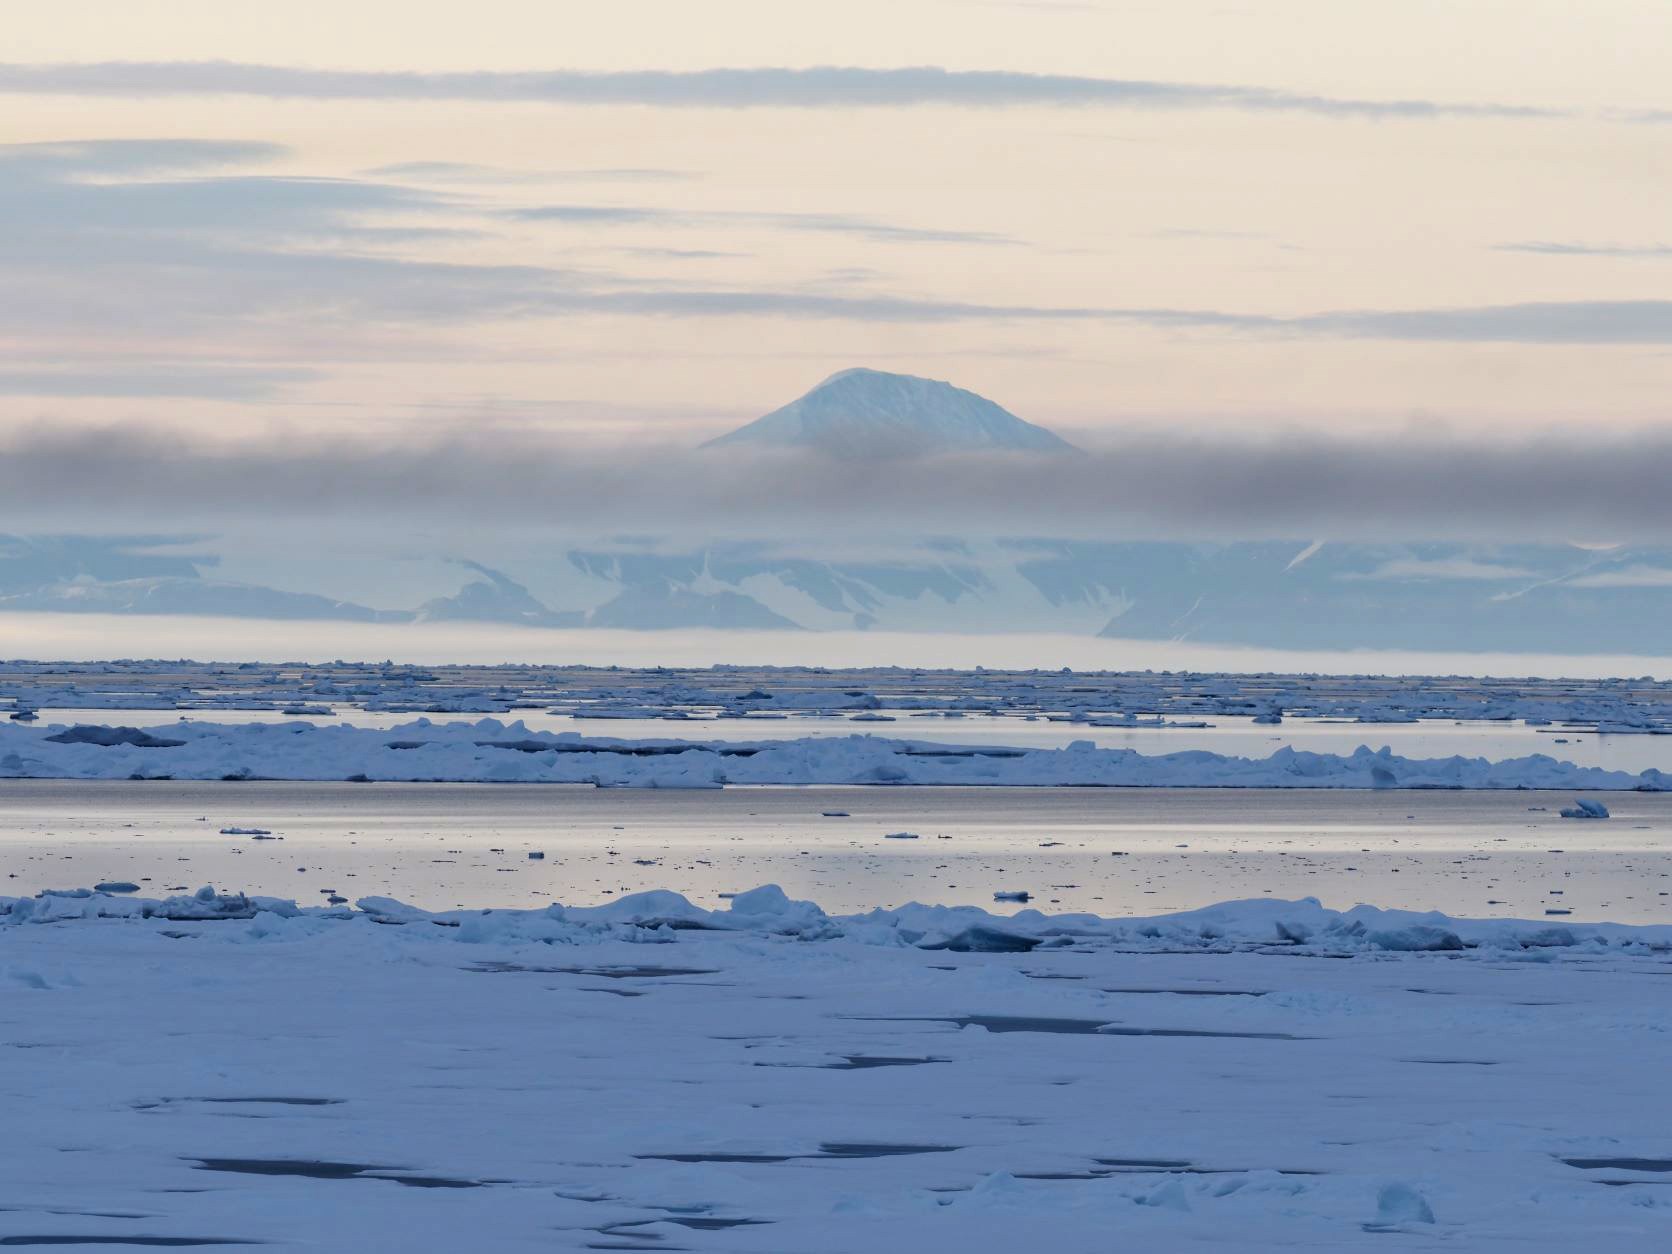
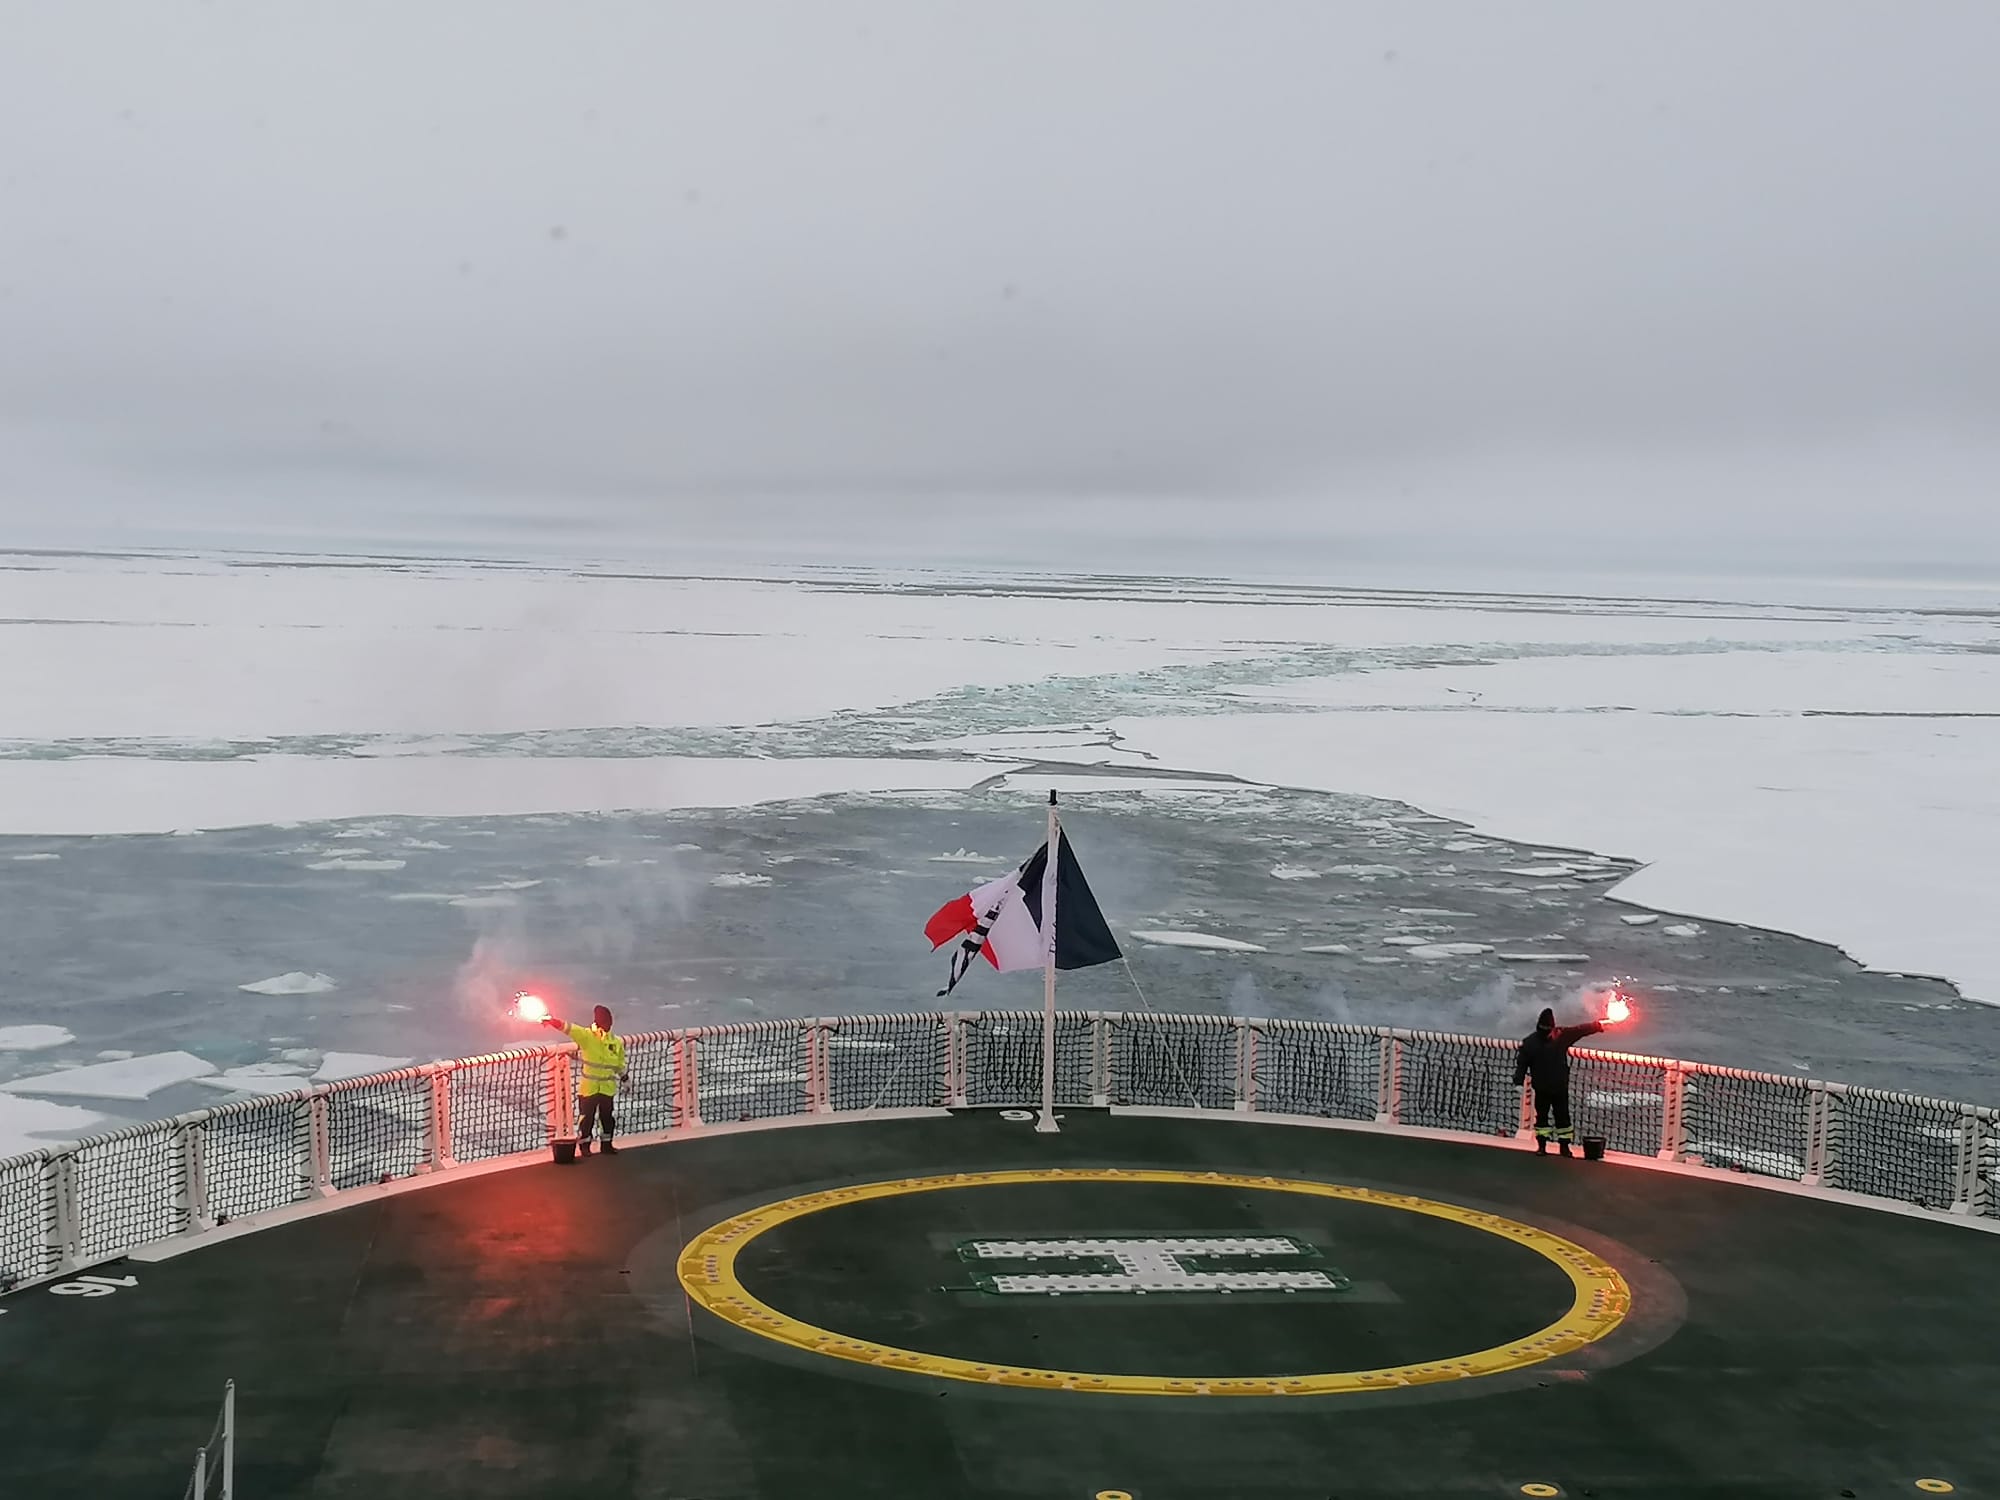
[Edit – September 10th]A picture of the sea ice at the North Pole from Ponant’s Le Commandant Charcot on September 6th:
Here’s the latest NSIDC sea ice age map:
That shows plenty of old ice still left in the Beaufort Sea. However ice mass balance buoy 52460 now appears to floating free of its ice floe at 75.56 N, 165.99 W:
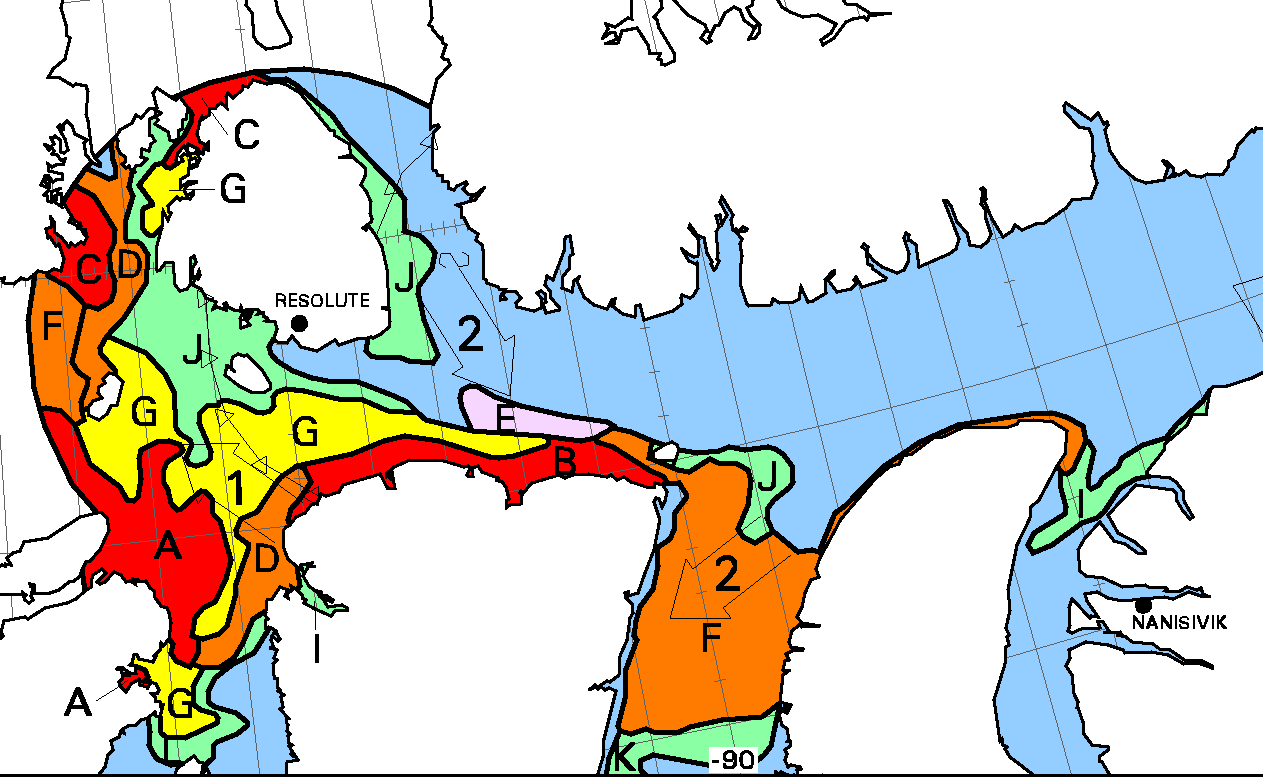
“New ice” has started to appear in previously open water on the Canadian Ice Service charts. See area E south east of Resolute:
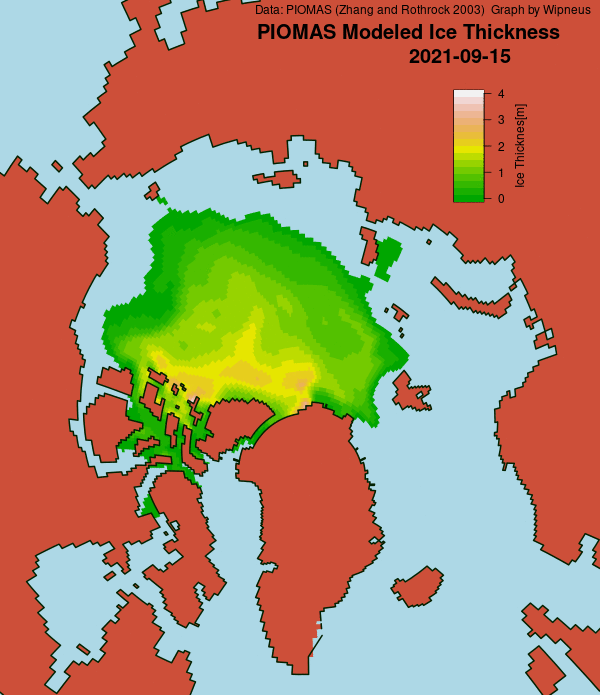
In answer to Frozen Earth’s metaphorical prayer, Wipneus has just released the mid September PIOMAS gridded thickness numbers on the Arctic Sea Ice Forum. First of all the thickness map:
followed by the volume graph:

and the monthly volume trends:
Volume calculated from the thickness data currently show that 2021’s minimum was reached on September 7th at 4.64 thousand km3, which is the 8th lowest value in the Polar Science Center’s record.
[Edit – September 23rd]NASA have just announced a new paper about clouds in the Arctic. Highly relevant given their recent overview of the 2021 melting season!
Clouds are one of the biggest wildcards in predictions of how much and how fast the Arctic will continue to warm in the future. Depending on the time of the year and the changing environment in which they form and exist, clouds can both act to warm and cool the surface below them.
For decades, scientists have assumed that losses in Arctic sea ice cover allow for the formation of more clouds near the ocean’s surface. Now, new NASA research shows that by releasing heat and moisture through a large hole in sea ice known as a polynya, the exposed ocean fuels the formation of more clouds that trap heat in the atmosphere and hinder the refreezing of new sea ice.
The findings come from a study over a section of northern Baffin Bay between Greenland and Canada known as the North Water Polynya. The research is among the first to probe the interactions between the polynya and clouds with active sensors on satellites, which allowed scientists to analyze clouds vertically at lower and higher levels in the atmosphere.
The approach allowed scientists to more accurately spot how cloud formation changed near the ocean’s surface over the polynya and the surrounding sea ice.

Watch this space!
Some interesting clouds over Baffin Bay today:
USCGC Healy has been in the area today, and reports a maximum wind speed of 14.4 m/s, a 2 metre swell and water temperature of 3 °C.
Plus a glimpse of the disintegrating sea ice in the Beaufort Sea:
The Arctic warming Albedo potential has been lower than usual for the last half of the year which must have helped slow the melting.
Position wise we have done multiple runs of second lowest to 12 th lowest over the last 2 years which is weird. ;
Global Temps seem a little down and La Nina may be reforming though if it does it will take 5 months to affect the Arctic by transported colder waters.
Note the if it does.
Like the Arctic Enso is unpredictable.
Thanks, as usual , for your coverage and insights.
Nico Sun’s Arctic Albedo-Warming Potential hasn’t been as high in 2021 as in other recent years:
Moreover that “potential” wasn’t realised due to low pressure, and hence cloudy skies, during the period of high insolation in July:
August wasn’t a whole lot better either, certainly on the Canadian side of the Arctic:
Everybody seems to be agreeing that the overall melt is stopping, and DMI seems convinced that sea ice volume bottomed out in the first few days of September, which would say that overall water temps are not as warm as recent years. What’s interesting to me is that Wrangel Island has been relatively icebound as compared to recent past. With the Pacific ‘blob’ waining, looks like that part of the Arctic is in for more ice. Will be interesting to see how this plays out in the winter.
Sadly I find DMI’s modelled volume to be rather unconvincing. Let’s see if the mid-month PIOMAS numbers agree?
I think it’s safe to say that Wrangel Island will definitely be icebound by the end of winter! How thick that ice will be is, as always, highly dependent on the “weather” over the next 8 months or so. How quickly it melts will be, as this year has proved, even more highly dependent on the “weather” next summer. See the July 2021 MSLP anomaly above.
The mid-month PIOMAS numbers do agree, roughly on the date at least. September 7th, see above.
As said the refreeze in the last two years was extremely poor early on so even though ice recovered to 10th lowest positions it rapidly fell away to second or even? first lowest for a while.
This year is starting off from a much better base but I fear the same sort of inbuilt mechanism might still exist.
Ona lighter note I worked out a schemata for proof of AGW.
If the JAXA ice continues to rise we can put a position and a percentage on it out of the 42 years of records.
So 11/42 fives a 75% chance AGW is correct
Obviously much higher in the past few years.
If a miracle happens and we get a year or years in the 70’s levels that would mean the theory was falsified.
Sounds fair?
Not really. Declining Arctic sea ice extent is a symptom, not a direct cause, of “global warming”. Such a “miracle” is not entirely beyond the bounds of possibility.
Increased precipitation and hence spring snow cover? “Freshening” of Arctic surface waters due to increased river runoff? AMOC slowdown? More clouds in summer!
Meanwhile despite the politicians’ promises:
“Sadly I find DMI’s modelled volume to be rather unconvincing. Let’s see if the mid-month PIOMAS numbers agree?”
Agree about that. Say, has there been any news about the Mid–Sep figures or Wipneus and where he will publish after Google just deleted everything he’s done for the availability of sea ice volume and area data? Always feels naked or empty around minimum without the data to show what happened.
Wipneus’s Google site doesn’t seem to back online yet. However he assures me that “I am studying my options, hopefully not too long”.
NoNews on mid September PIOMAS numbersyet either I’m afraidis now available above. Note also that I have started grafting AWI’s AMSR2 area/extent numbers on to Wipneus’s data:https://GreatWhiteCon.info/2021/08/the-2021-arctic-sea-ice-minimum-extent/#Sep-17
Excellent job, Jim! And yeah, God works very fast these days, answering prayers.
What you reckon, is AWI area higher or as high resolution + quality as the ‘old’ Uni Hamburg? I’m thinking about next Melt season, should I switch to AWI only?
Lars Kaleschke moved from Hamburg to AWI and has been working on the new product. The resolution is identical and “quality” should perhaps be better once all the teething troubles have been worked out. AWI produce concentration data twice a day rather than only once, and also provide a “sea ice leads” product:
However for the regional data AWI use NSIDC regions whereas Wipneus used the old Cryosphere Today regions which are different. For example AWI’s “Beaufort Sea” is bigger, whereas their “CAB” is smaller.