A selection of graphs, images and videos from the Fram Strait and Barents and Greenland Seas.
The Northernmost Town on Earth – Longyearbyen on Svalbard
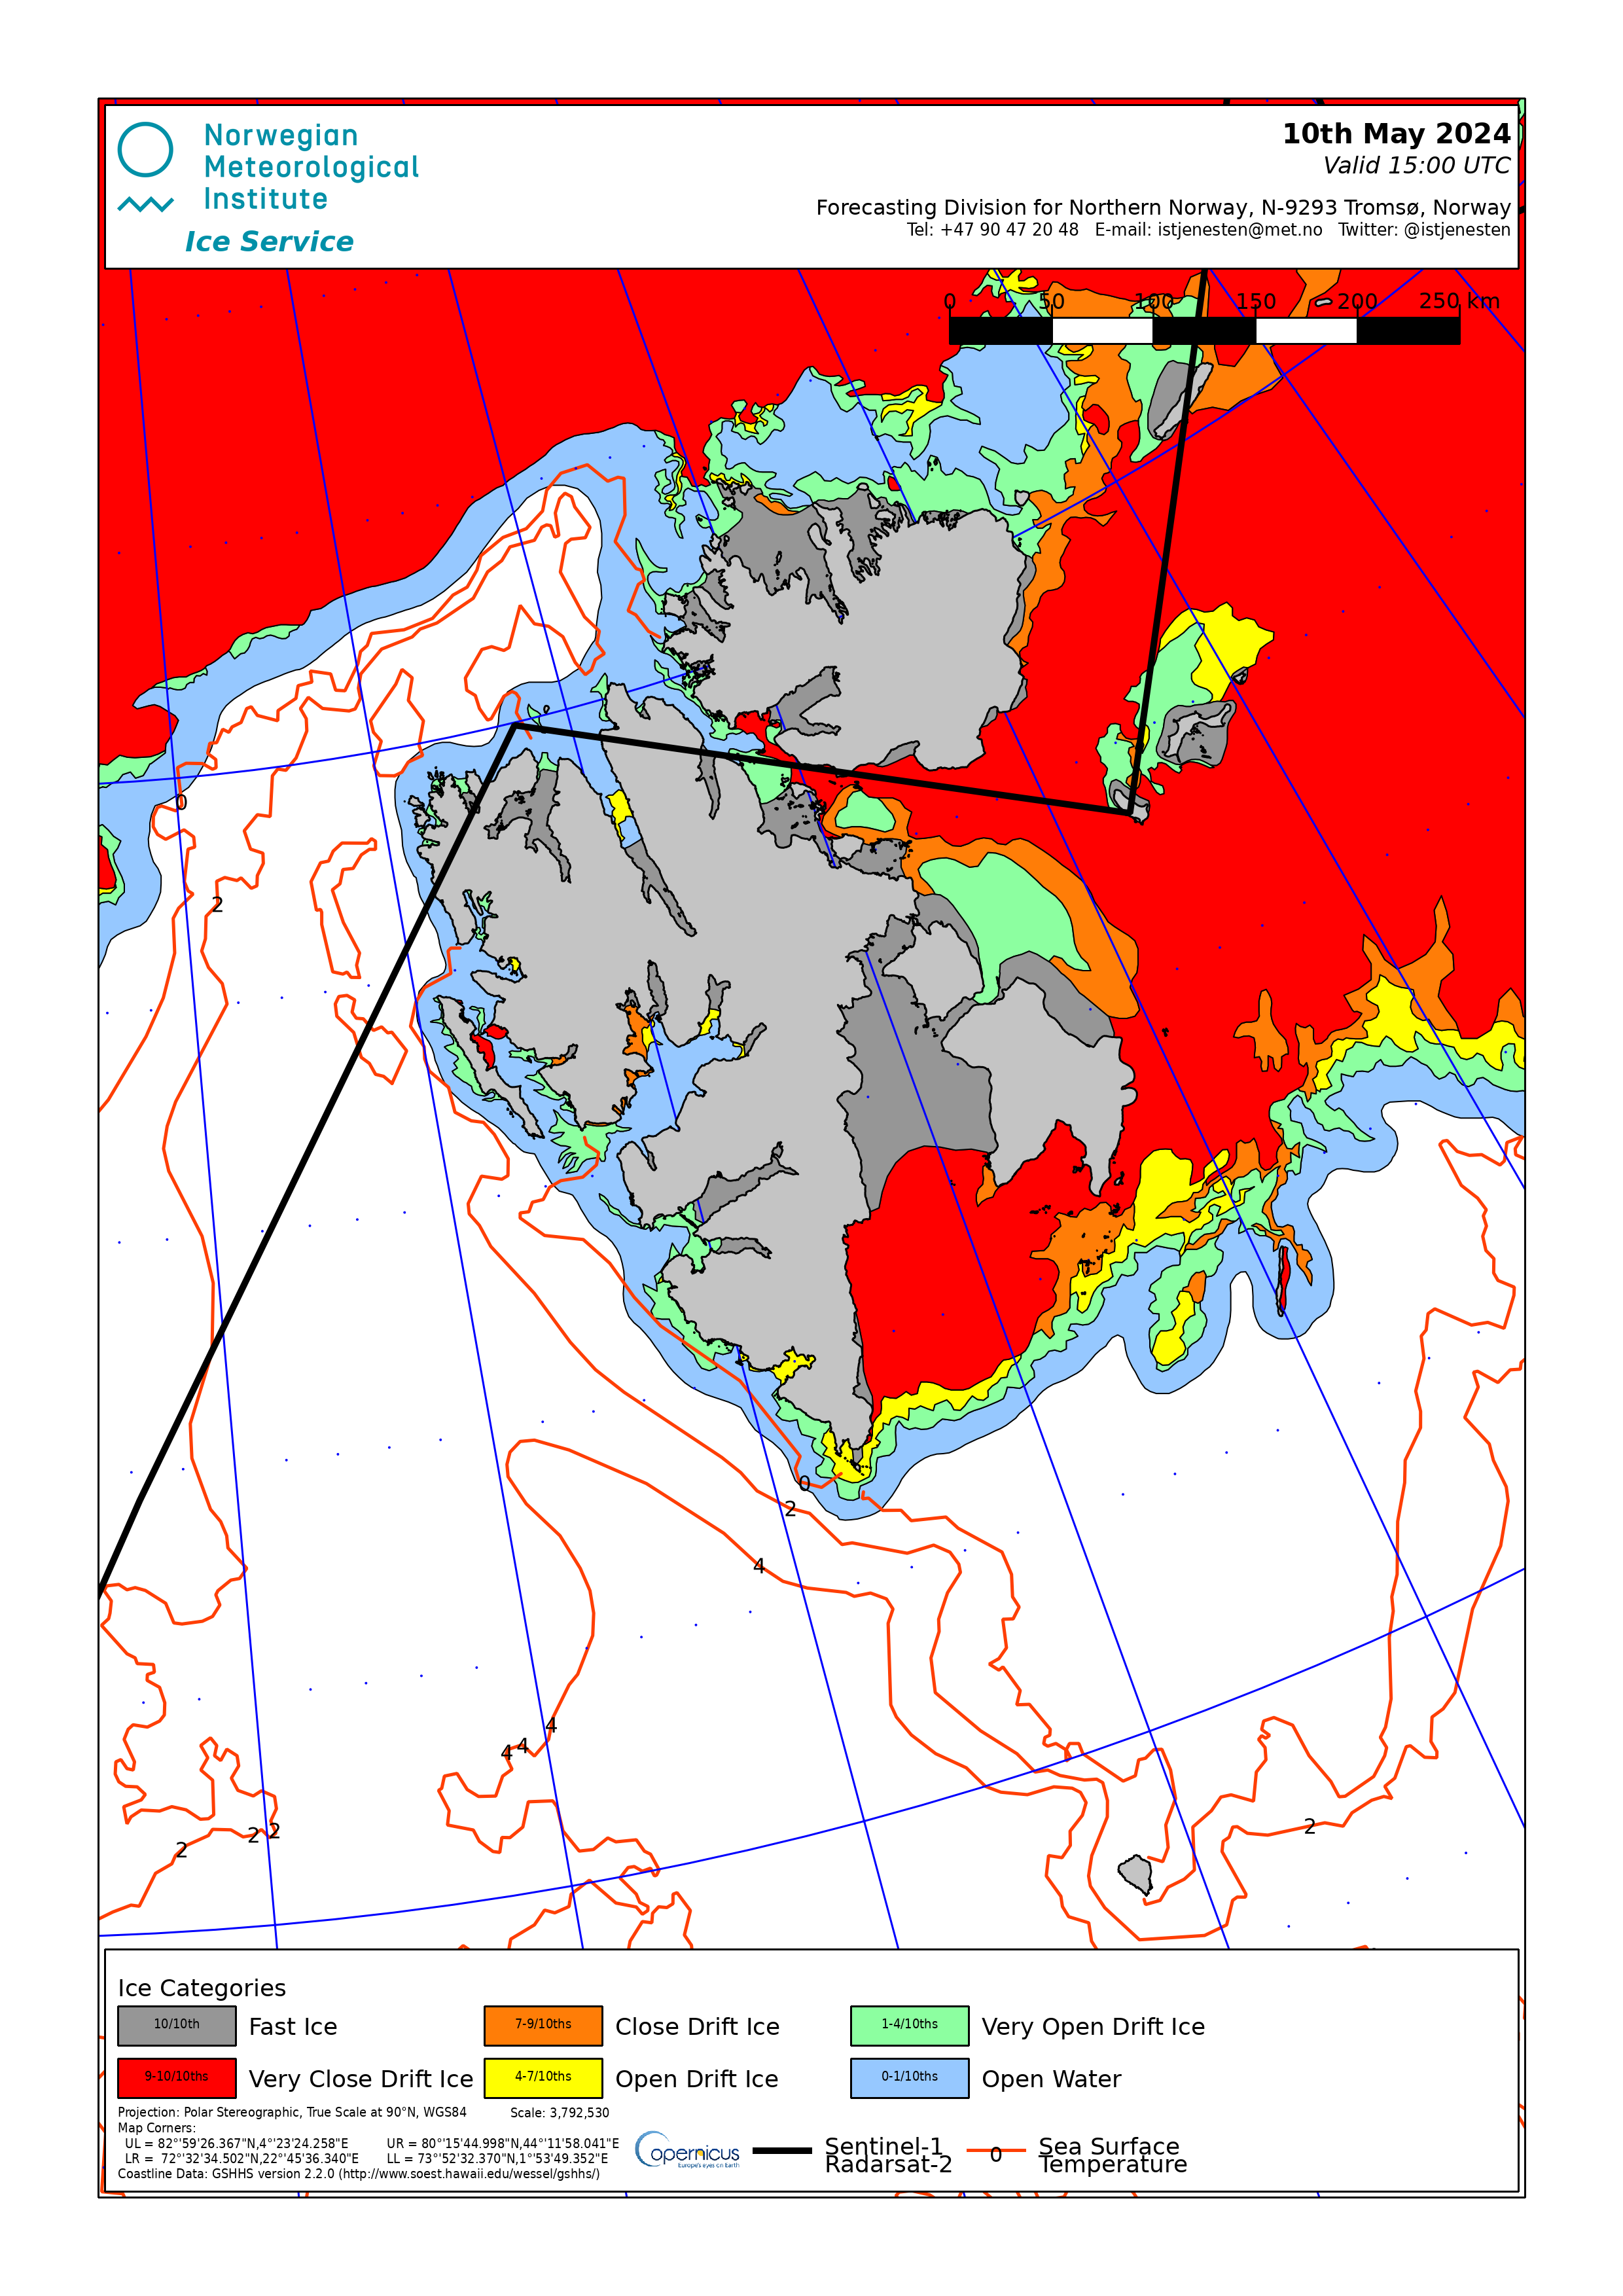
Svalbard Sea Ice Concentration

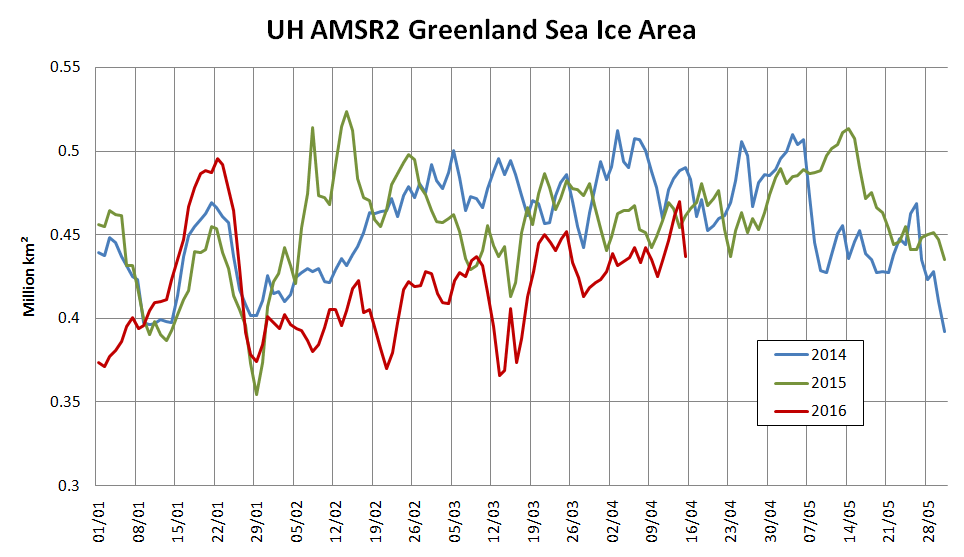
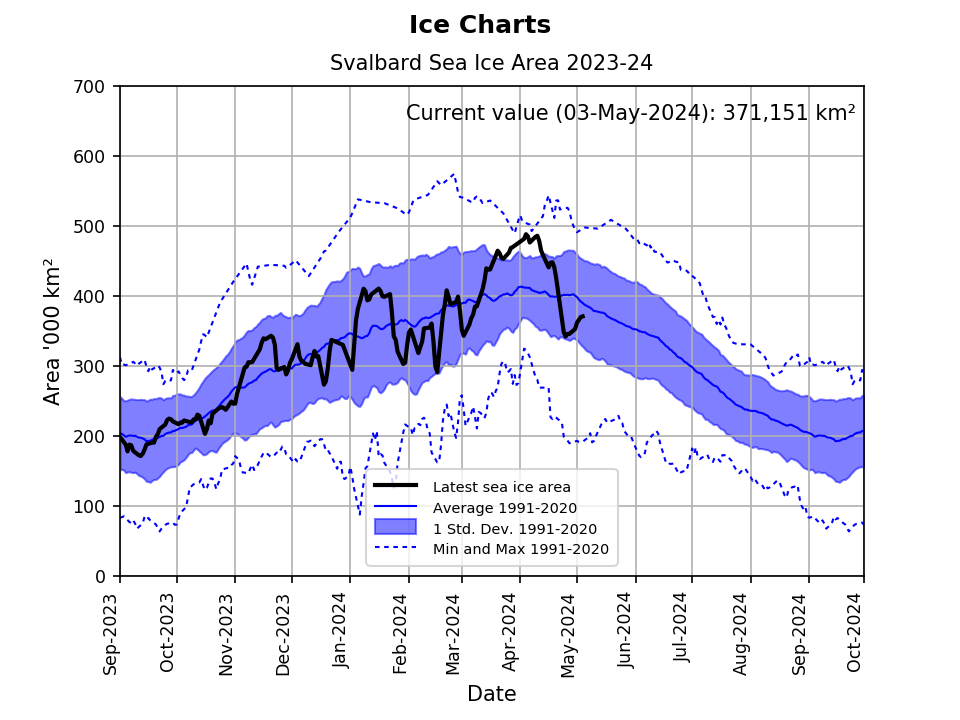
Svalbard Sea Ice Area
High resolution AMSR2 Svalbard Sea Ice Area from Arctische Pinguin:

Svalbard Sea Ice Area from Cryosphere Today (Currently AWOL due to DMSP F-17 gremlins):


Svalbard Sea Ice Concentration, from the Norwegian Meteorological Institute
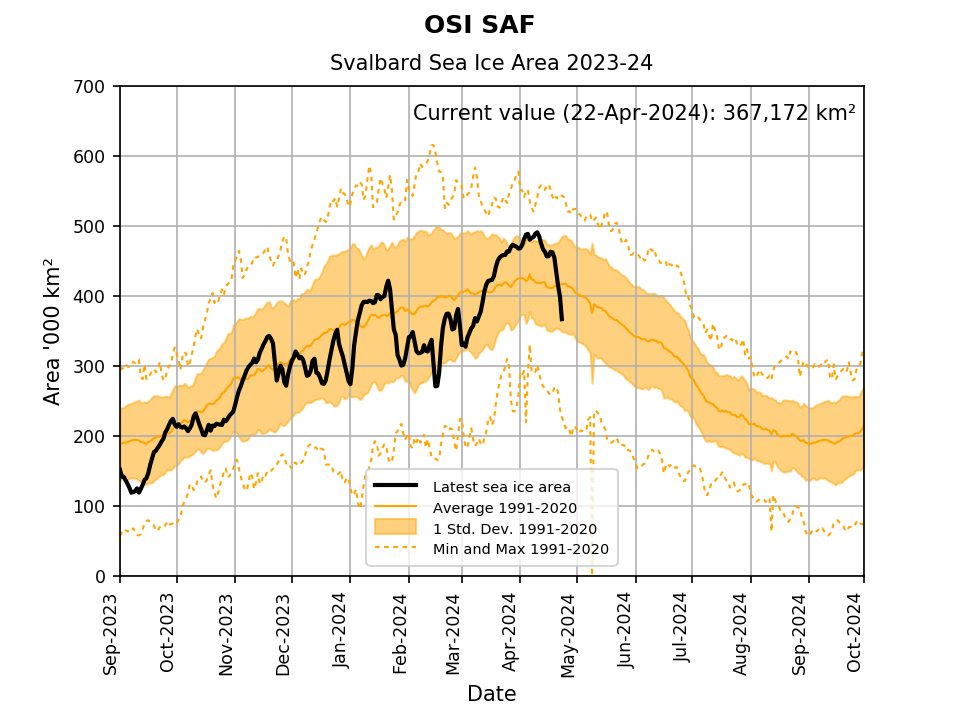
Svalbard Sea Ice Area, from the Norwegian Meteorological Institute:
See also our Arctic sea ice graphs overview page, our Arctic ice mass balance buoys overview page, our Arctic sea ice images page and our Arctic sea ice videos page.
Constructive technical criticism is welcome on the introductory blog post. For discussions about interpreting the information please comment on the “About Our Arctic Sea Ice Resources” page.