I’ve been waiting for the results of the ARCUS SIPN August call, but despite the timetable specifying “26 August 2020 (Wednesday)” they’ve still not been published and I can wait no longer!
Hopefully the August “predictions” will be available soon, but for the moment let’s take a look at the July 2020 Sea Ice Outlook instead:
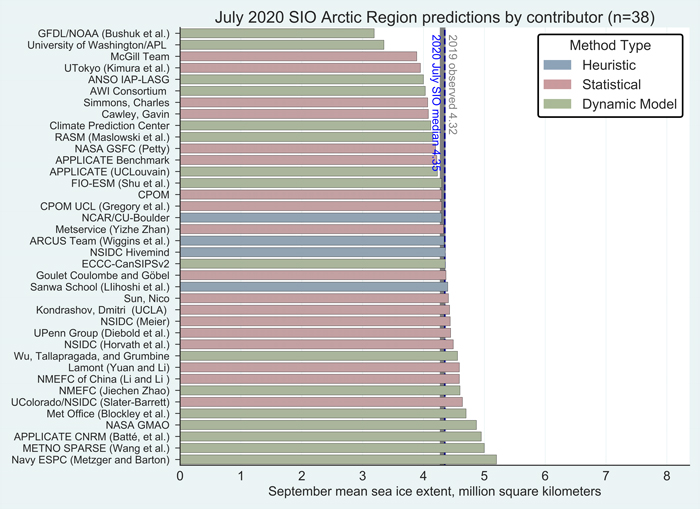
For the Arctic, the median July Outlook for September 2020 average sea-ice extent is 4.36 million square kilometers, essentially identical to the median prediction in the June report, with quartiles of 4.1 and 4.6 million square kilometers. For comparison, the historical record September low over the period of satellite observations was set in 2012 at 3.57 million square kilometers, and the second lowest record was 4.27 million square kilometers set in 2007. This year’s projection is close to the 2019 observed September sea-ice extent of 4.32 million square kilometers. As was also the case for the June report, only two of the outlooks project September sea-ice extent below the 2012 record. The consensus judgement against a new record low September sea-ice extent hence remains unchanged. Interestingly, as of this report, observed extent stands at a record low for this time of year.
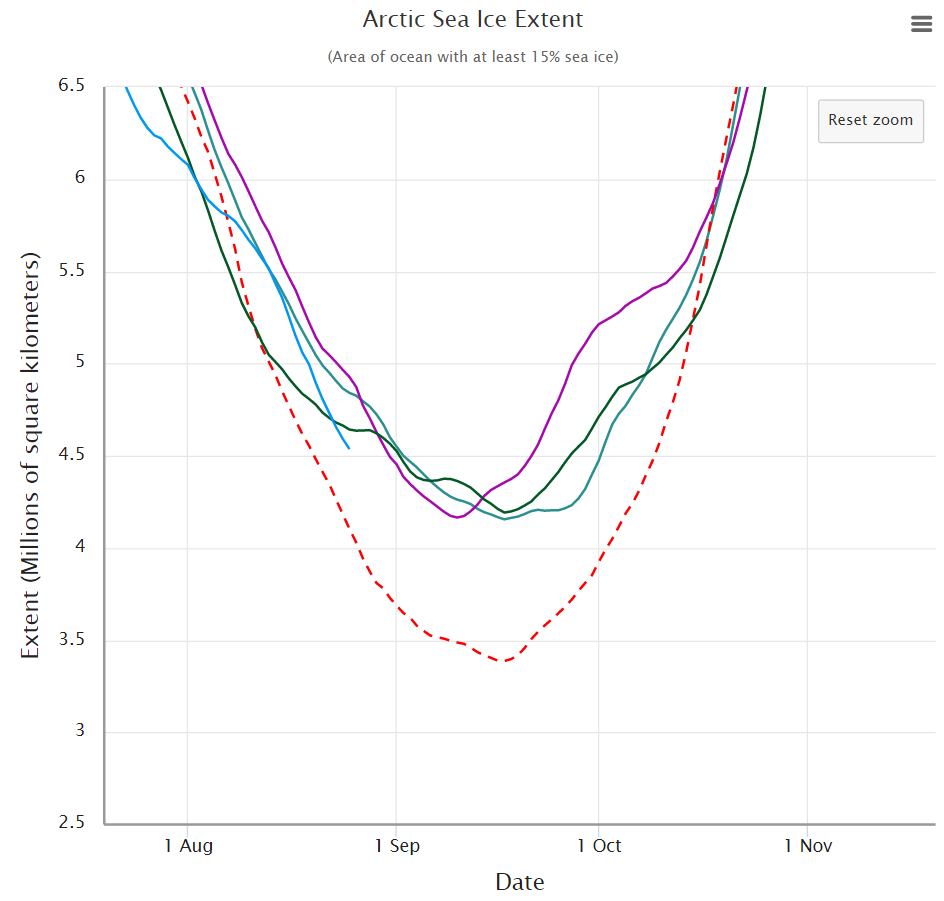
Note that those numbers represent “September 2020 average sea-ice extent” and not the daily minimum. Let’s now take a look at the assorted different flavours of “Arctic sea ice extent” metric. Firstly here’s the NSIDC’s “Charctic” 5 day average extent:
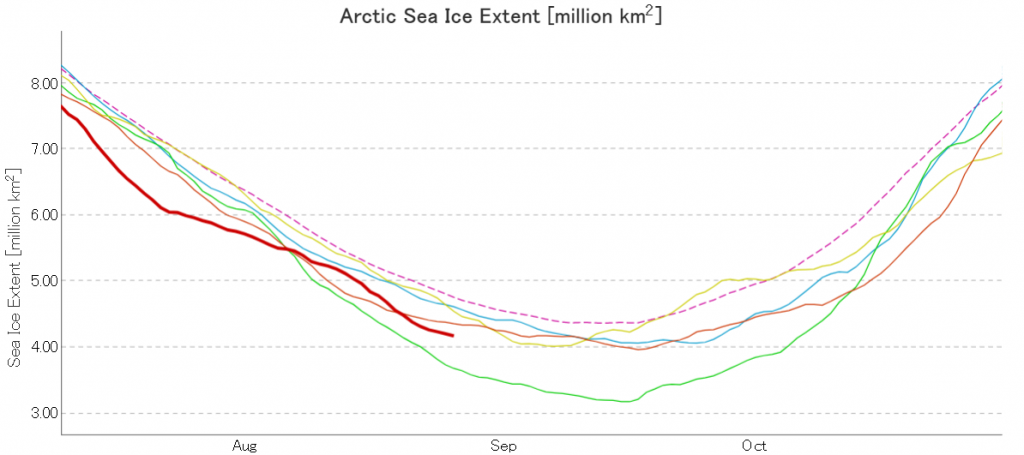
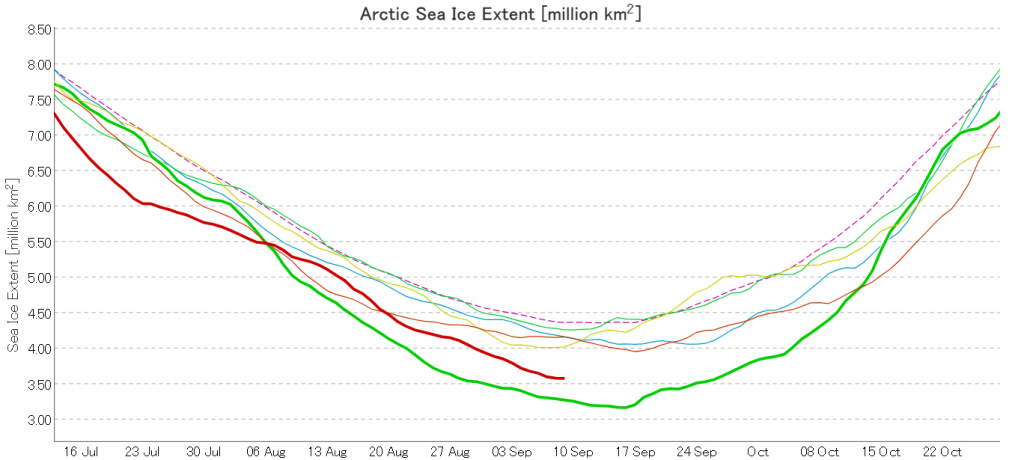
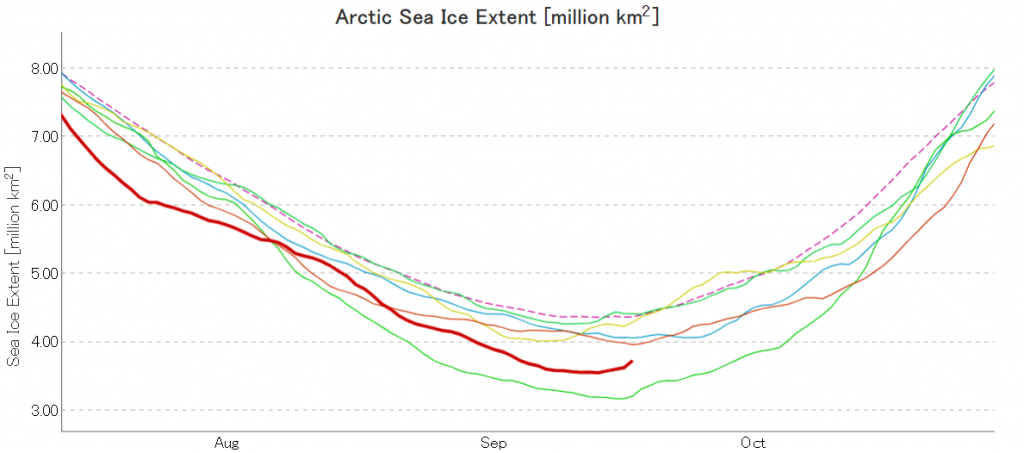
Next here’s JAXA/ViSHOP extent, generally assumed to be a “2 day average”:
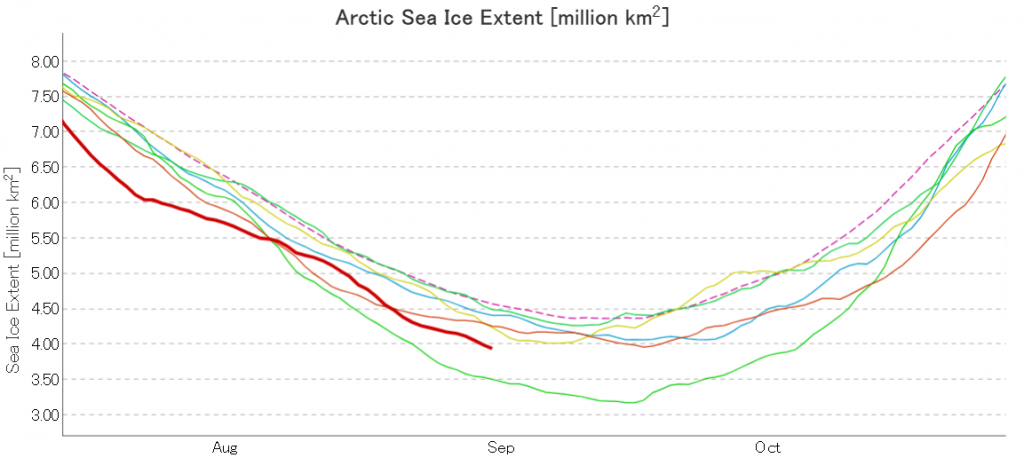
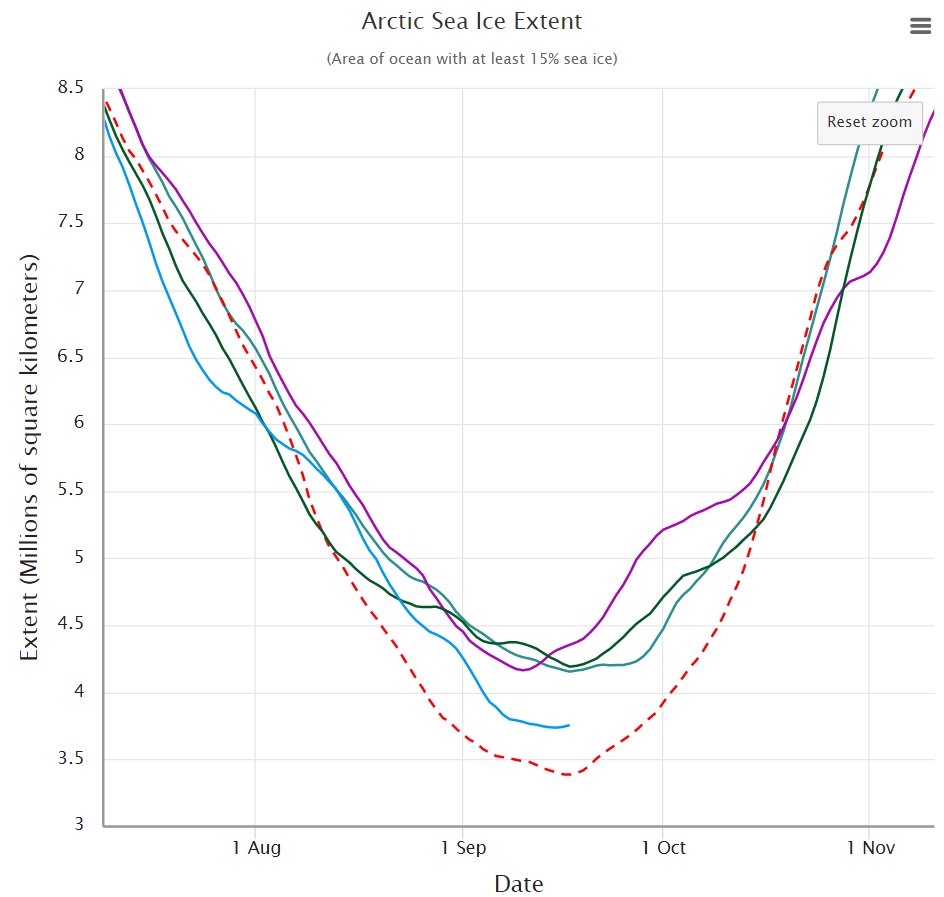
Next here’s the DMI version, which neglects to include 2012:
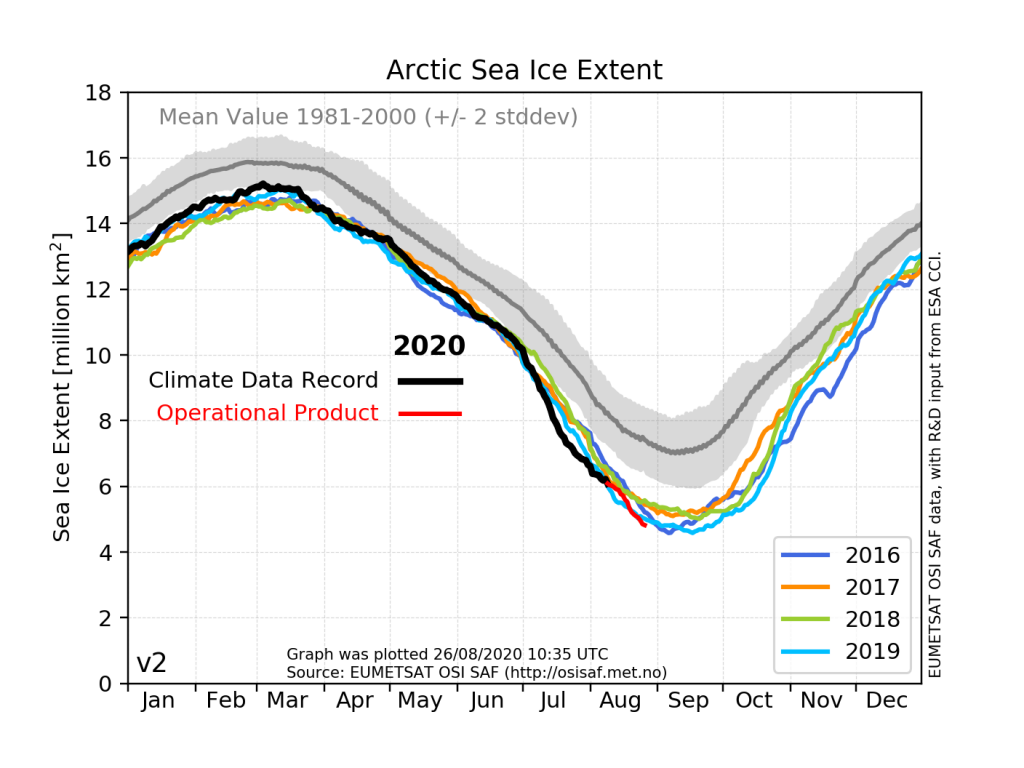
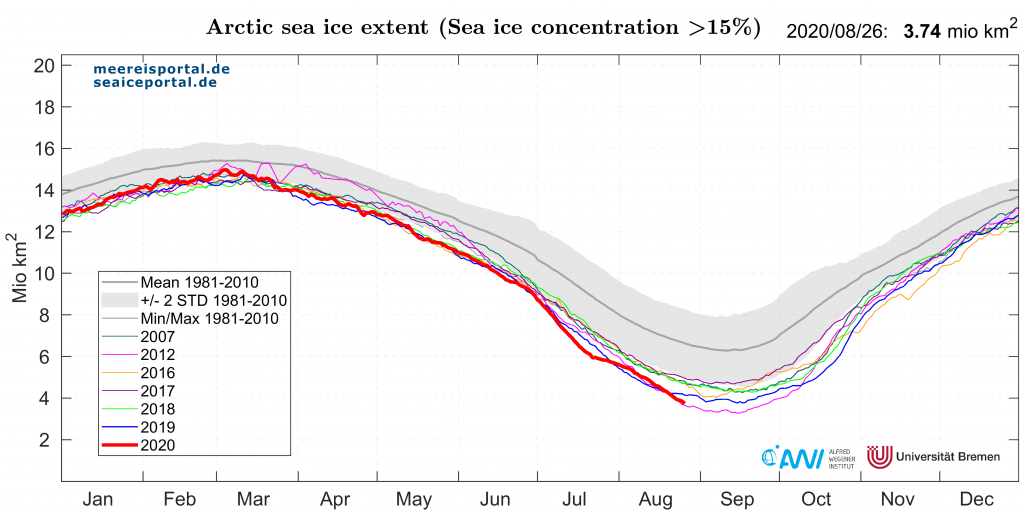
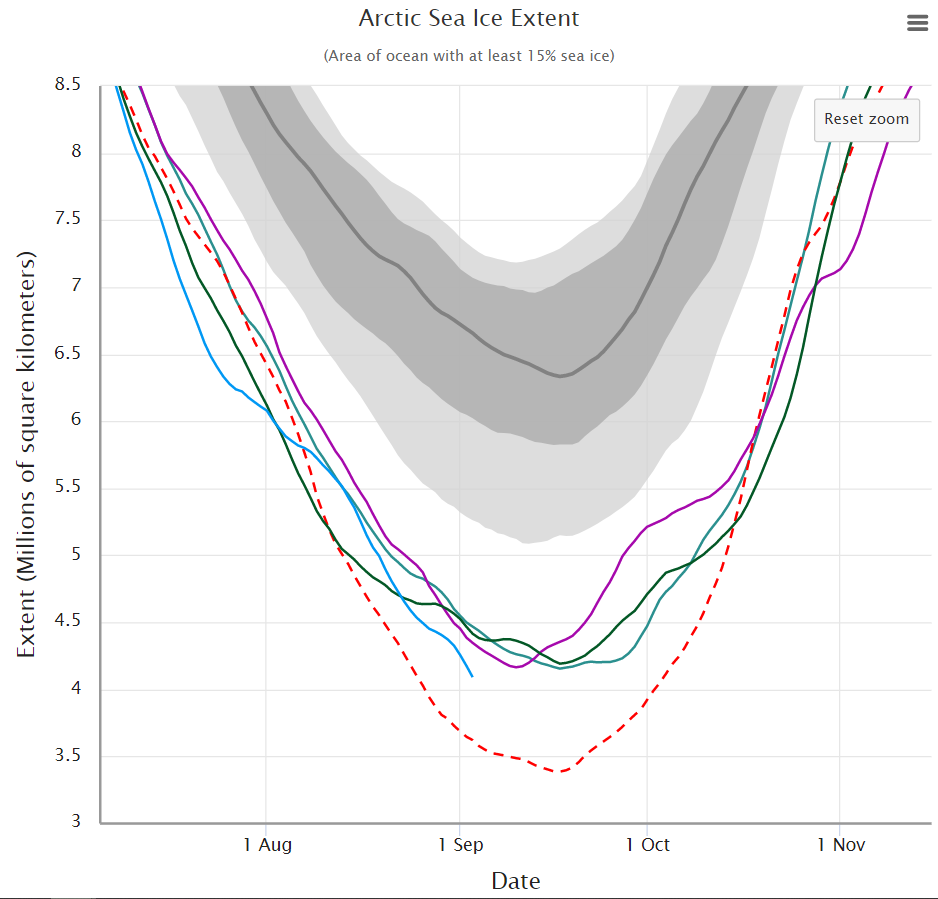
followed by the Alfred Wegener Institute/University of Bremen version:
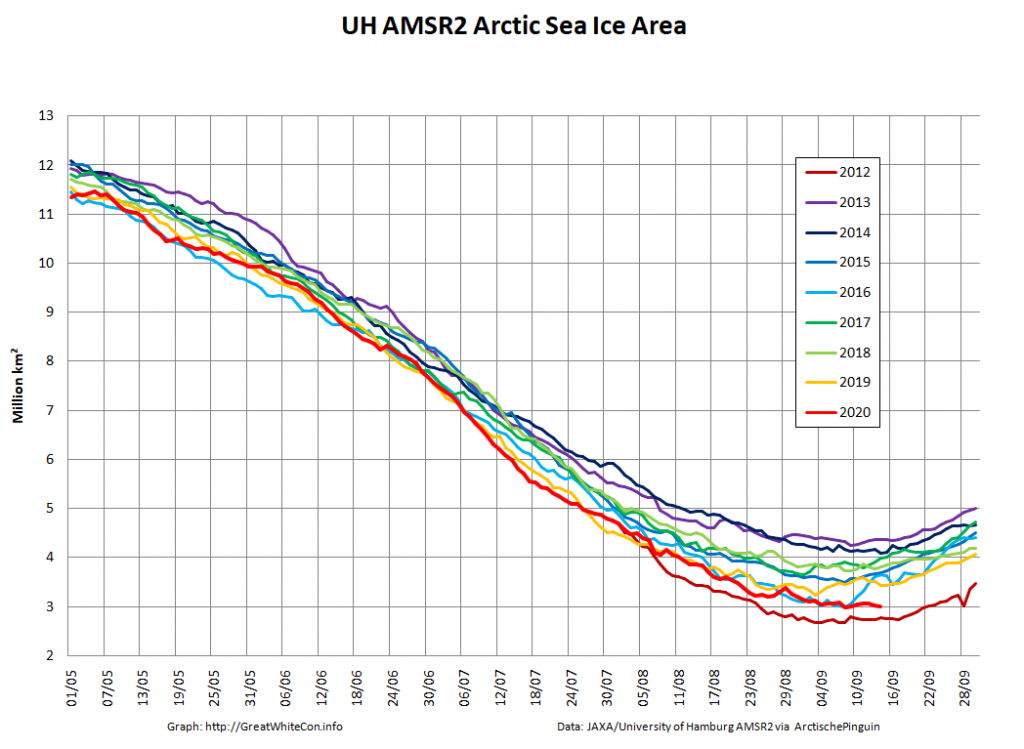
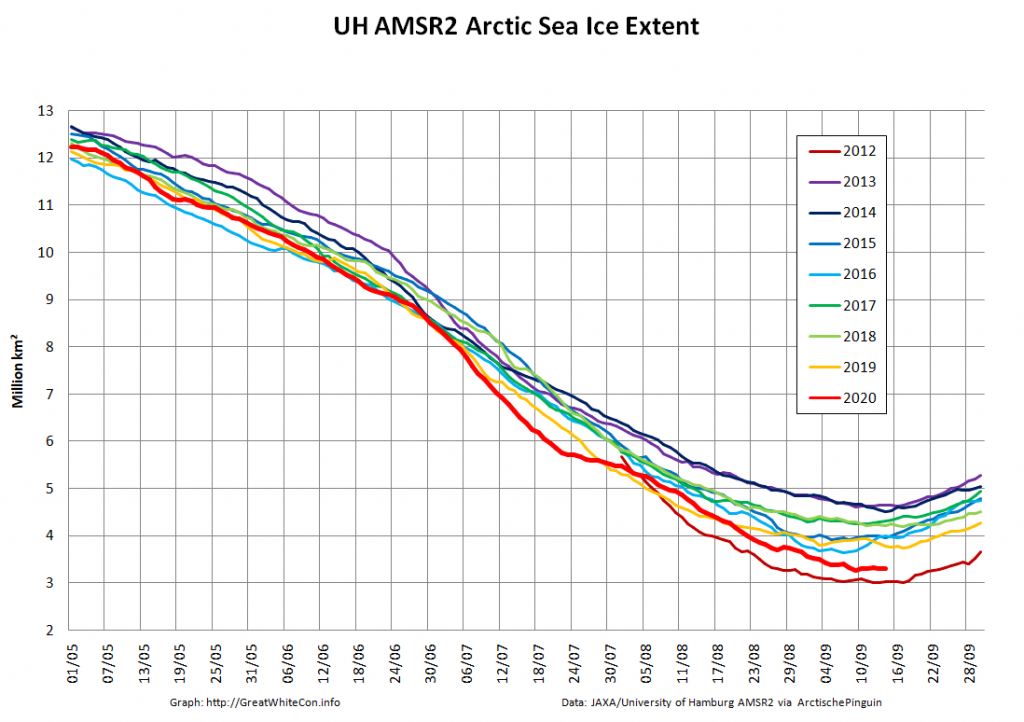
Last but not least here is our own favourite high resolution AMSR2 version of extent, plus sea ice area for good measure:
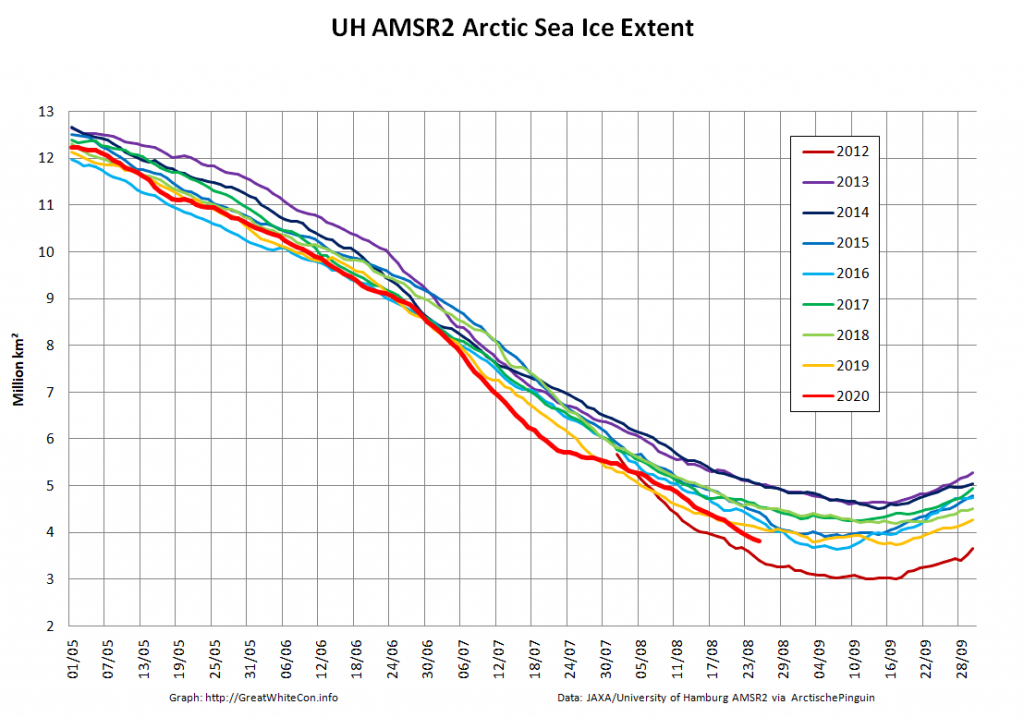
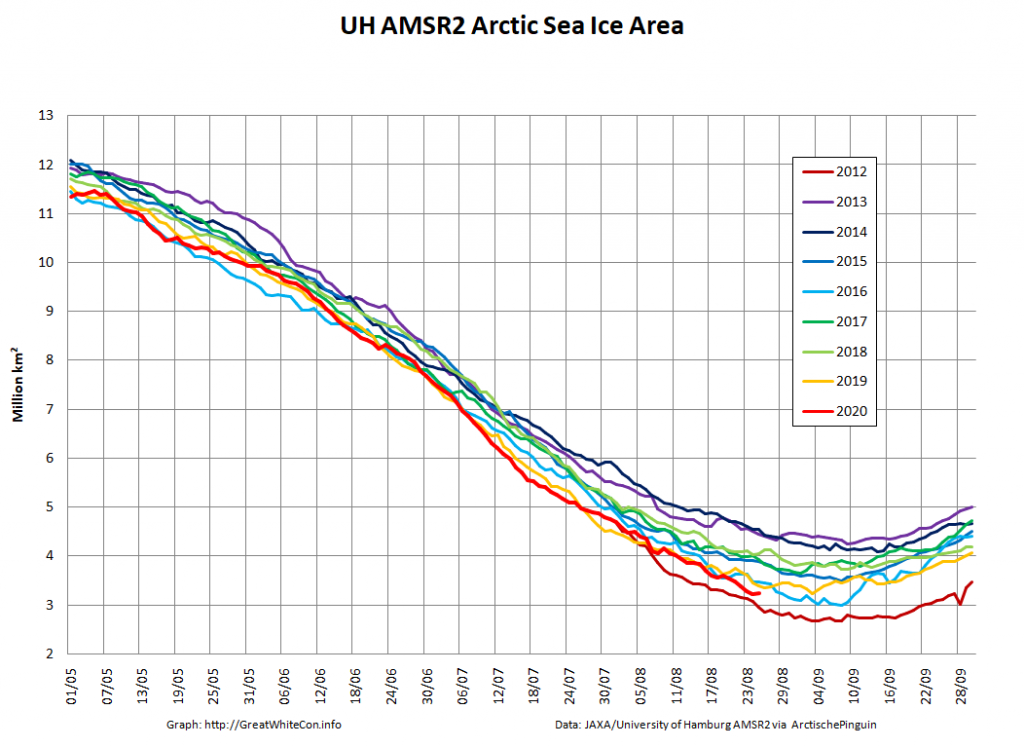
Would anybody care to play “spot the difference” with me?
Stop press! The August ARCUS SIPN September average Arctic sea ice extent “predictions” have just been published. Here’s the graphical overview:
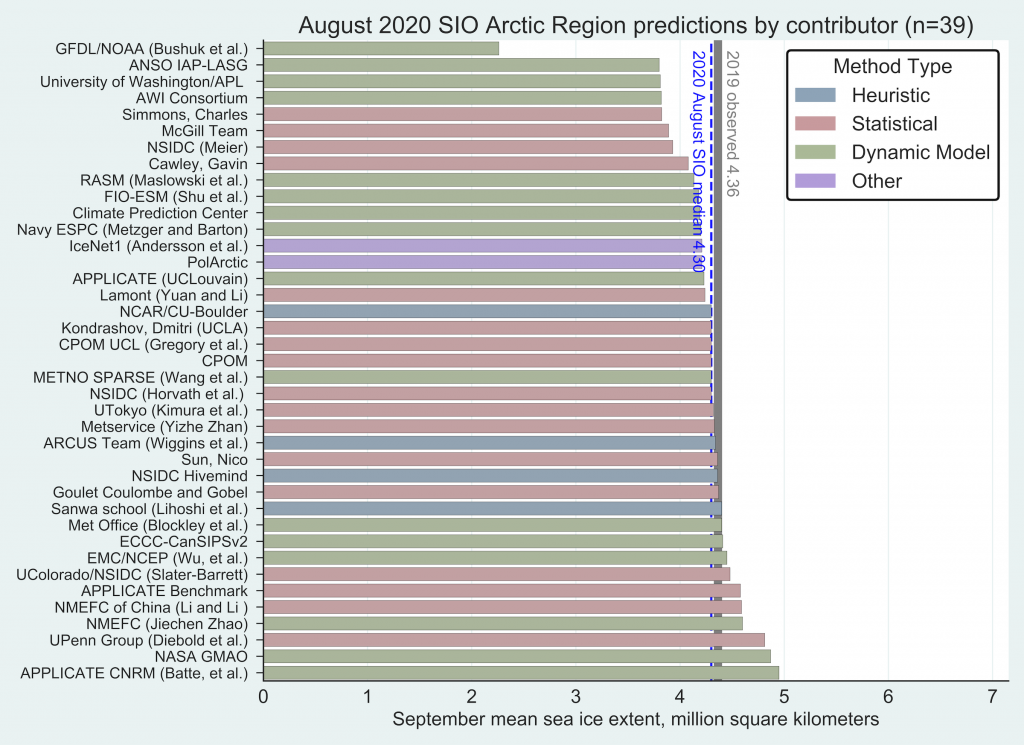
According to ARCUS:
The August Outlook is based on a total of 39 forecasts, of which 25 are new August submissions while the remaining 14 are carried over from June and July. The median August Outlook value for the September 2020 sea-ice extent is 4.30 million square kilometers, with quartile values of 4.1 and 4.5 million square kilometers. Of the 39 August 2020 contributions, 16 are based on dynamical models, 17 are based on statistical methods, 4 are based on heuristic approaches (qualitative analyses), and 2 used machine learning-based methods. The median of the August submissions is close to that from July (4.36 million square kilometers) and June (4.33 million square kilometers). The 2020 August Outlook median is higher than 2019 (4.22 million square kilometers) and lower than 2018 (4.57 million square kilometers).
Following a one day decline of 51,770 km2 JAXA/ViSHOP minimum extent is now 2nd lowest in their records going back to 1979:
Just 2012 to beat!
The NSIDC 5 day average extent is now also lower than all previous minima since 1979 apart from 2012:
After being offline for maintenance the ViSHOP web site is up and running again this morning, to reveal:
JAXA extent stuck on 3.59 million square kilometers two days running! Perhaps the 2020 minimum is here already?
A combination of central freezing with peripheral melting has resulted in high resolution AMSR2 area and extent both “flatlining” for several days:
Which means it’s still too early to consider calling the 2020 minimum for any of the assorted metrics!
New ice has started appearing on the Canadian Ice Service charts of the Canadian Arctic Archipelago, and JAXA extent has just posted a 100k daily increase:
The NSIDC 5 day averaged extent is also on the increase:
Here then are the preliminary 2020 minimum extent values for the most watched metrics:
JAXA/ViSHOP – 3.55 million square kilometers on September 13th
NSIDC Charctic – 3.74 million square kilometers on September 15th
Watch this space!
This is the time of year when all the measurements of Arctic extent get squirrelly. NSIDC is flattening, MASIE is up, and DMI is sharply down over the past few days. Clearly they are measuring something in addition to extent (melt ponds?, reflectivity? Small floes?), but who knows what it is. It would be one thing if they all fluctuated in the same direction, and just differed in magnitude. We could call that ‘calibration error’. Good thing the science is settled, or a thinking person might lose faith in this metric.
A thinking person wouldn’t put any faith in a single Arctic metric Taylor!
And for the umpteenth time, nobody should ever place any faith whatsoever in MASIE for long term comparisons:
https://GreatWhiteCon.info/2016/02/dmi-masie-and-the-sea-ice-index-an-interview-with-walt-meier/
Meanwhile JAXA extent is now below the magic 4 million mark:
As predicted by yours truly!
Thanks for the link to your 2016 article. I was aware that MASIE was multi-source, but the article helped explain the day to day fluctuations – it has been bouncing around lately pretty badly. On the other hand, you say ‘don’t put your faith in one metric’ while promoting the ARCUS extent ‘contest’ and tracking JAXA as the gold standard for the 15% extent metric.
Maybe you could do a similar article to the 2016 one explaining your faith in JAXA, or point me to an existing one. JAXA seems to be consistently lower than the others, and I’d love to understand why.
I’m “reporting” Taylor, not “promoting”!
The JAXA number is lower because the AMSR2 instrument allows the use of a smaller sea ice concentration “grid cell” size than the SSMIS instrument used by the NSIDC.
Interesting, the smaller grid size would explain differences, but I would think would also create melt pool issues and ice edge expansion/compaction variations. Also interesting that ARCUS apparently uses NSIDC data. Net,net one has to guess not only the extent, but how the particular measurement affects that extent number.
Following an almost 200k decline NSIDC daily extent joins JAXA in second place behind 2012 with an Arctic wide extent of 4.004 million km²
AWI extent looks as though it’s just about to cross below 2012:
However our “homebrew” AMSR2 extent metric does not concur:
Yes, the AWI appears to match the 2012 minimum arctic sea ice. You would think with the advantage of the Polarstern roaming around that very area that it might be the most accurate measure.
After some excellent detective work by mv89 on the Arctic Sea Ice Forum it looks as though the AWI AMSR2 extent crossed below 2012 on September 5th:
The current AWI/Bremen AMSR2 minimum for 2020 is 3,298,589 km² on September 9th
.. or the most biased?
Extent Sept. 8 2020 Jaxa 3,586,000
Nsidc 3,770,000
AWI 3,320,000
I simply can’t believe NSIDC is below 4…
(*** This is getting historical I tell ya! )
AWI/Bremen have discovered a problem:
Here’s the amended graph:
Ok, here we go again. AWI is 3.83 mio km2. Sudden correction of 500,000 km2. Now Jaxa is the lowest at 3,562,288 km2. About 300,000 from 2012.
Bremen making mistakes like that is, how shall I say it, “bad for business”.
The plot thickens!
And so, apparently, does the ice (thicken). DMI seems to think that minimum volume occurred in late August. Will be interesting to check PIOMAS at the end of the month.
AWI have posted an article explaining their recent recalculations:
https://www.meereisportal.de/en/archive/2020-kurzmeldungen-gesamttexte/recalculation-extent/
Ok, some science being done here (with respect to finding and correcting the error). However, I’m surprised at the lack of science in the original 2018 work. Feynman says “you make a guess” (in this case, creating their 2018 new model), “then you compute the results” (running the model to process the data) “then you compare the results to experimental data” (the actual extent, at least in sample locations, which apparently they did not do until now) “and if the guess doesn’t agree, then it’s wrong”.
Compare that to UAH satellite temperature models, which are constantly compared to radiosonde balloon measurements. While I appreciate them finally finding their mistake and fixing it, it would have been better to have followed the scientific method in the first place and avoided the embarrassment (and the likely corruption of other scientific work based on the errors).
But of course, “the science is settled…”
You have a very strange conception of how the “scientific method” might work when it comes to determining sea ice concentration Taylor.
How do you propose that AWI (or anybody else for that matter) should go about measuring “the actual extent, at least in sample locations”?
QED, Jim. You made my point. If the extent models can’t be verified with actual measurements, at the very least in sample regions that can be directly examined, then it is not a scientific metric, it’s a guess, as good as any other guess. Maybe it should be rounded to the nearest million sq Kilometers and be done. Those that then claim that 2020 is .2 sq Km > 2012 can then go on to more productive work, and the AWI folks can save themselves the embarrassment. I don’t mean to be harsh, but climate science seems to be littered with these kinds of unscientific approaches (tree ring temp proxies, coding and stat errors, etc). I think it’s time for those in the field to take a pause, examine the core underpinnings of the science, and maybe show a bit more humility about what they know and don’t know about the climate. It would be well to do this before asking for any more trillions to ‘fix it’.
“tree ring temp proxies” Boy, there’s a loaded phrase.
I thought this was about aligning the previous satellite extent data schema to the current one, and that it wasn’t followed through. I don’t see any reference to in situ sampling of Arctic sea ice extent to corroborate satellite data in the AWI statement posted above. I think Dr. Feynman would have considered on-site measurements to corroborate satellite data for sea ice volume, however.
Would be interesting to see when the 2020 sea ice minimum will be! Speaking of, do we have any intel on whether or not Mr Axel Schweiger is enjoying himself this lovely October weekend? Here’s to keeping it 100% sea ice volume update free, Mr Schweiger!
But maybe one of his colleagues will make a mistake again or reveal the ice volume numbers through personal error or automation, so that the data will find its way out through the catacombs of Wipneus and the ASIF? Oh joy! that would for sure be exciting. But best not to get one’s hopes up. After all, it’s just ice.
Dmi temp looks mesmerising these days…
Well, maybe he got covid.
Jim, as a general inquiry: in what region is the Parry Channel accounted for?
Re: https://forum.arctic-sea-ice.net/index.php?action=dlattach;topic=3299.0;attach=288001;image