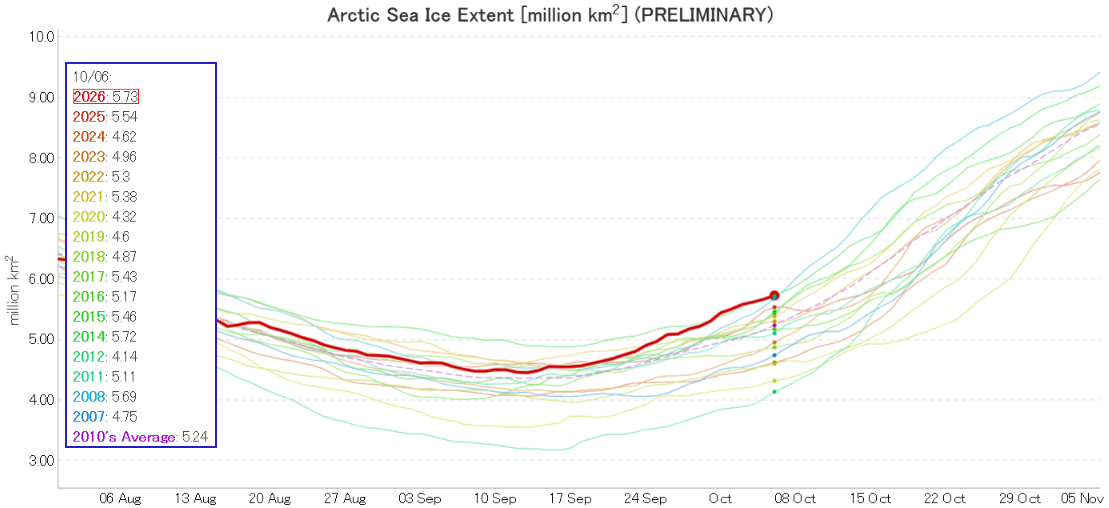
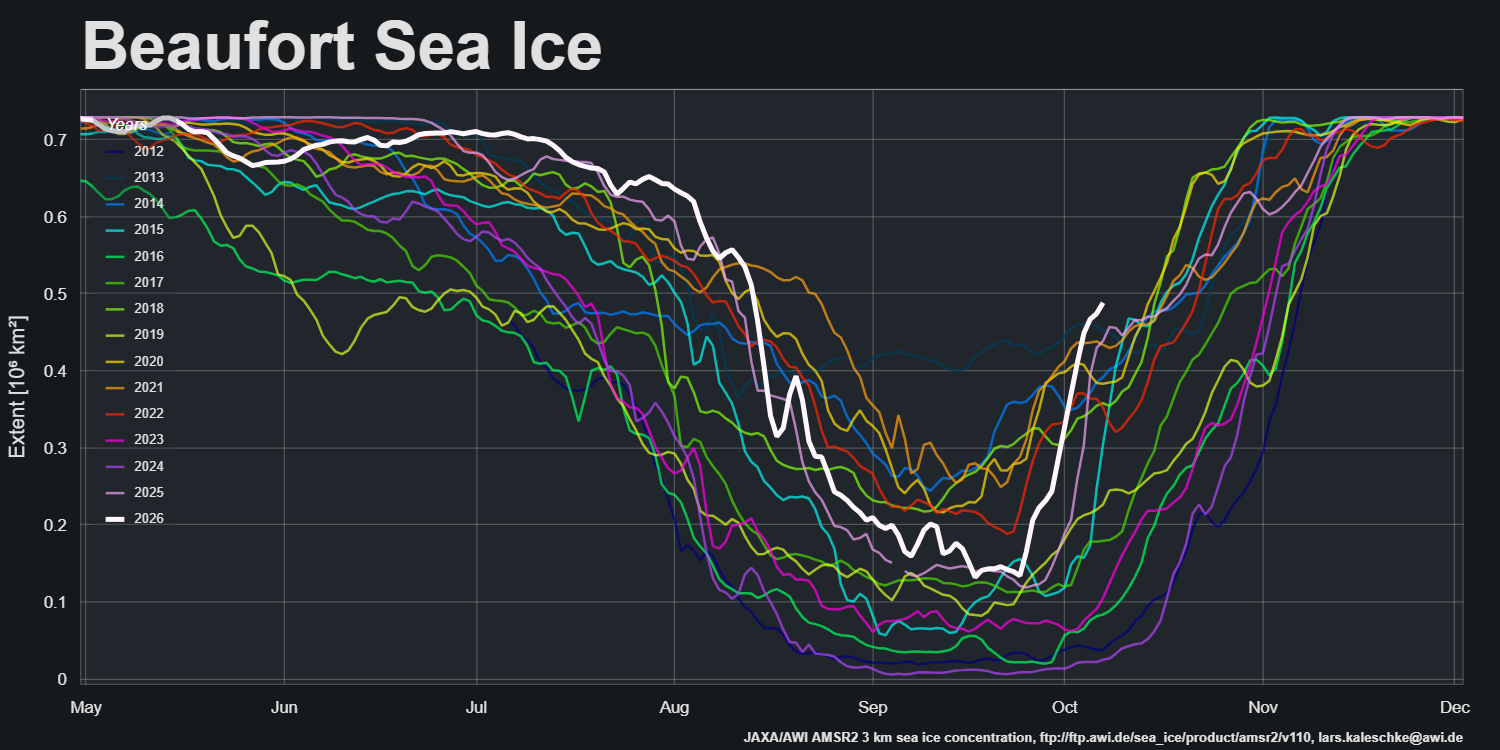
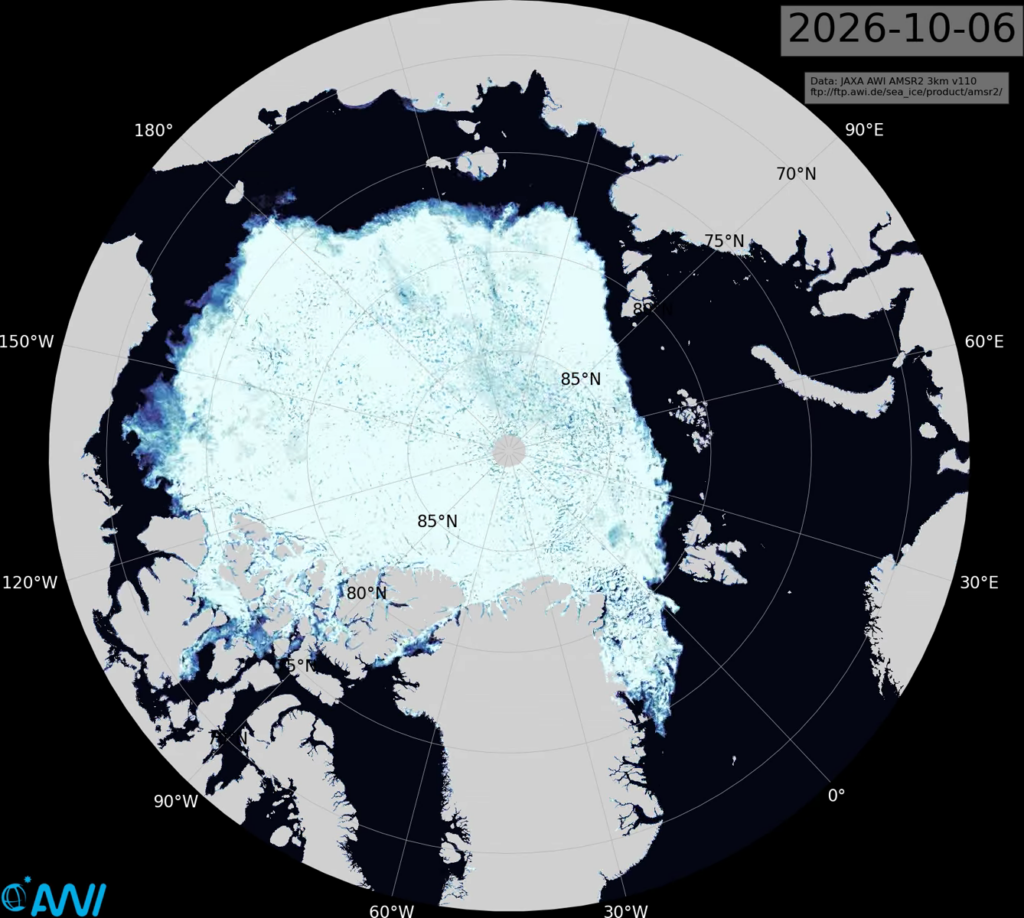
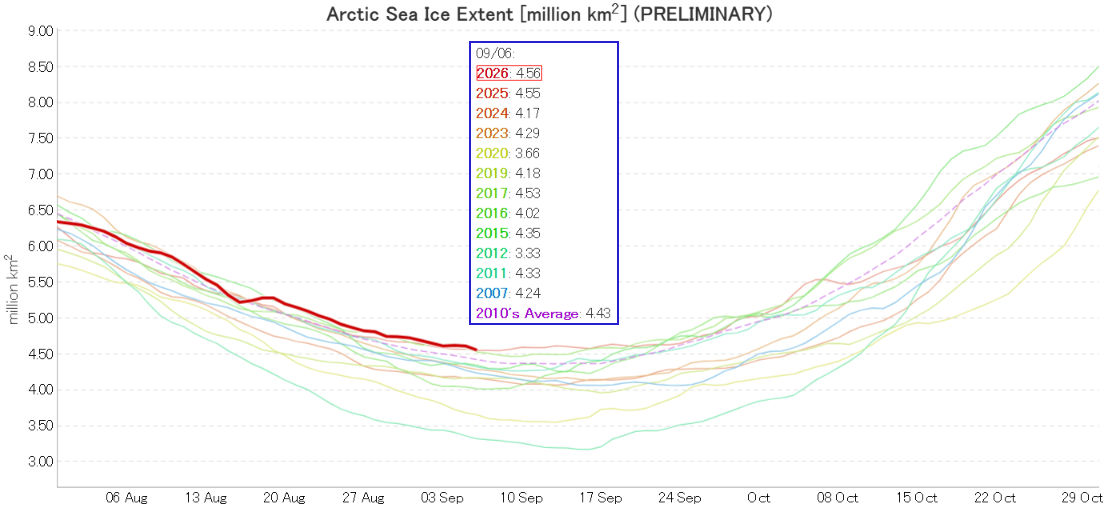
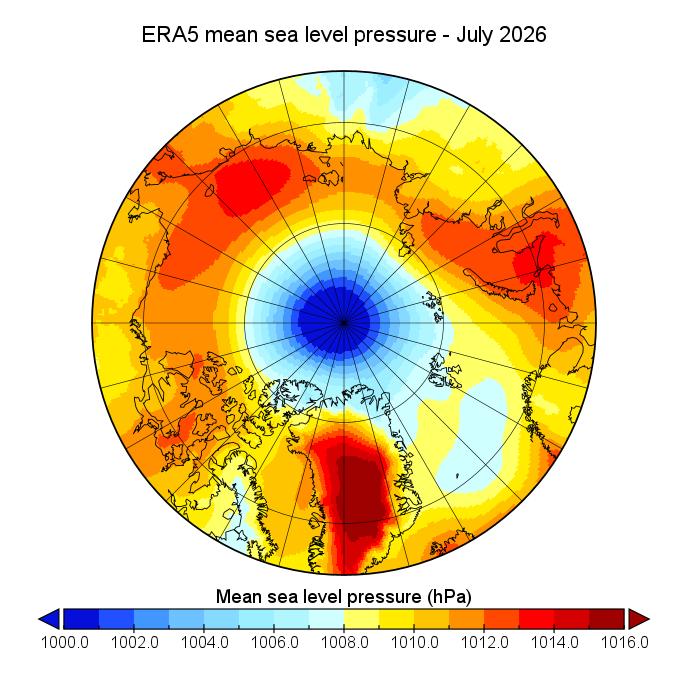
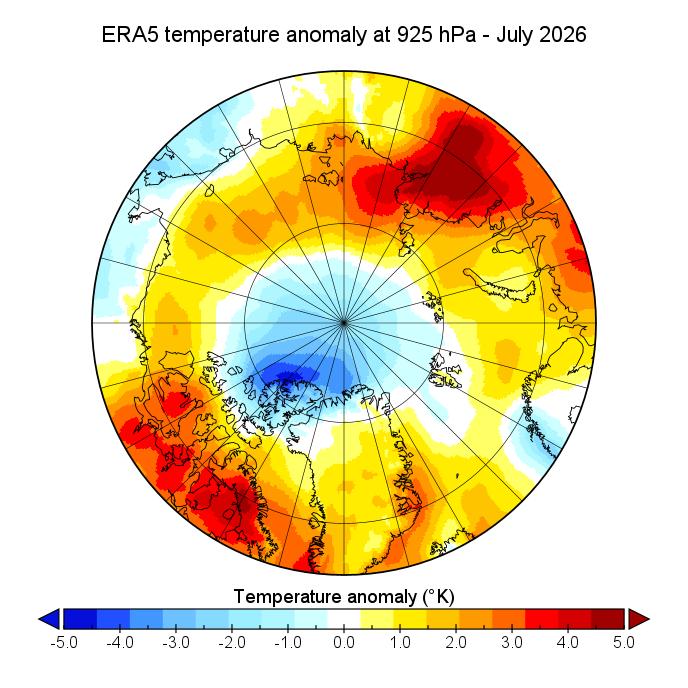
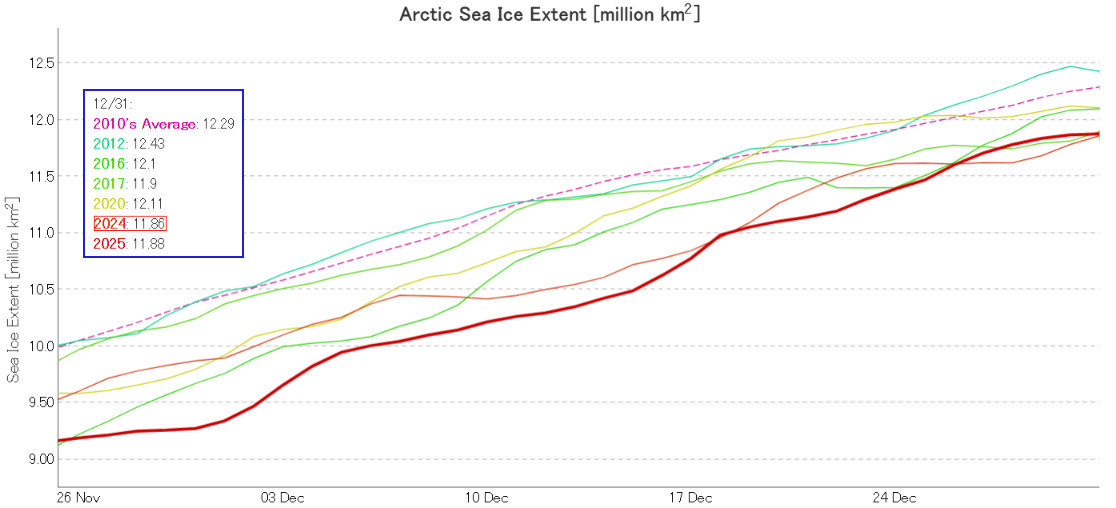
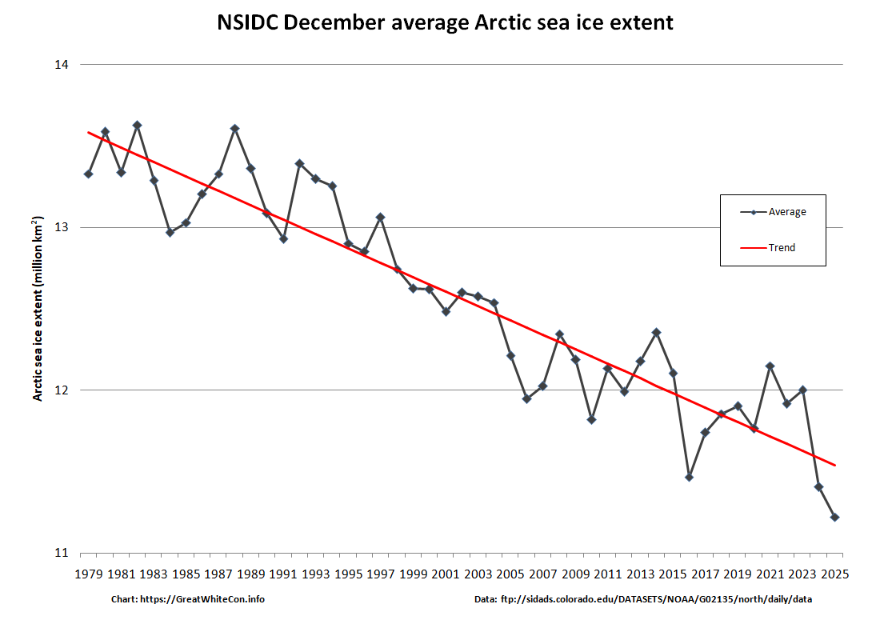
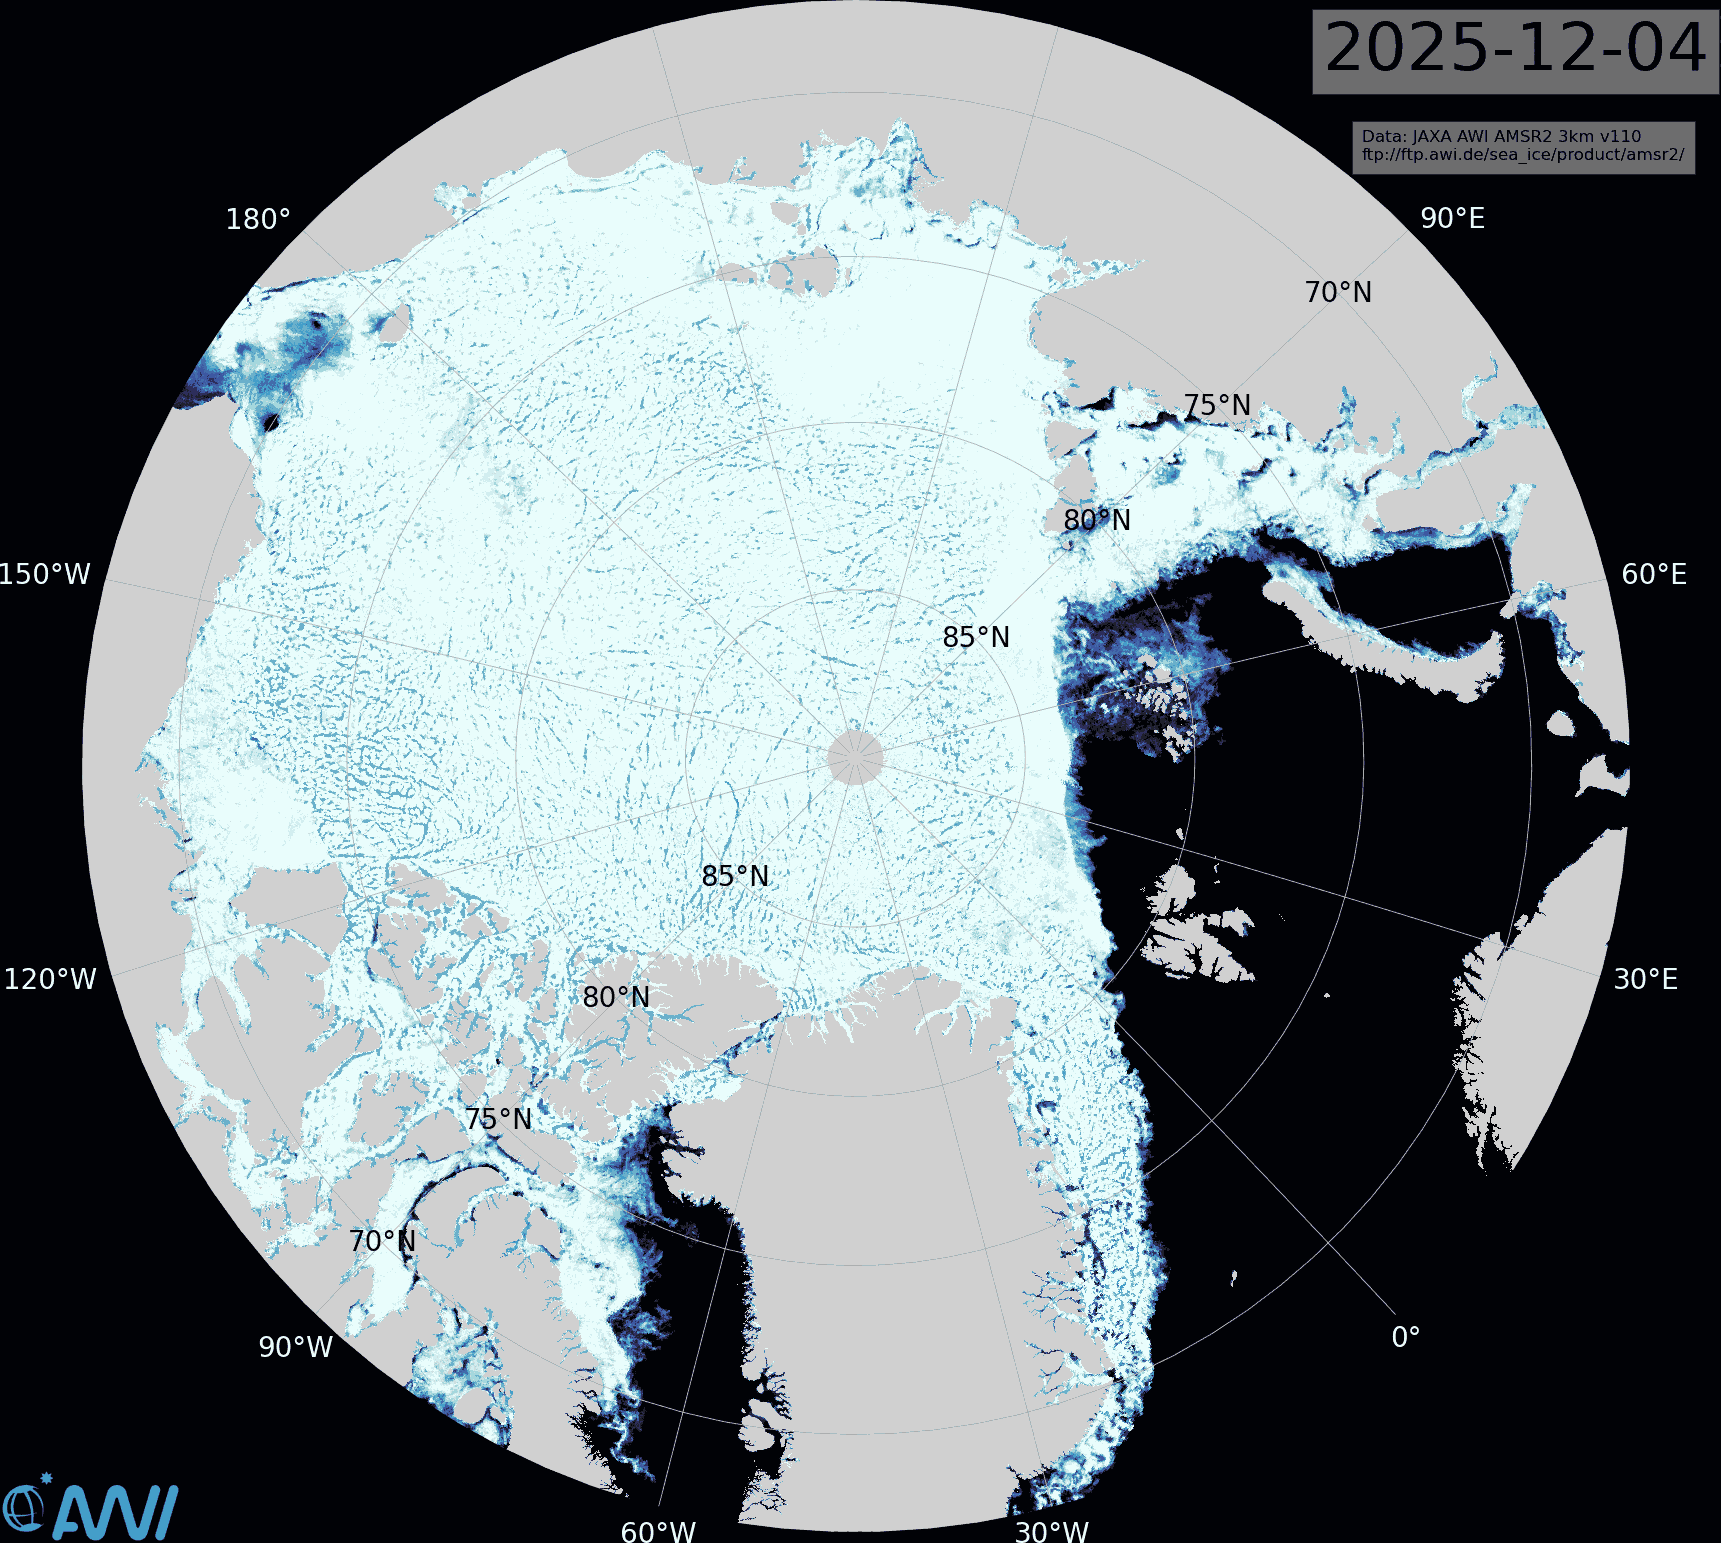
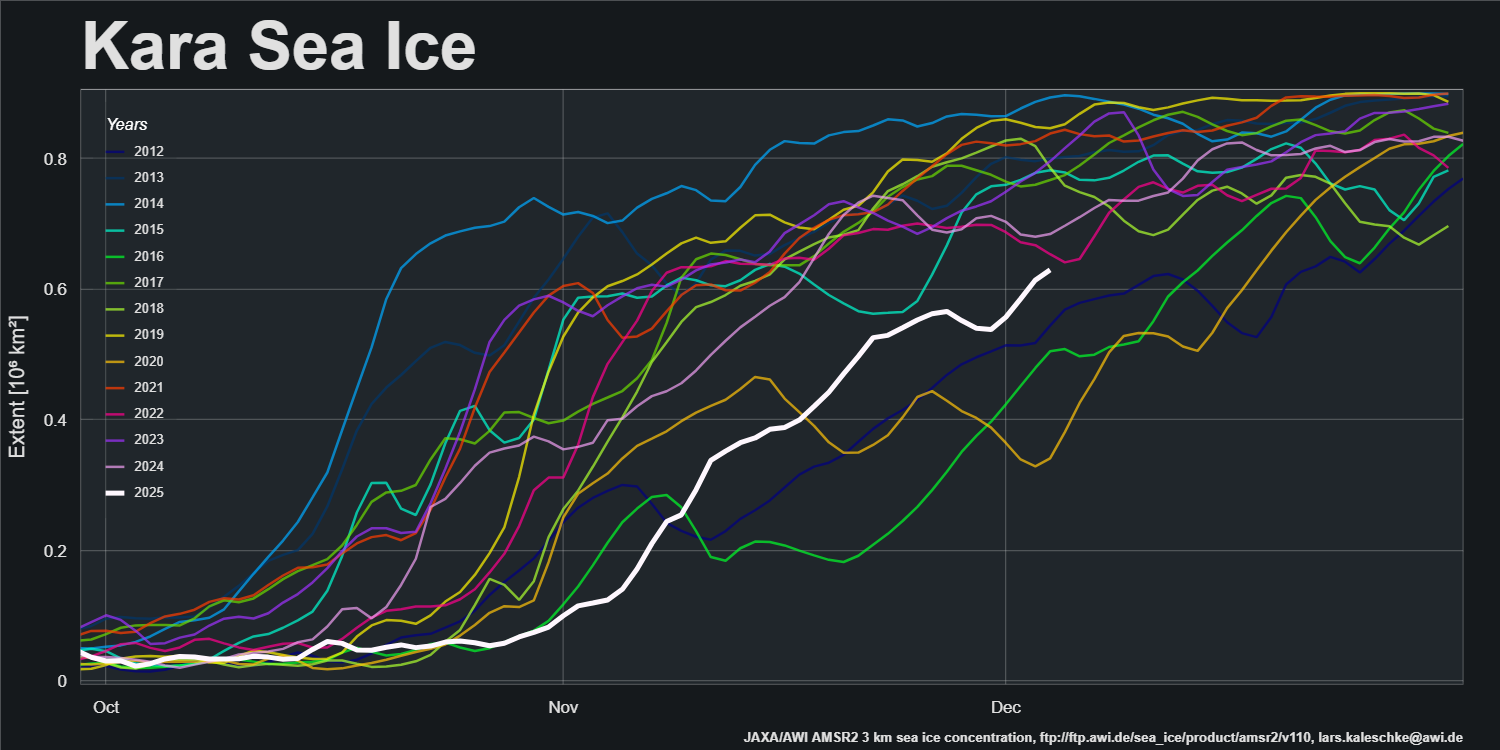
July was once again dominated by low pressure and anomalously low temperatures over the central Arctic:
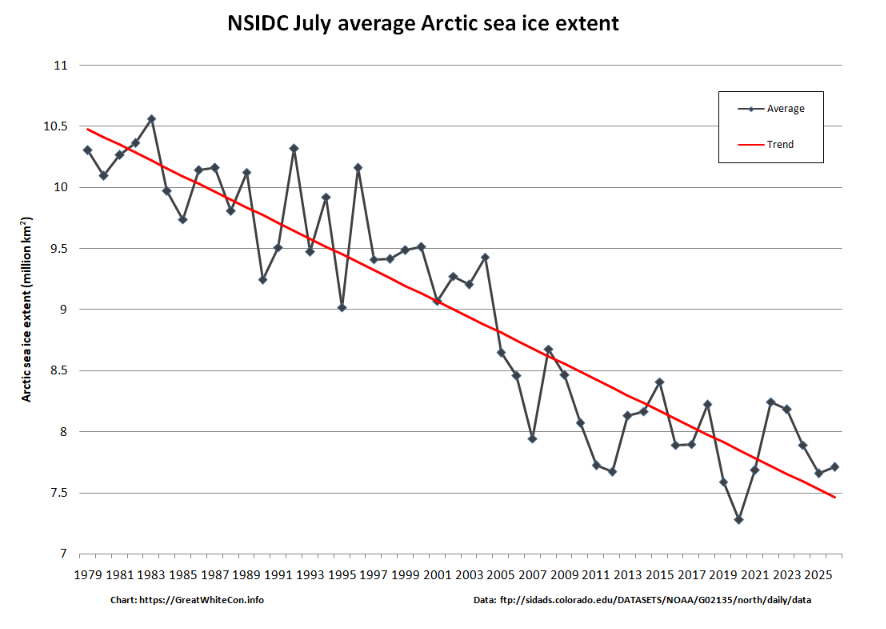
As a consequence the NSIDC monthly average extent for July was 6th lowest in their record going back to 1979:
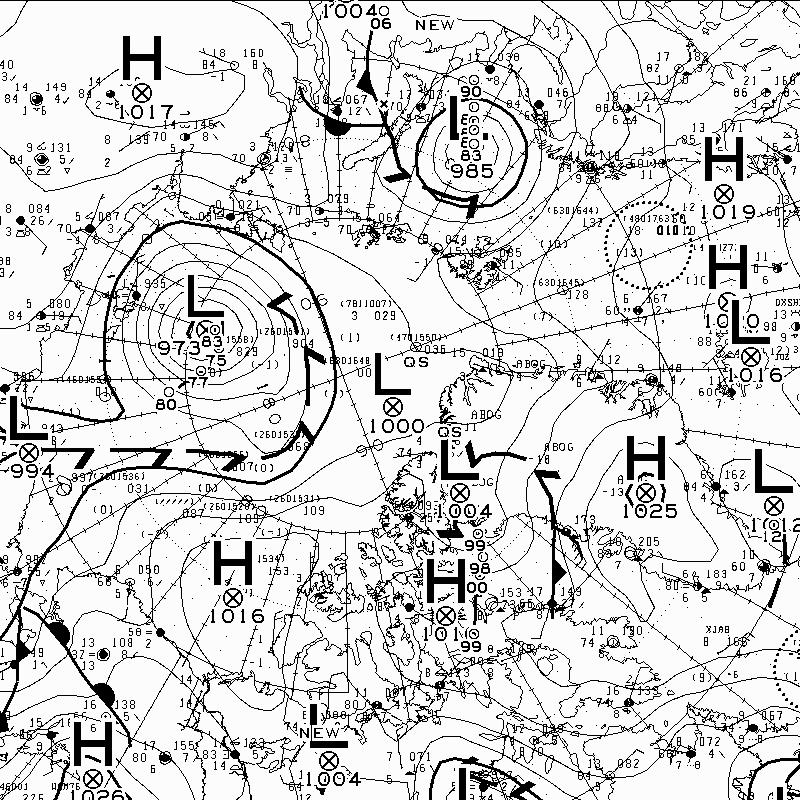
August began with low pressure still dominant. According to the Canadian Meteorological Centre yet another cyclone bottomed out with a mean sea level pressure of 973 hPa on the 4th:
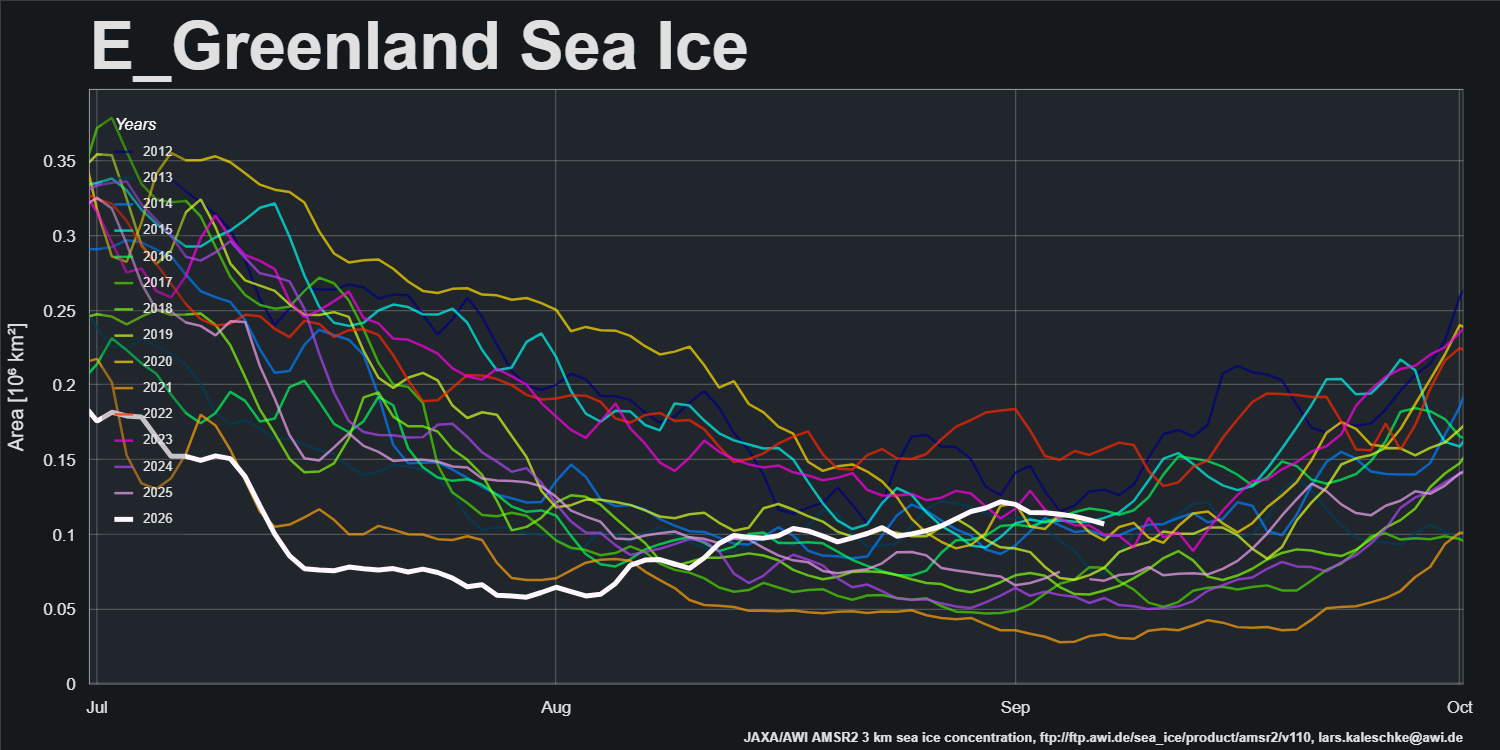
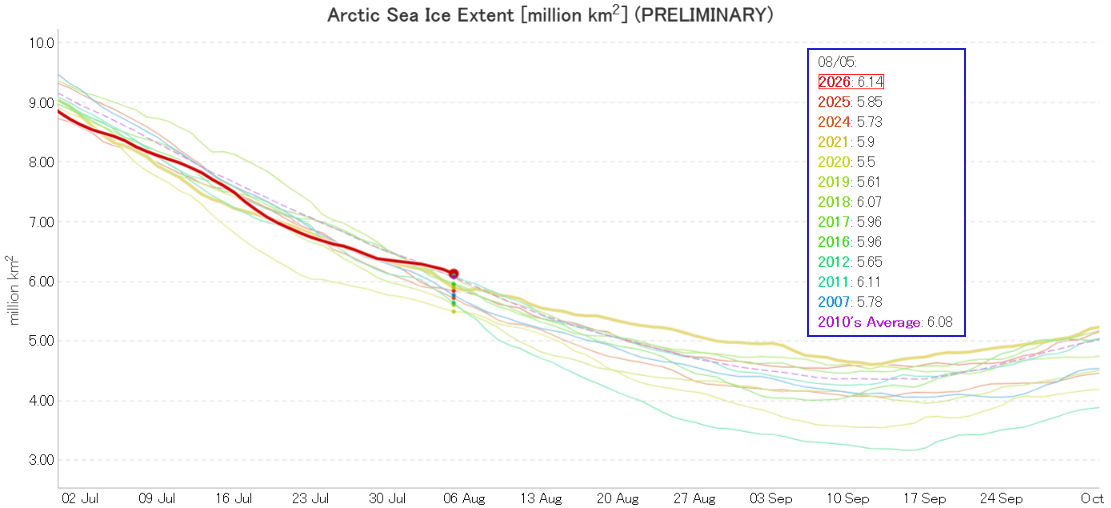
The continuing cyclonic activity has dispersed the sea ice, and JAXA extent is currently 12th lowest in their record:
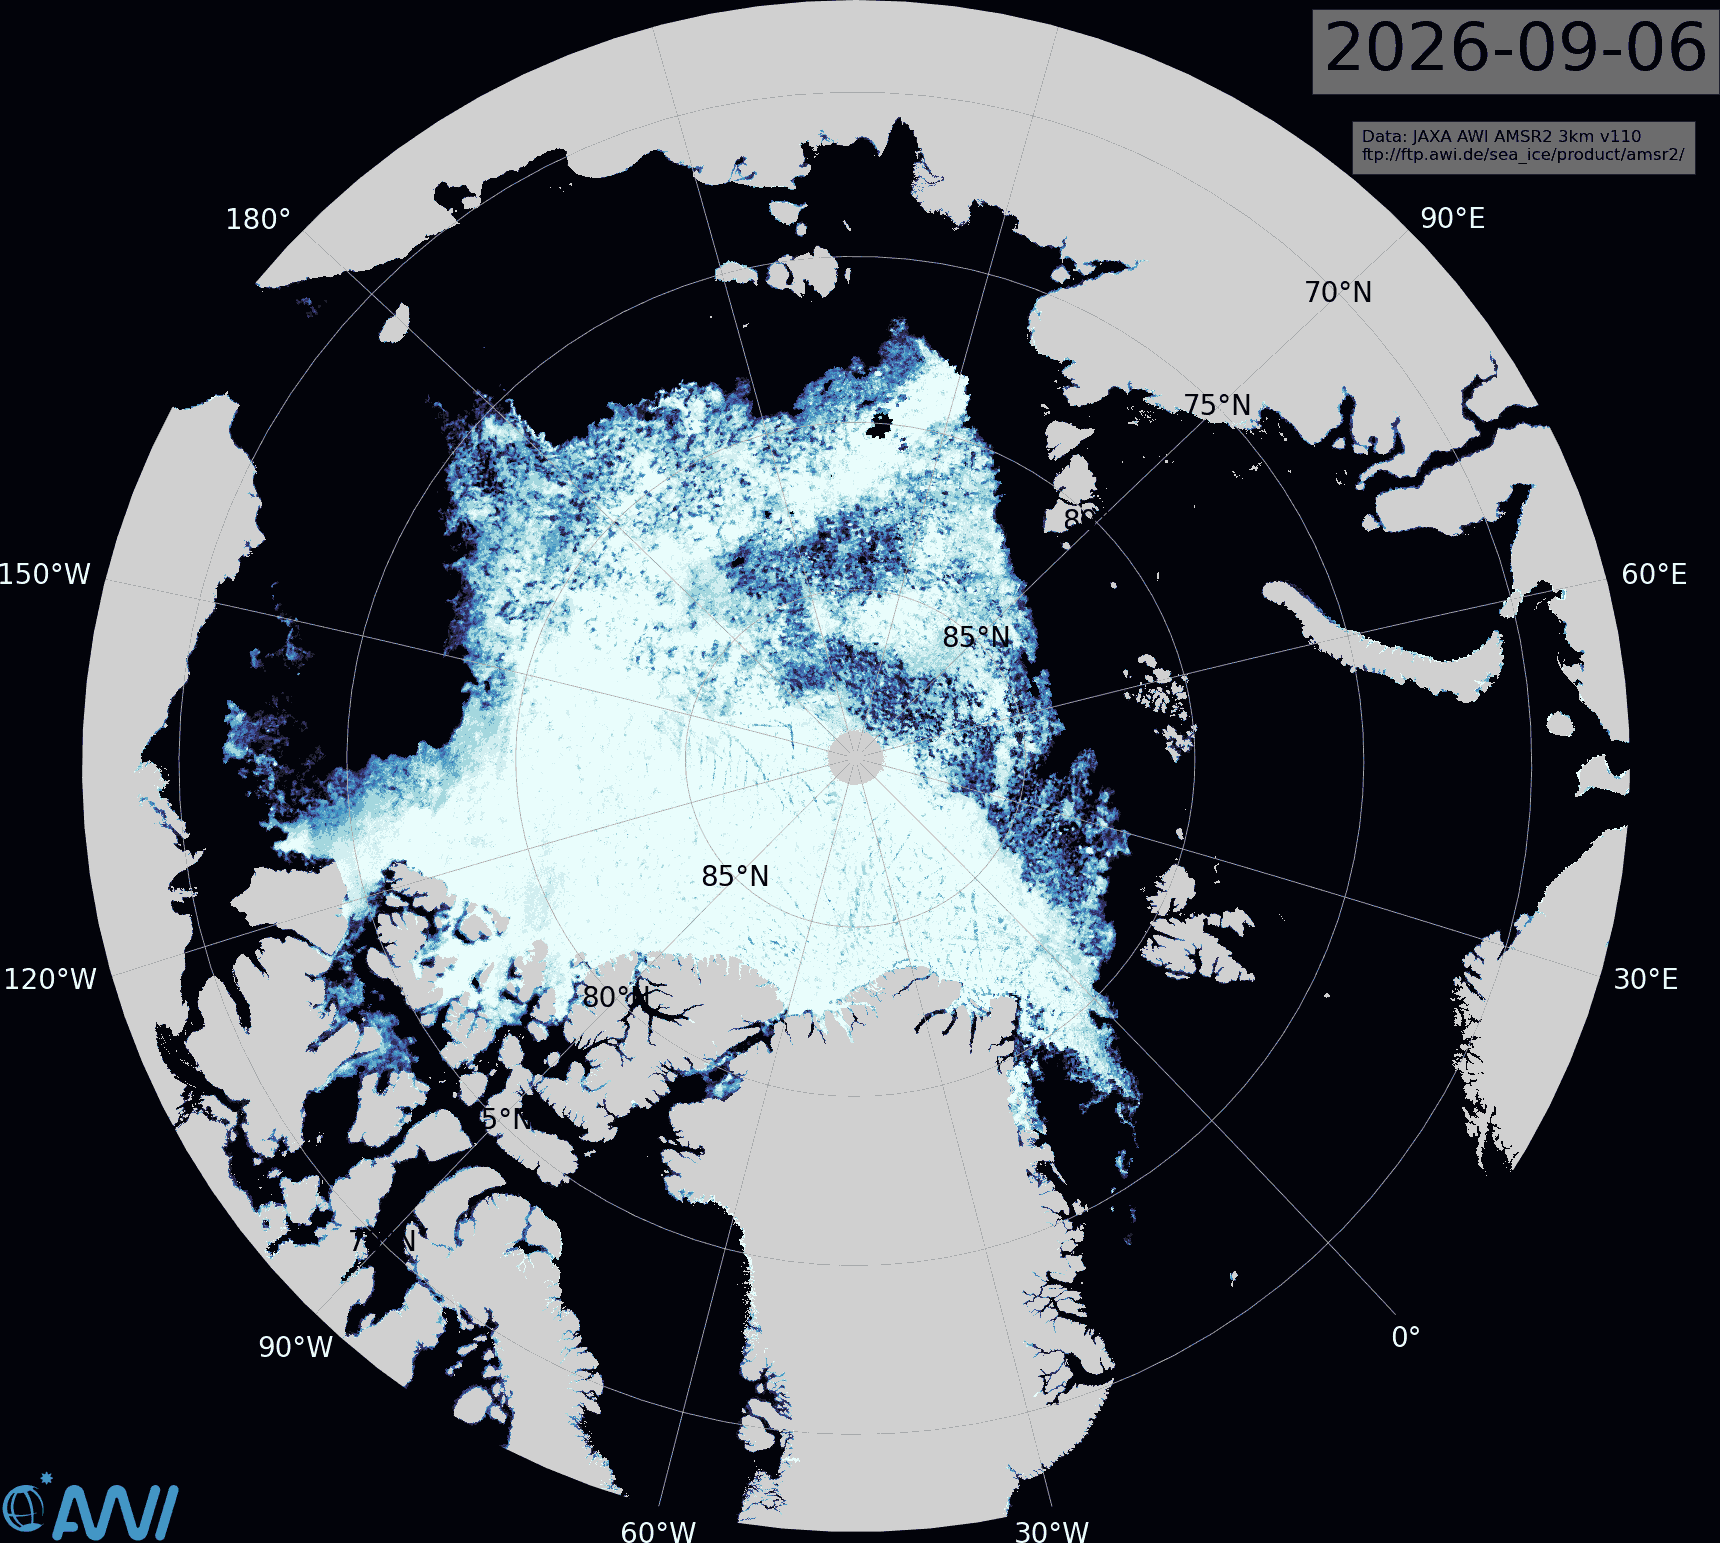
The other side of the same coin is that reduced sea ice concentration is now apparent across large areas of the Central Arctic Basin:
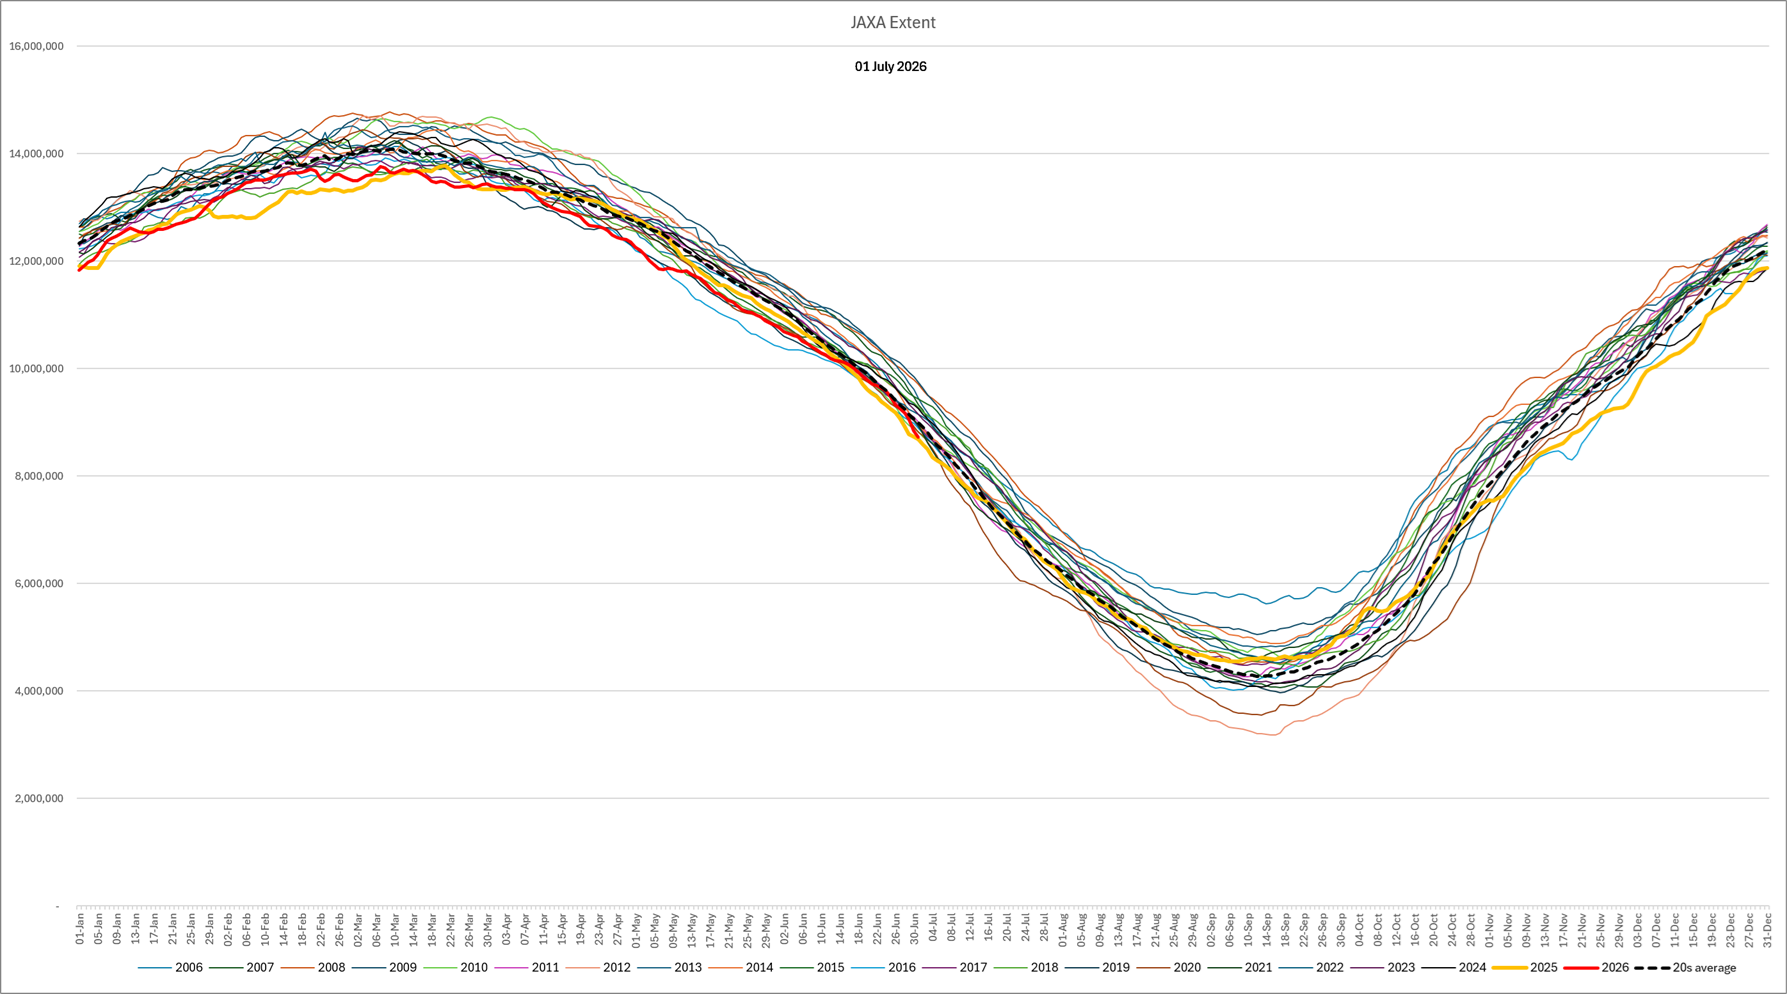
At the beginning of July the JAXA/ViSHOP web site is undergoing maintenance yet again! Here here is how their 2 day average extent graph looked for July 1st:
Extent is currently second lowest for the date, above 2025 by a whisker.
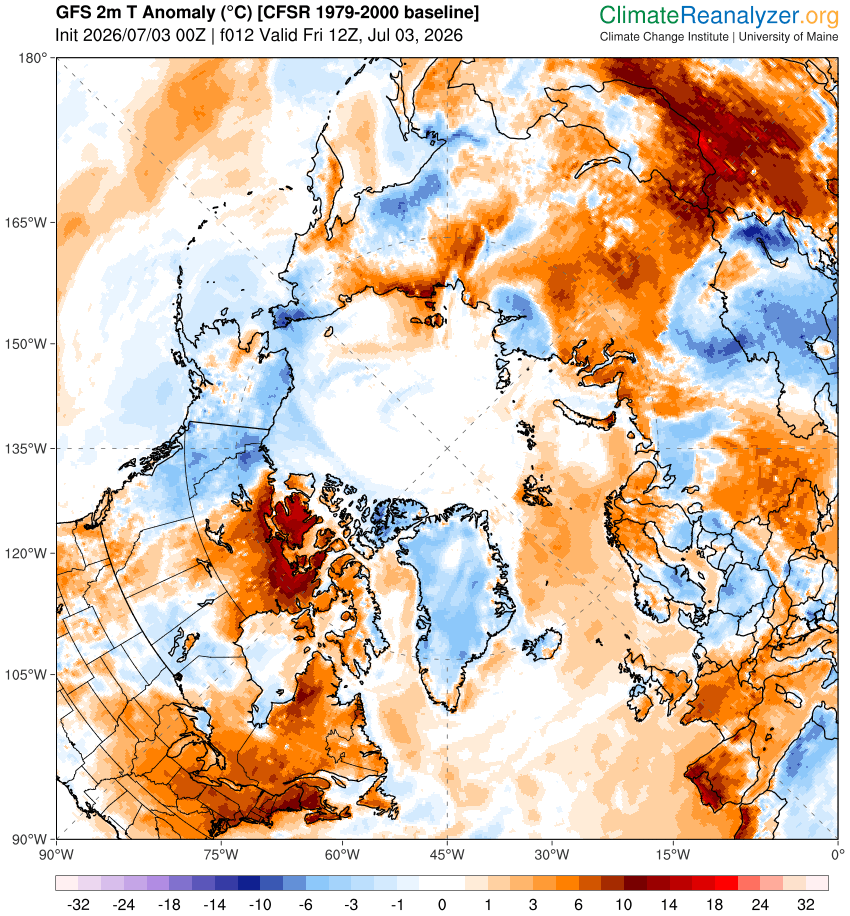
Looking next at temperature anomalies across the Arctic, the Beaufort and Chukchi Seas are slightly cooler than the 1979-2000 climatology. However, the East Siberian Sea and particularly the Canadian Arctic Archipelago are well above what used to be considered “normal”:
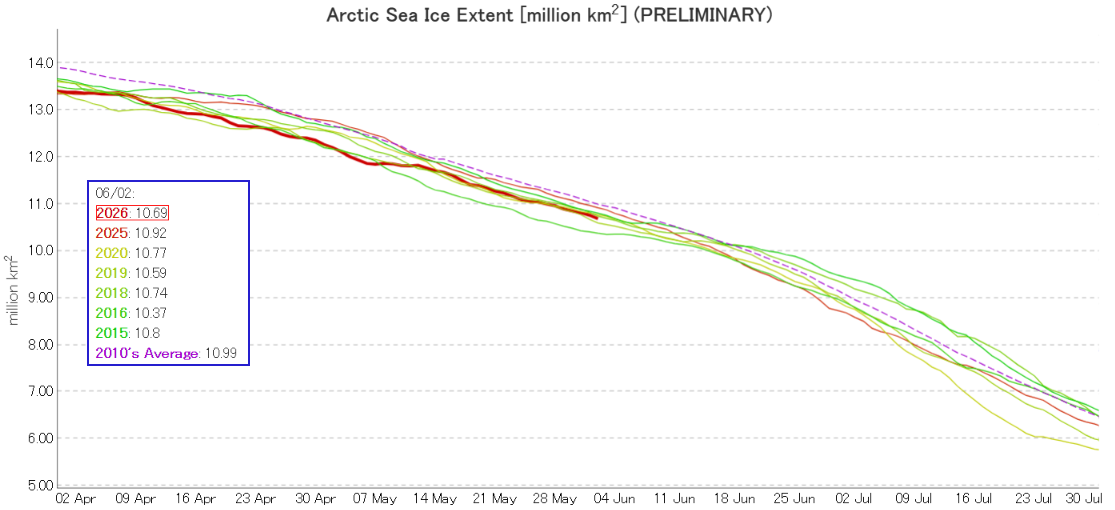
The JAXA/ViSHOP web site is currently undergoing maintenance, but here is how their 2 day average extent graph looked for June 2nd:
Extent was 3rd lowest in the JAXA record, behind 2016 and 2019.
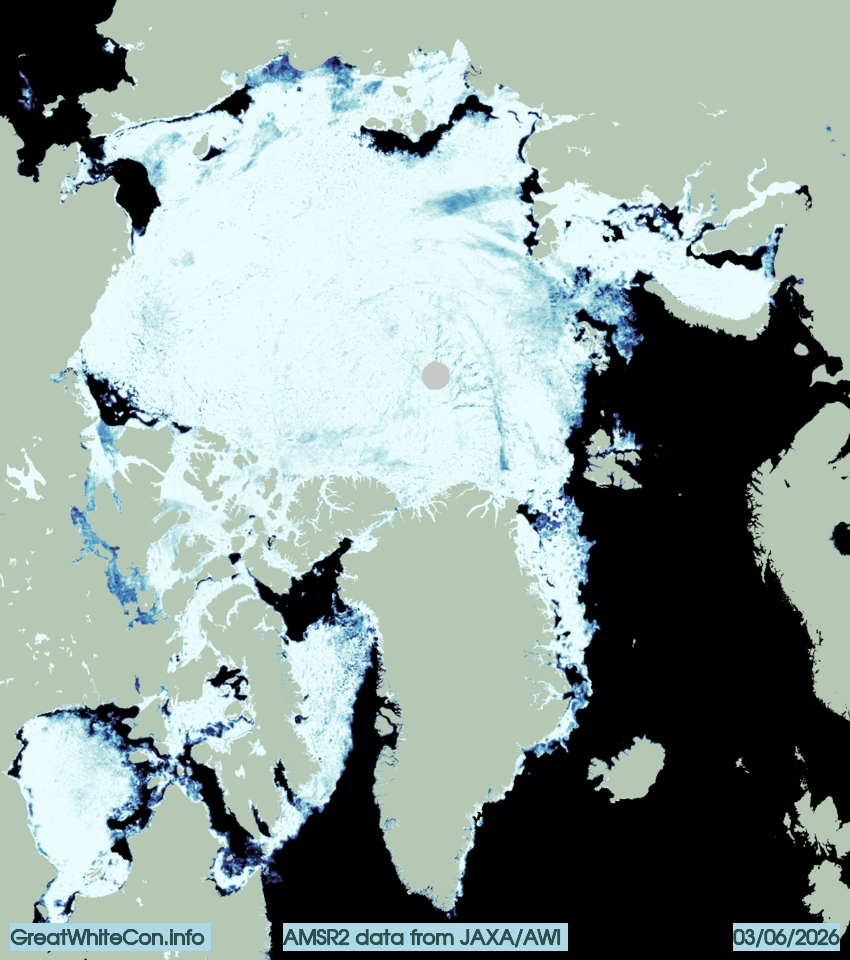
The Alfred Wegener Institute’s sea ice concentration data shows that the Bering Sea is now largely free of sea ice, and the areas of open water in the Beaufort, Chukchi, East Siberian and Laptev Seas continue to expand:
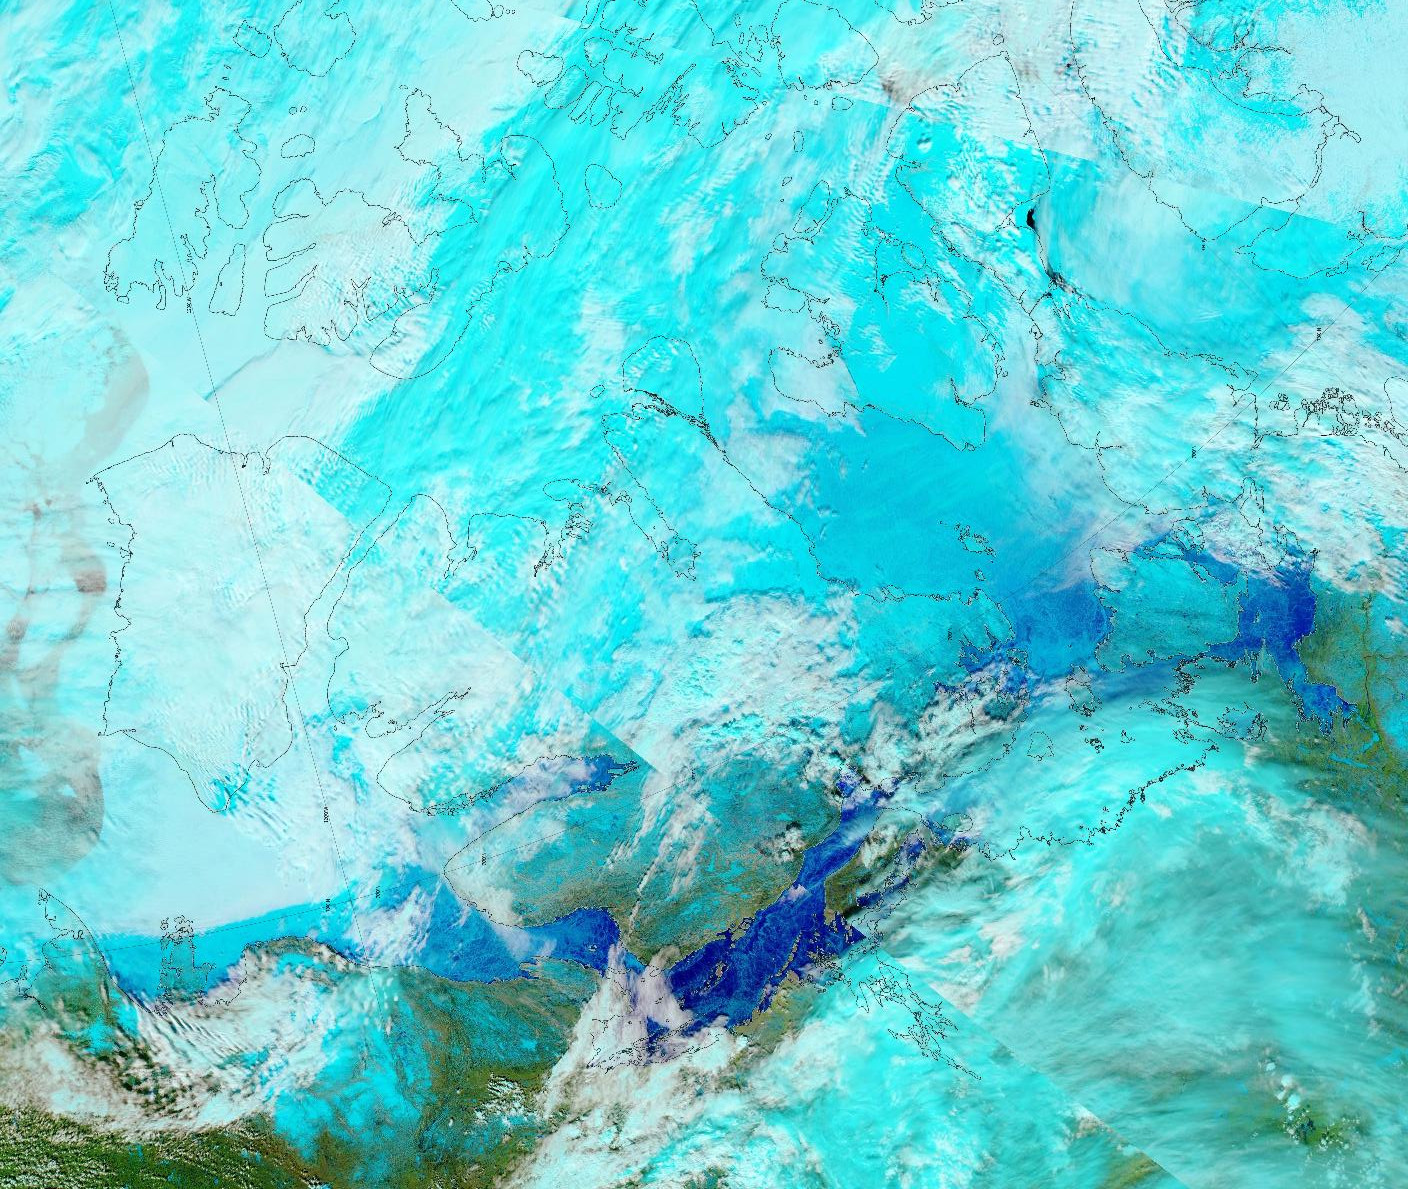
The sea ice concentration map also shows open water in much of Lancaster Sound. Also apparent is the widespread presence of melt ponds along the southern part of the Canadian Arctic Archipelago. Here’s a closer, albeit somewhat cloudy, look:
“False colour” image of the Canadian Arctic Archipelago on June 3rd from the MODIS instrument on the Aqua satellite
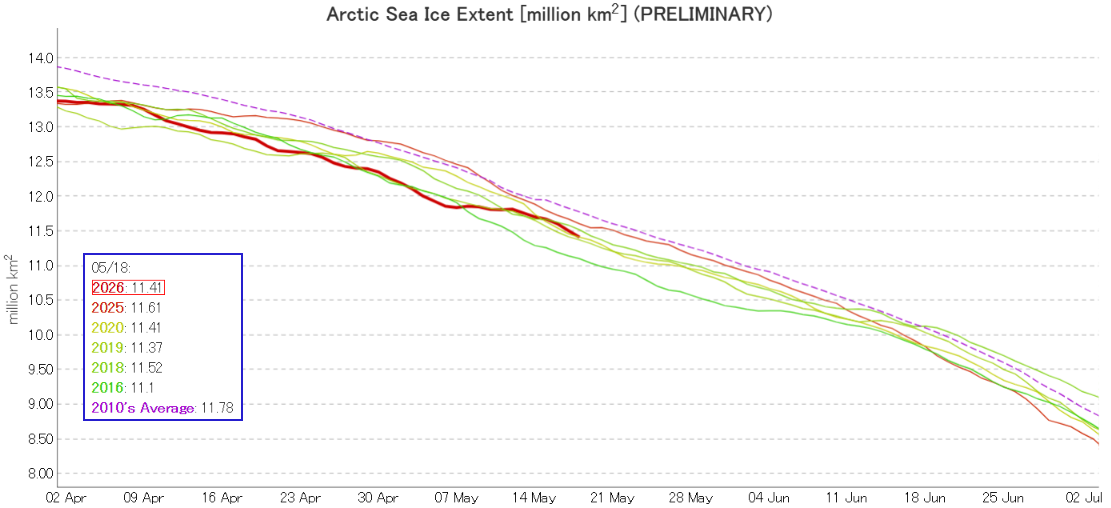
JAXA have updated their visualisations of Arctic sea ice extent data. The “traditional” 2 day average graph is now labelled “preliminary”, and currently shows 2026 in a tie with 2020 for third lowest for the date:
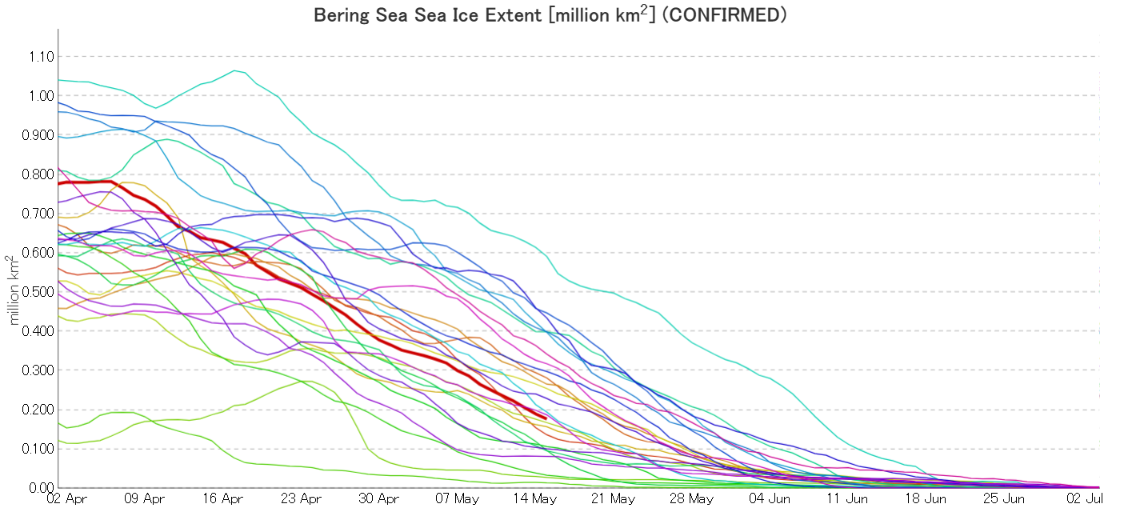
5 day averaged “confirmed” data is also available, including regional graphs. By way of example here’s JAXA’s latest extent graph for the Bering Sea, dated May 15th:
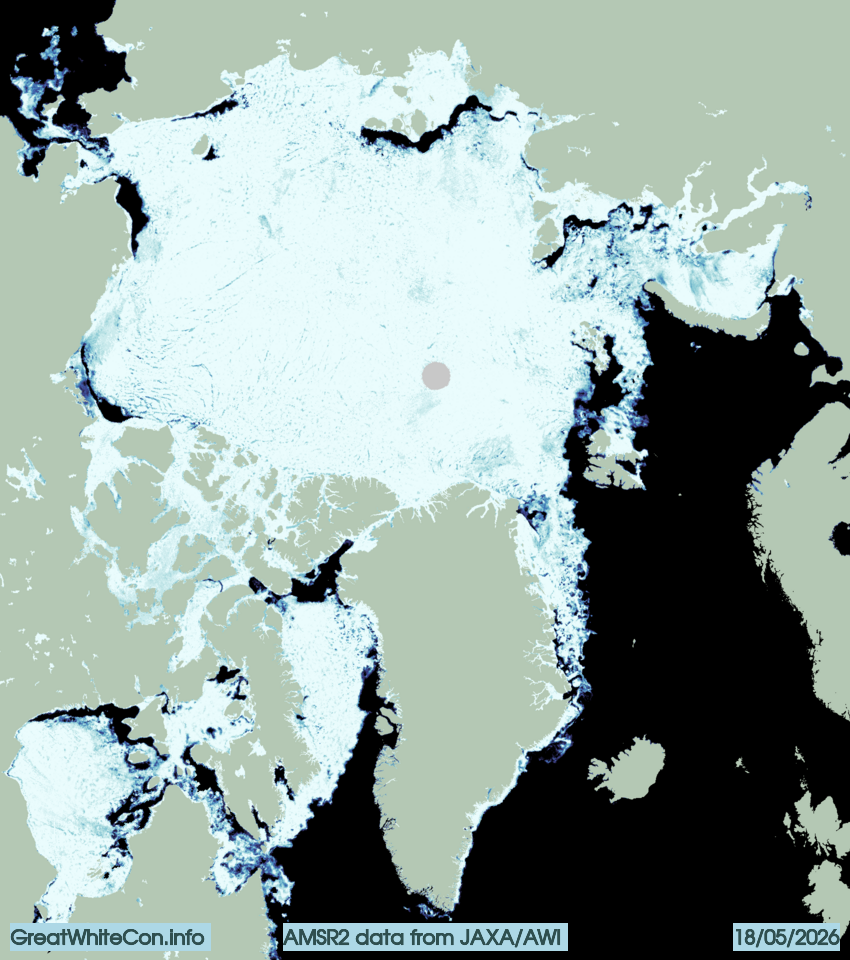
The Alfred Wegener Institute’s sea ice concentration data reveals open water in the Beaufort, Chukchi, East Siberian and Laptev Seas:
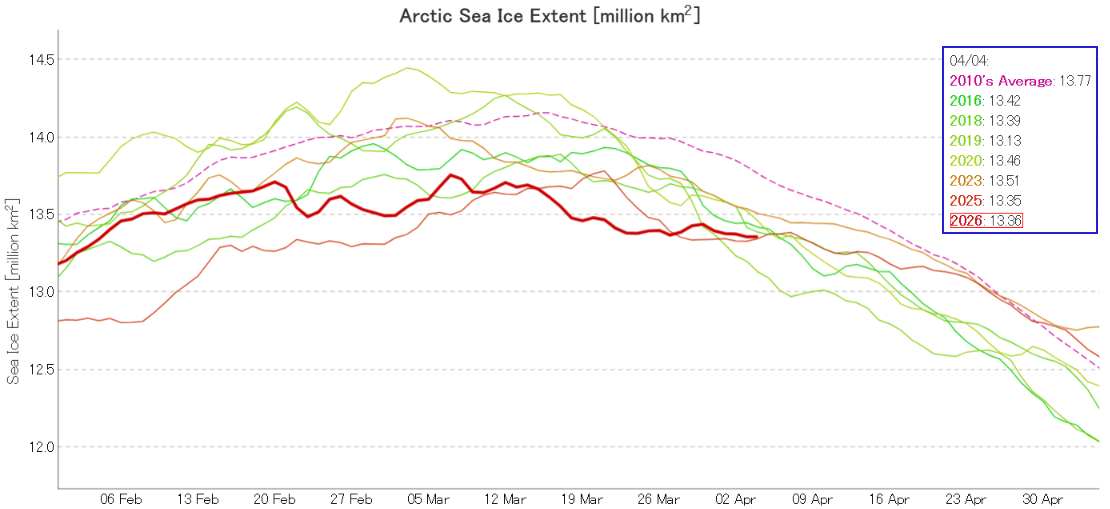
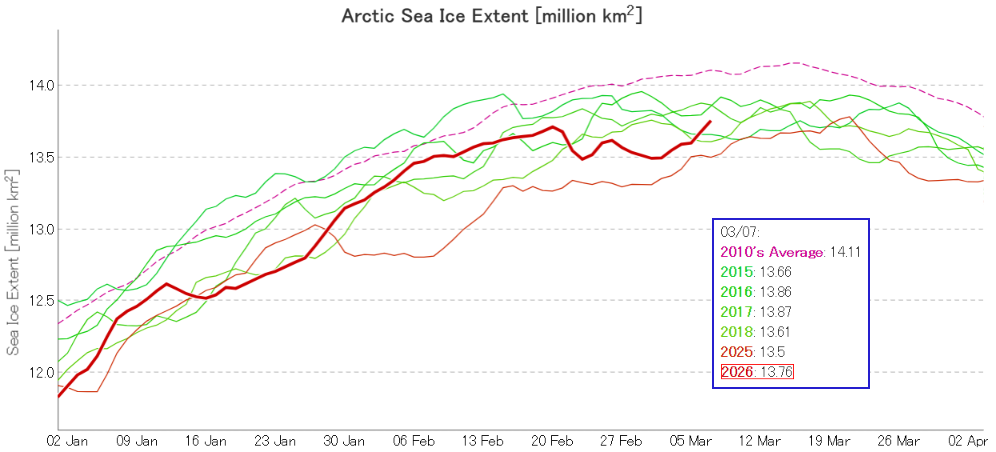
In early April JAXA Arctic sea ice extent is 3rd lowest for the date, albeit in a “statistical tie” with last year:
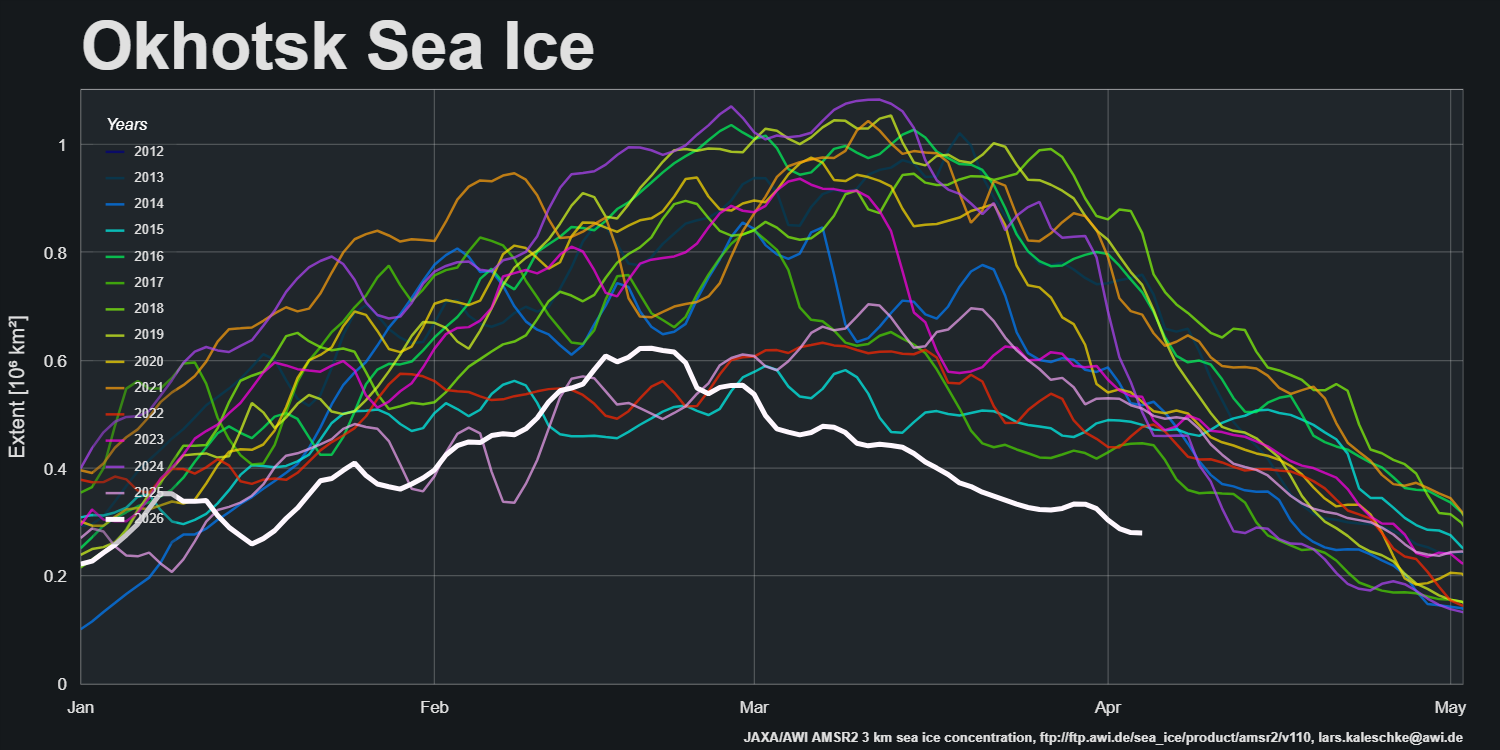
The Alfred Wegener Institute’s regional extent graphs reveal an intriguing divergence on the Pacific periphery, where sea ice extent in the Sea of Okhotsk is at an all time low for the date in the AMSR2 record:
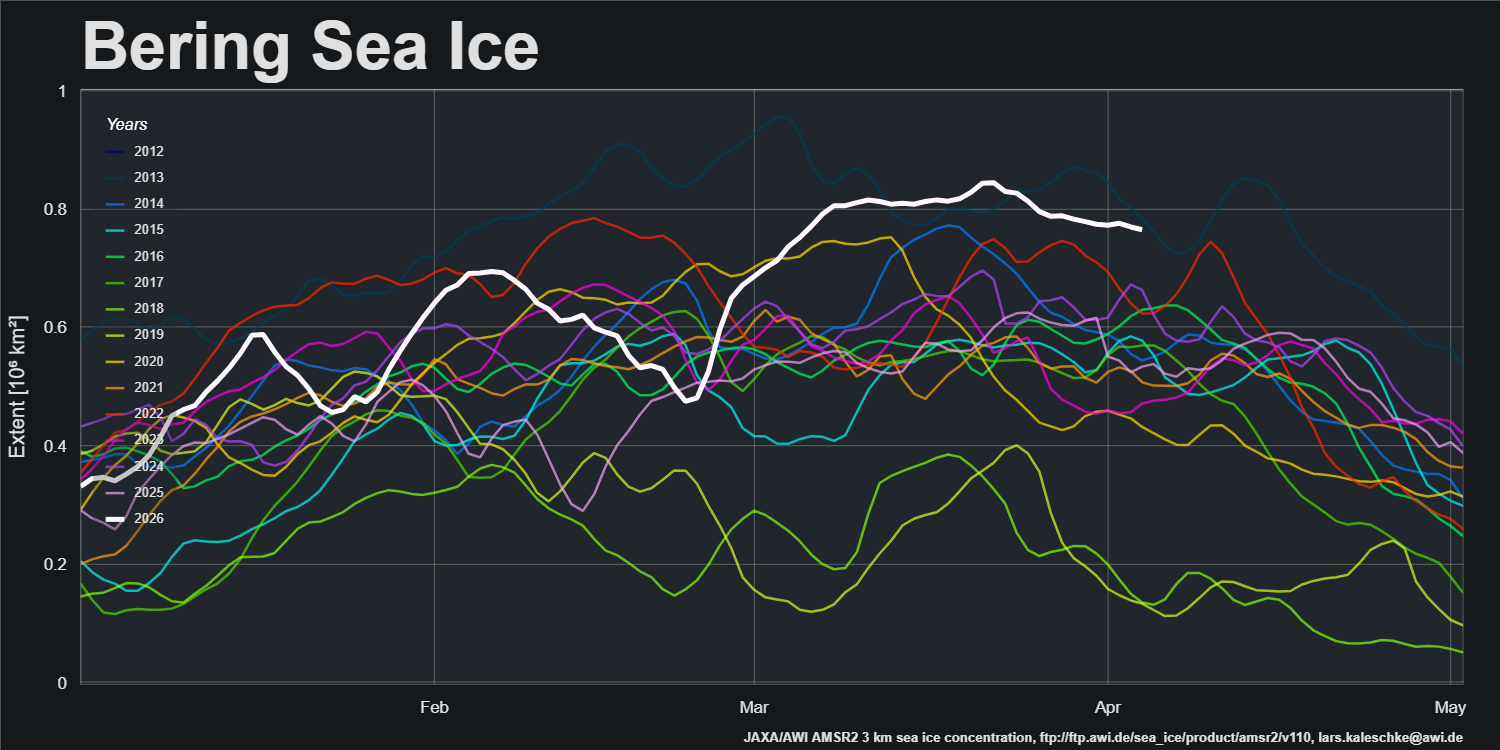
On the other hand extent in the Bering Sea is close to an all time high:
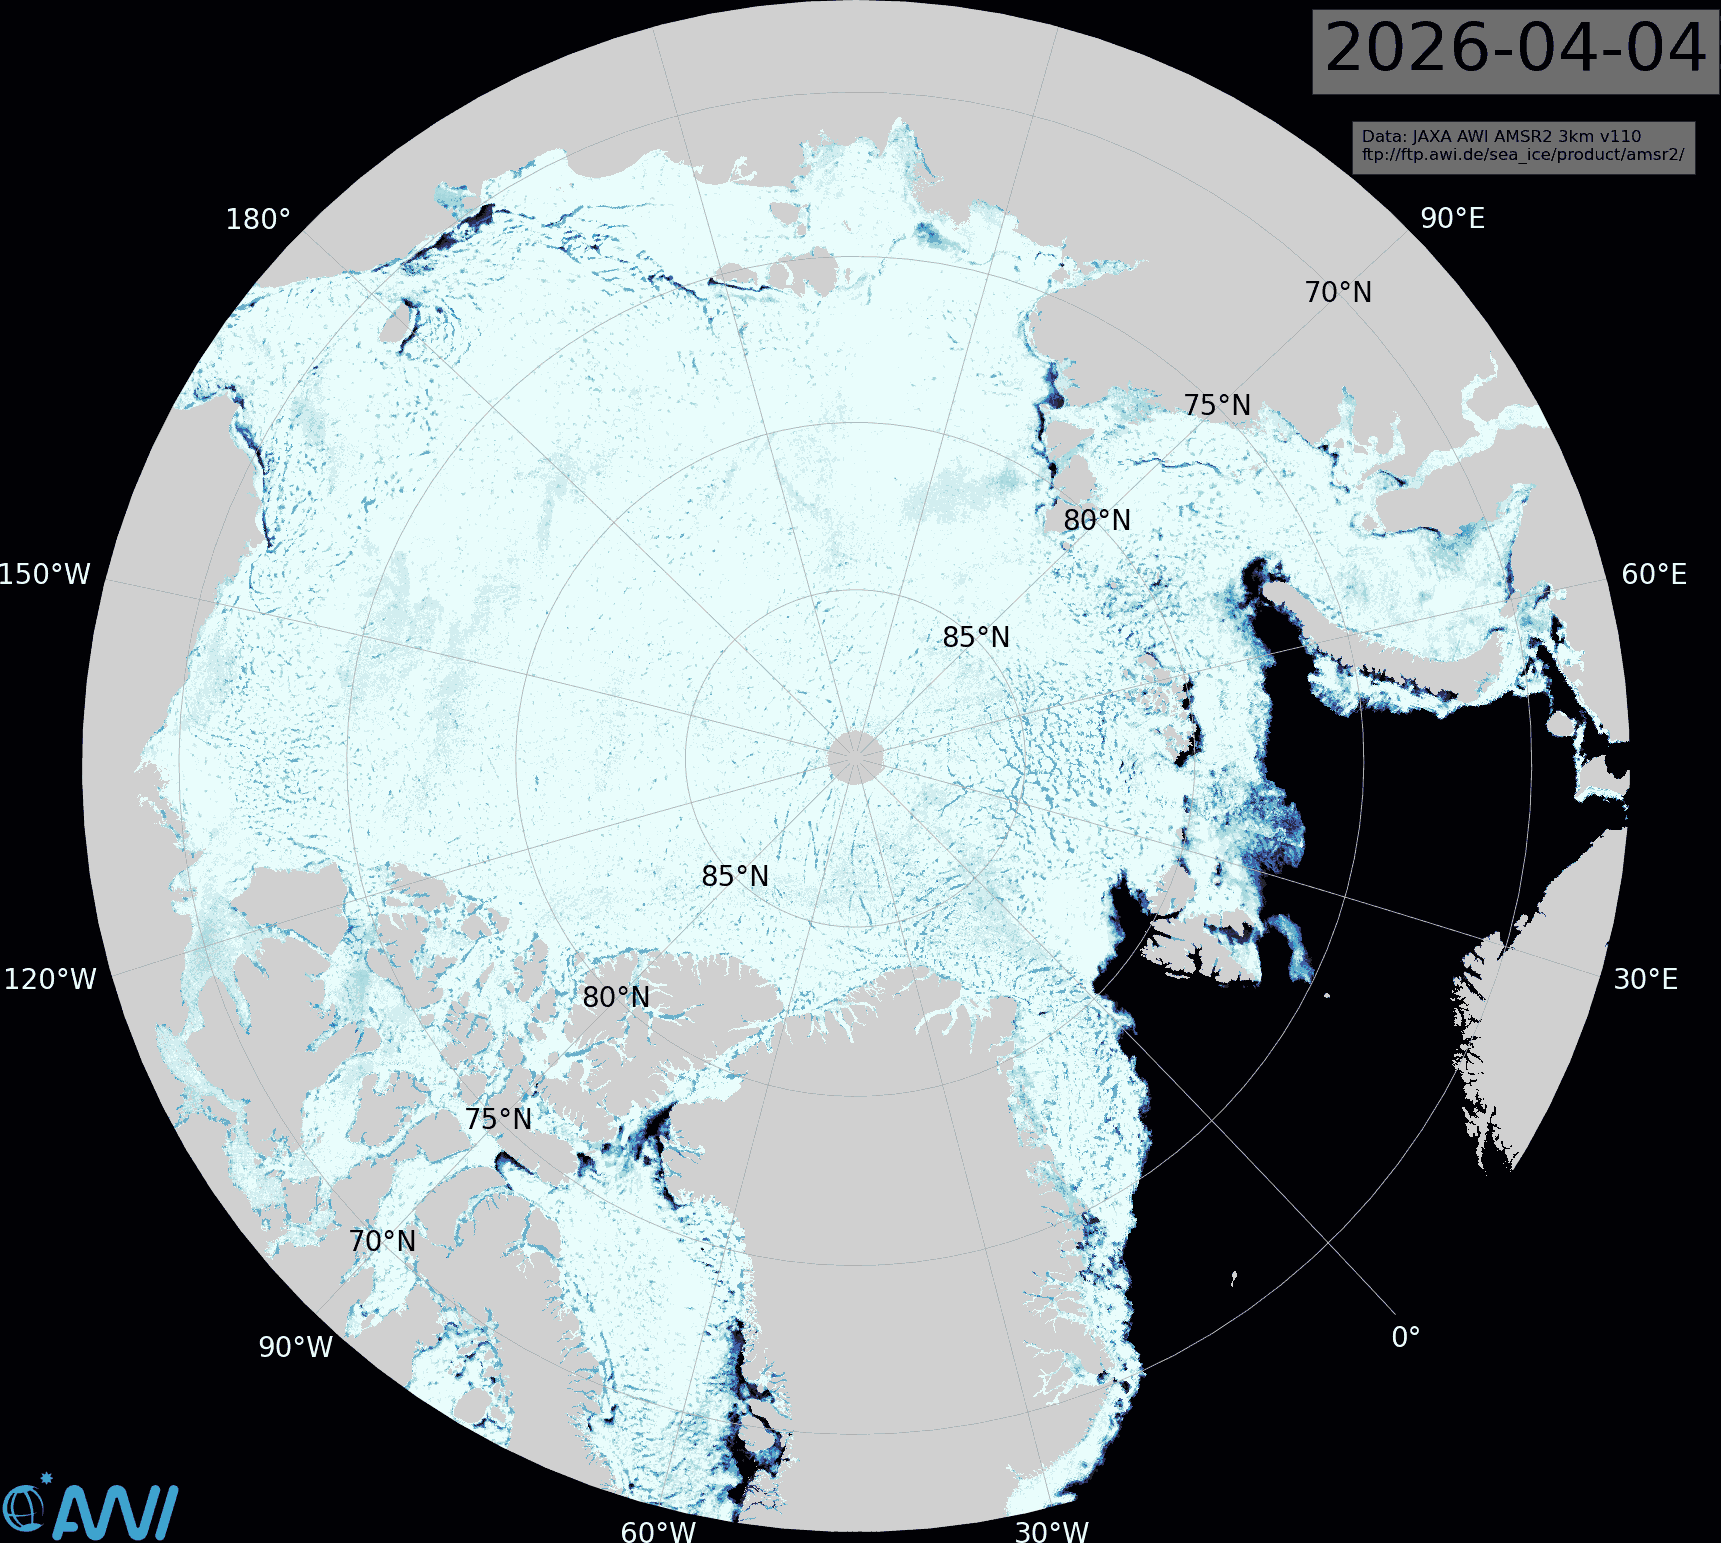
On the Atlantic periphery extent is less extreme, although there is currently open water north of Svalbard:
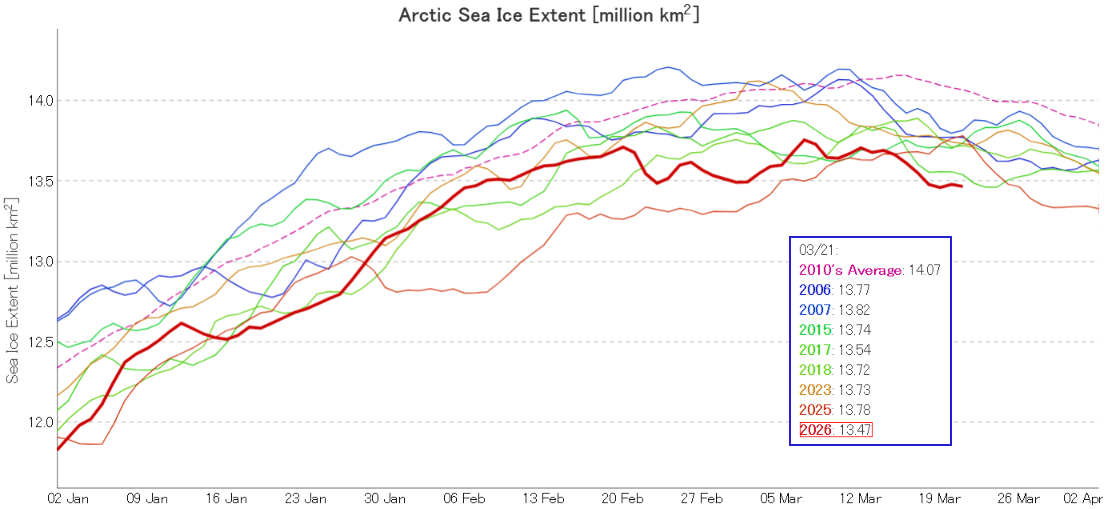
JAXA Arctic sea ice extent has just reached a new high for the year. At 13.76 million km² extent is currently 4th lowest for the date, just below last year’s maximum of 13.78 million km²:
JAXA extent is currently lowest for the date in their record going back to 1979. It’s highly likely that the metric peaked on March 7th which is a new record low maximum, albeit by a mere 20 thousand km²:
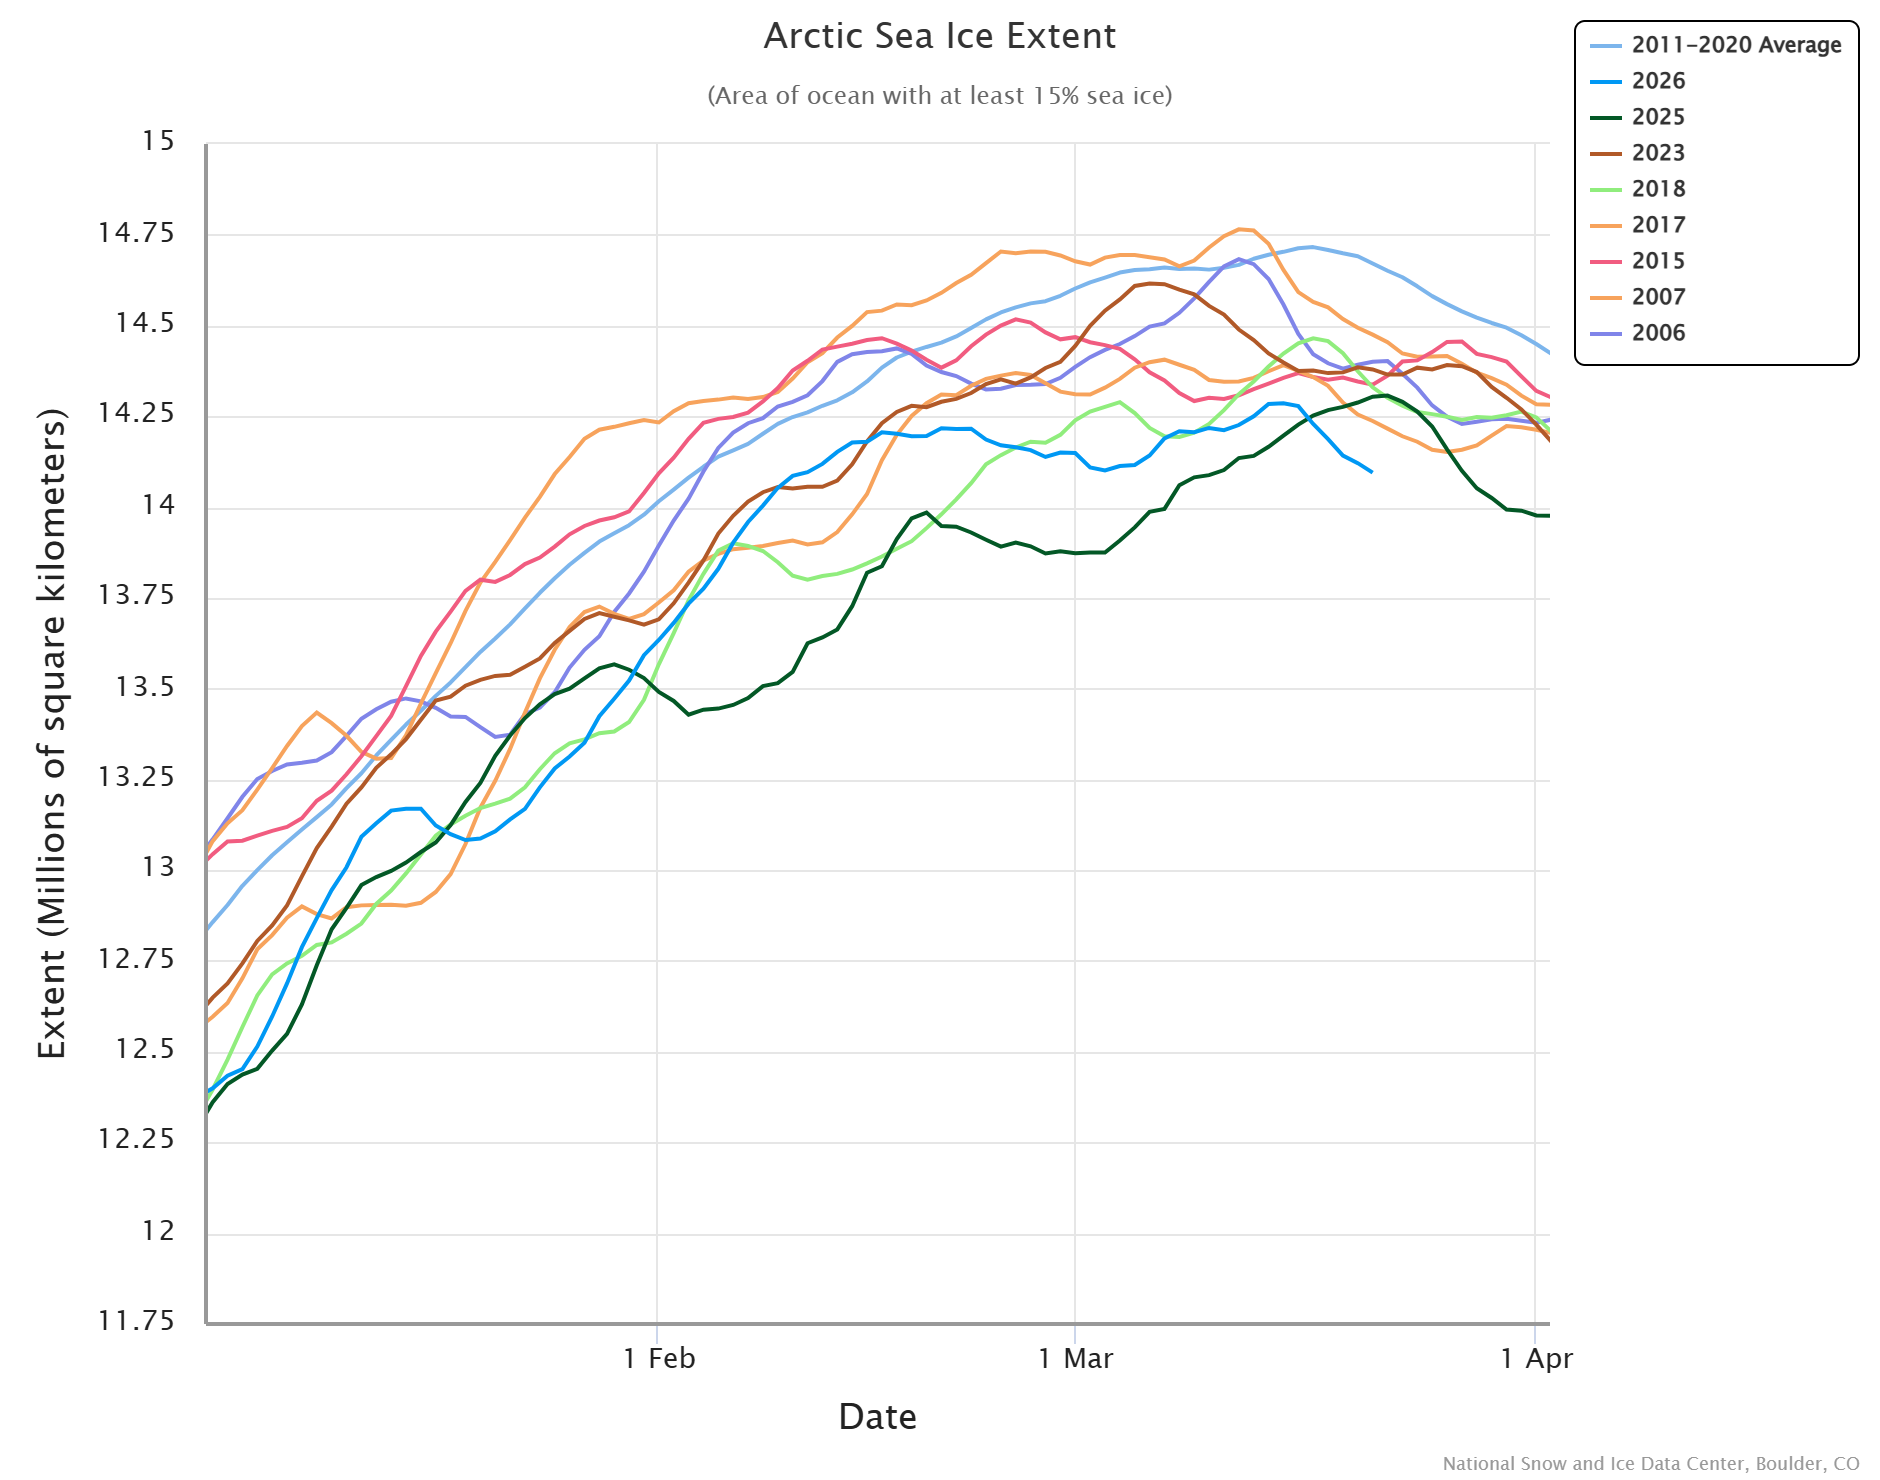
By way of a contrast, the National Snow and Ice Data Center’s 5 day averaged extent maximum of 14.29 million km² was reached on March 15th:
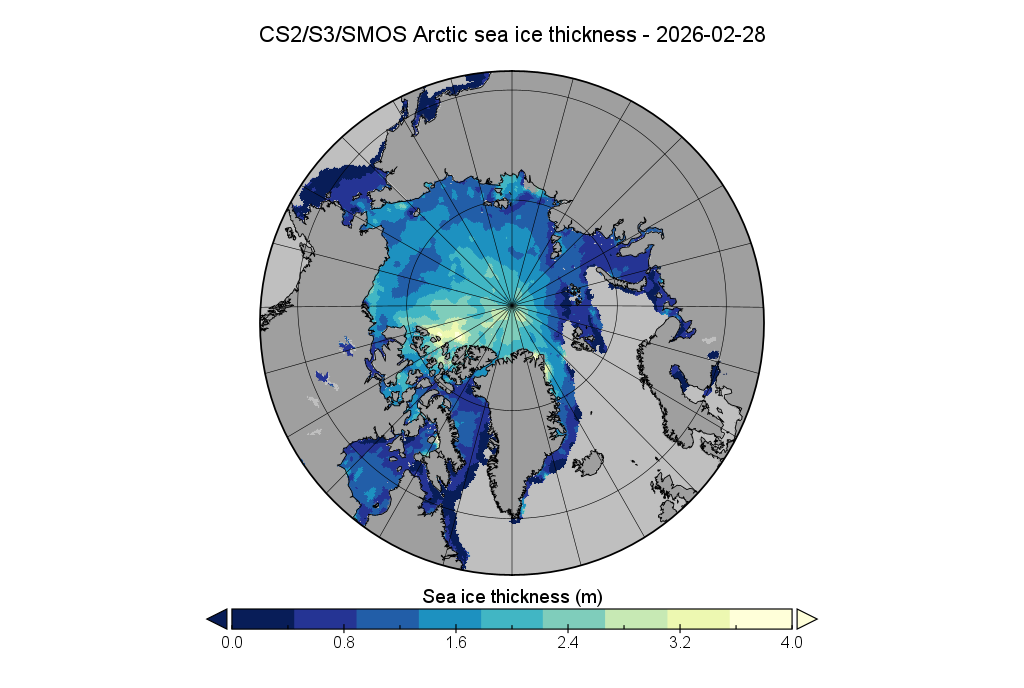
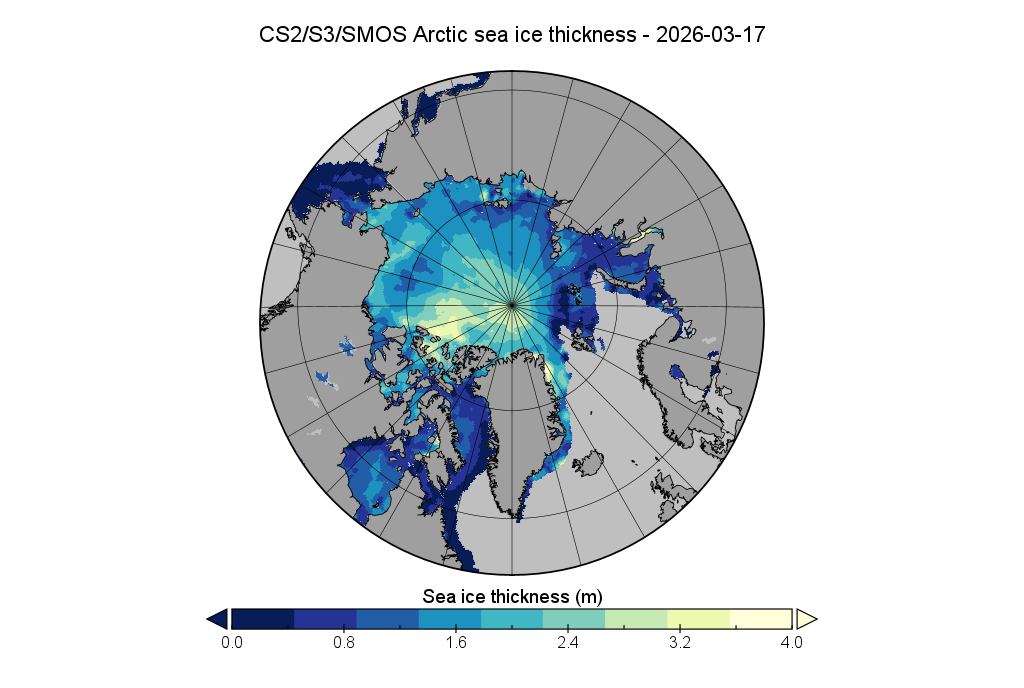
Here is the mid month update on the AWI’s CryoSat-2/Sentinel 3/SMOS Arctic sea ice thickness map:
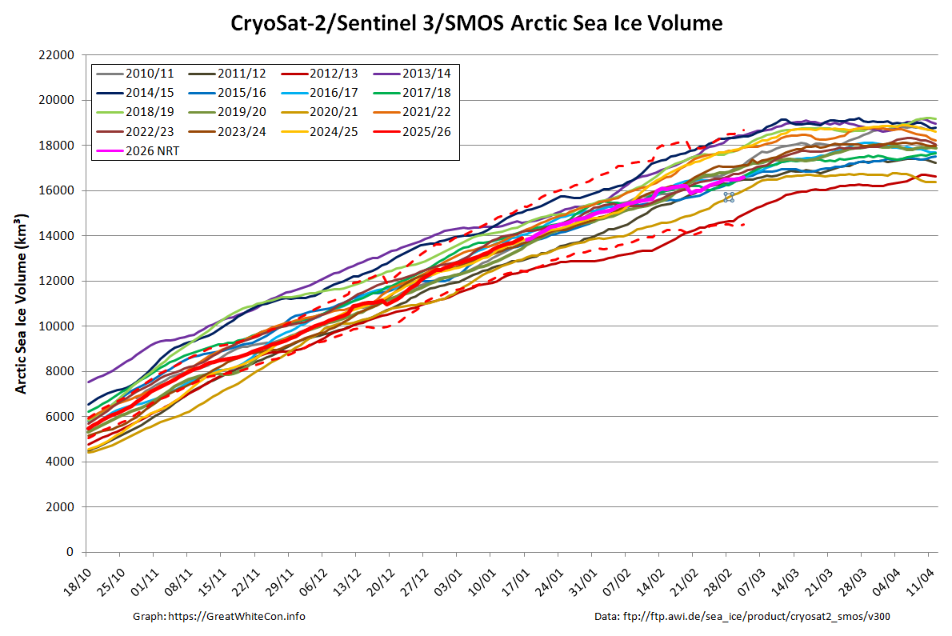
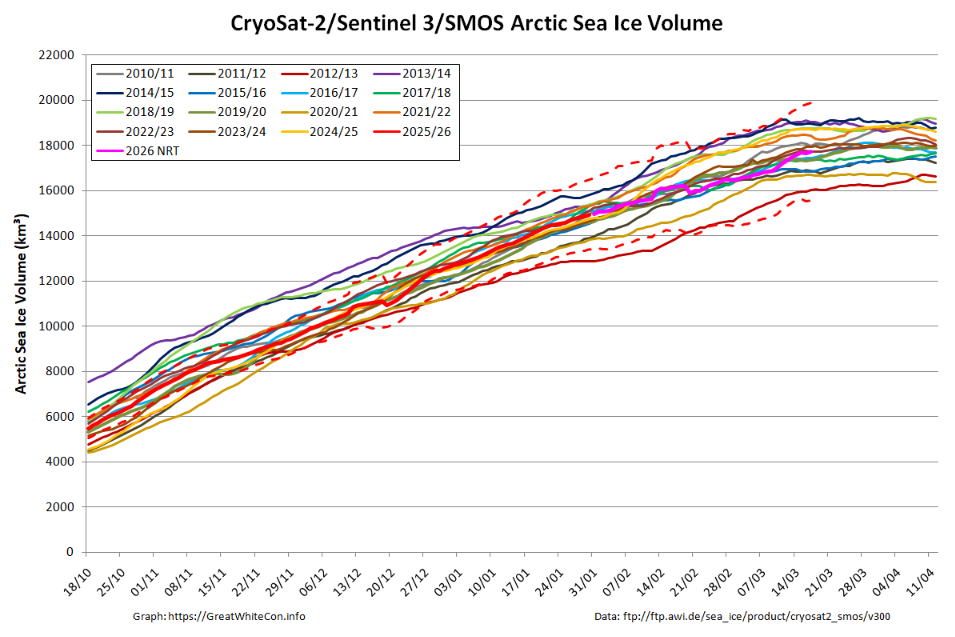
Here too is the associated sea ice volume graph:
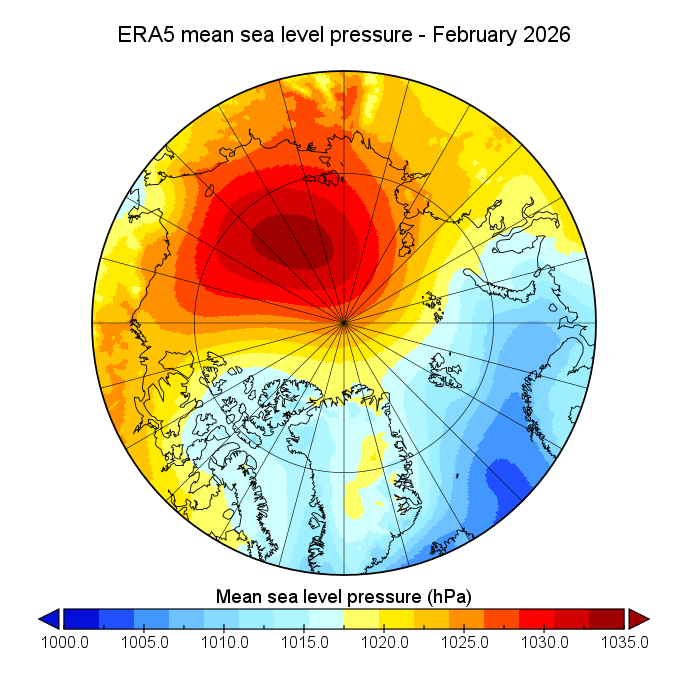
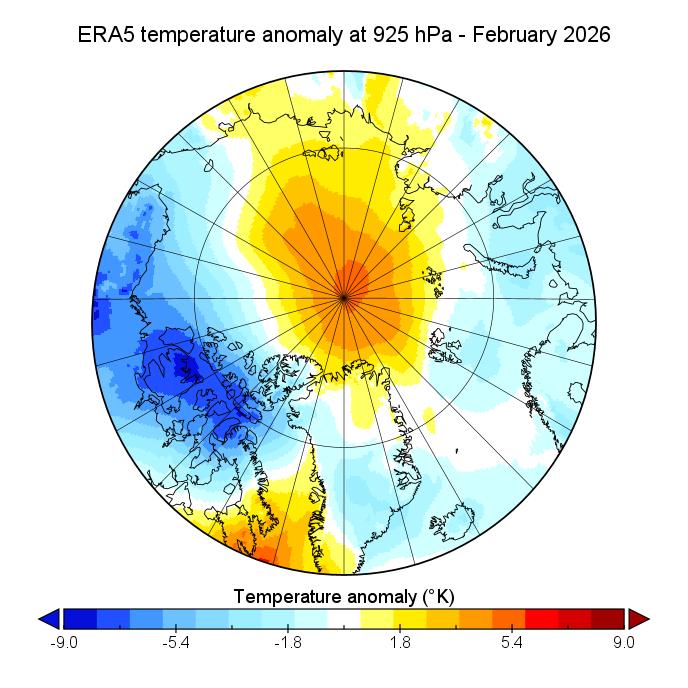
Next here are the ERA5 MSLP and 925 hPa air temperature anomaly maps for February 2026, now in “Greenland down” orientation to match the thickness maps:
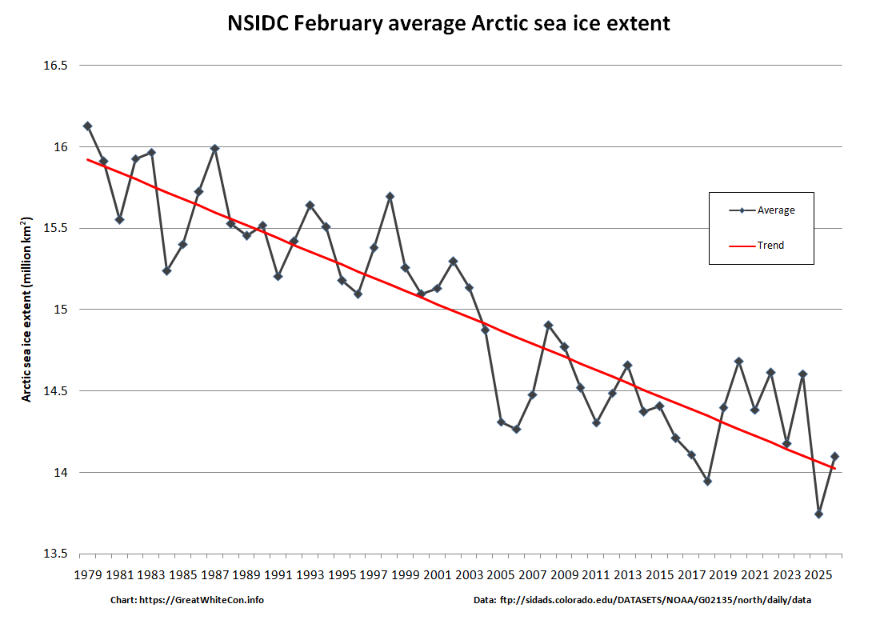
together with the NSIDC monthly average extent graph for February:
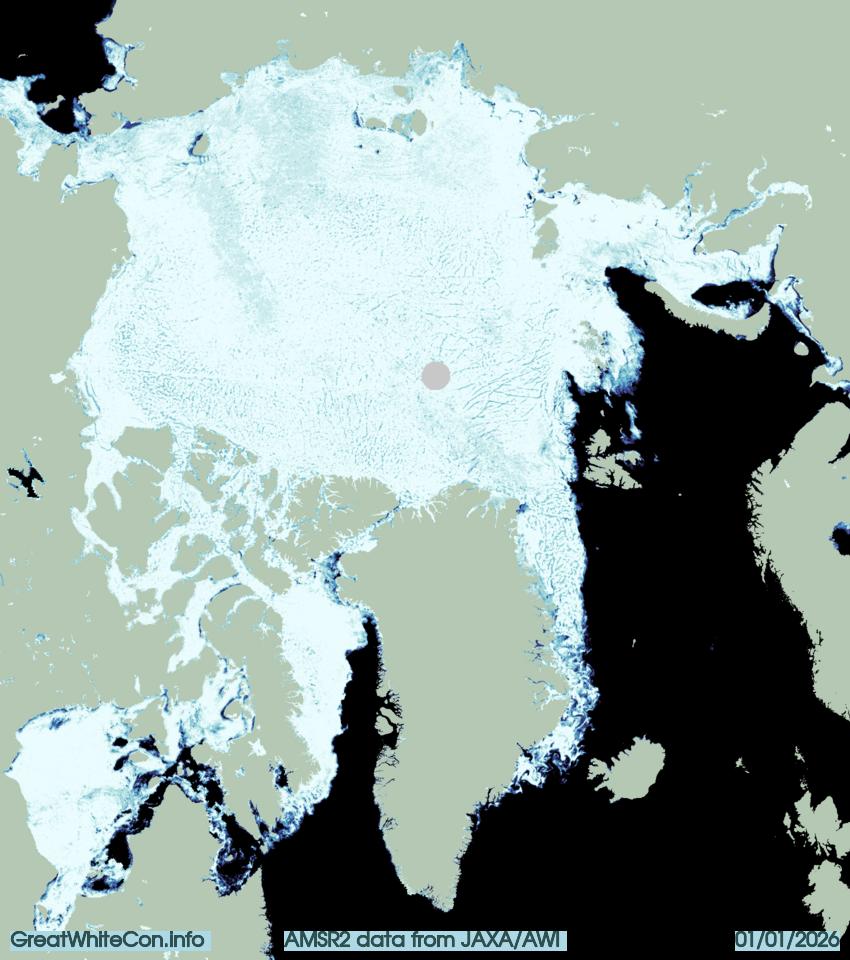
The latest Alfred Wegener Institute sea ice concentration map shows that the Pacific side of the Central Arctic Basin is now almost completely refrozen:
On the Atlantic side of the Arctic the Kara Sea is rapidly refreezing:
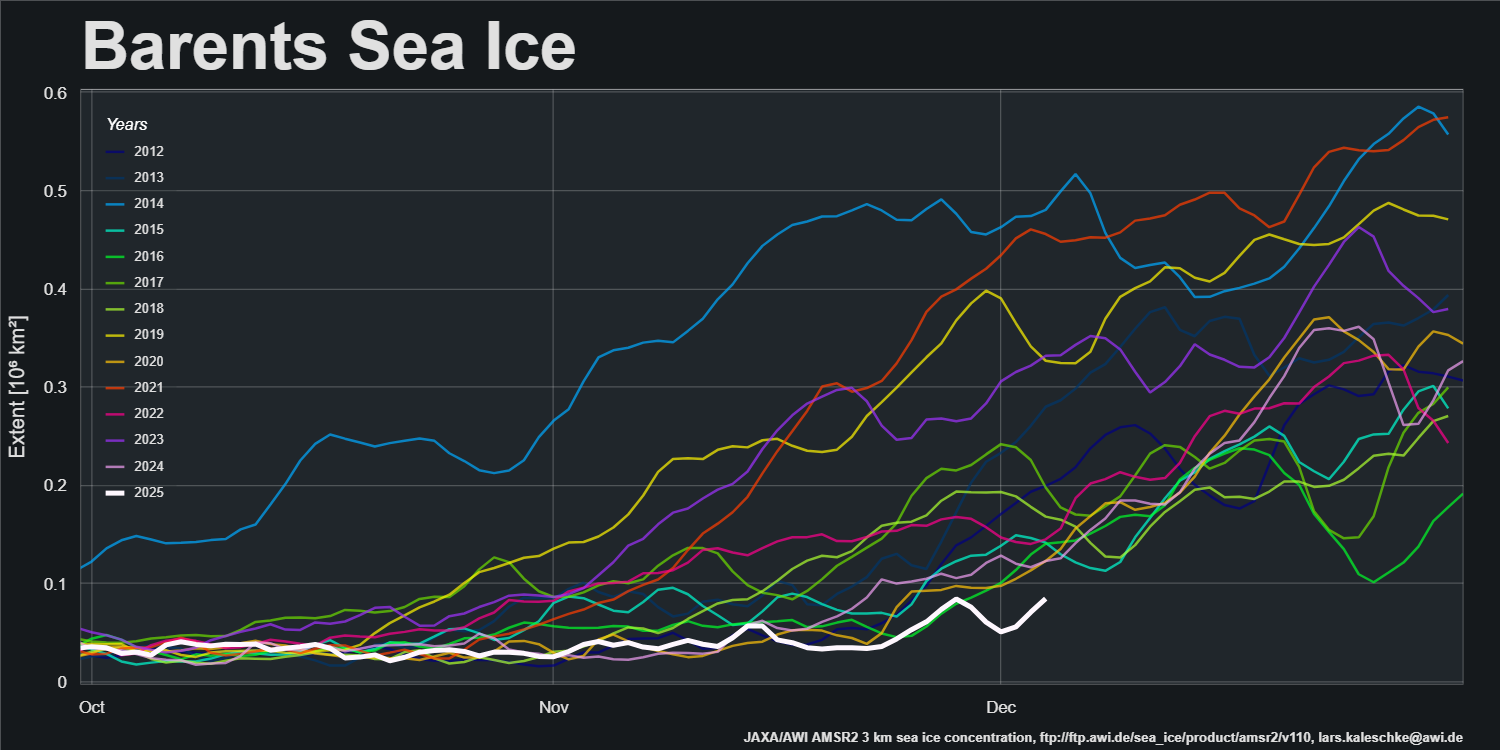
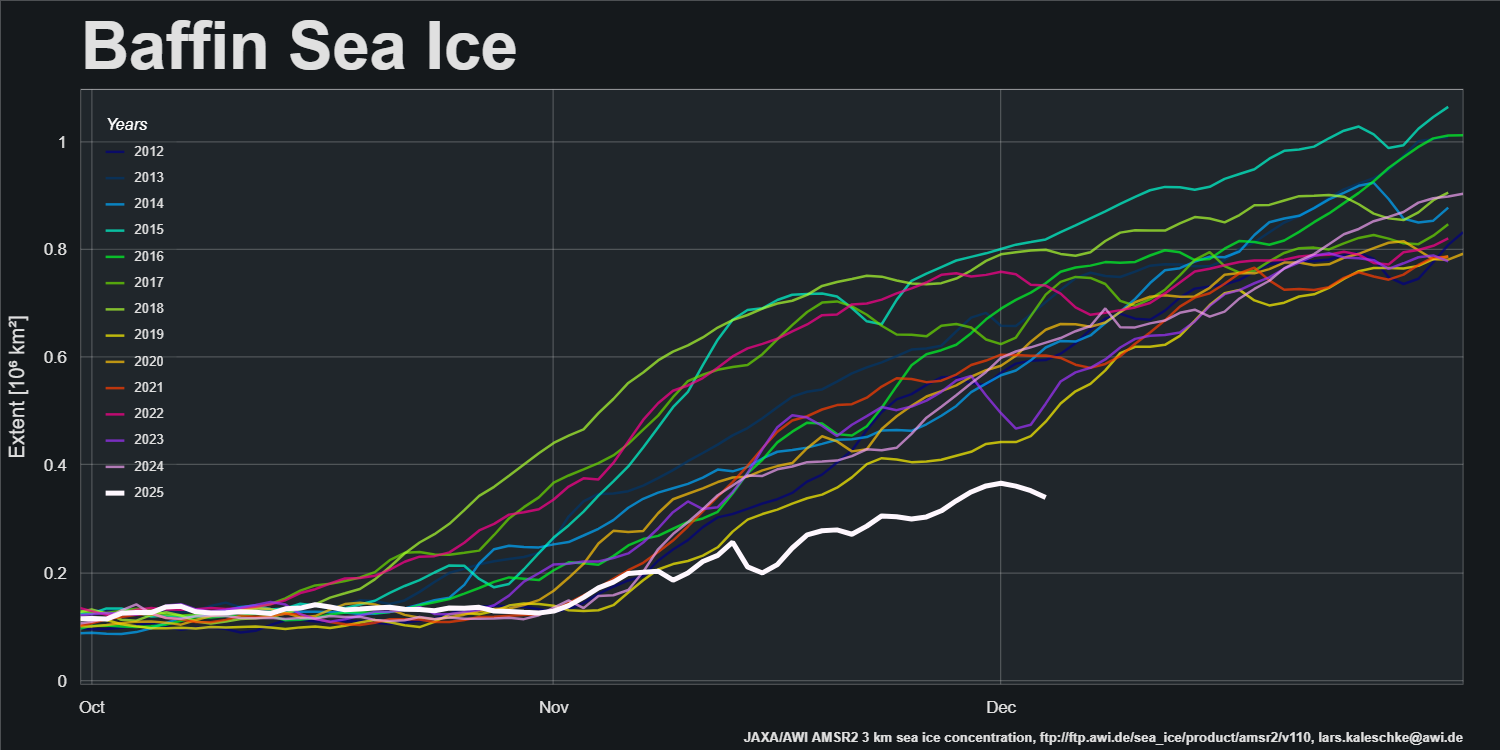
However, sea ice extent in the Barents Sea and Baffin Bay is currently lowest for the date in the AMSR2 record:
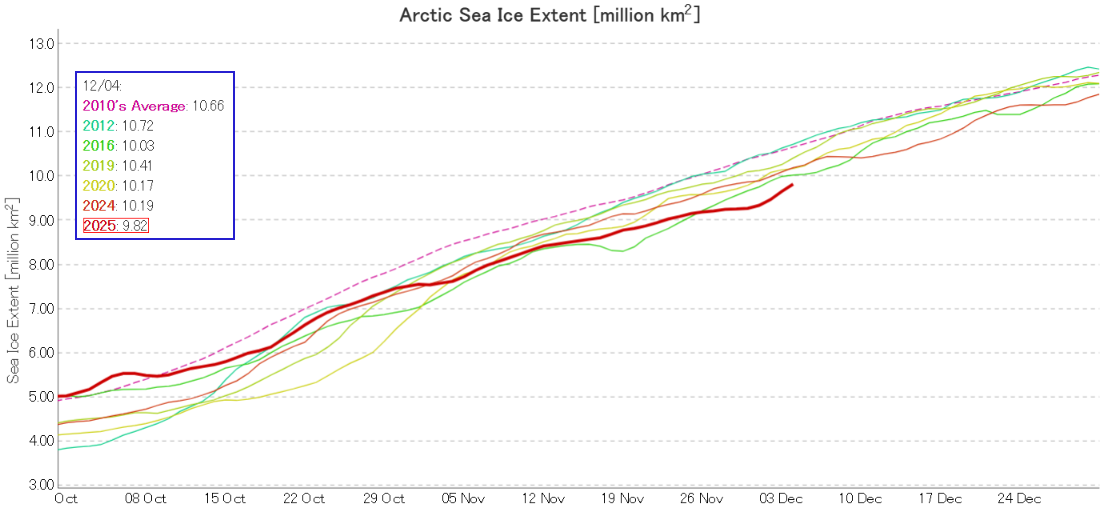
Pan Arctic JAXA/ViSHOP extent is currently lowest for the date in the satellite era:
This website uses cookies to improve your experience. We'll assume you're ok with this, but you can opt-out if you wish. Cookie settingsACCEPT
Privacy & Cookies Policy
Privacy Overview
This website uses cookies to improve your experience while you navigate through the website. Out of these, the cookies that are categorized as necessary are stored on your browser as they are essential for the working of basic functionalities of the website. We also use third-party cookies that help us analyze and understand how you use this website. These cookies will be stored in your browser only with your consent. You also have the option to opt-out of these cookies. But opting out of some of these cookies may affect your browsing experience.
Necessary cookies are absolutely essential for the website to function properly. This category only includes cookies that ensures basic functionalities and security features of the website. These cookies do not store any personal information.
Any cookies that may not be particularly necessary for the website to function and is used specifically to collect user personal data via analytics, ads, other embedded contents are termed as non-necessary cookies. It is mandatory to procure user consent prior to running these cookies on your website.