The images below all have links embedded in the captions which provide access to further images. Please click them and explore! For the satellite images you will find yourself on the NASA Worldview web site, where with a click or two you can easily see the effect of changing from one “false colour” representation of the satellite data to another.
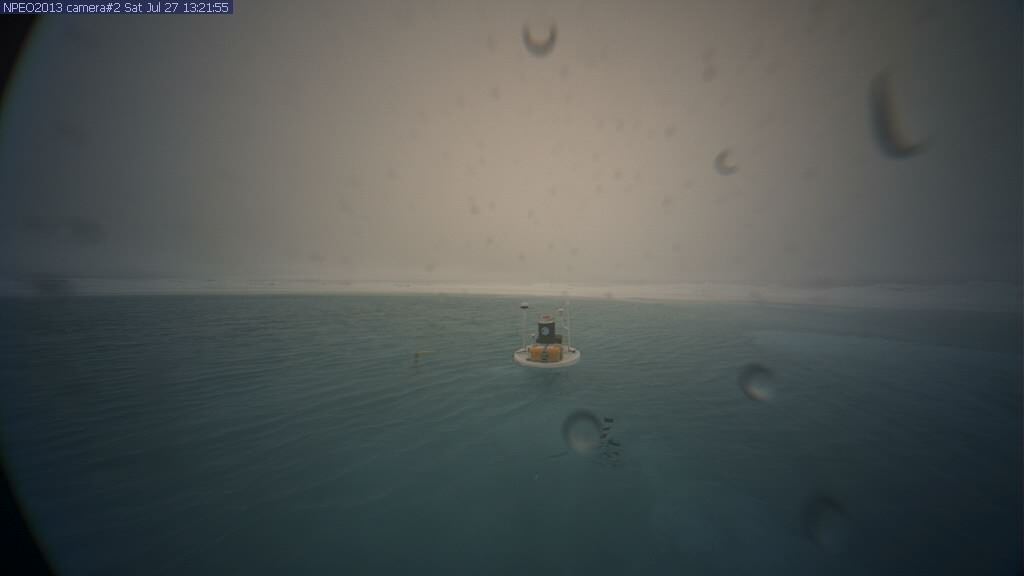
North Pole Environmental Observatory Webcam 2
NPEO webcam 2 image from July 27th 2013NPEO webcam 2 image from July 22nd 2013, revealing a melt pond and a bird’s backside
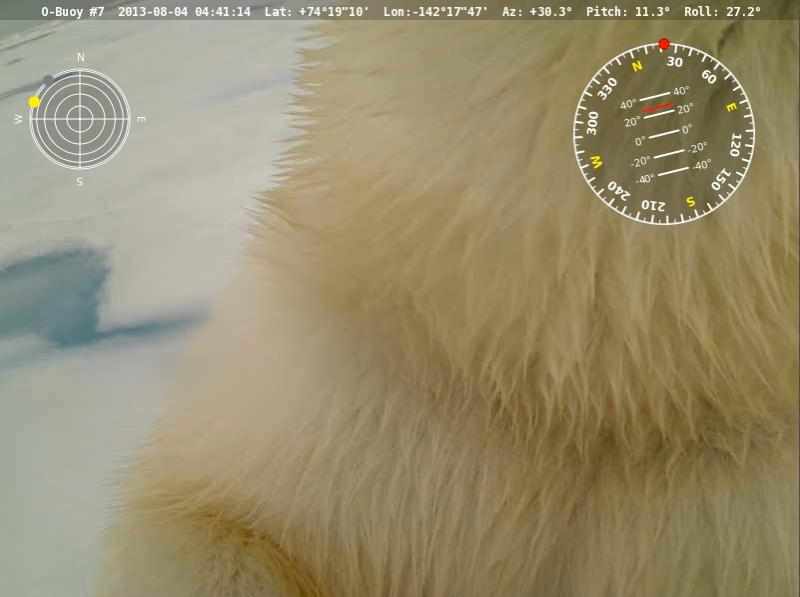
O-Buoy 7 Webcam
O-Buoy 7 image from August 4th 2013, showing a close up of a polar bear
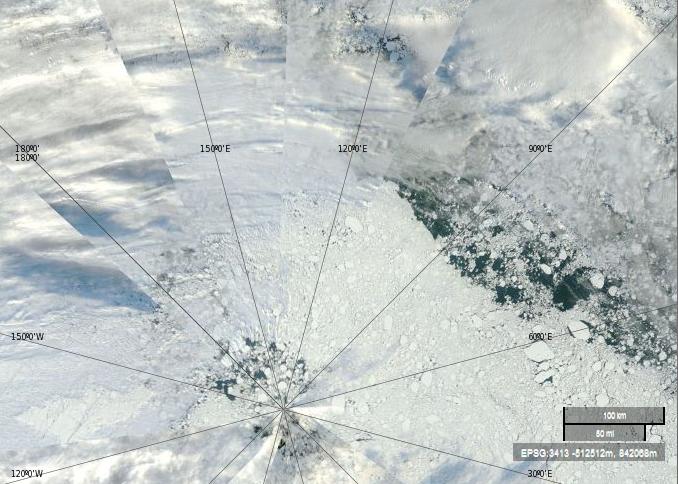
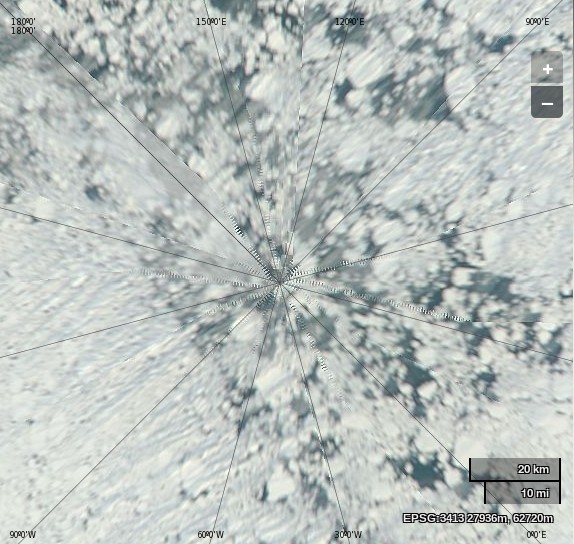
NASA Worldview “true-color” image of the North Pole area on September 4th 2013 derived from bands 1,4 and 3 of the MODIS sensor on the Terra satelliteNASA Worldview “true-color” image of the North Pole area on August 28th 2013, derived from bands 1, 4 and 3 of the MODIS sensor on the Aqua satellite
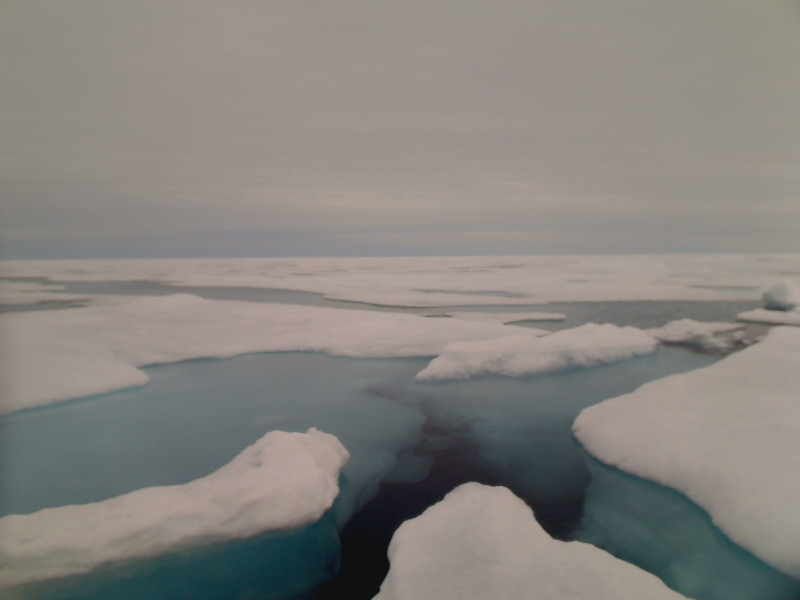
Central Arctic Basin
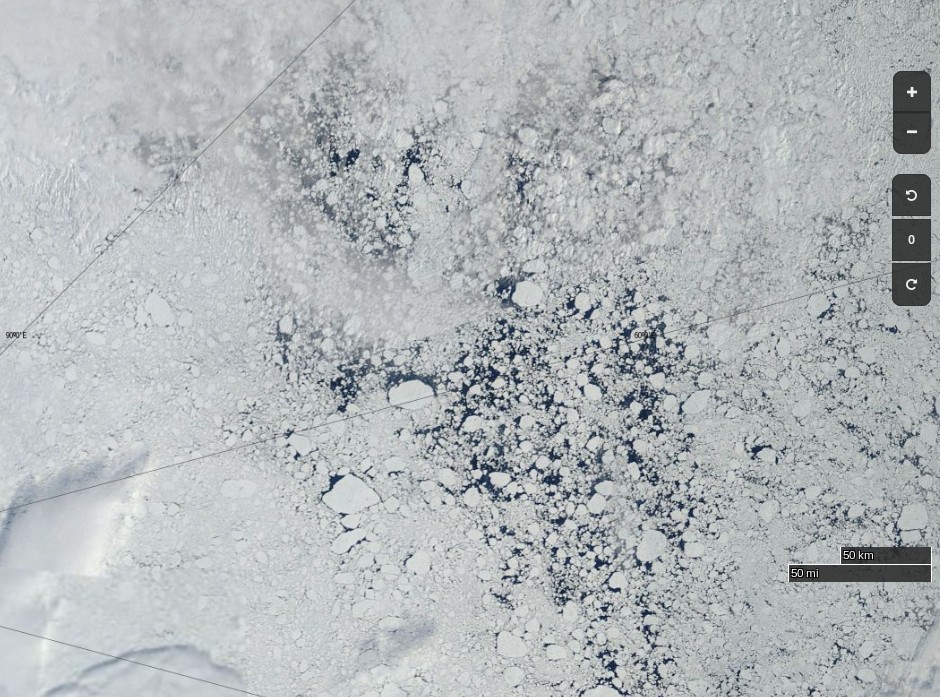
NASA Worldview “true-color” image of the Arctic north of Franz Josef Land on July 29th 2013, derived from bands 1, 4 and 3 of the MODIS sensor on the Terra satelliteNASA Worldview “true-color” image of the Arctic north of the Laptev sea on July 6th 2013, derived from bands 1, 4 and 3 of the MODIS sensor on the Aqua satellite
Beaufort Sea
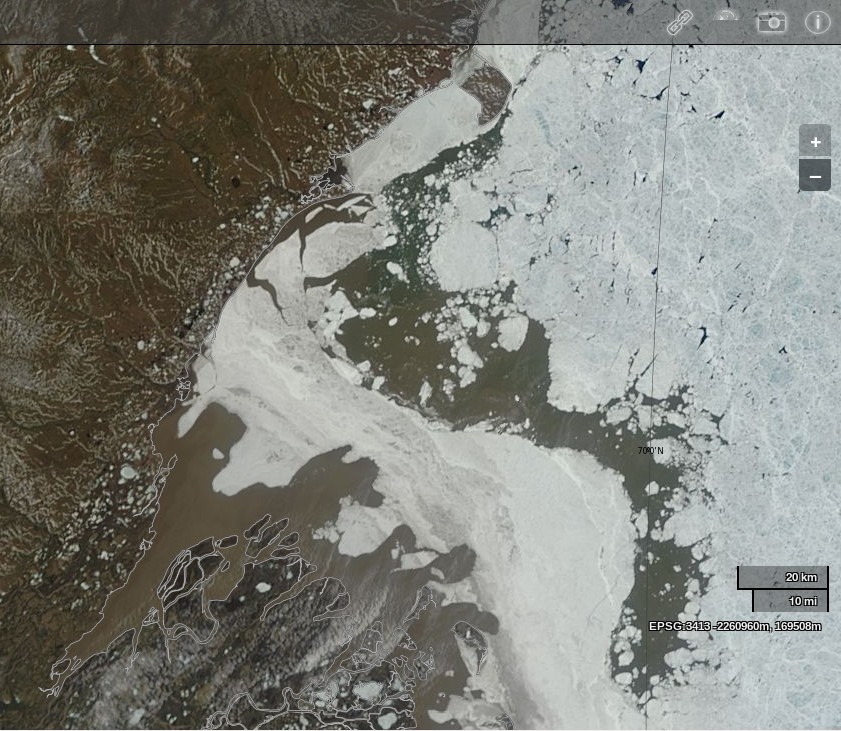
NASA Worldview “true-color” image of the Mackenzie Delta and the Beaufort Sea on June 17th 2013, derived from bands 1, 4 and 3 of the MODIS sensor on the Terra satellite
NASA Worldview “true-color” image of the Beaufort Sea and Amundsen Gulf on June 8th 2013, derived from bands 1, 4 and 3 of the MODIS sensor on the Terra satellite
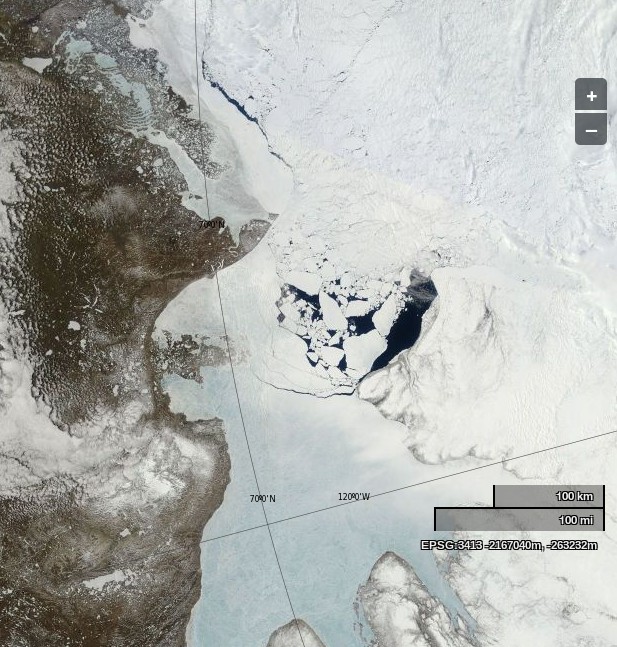
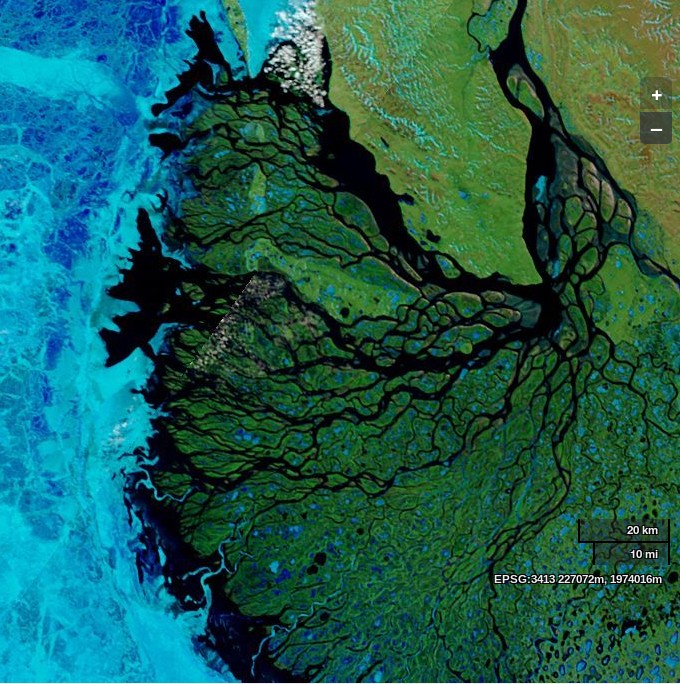
Laptev Sea
NASA Worldview image of the Lena Delta and Laptev Sea on June 14th 2013, derived from bands 7, 2 and 1 of the MODIS sensor on the Terra satellite
This website uses cookies to improve your experience. We'll assume you're ok with this, but you can opt-out if you wish. Cookie settingsACCEPT
Privacy & Cookies Policy
Privacy Overview
This website uses cookies to improve your experience while you navigate through the website. Out of these, the cookies that are categorized as necessary are stored on your browser as they are essential for the working of basic functionalities of the website. We also use third-party cookies that help us analyze and understand how you use this website. These cookies will be stored in your browser only with your consent. You also have the option to opt-out of these cookies. But opting out of some of these cookies may affect your browsing experience.
Necessary cookies are absolutely essential for the website to function properly. This category only includes cookies that ensures basic functionalities and security features of the website. These cookies do not store any personal information.
Any cookies that may not be particularly necessary for the website to function and is used specifically to collect user personal data via analytics, ads, other embedded contents are termed as non-necessary cookies. It is mandatory to procure user consent prior to running these cookies on your website.