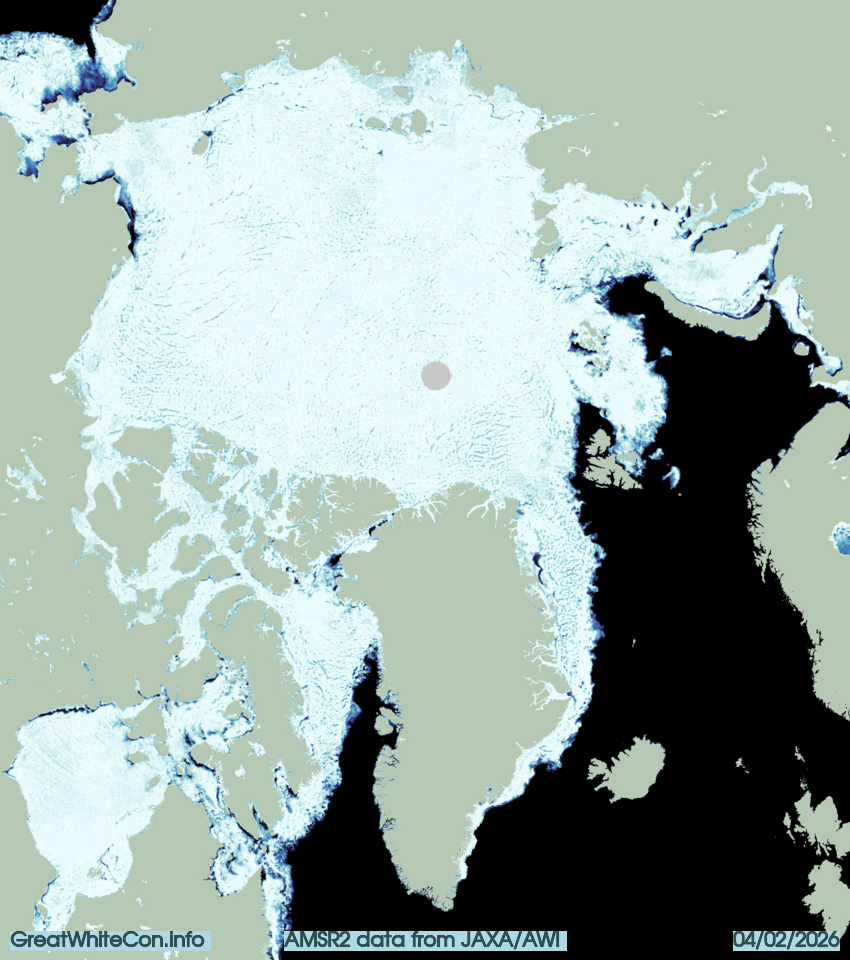
Hudson Bay has fully frozen over during January. However, there is still open water north of Svalbard and in the North Water Polynya. It’s even possible to go swimming in the Nares Strait according to the latest AMSR2 concentration map from the Alfred Wegener Institute:
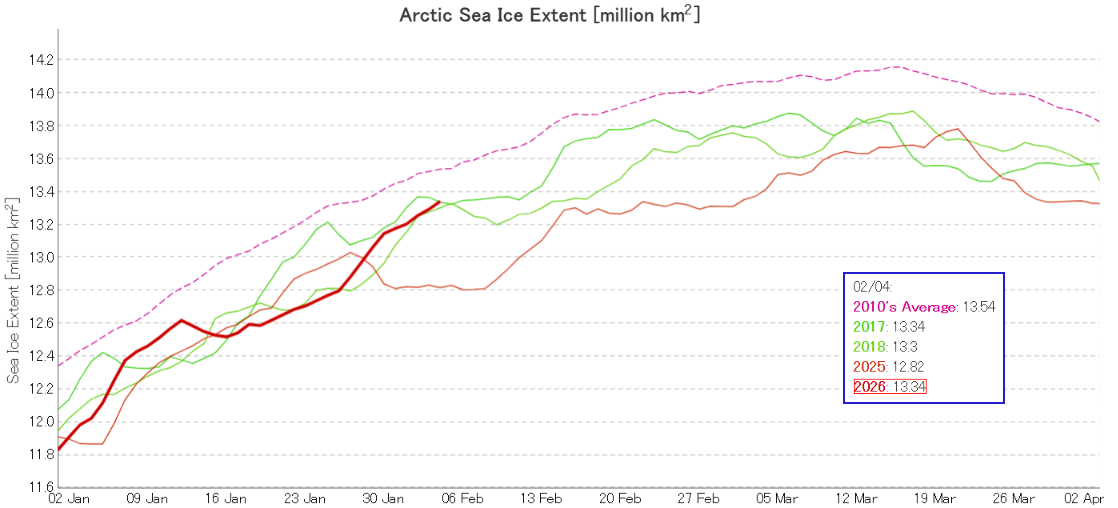
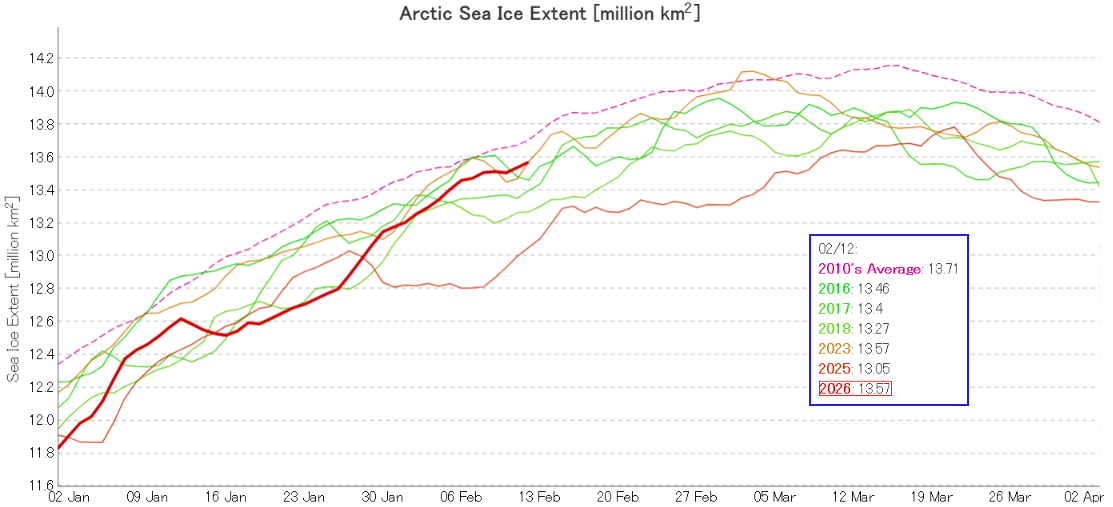
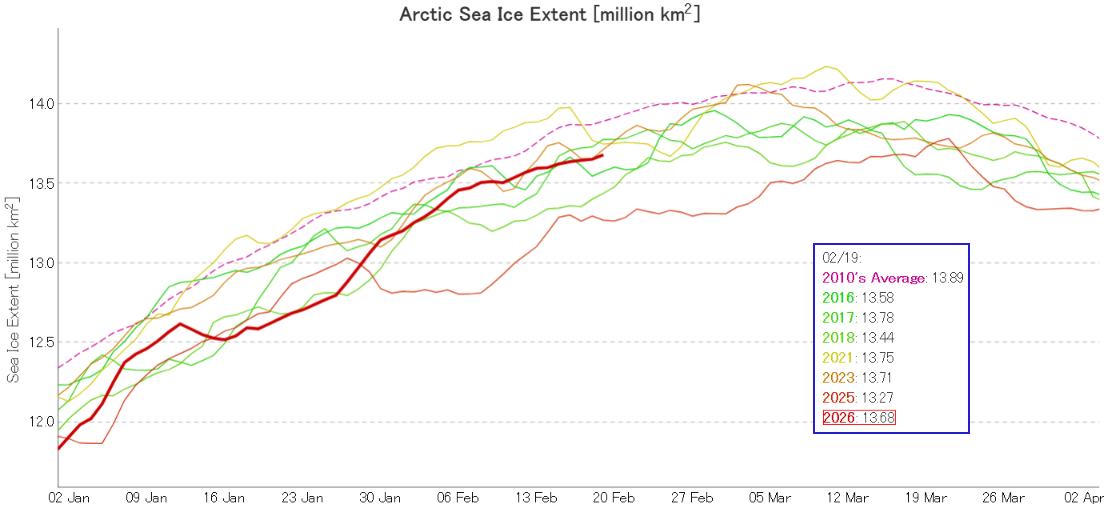
JAXA extent is currently 3rd lowest for the date, in a “statistical tie” with 2017:
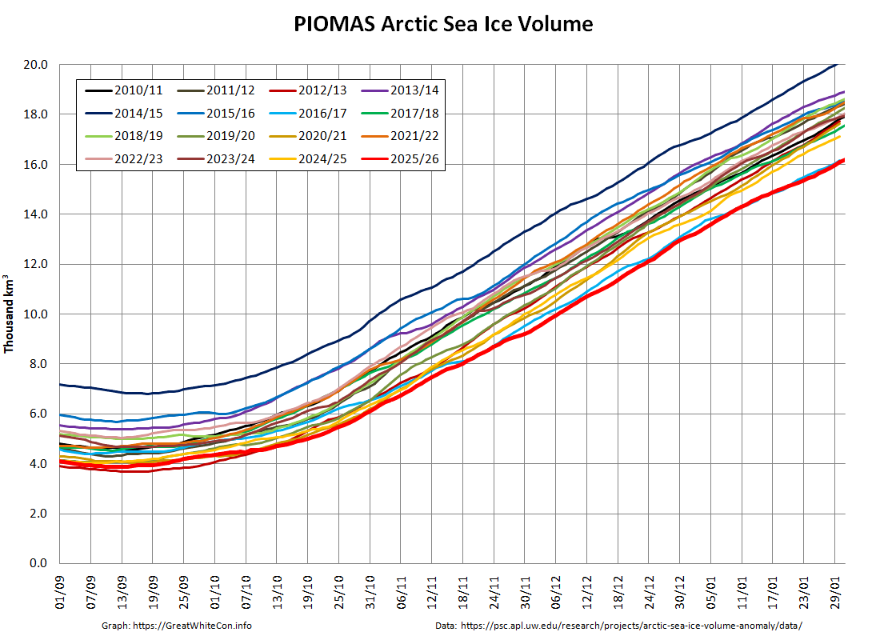
Looking at the third dimension next, PIOMAS volume was second lowest for the date by a whisker at the end of January:
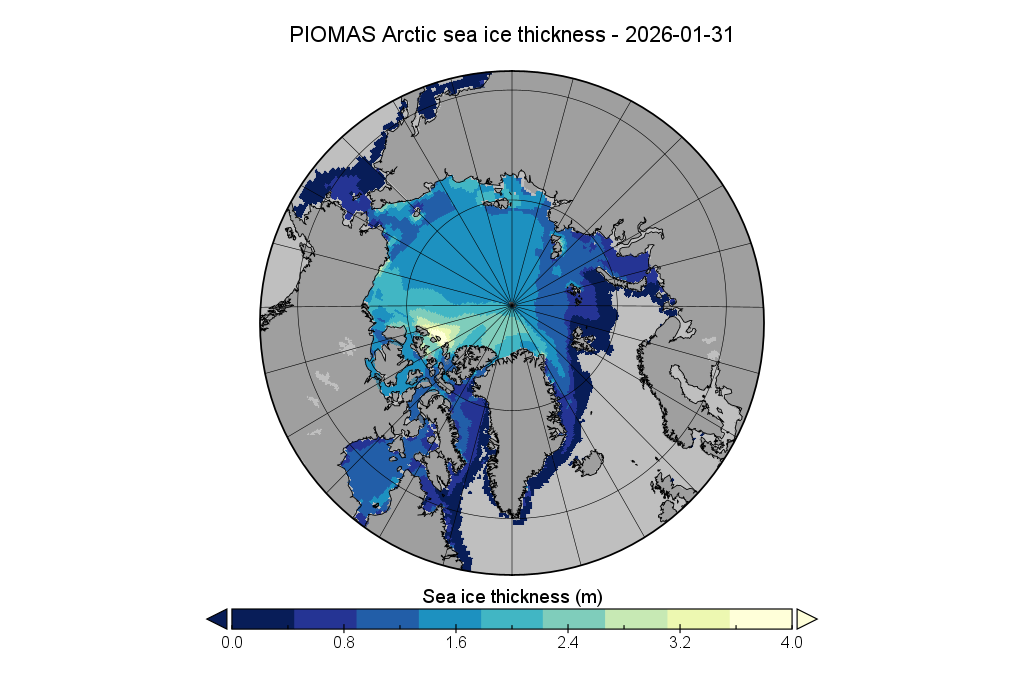
Here’s the associated sea ice thickness map:
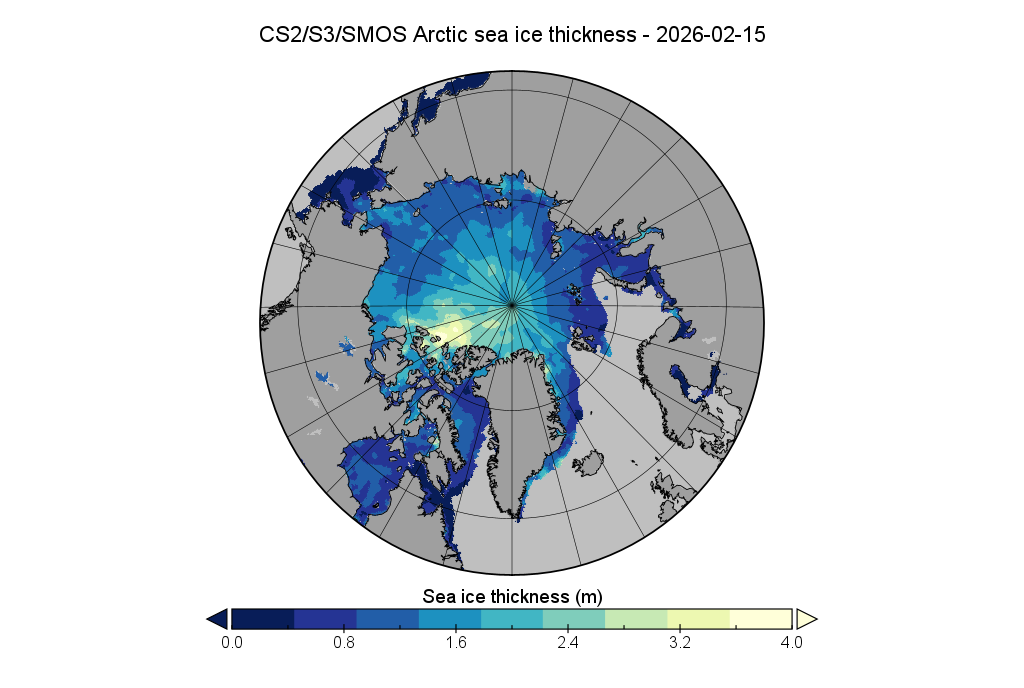
For comparison puporses, here is the Alfred Wegener Institute’s CryoSat-2/Sentinel 3/SMOS Arctic sea ice thickness map at the end of January:
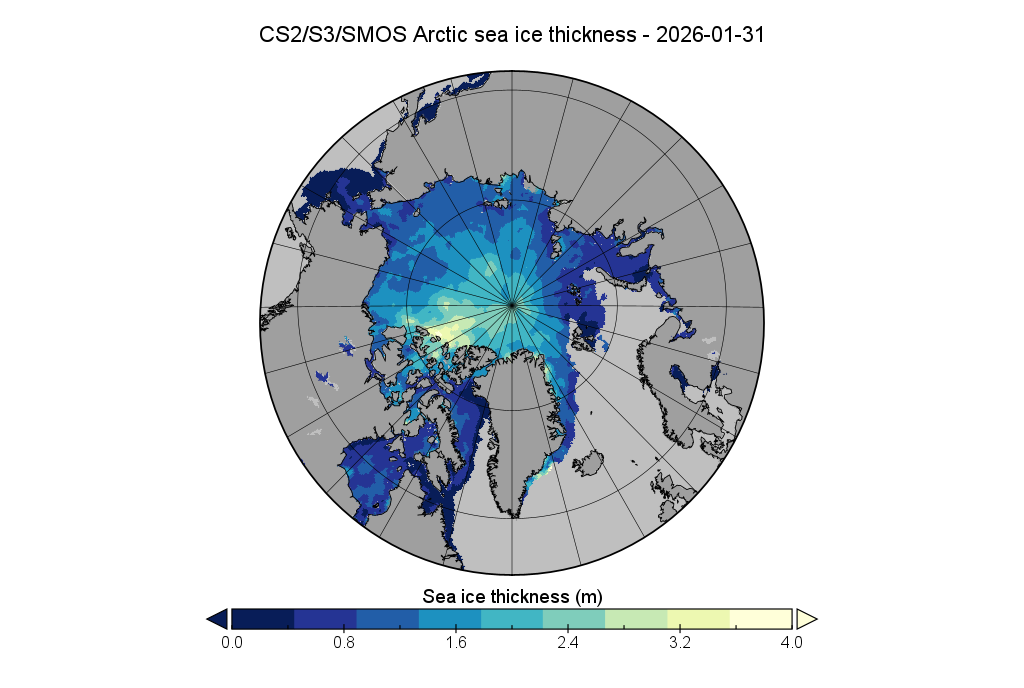
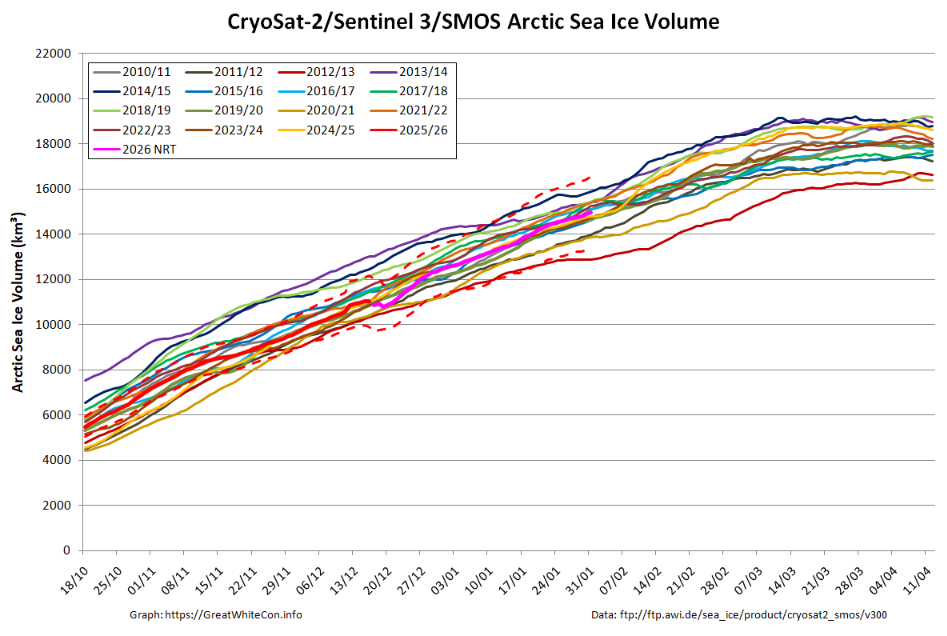
The overall distribution of sea ice thickness is similar to the PIOMAS map. However the visual similarity ends when you compare the two volume graphs:
JAXA extent is currently in a “statistical tie” with 2023 for 5th lowest for the date in the satellite era:
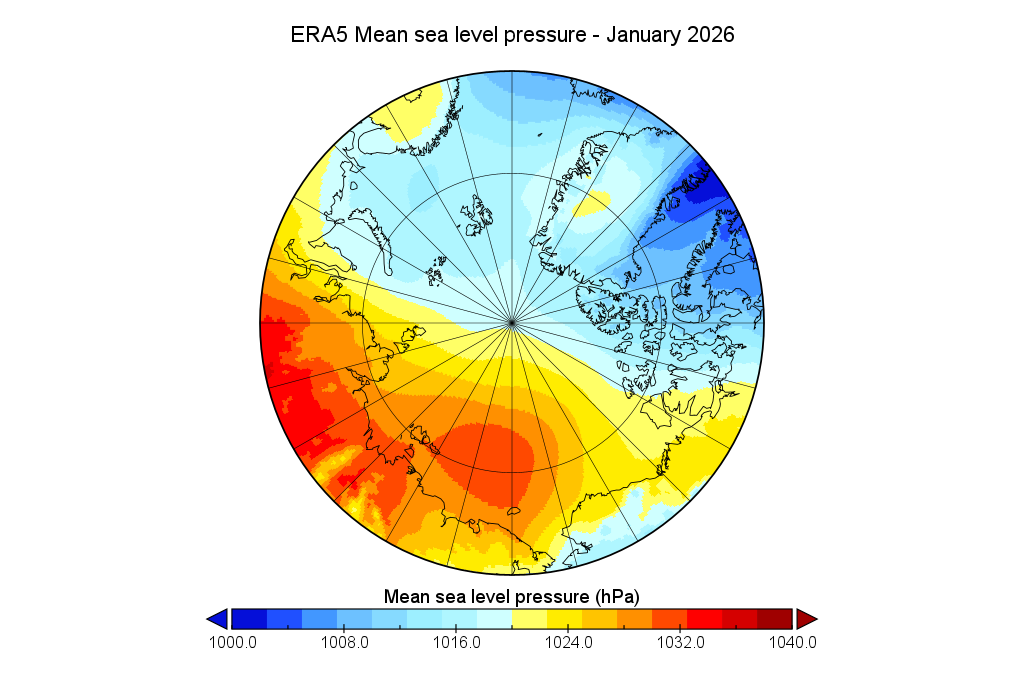
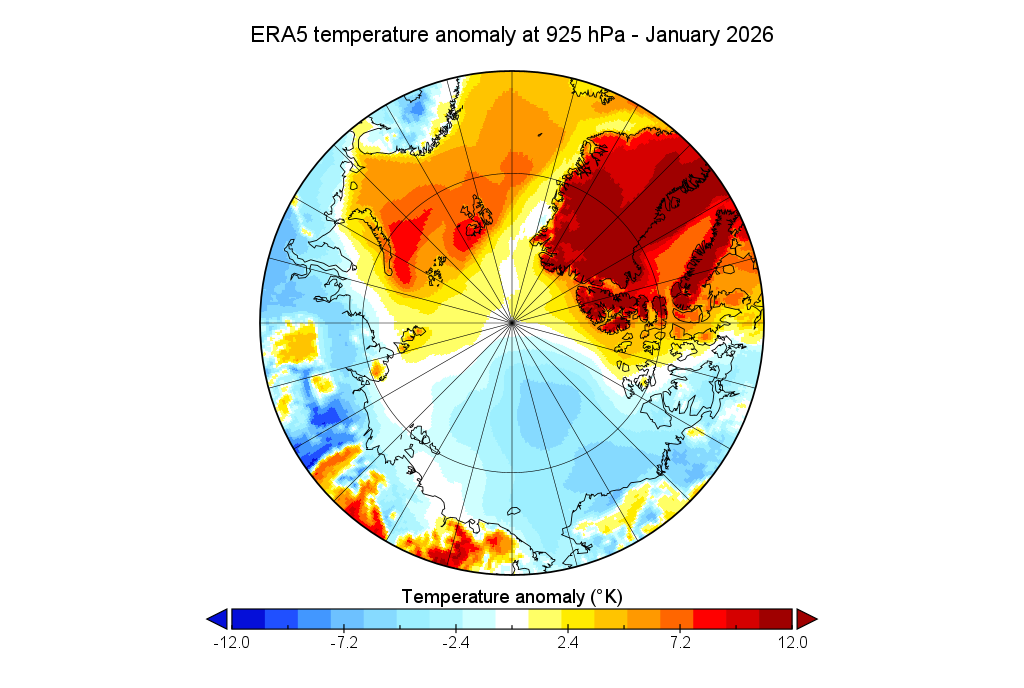
ERA5 data still hasn’t become available via WRIT so reverting to NCEP/NCAR R1 data for the moment, here are the MSLP and 925 hPa air temperature anomaly maps for January 2026:
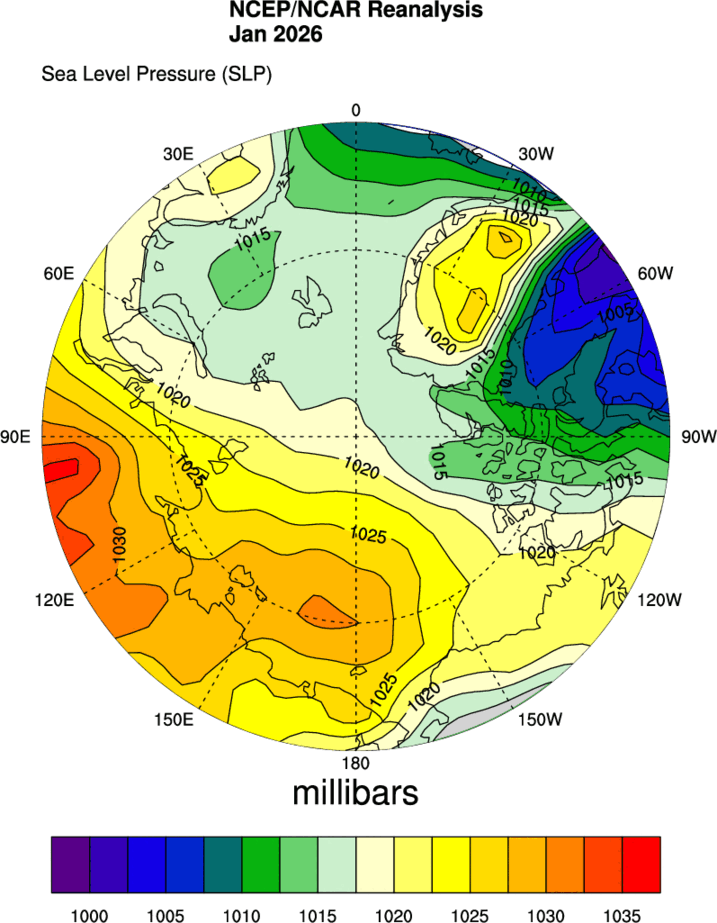
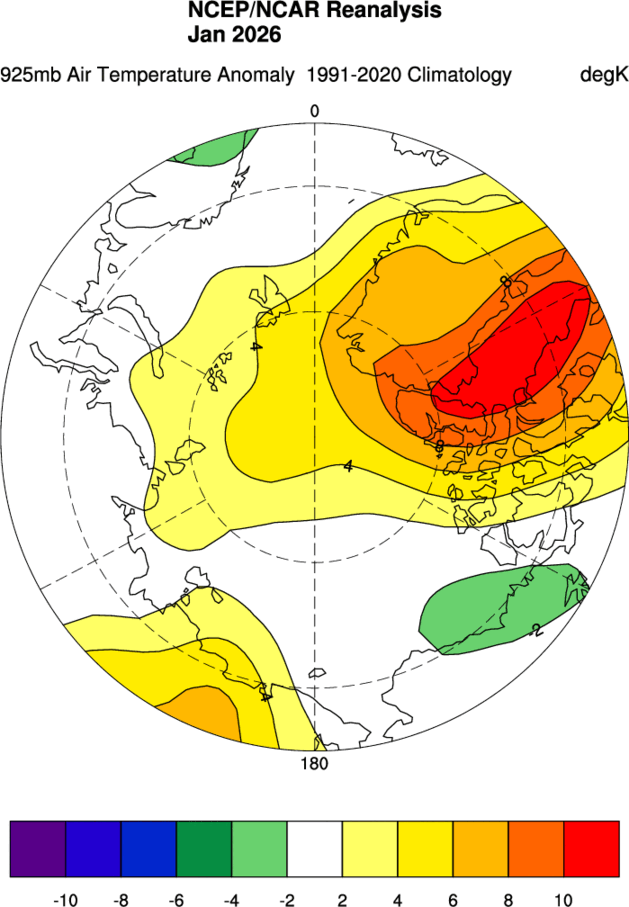
The most notable features are high pressure, centred over the Chukchi Sea rather than the Beaufort Sea, and anomalous warmth above Baffin Bay.
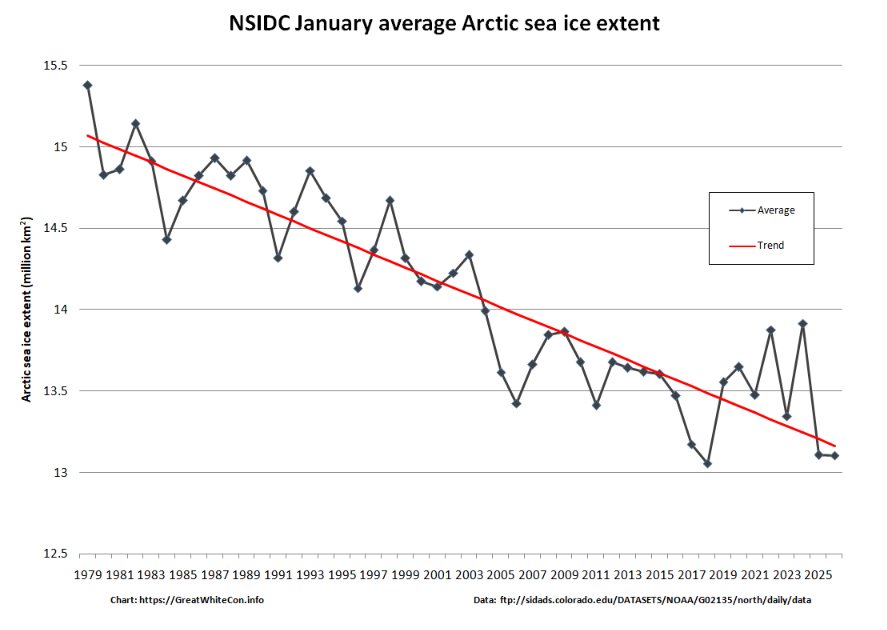
Here too is the graph of NSIDC average extent for January:
It now looks exceedingly unlikely that JAXA extent will achieve a record low maximum this year. The metric is currently 4th lowest for the date at 13.68 million km², marginally below last year’s maximum of 13.78 million km²
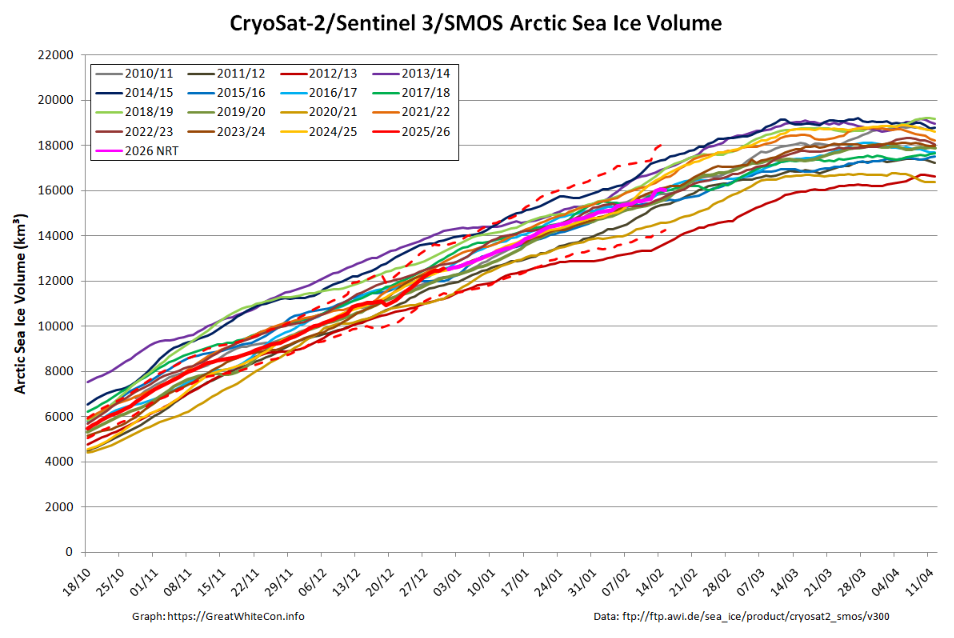
Here is the mid month update on the AWI’s CryoSat-2/Sentinel 3/SMOS Arctic sea ice volume:
Here too is the associated sea ice thickness map:
On February 23rd the National Oceanic and Atmospheric Administration’s Physical Sciences Laboratory issued a press release, stating:
Data Notice: NCEP/NCAR Reanalysis 1 updates to end.
The National Weather Service’s National Centers for Environmental Prediction (NCEP) Central Operations has announced that the Climate Data Assimilation System (CDAS) will be discontinued in favor of the Conventional Observation Reanalysis ( CORe) effective on or about March 9, 2026.
Because of this change, PSL will no longer be able to update NCEP/NCAR Reanalysis 1 starting around March 9, 2026, The exact date is pending the discontinuation of CDAS by the National Weather Service.
The historical NCEP/NCAR Reanalysis 1 data will remain available on our site.
We are in the process of identifying other products that may no longer be able to be updated or will require a suitable alternative to CDAS to continue operating.
Please note: PSL does not have immediate plans to make the COREe datasets available through our site. Information on the CORe dataset, including access instructions, has been compiled on this NOAA CORe Information page as a service to our users.
Currently NCEP/NCAR R1 is the only dataset available via NOAA’s WRIT web site that offers data for January 2026. Hence we are now obtaining ERA5 data direct from the Copernicus climate data store. Here are the ERA5 equivalents of the NCEP/NCAR R1 maps above.
The conversation continues over on the March open thread.
(Using CryoSat daily volume deltas to estimate current month Piomas)
Grok AI still on a mission to “hide the decline”?
I see Extent dropped almost 34k yesterday.
Might not be a record low maximum, but it might not be much higher either.
Hey, Tom
looks like 132k today, a record drop for the day of the year.
Could potentially become the lowest maximum on record.
Certainly a big drop in JAXA extent for the time of year, putting 2026 in 2nd lowest position. The current maximum is 13.71 million km² on February 20th:
And there don’t seem to be any unusual glitches in the concentration data that might suggest a suspect number:
Another record drop for the date today: 58,654 km2 (Arctic) and 79,566 (Global sea ice extent).
Meanwhile back on planet earth, annual Arctic ice extent has shown no trend since 2007. This has been an acknowledged by the universities of exeter and Washington.
Yawn!
Thanks (once again!) for your graph Peter.
In case you’ve mislaid your reading glasses, according to your source (OSI SAF monthly extent):
“March trend -2.4 %/decade. September trend -11.3 %/decade.”