It’s going to be more difficult to follow traffic on the Northern Sea Route this year, because the Russian authorities are no longer publishing daily position information for ships using the route.
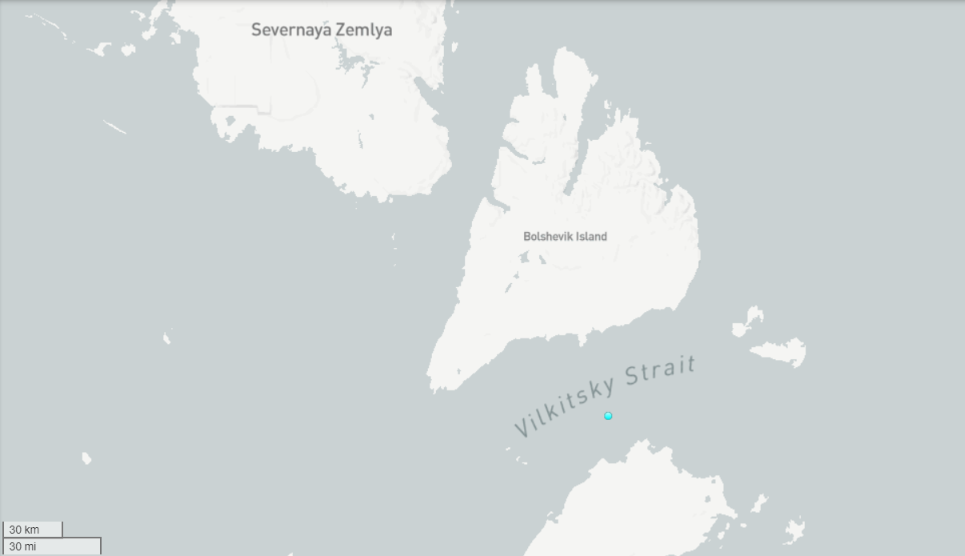
However other sources revealed that things got underway early this year. On May 29th the nuclear icebreaker Ural led LNG tanker Christophe de Margerie through the Vilkitsky Strait into the Laptev Sea:
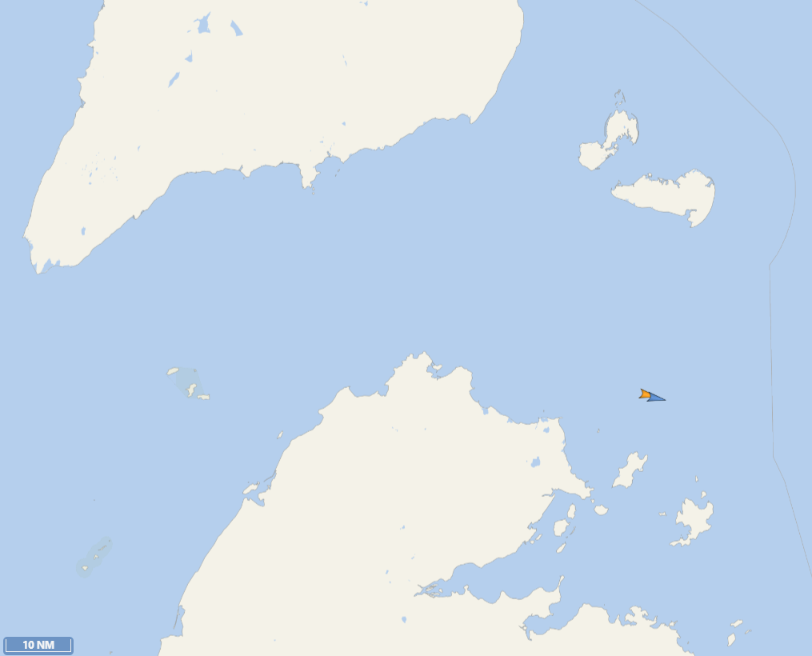
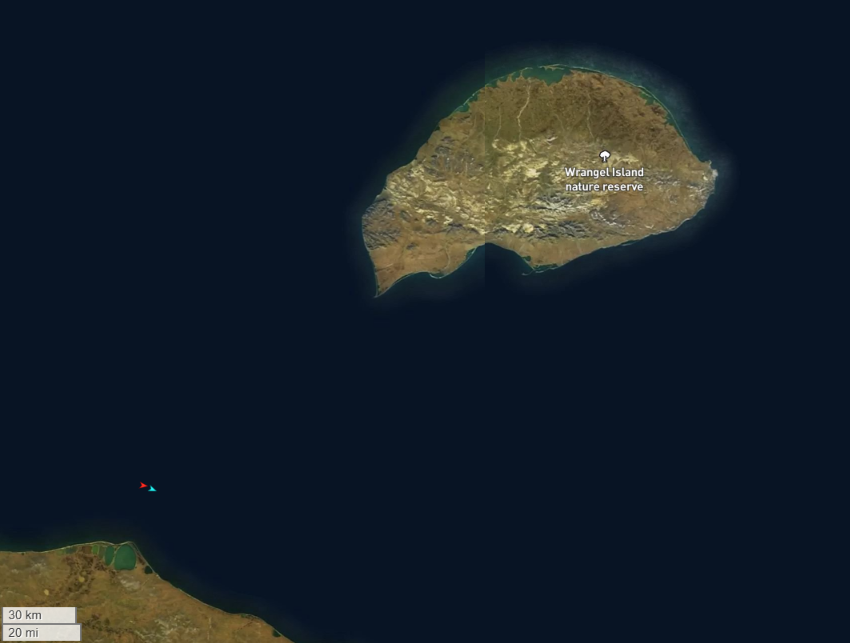
On June 5th the modest convoy is about to pass Wrangel Island into the Chukchi Sea:
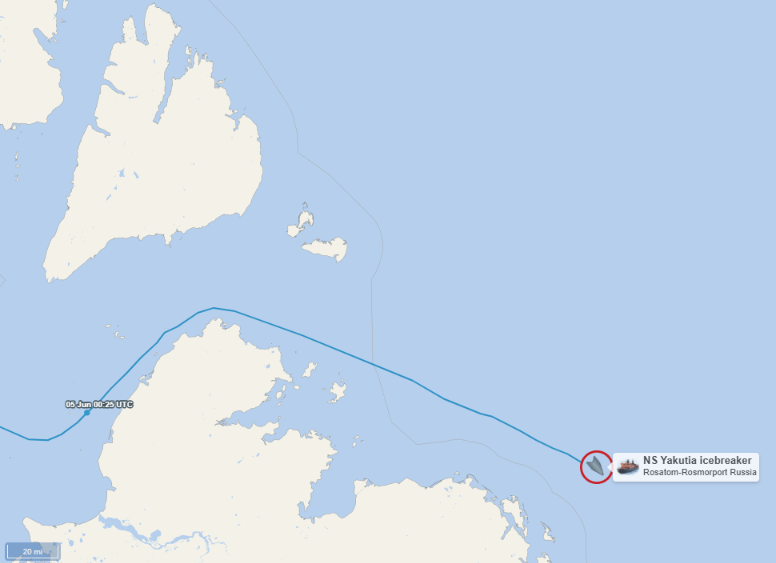
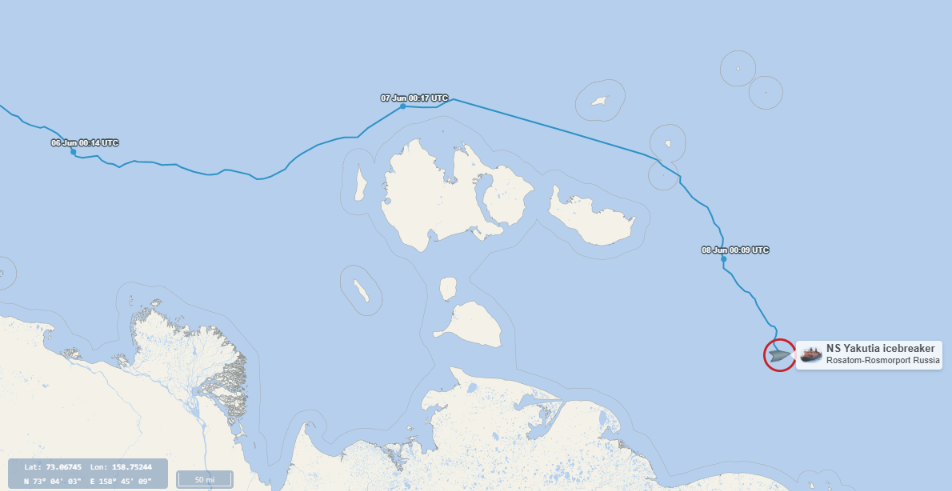
Another nuclear powered icebreaker, Yakutiya, has also just made its way through the Vilkitsky Strait heading east:
If Yakutiya is leading a convoy of one or more other vessels through the pack ice in the Laptev Sea they have all got satellite AIS turned off!
[Update – June 8th]
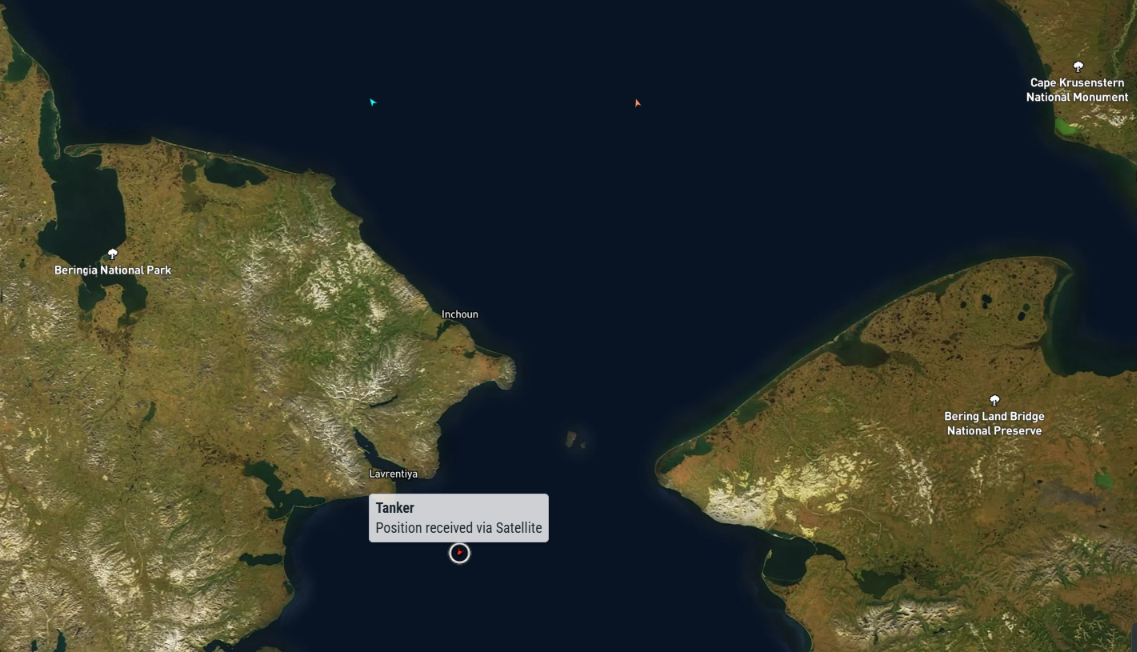
Christophe de Margerie has passed through the Bering Strait, and thus completed the first west to east voyage through the Northern Sea Route this year. Ural has been left behind in the Chukchi Sea:
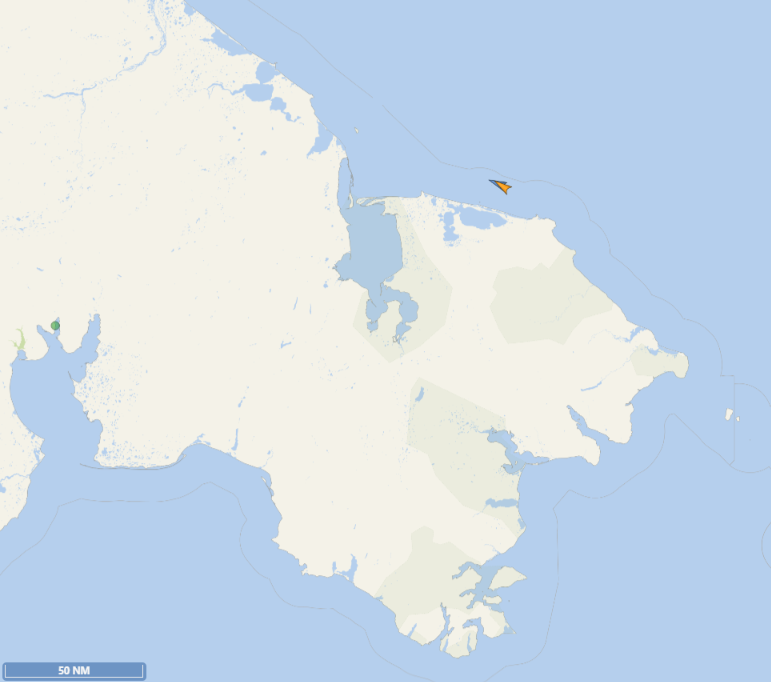
Yakutiya has travelled north of the New Siberian Islands and entered the East Siberian Sea:
[Update – June 15th]
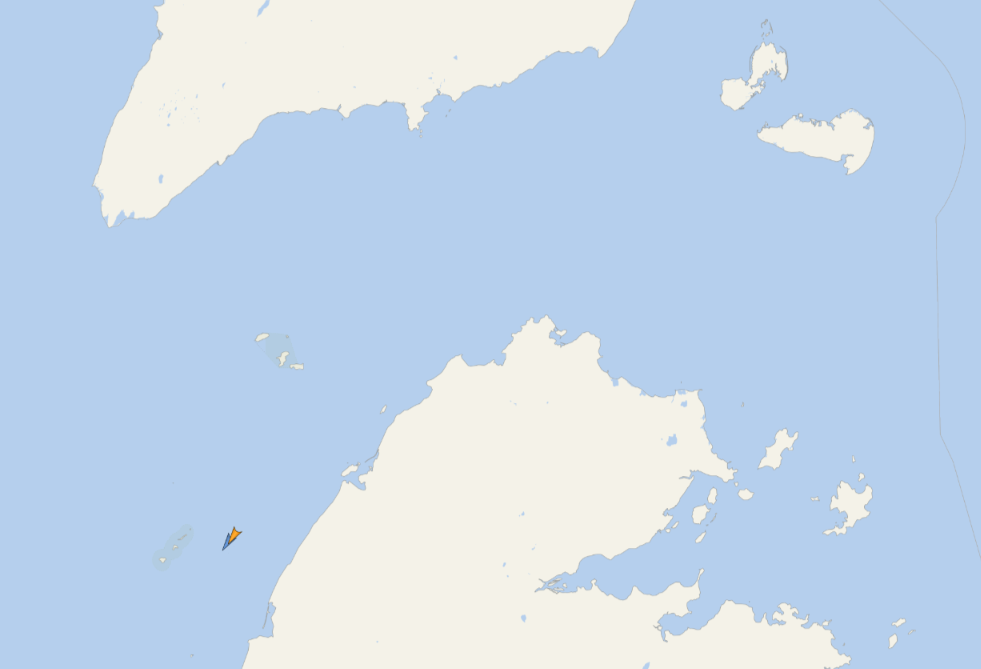
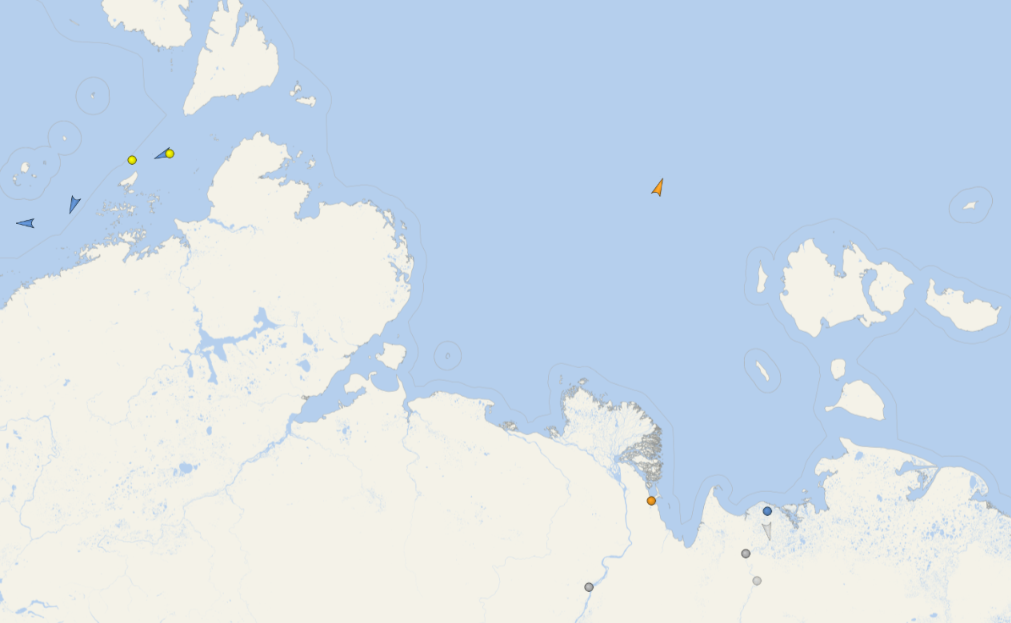
Christophe de Margerie has just passed through the Bering Strait heading north on a return journey through the NSR. This time around Yakutiya is leading the way:
[Update – June 22nd]
Yakutiya and Christophe de Margerie have just passed through the Vilkitsky Strait heading west:
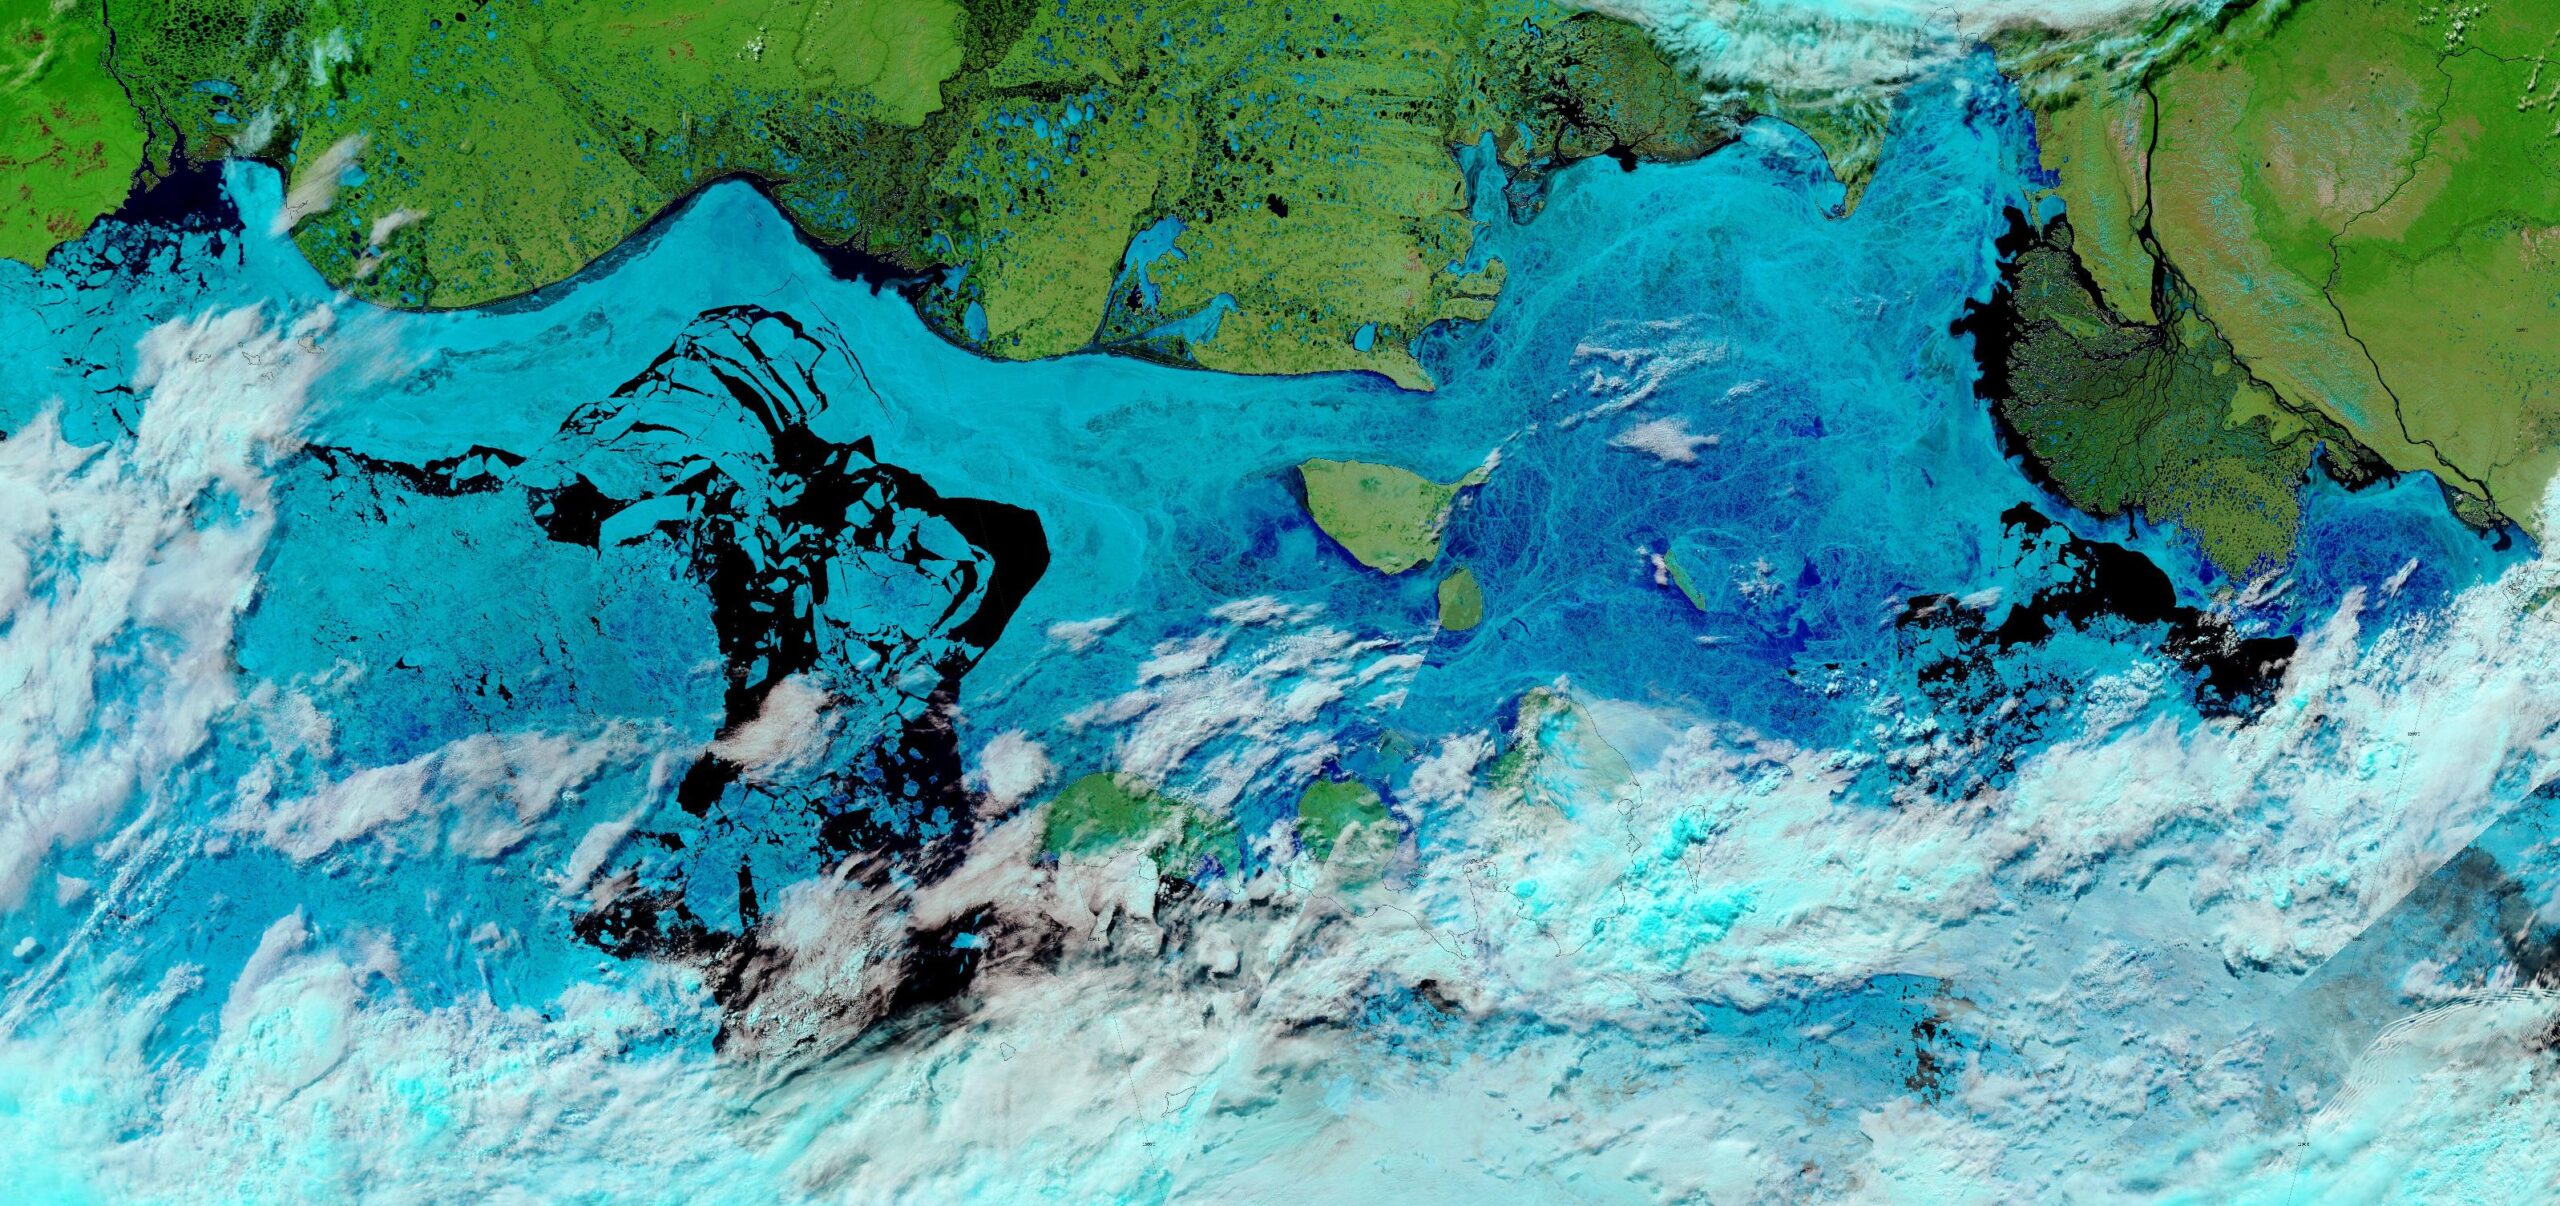
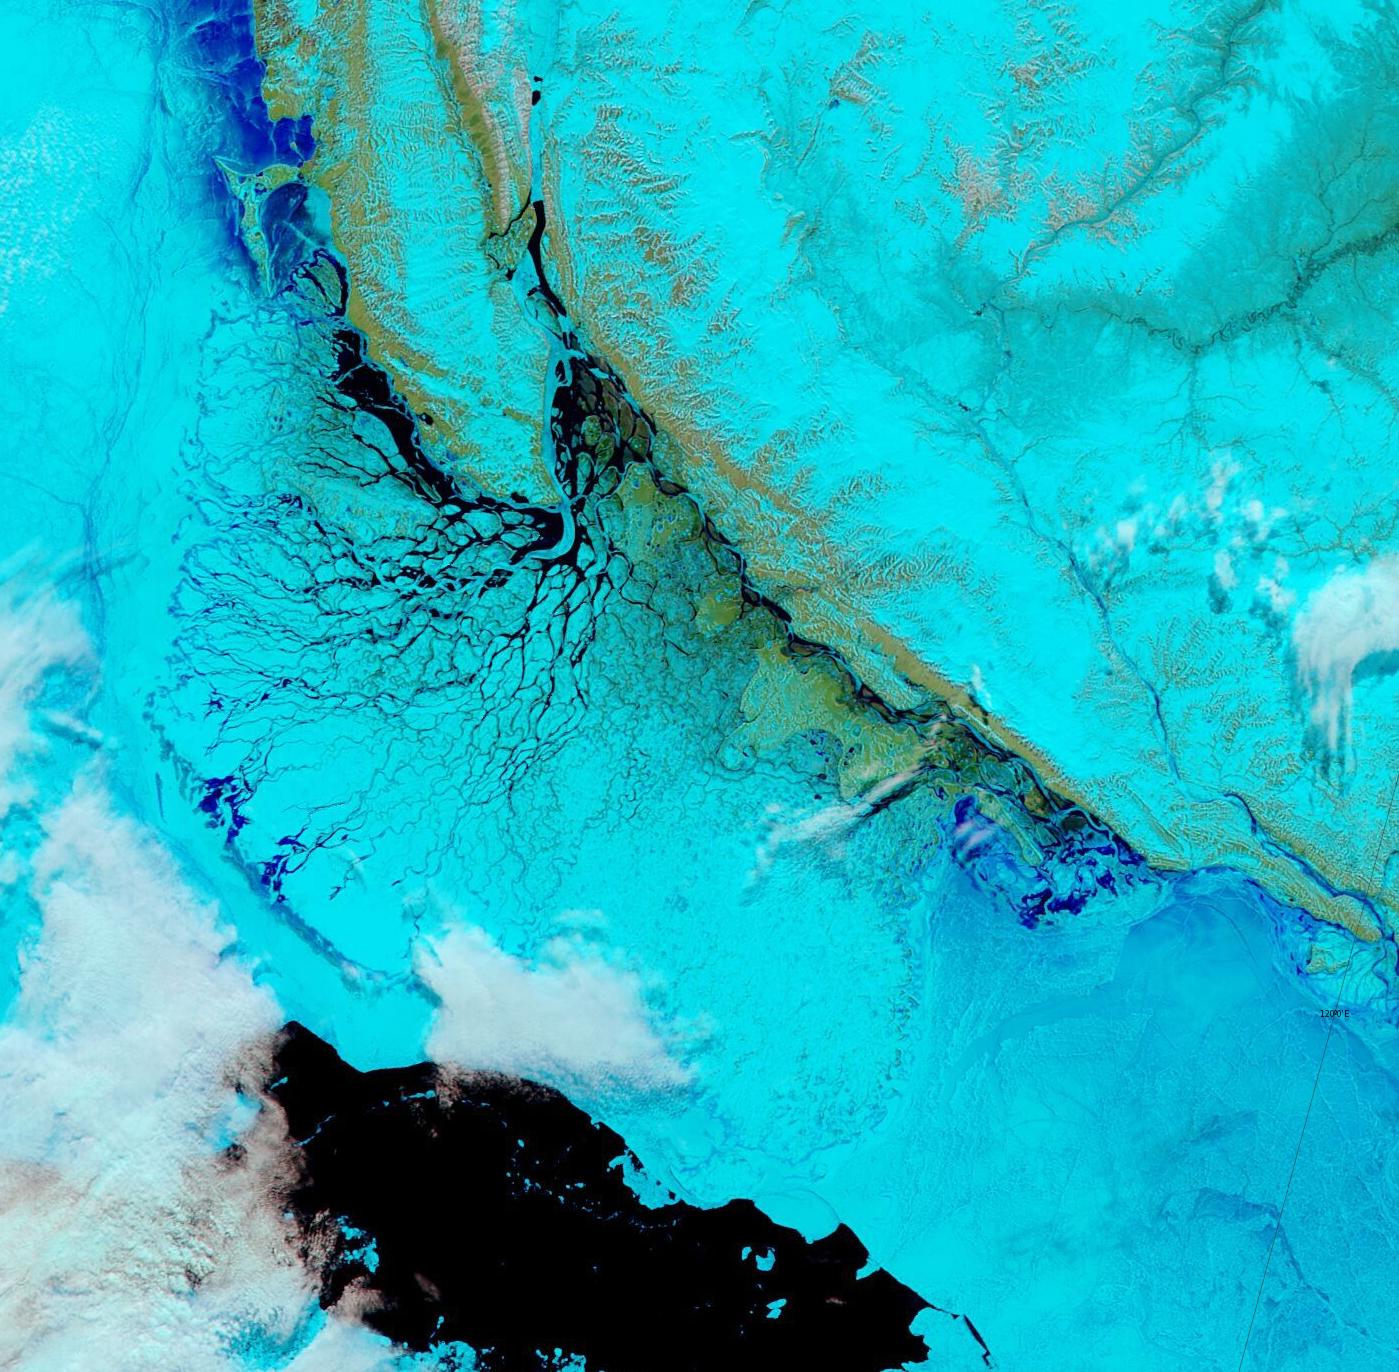
The skies were fairly clear over the central Northern Sea Route this morning, revealing the fast ice breaking up in the East Siberian Sea and plenty of melt ponds in the Laptev Sea:
“False colour” image of the Laptev and East Siberian Seas on June 22nd from the MODIS instrument on the Terra satellite
[Update – June 30th]
Christophe de Margerie is back in the Laptev Sea heading east, this time accompanied by Boris Davydov, another LNG tanker. The nuclear icebreakers are all in the Kara Sea, on the other side of the Vilkitsky Strait:
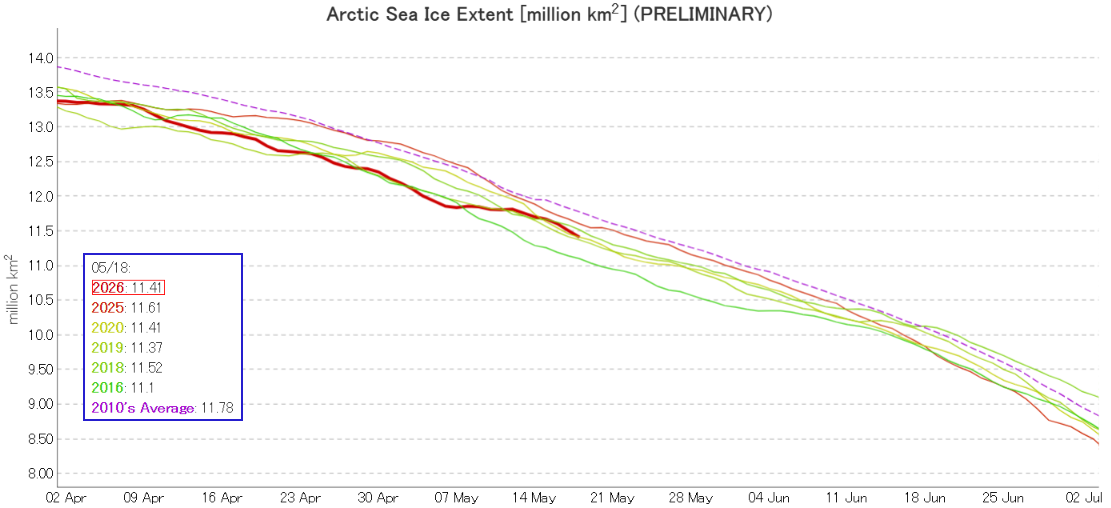
JAXA have updated their visualisations of Arctic sea ice extent data. The “traditional” 2 day average graph is now labelled “preliminary”, and currently shows 2026 in a tie with 2020 for third lowest for the date:
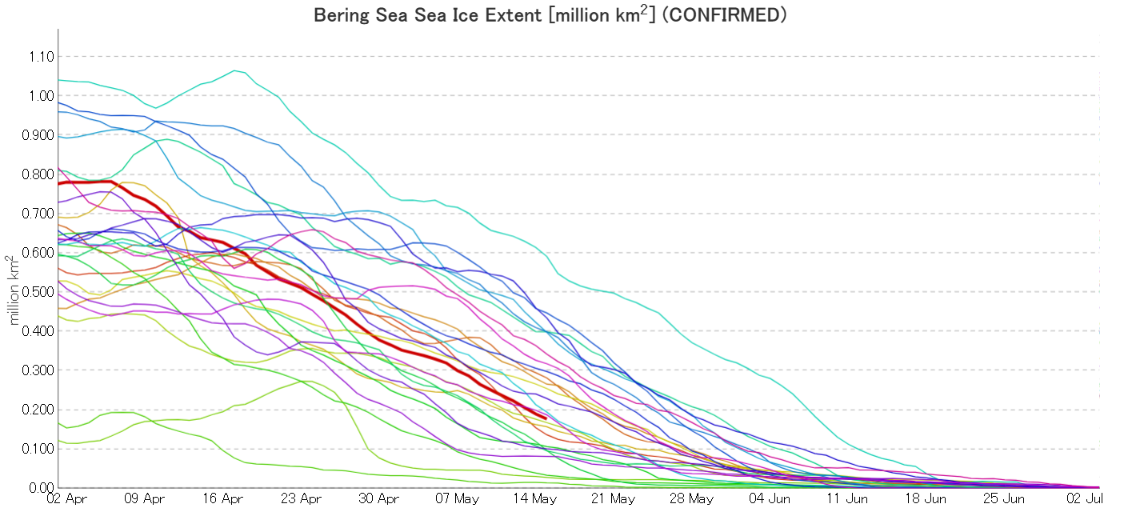
5 day averaged “confirmed” data is also available, including regional graphs. By way of example here’s JAXA’s latest extent graph for the Bering Sea, dated May 15th:
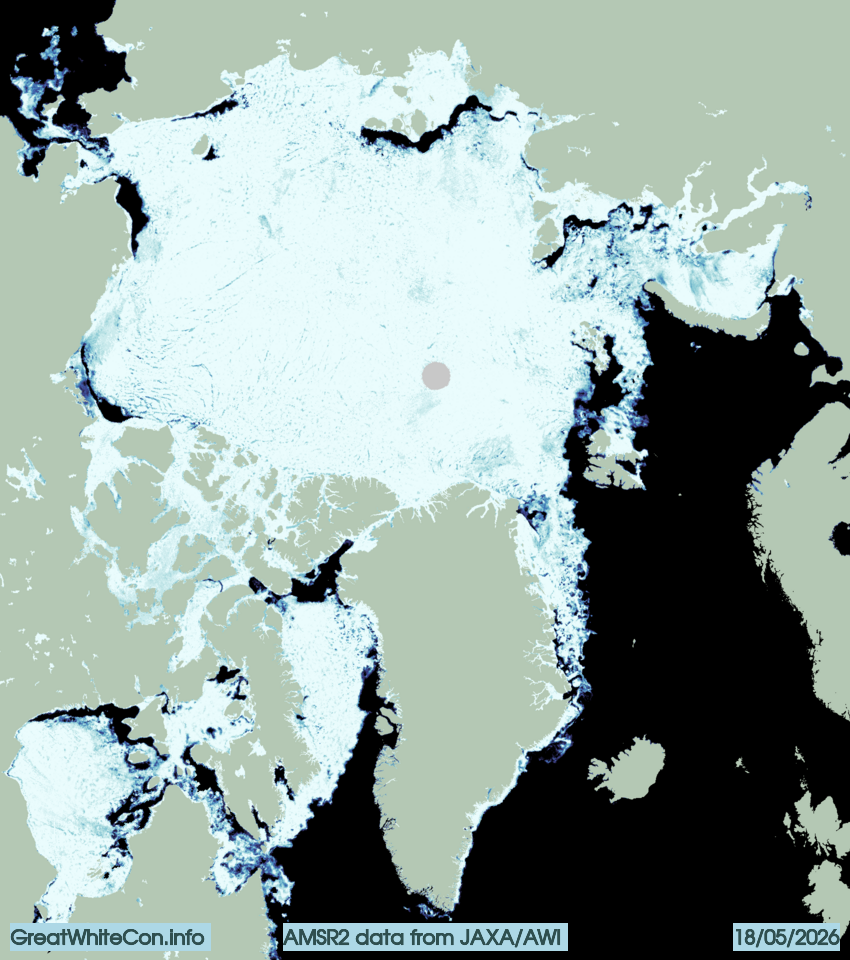
The Alfred Wegener Institute’s sea ice concentration data reveals open water in the Beaufort, Chukchi, East Siberian and Laptev Seas:
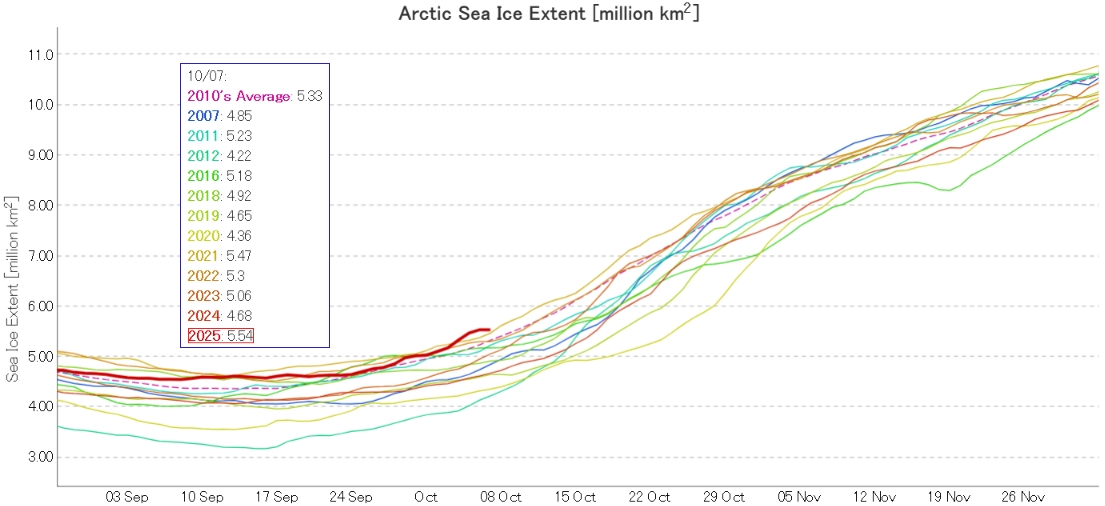
I was hoping that the September PIOMAS gridded thickness data would have been published by now, but no such luck. Reverting to JAXA/ViSHOP extent, after flatlining for most of September the refreeze has started in earnest over the last two weeks. Extent is currently 12th lowest in the satellite era:
The latest sea ice concentration map from Lars Kaleschke of the Alfred Wegener Institute, based on AMSR2 data, reveals plenty of new ice in the Beaufort Sea, plus a bit more to the north of the Laptev Sea:
The latest sea ice “stage of development” charts from the Canadian Ice Service confirm that, and reveal more new ice that has yet to show up in the AMSR2 data:
[Update – October 11th]
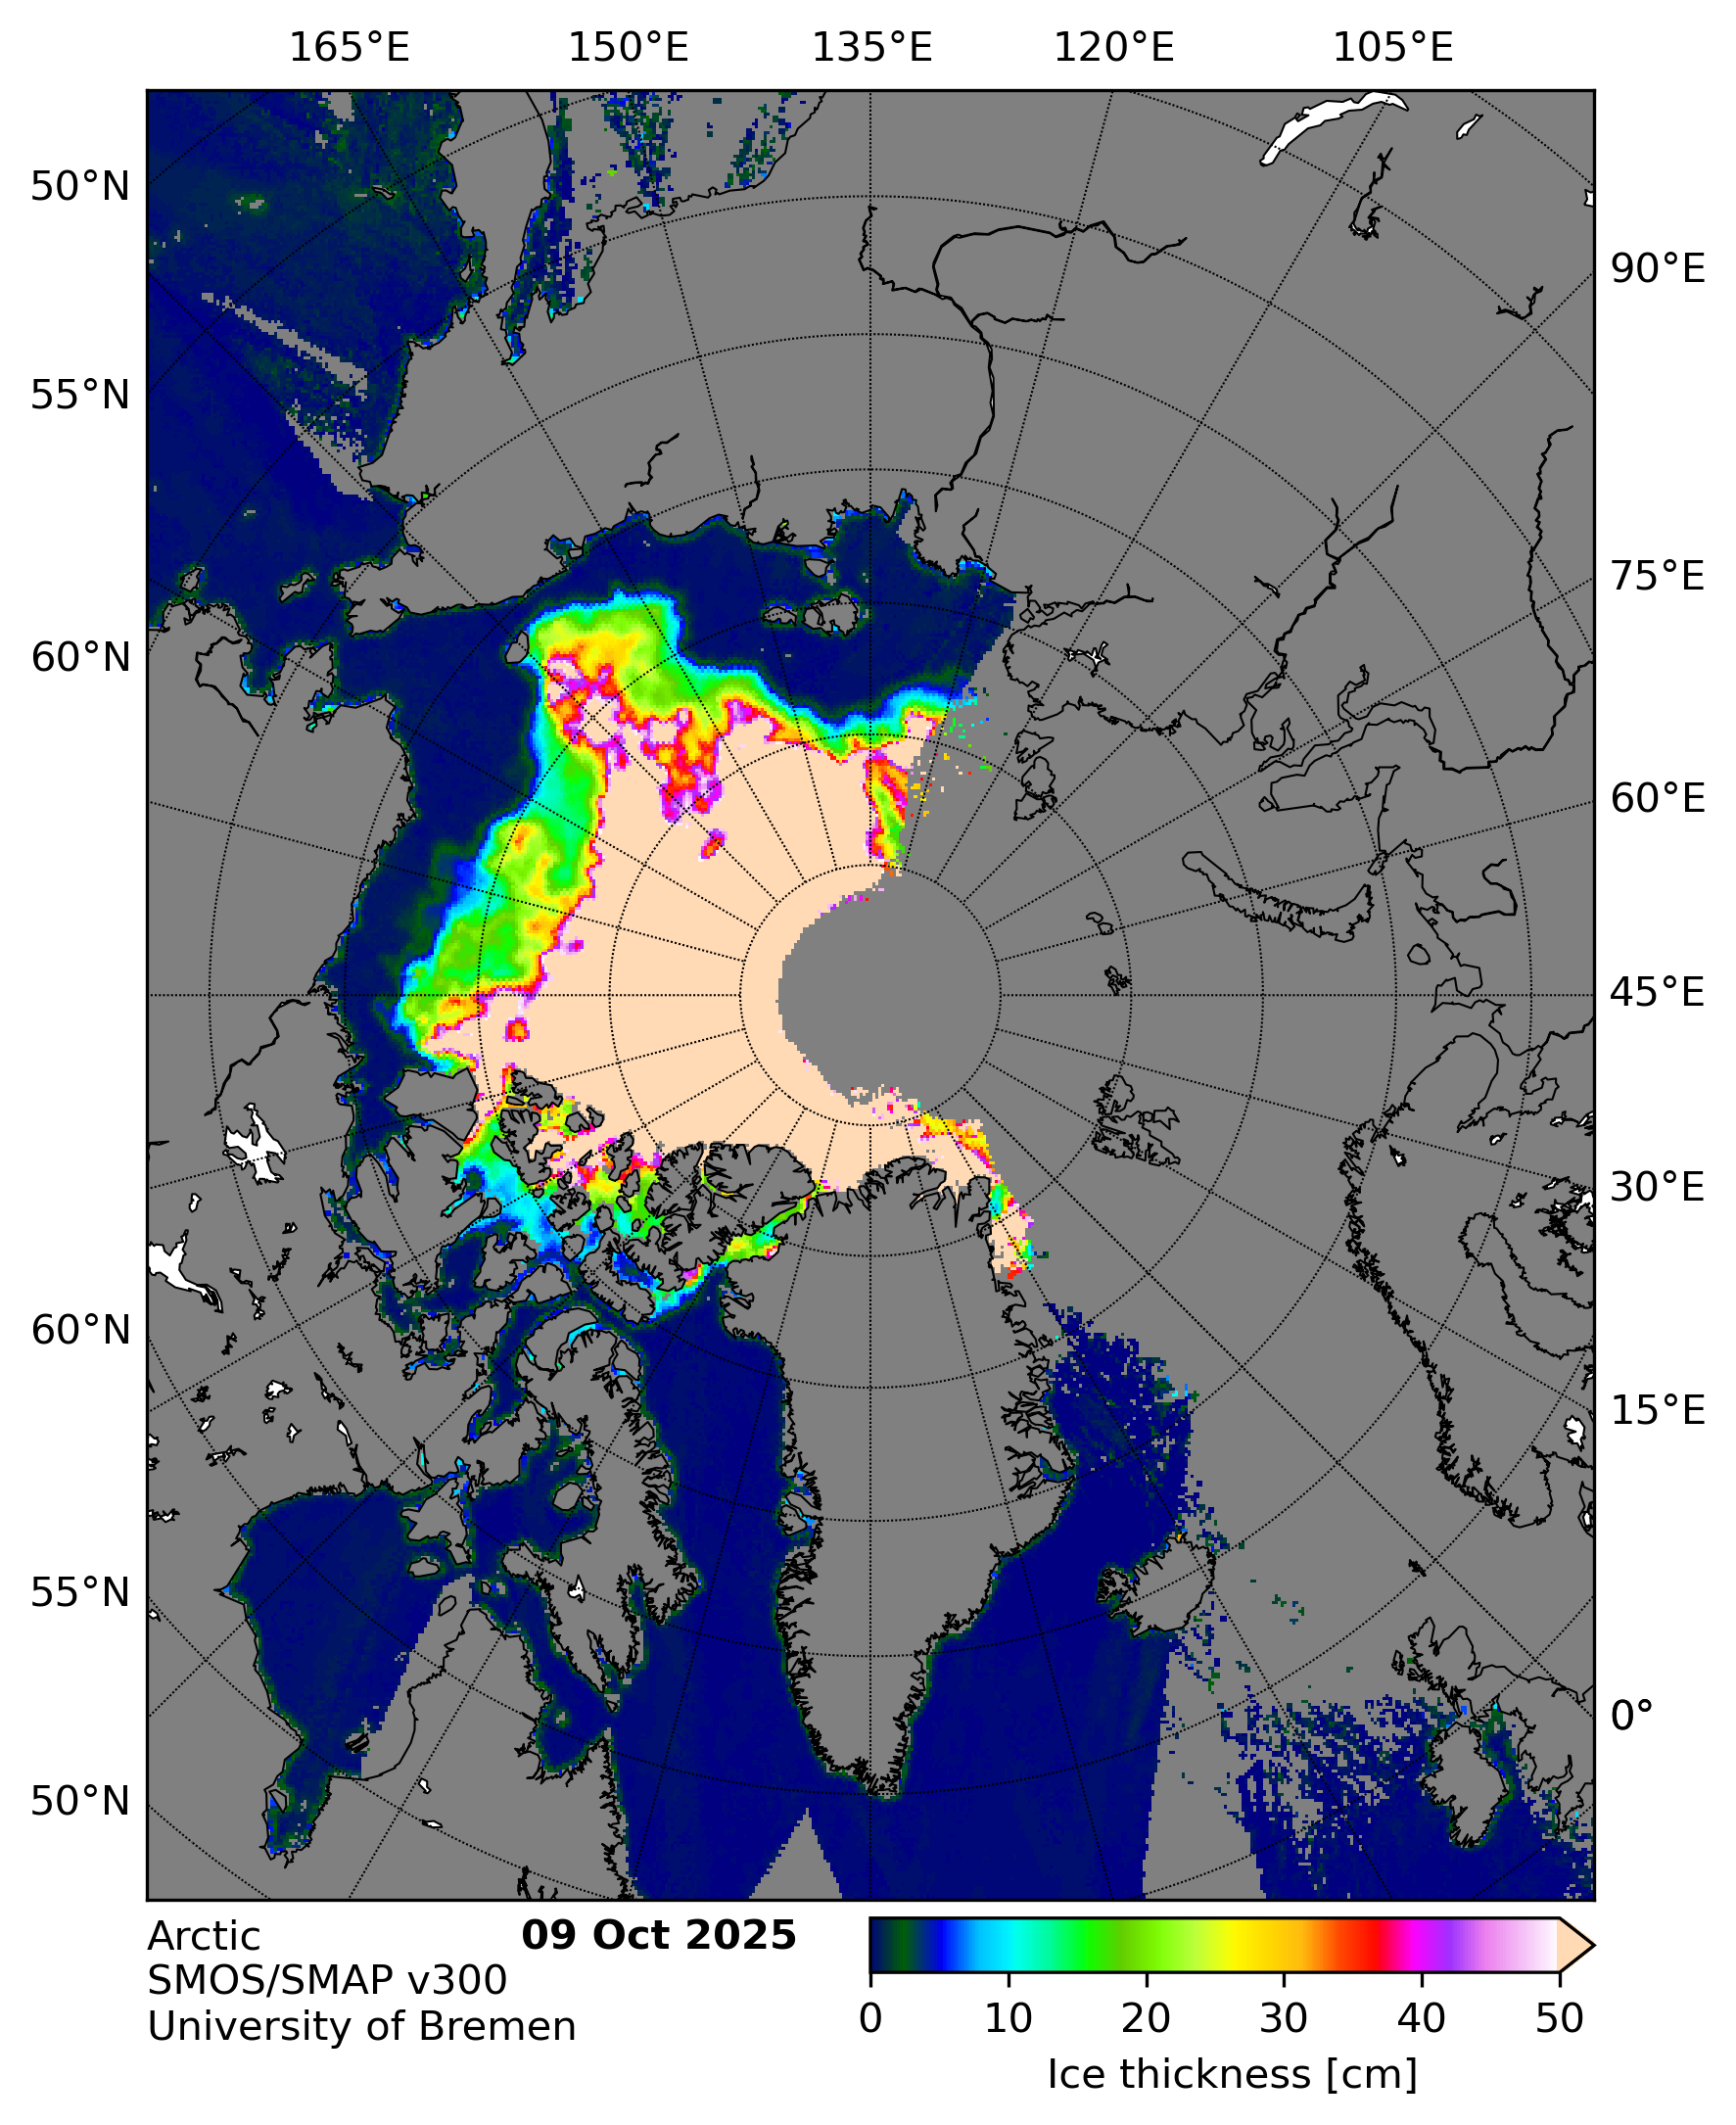
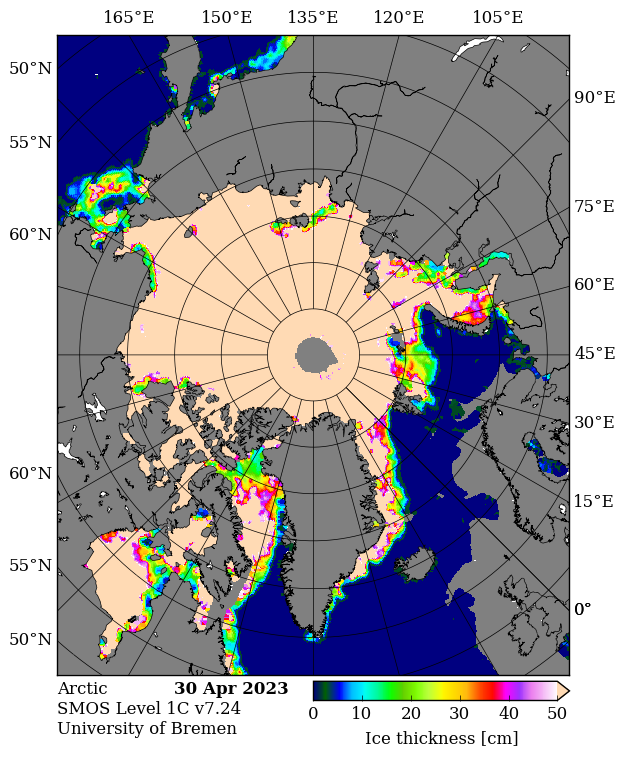
In the continuing absence of PIOMAS gridded thickness data (see below), here’s the latest SMOS/SMAP “thin ice thickness” map:
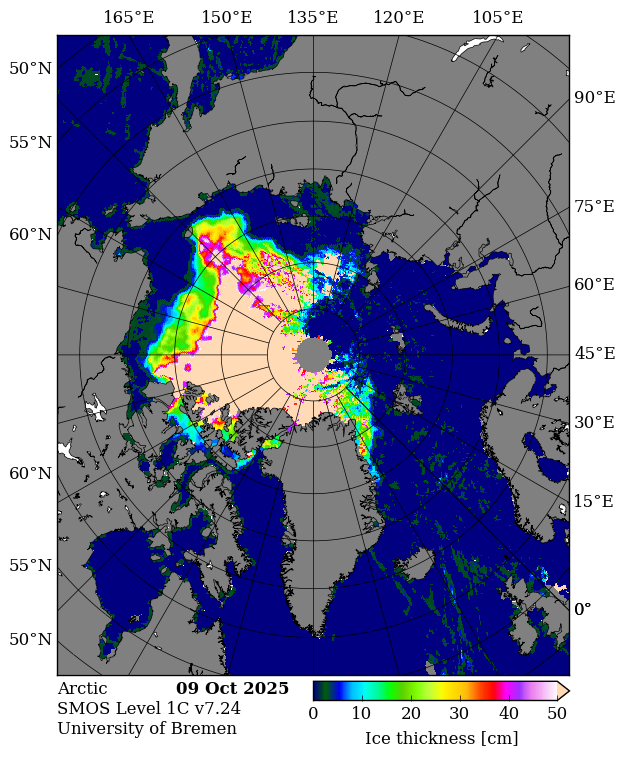
It appears to be badly affected by radio frequency interference on the Atlantic side of the Arctic. Here’s the raw SMOS map:
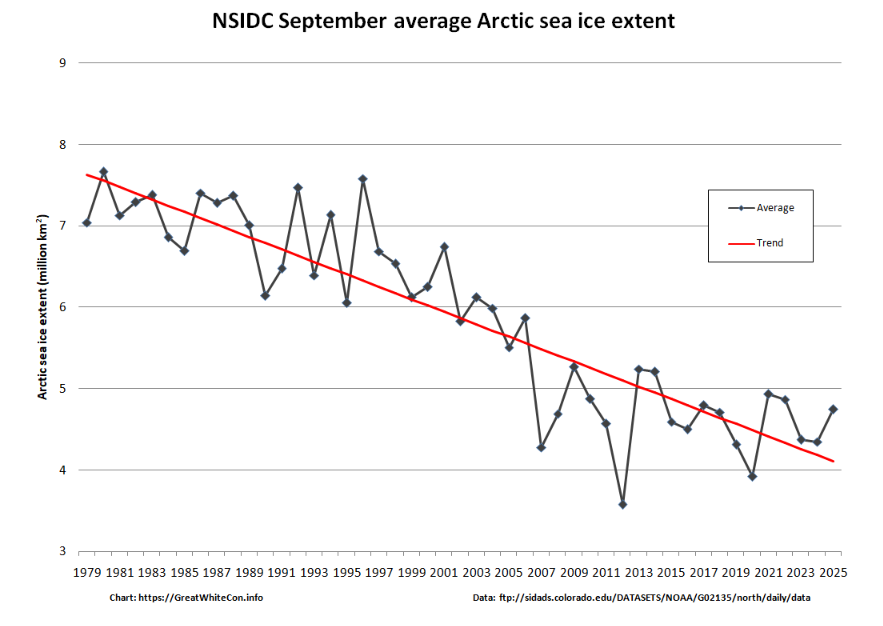
Further to a previous conversation on the subject, here’s the final NSIDC annual average extent graph for September:
As anticipated, 2025 annual average extent has proved to be the lowest in the satellite era.
[Update – October 16th]
I was hoping that the September edition of the NSIDC’s “Sea Ice Today” analysis would have been published by now, but no such luck. Here’s the latest data announcement from the NSIDC:
Effective October 15, 2025, due to non-renewed funding, NSIDC has suspended or reduced several Sea Ice Today tools and services.
Sea ice annual maximum and minimum announcements (typically occurring in March and September)
Previously-published Sea Ice Today analysis posts will remain online. The discontinued Sea Ice Today products will no longer update or be maintained, and will be removed in the next several weeks.
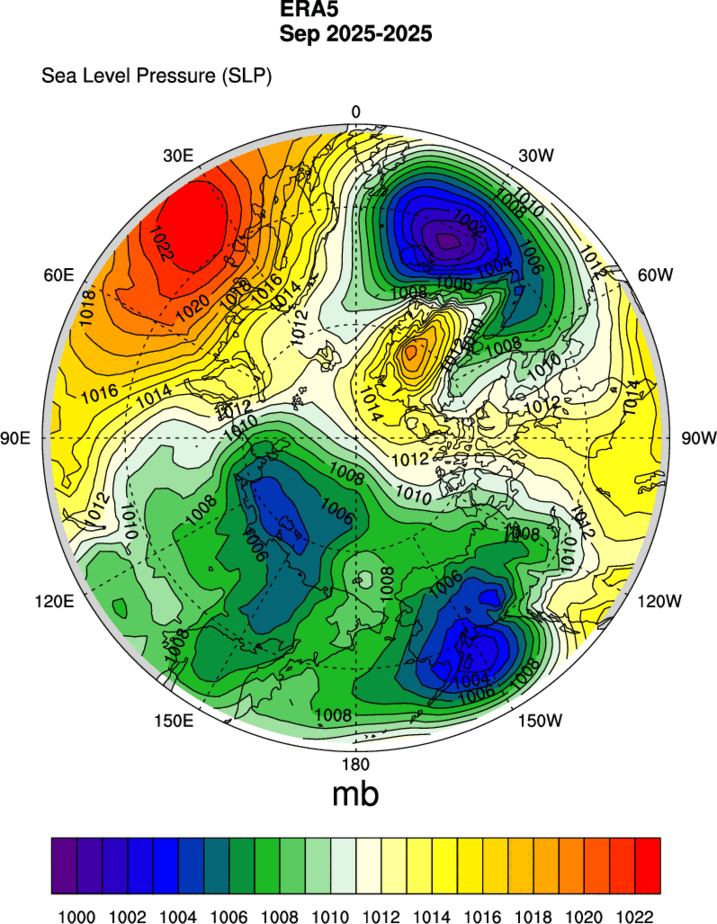
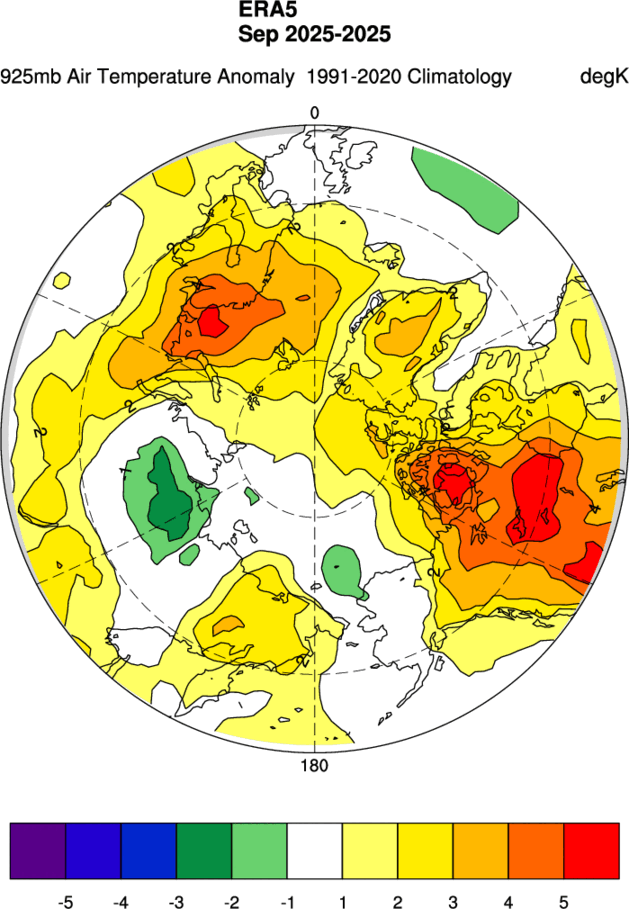
In Sea Ice Today’s absence, here’s the MSLP and 925 hPa temperature maps for September, usually contained in the monthly analysis articles:
Plus a hastily constructed graph of the monthly average extent for September:
The Arctic sea ice volume derived therefrom is 5.43 thousand km³. The data is accompanied by the following “Product Degradation Warning”:
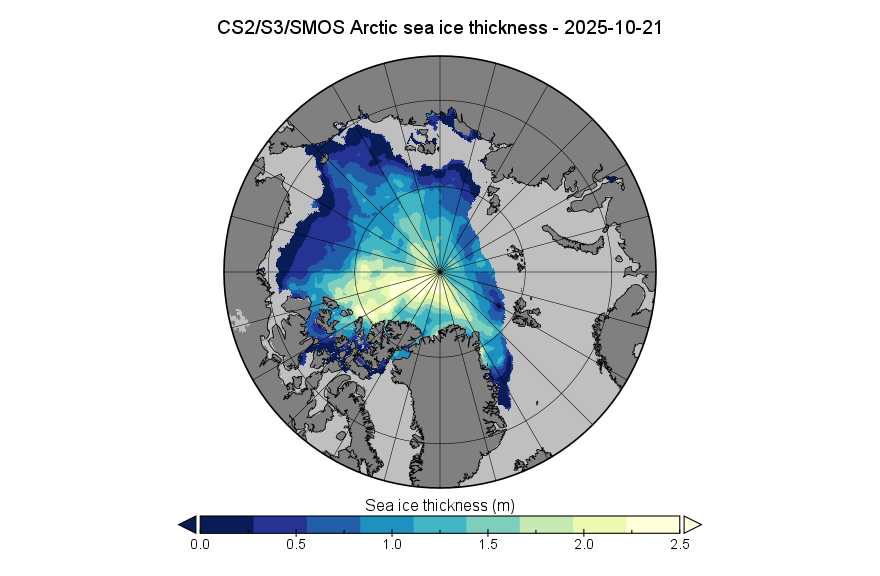
SMOS input data continues to be affected by persistent and frequent radio-frequency interference (RFI) in the Barents, Kara, and Laptev Seas, resulting in missing thin ice thickness measurements. Consequently, sea ice thickness estimates for this region in the product will rely exclusively on radar altimeter data, which may lead to higher reported values than would have been obtained using SMOS.
[Update – October 27th]
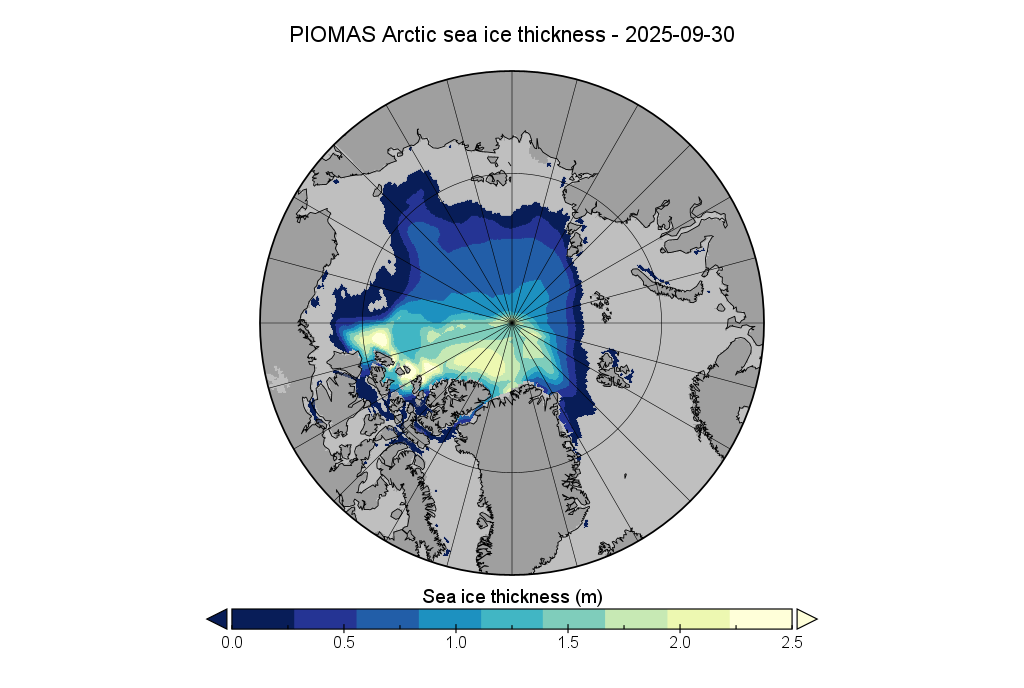
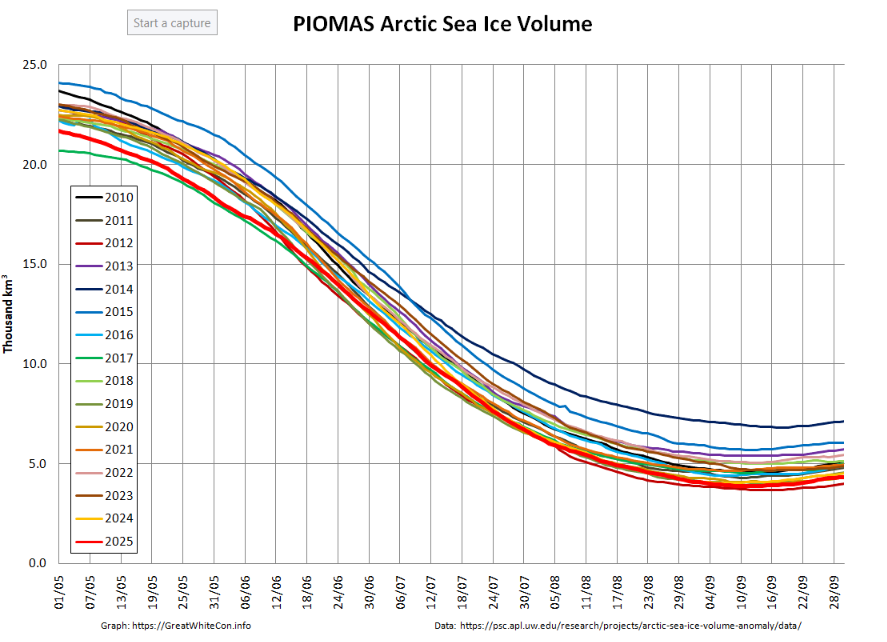
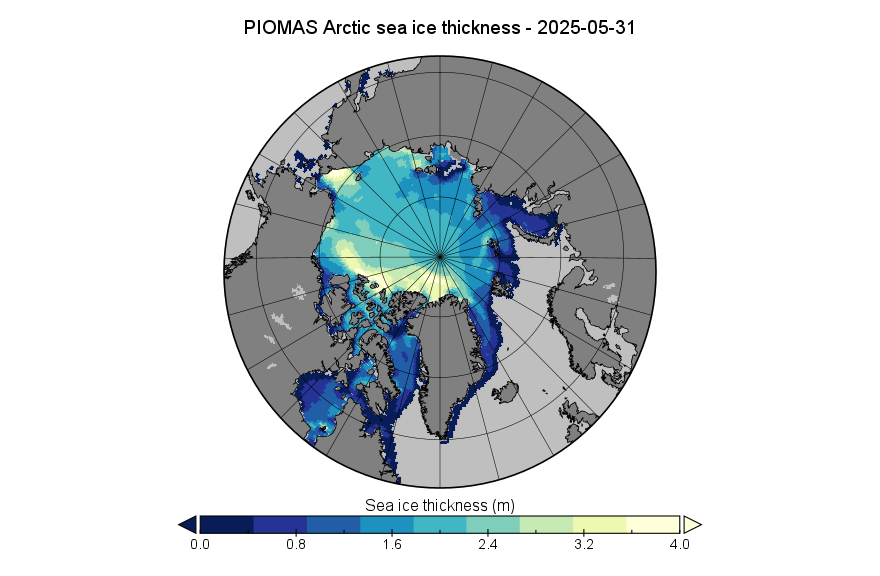
The PIOMAS gridded thickness data for September 2025 has been belatedly released:
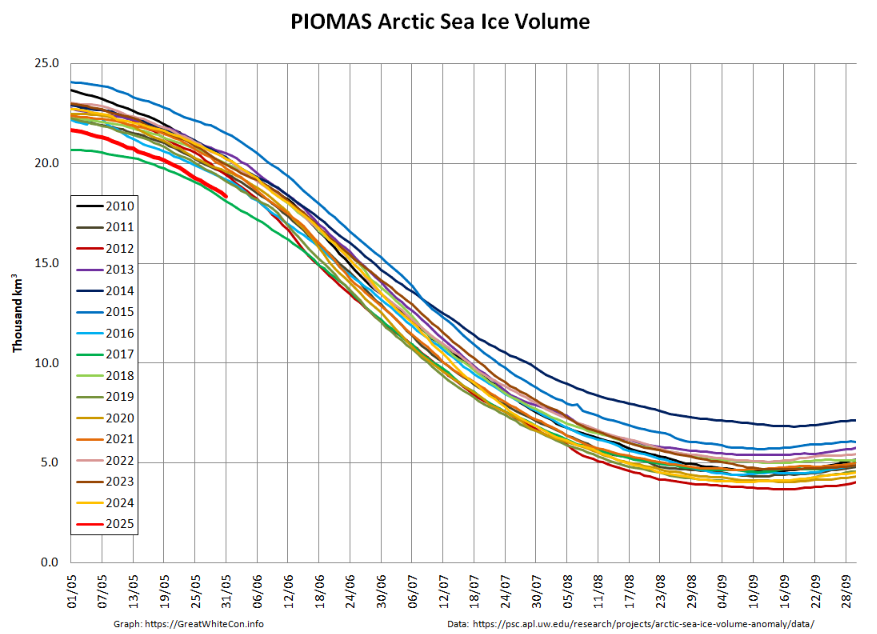
The associated volume graph reveals that the 2025 minimum modelled Arctic sea ice volume was 3.87 thousand km³ on September 12th, which is the 2nd lowest minimum in the PIOMAS record going back to 1979:
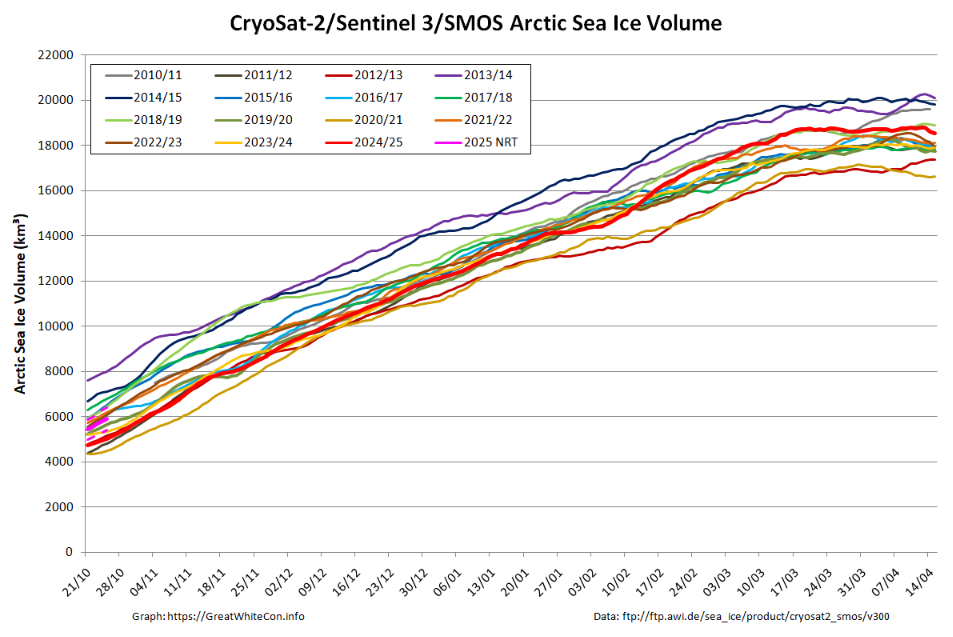
Whilst we’re on the topic of sea ice volume, here’s the latest “measured” volume graph:
Note the proviso about recent SMOS data above, and also that the version 3.00 data from AWI is currently only available beginning in Autumn 2023. Prior years shown on the graph above are based on version 2.06 data, which amongst other things does not incorporate Sentinel 3 data.
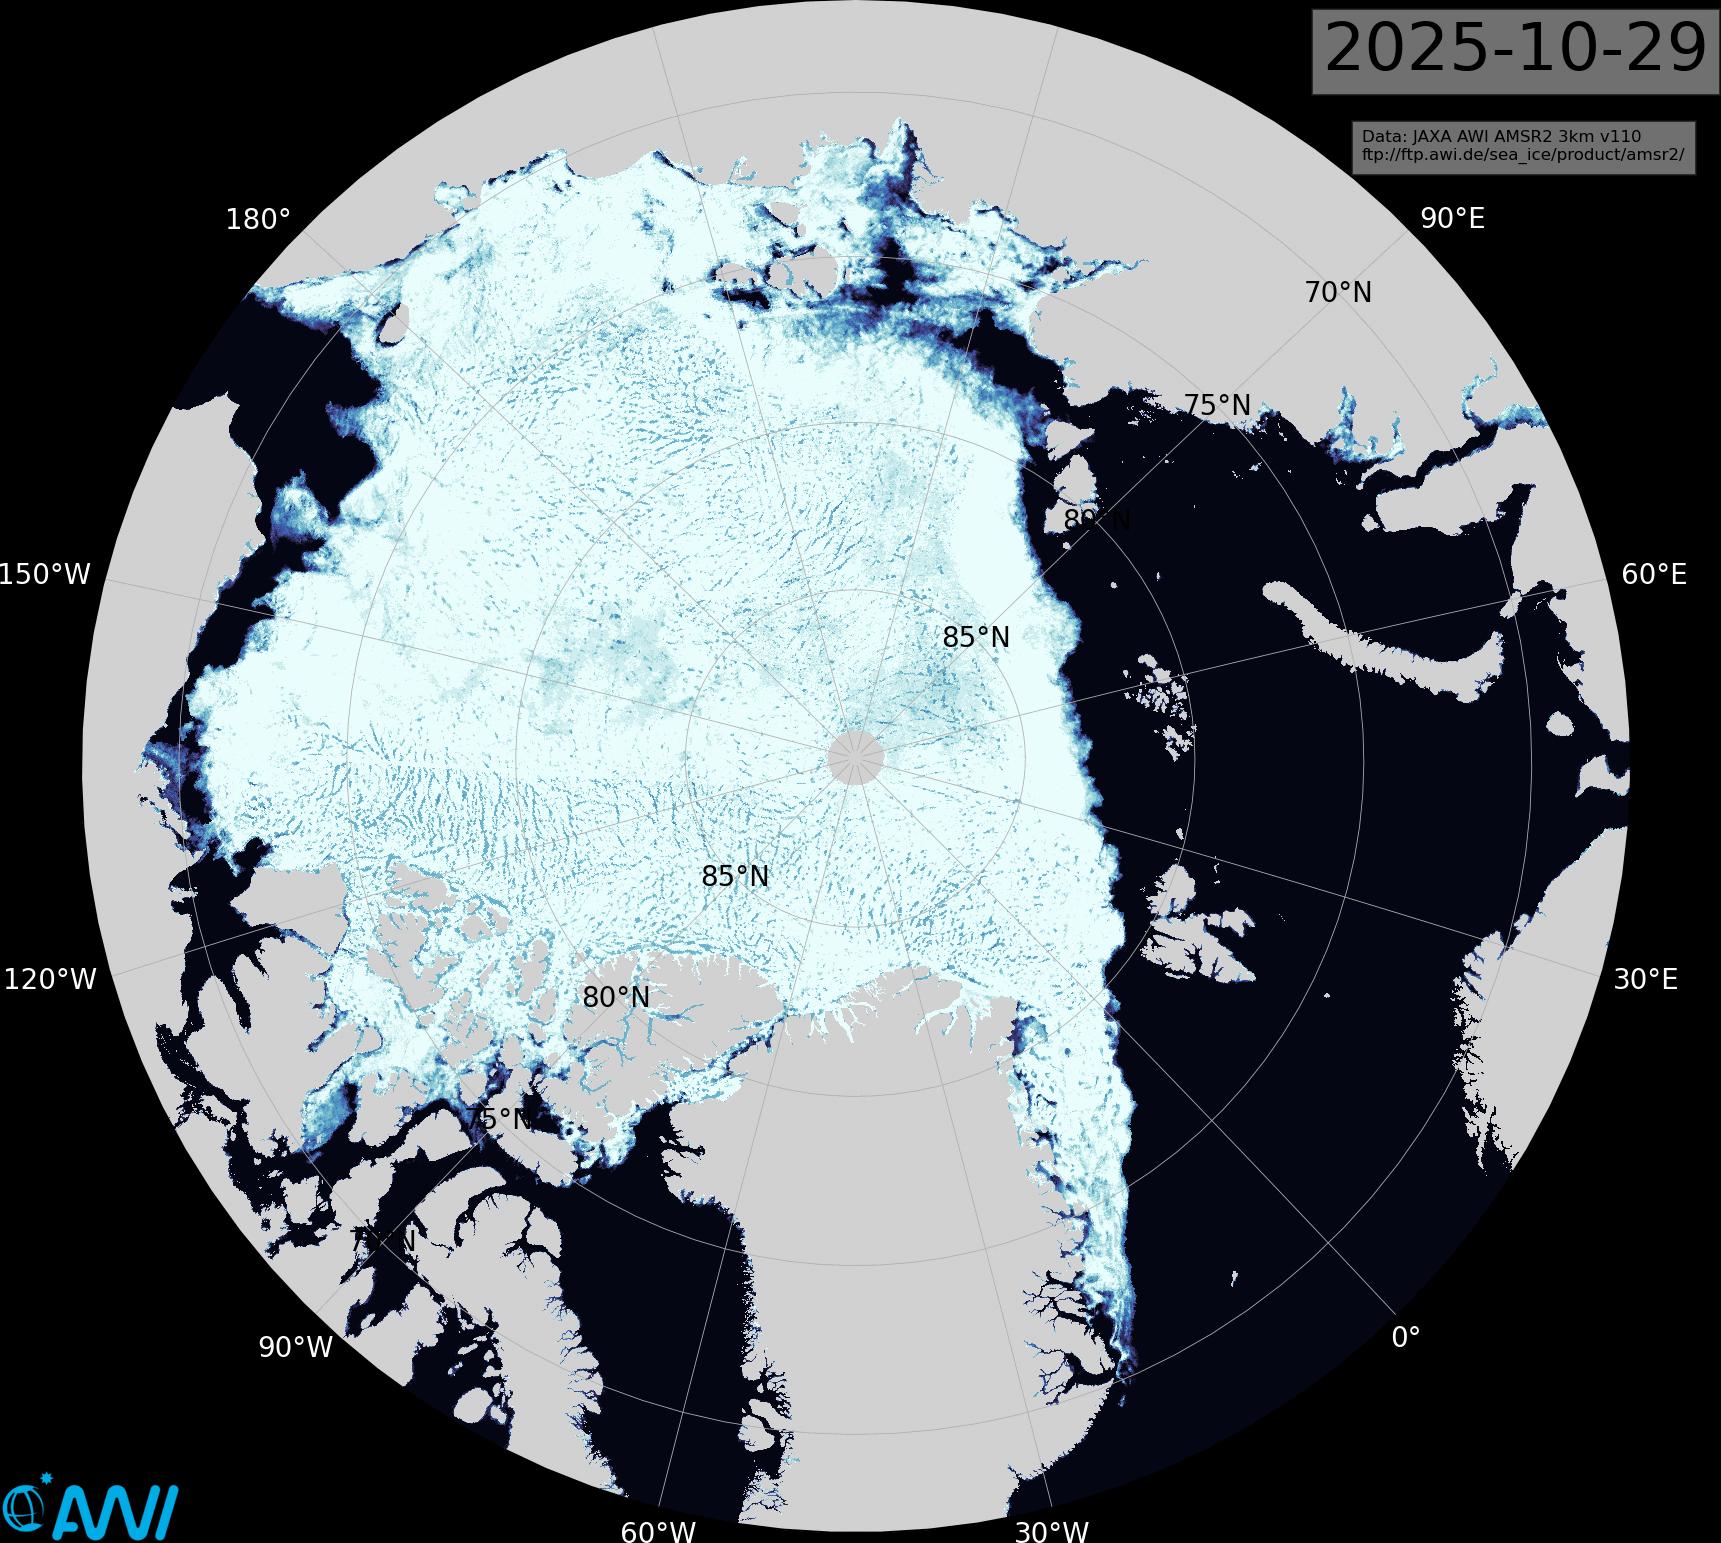
[Update – October 29th]
Much of the Siberian side of the Arctic Ocean has now refrozen:
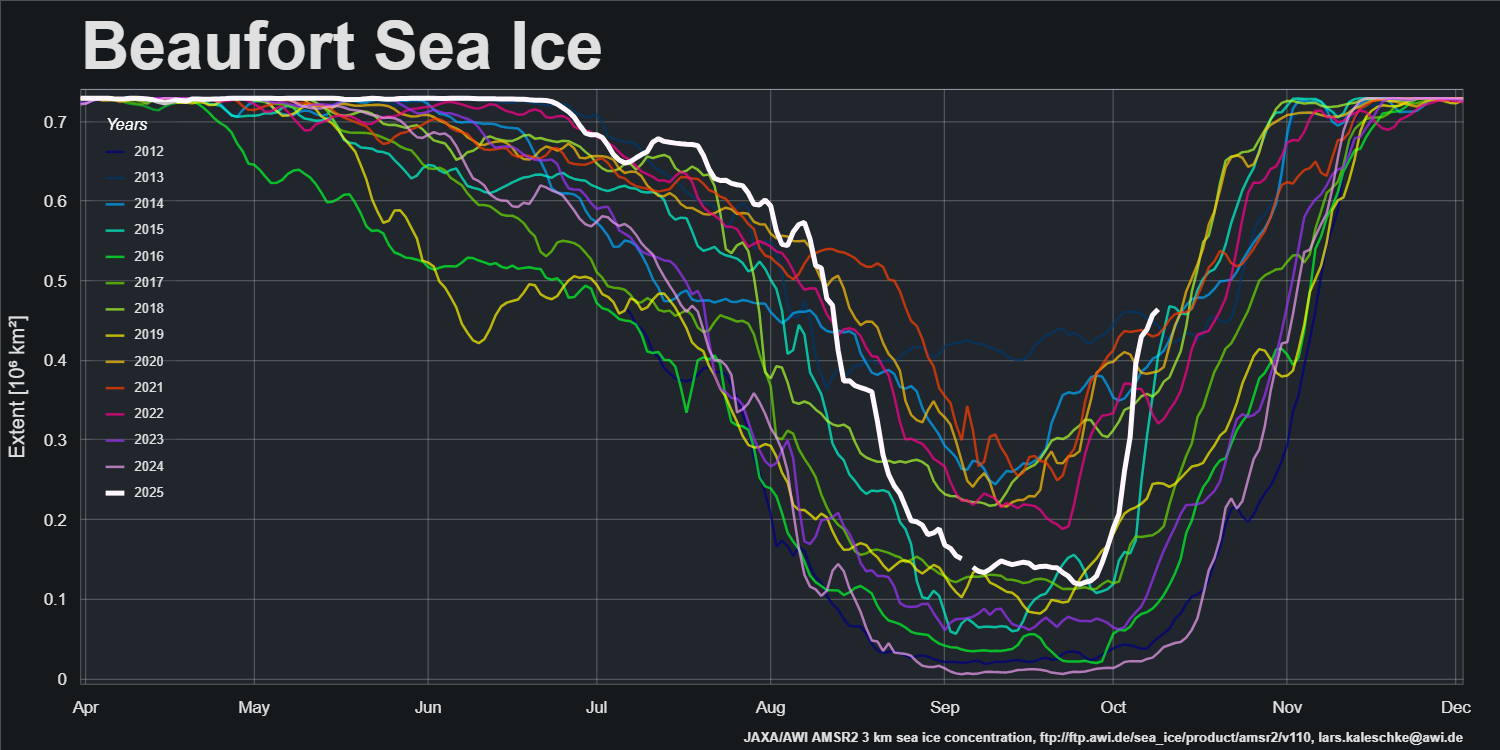
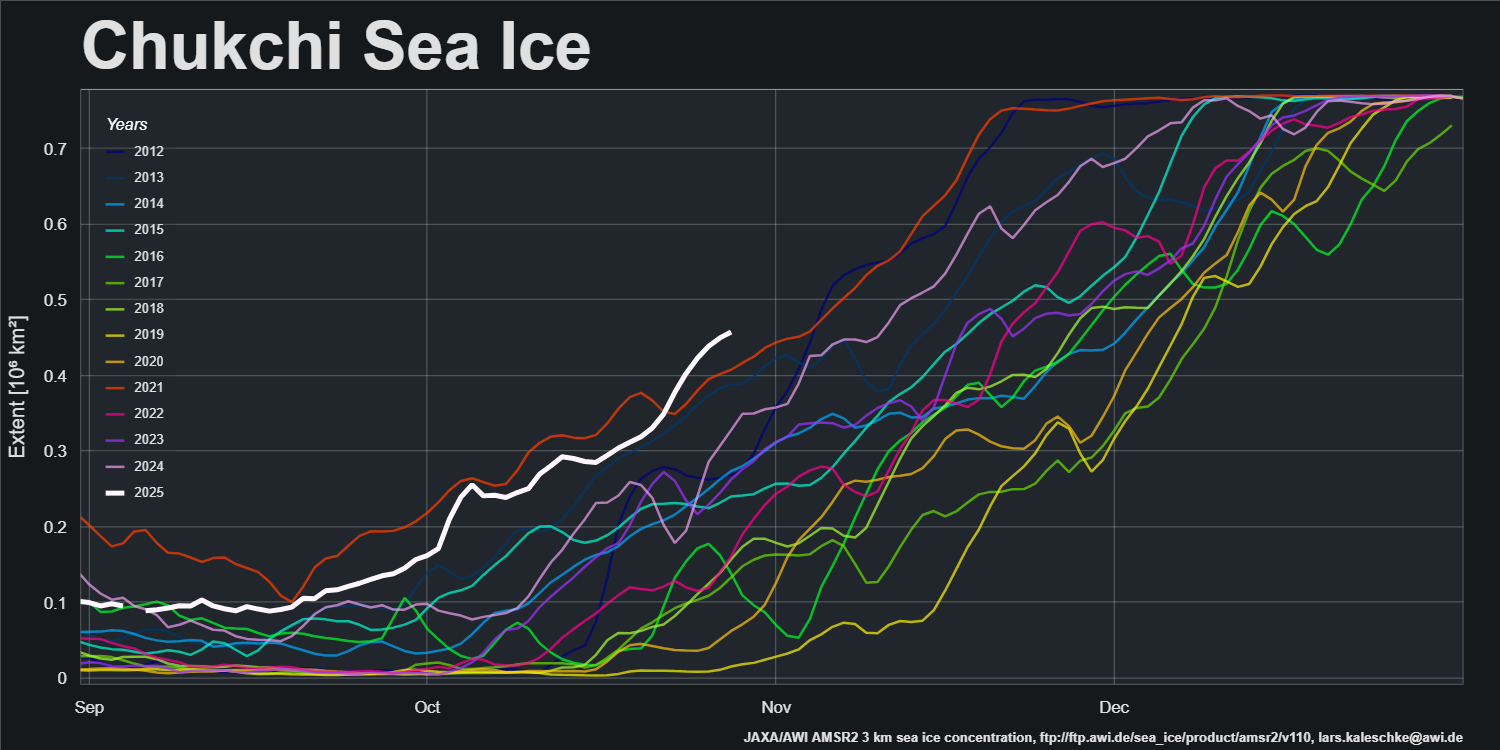
There is a significant difference between progress of the refreeze on the the Pacific and Atlantic sides of the Arctic. Extent in the Chukchi Sea is currently highest for the date in the AMSR2 record:
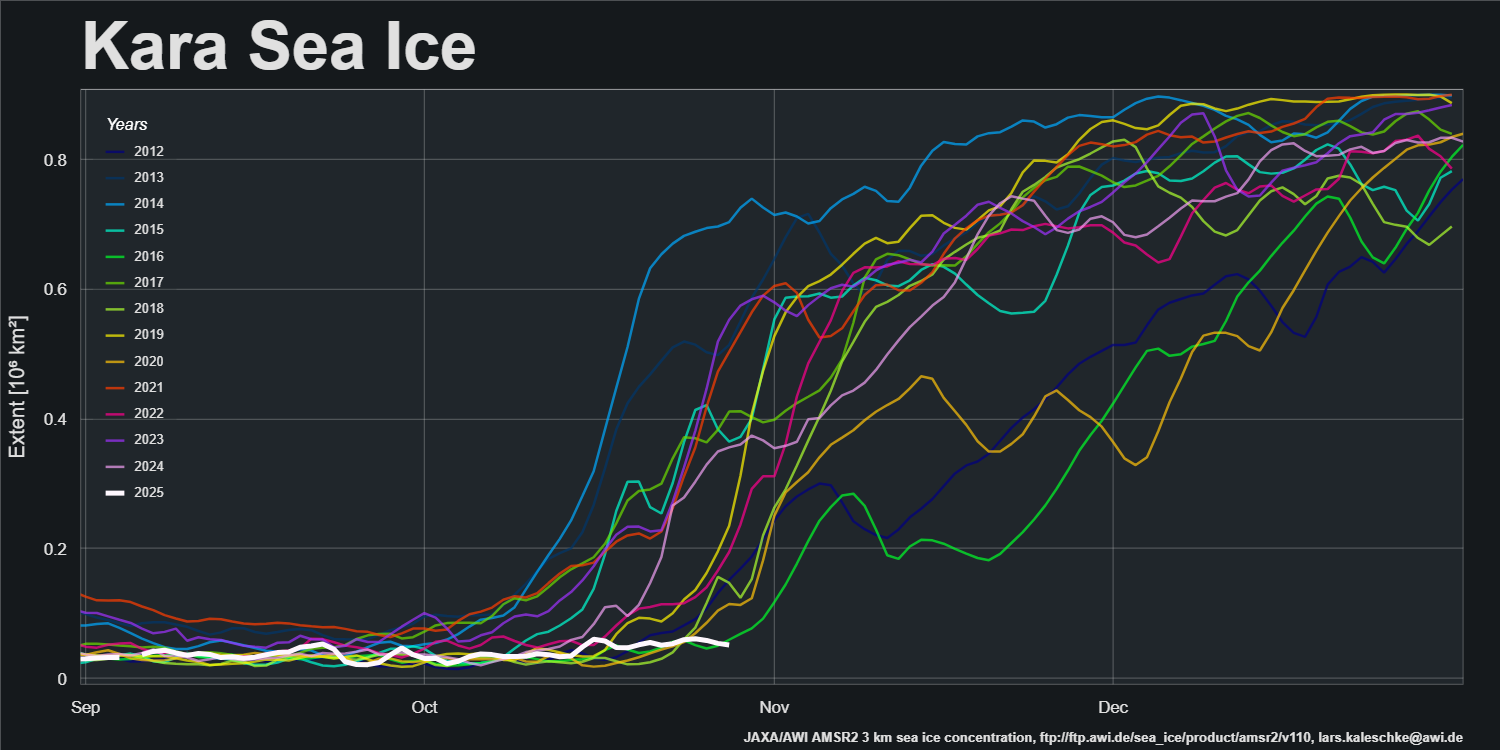
However, refreeze of the Kara Sea has yet to begin, and extent is currently lowest for the date in the AMSR2 record:
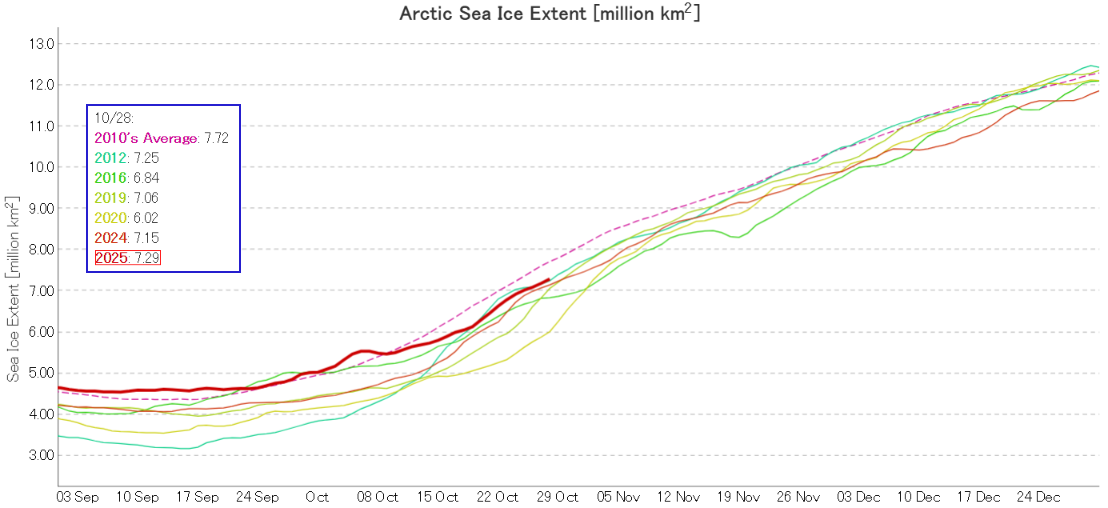
Pan Arctic JAXA/ViSHOP extent is now 6th lowest in the satellite era:
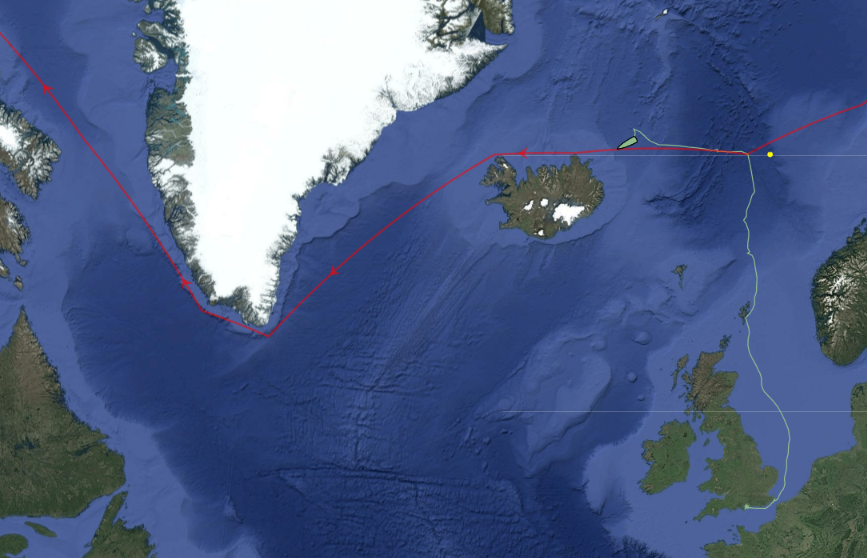
I mentioned the start of Ella Hibbert‘s long voyage in her yacht Yeva over on this year’s Northwest Passage thread. Ella and Yeva have now crossed north of the Arctic Circle near Iceland and have begun their attempt to circumnavigate the Arctic in a single summer by sailing past the north of Iceland in a westerly direction:
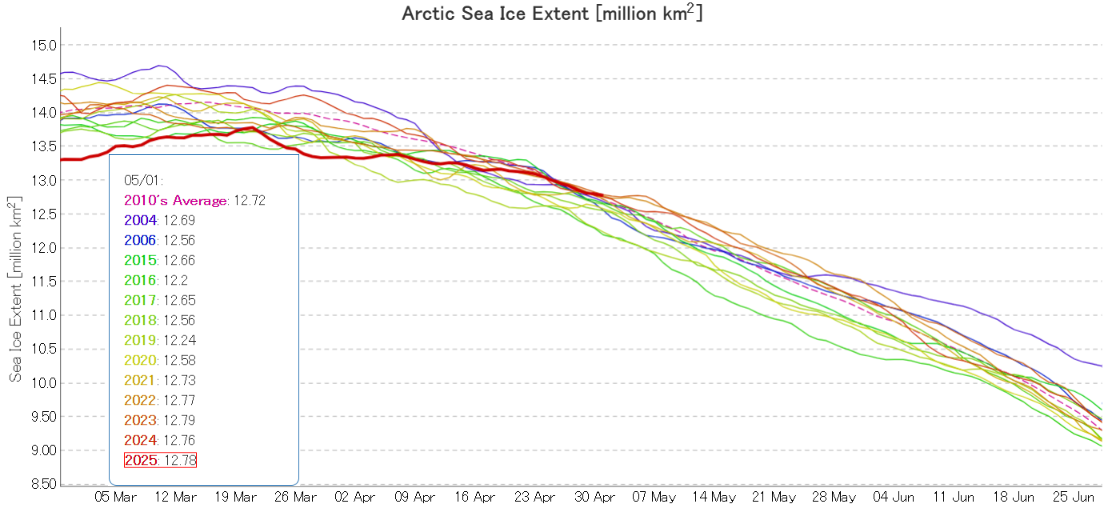
JAXA/ViSHOP extent is no longer “lowest for the date”! After “flatlining” for most of April the metric is now in the midst of a close knit group of the other years in the 2020s:
The high pressure area over the Central Arctic persisted through the second half of April, and so did the consequent drift of ice from the Pacific side of the Arctic to the Atlantic periphery:
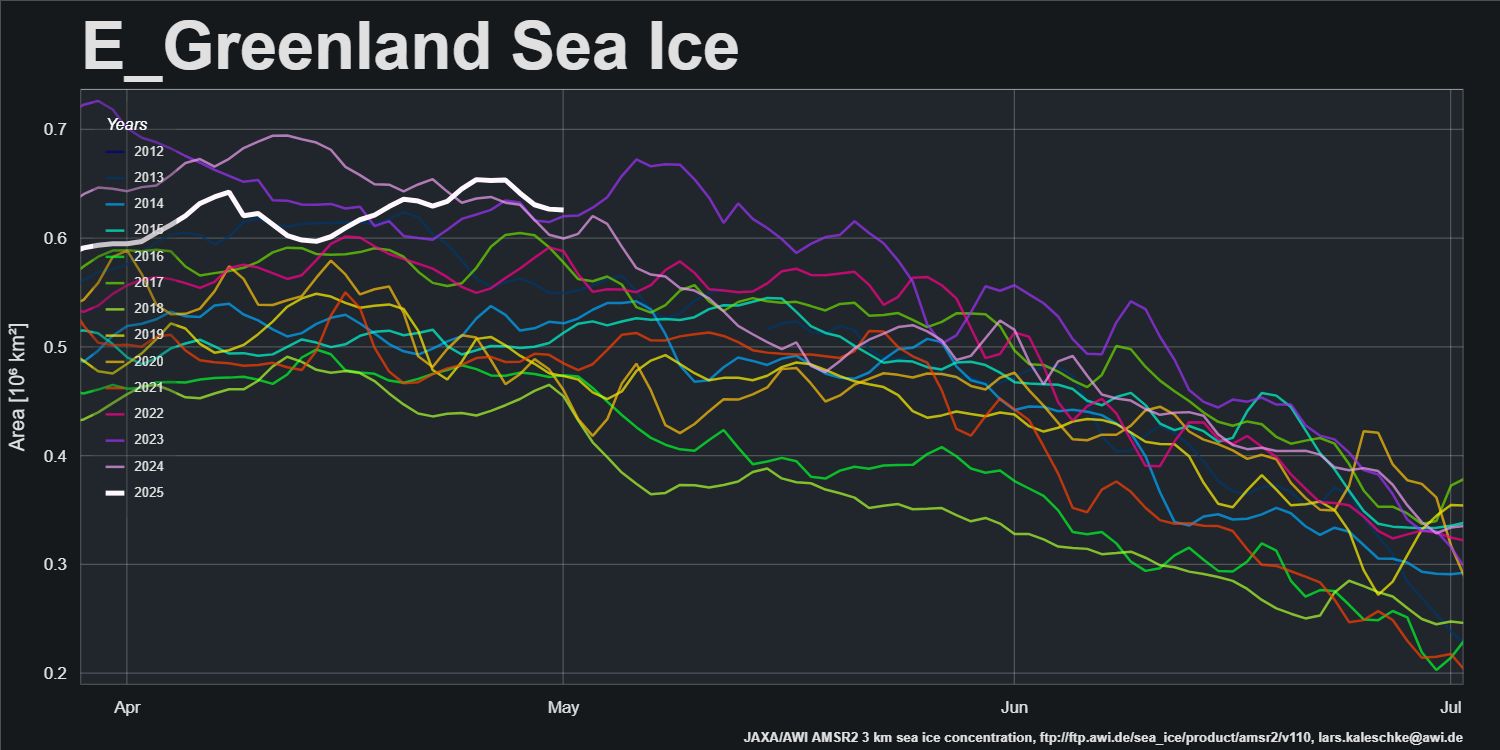
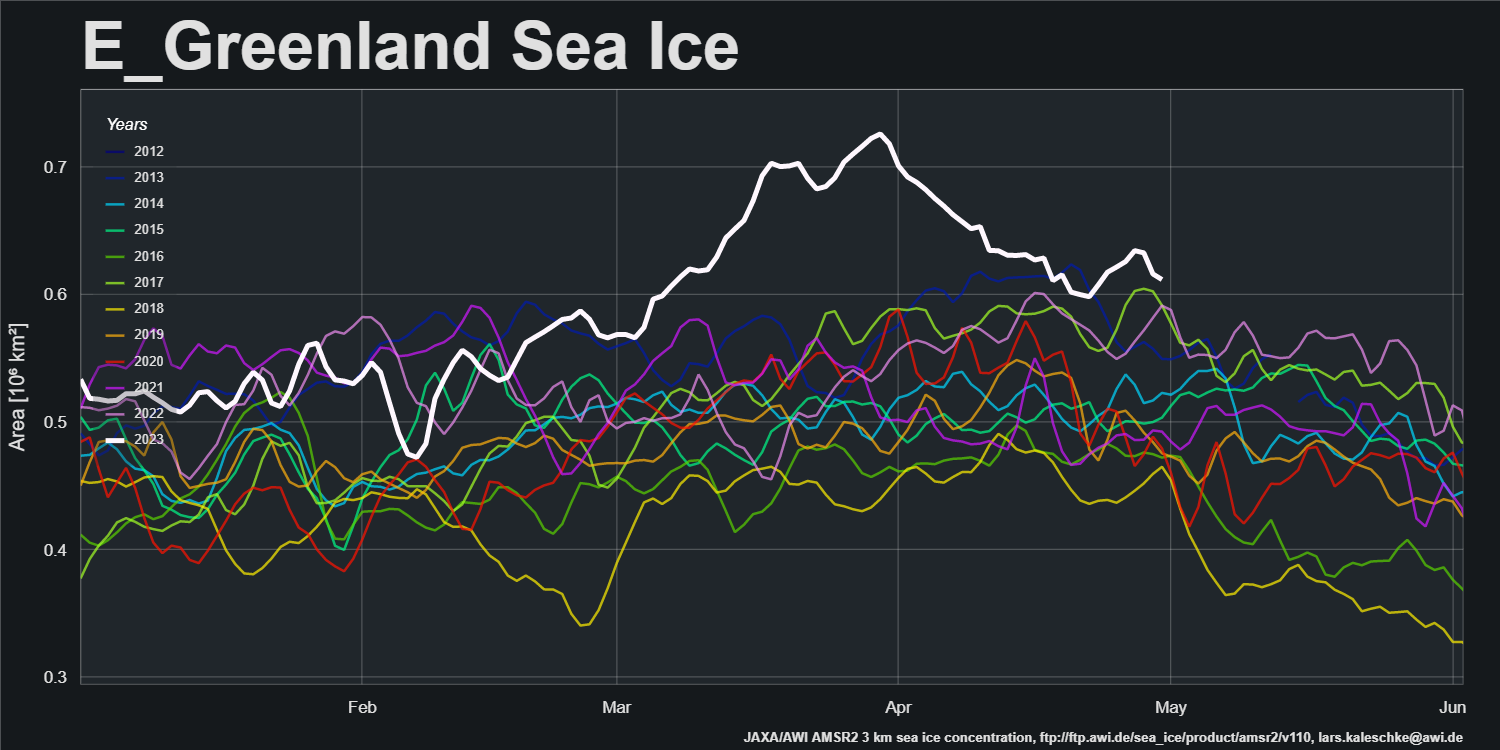
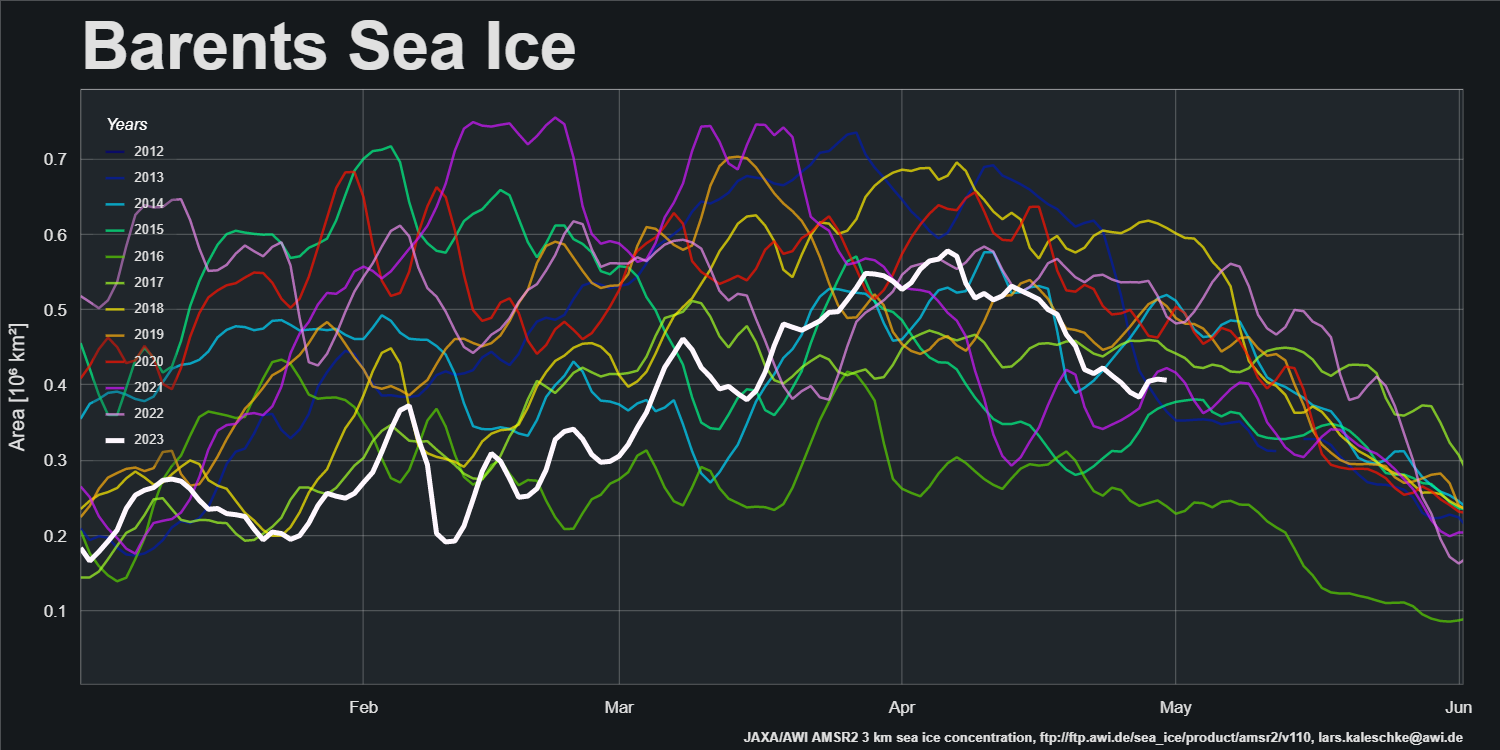
AWI’s sea ice area for the Greenland Sea is currently “highest for the date” in the AMSR2 record that started in July 2012:
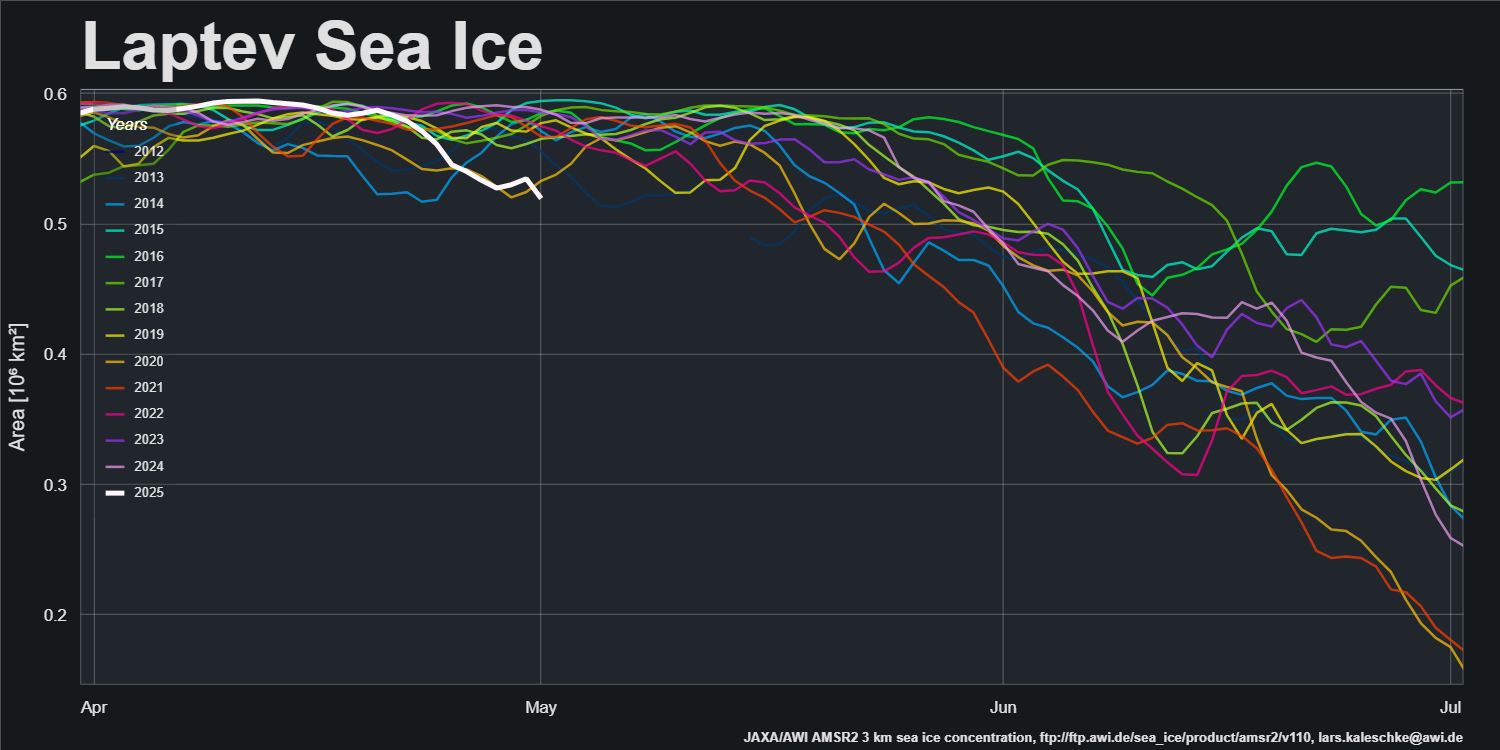
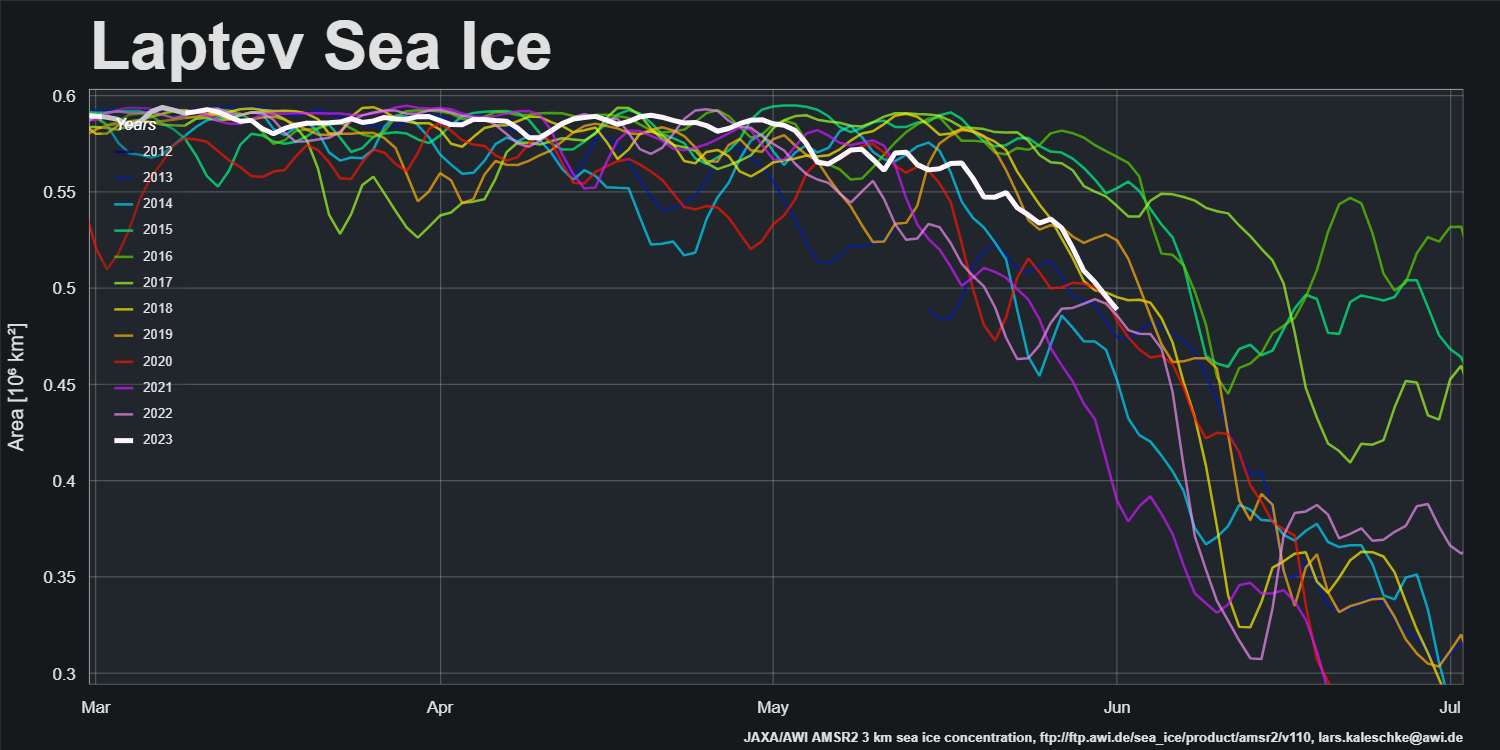
The offshore winds along the Laptev Sea coast have continued, and sea ice area is now “lowest for the date”:
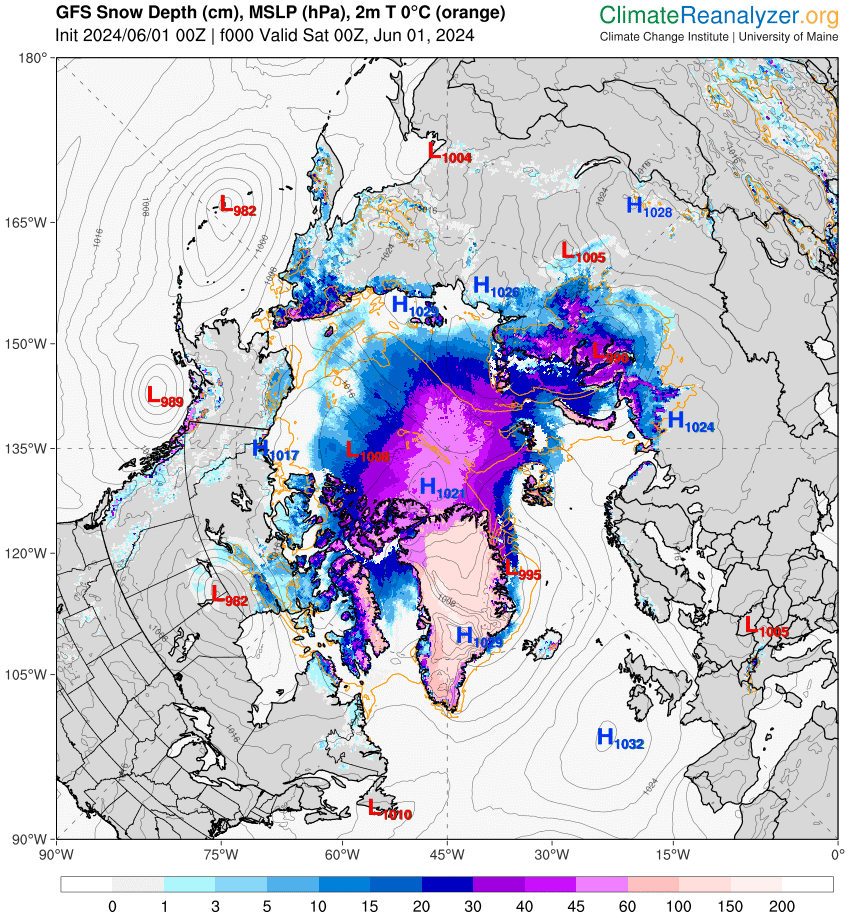
The first signs of a break in the high pressure dominance are appearing. GFS currently forecasts that a low pressure area will enter the Central Arctic, bring above zero temperatures over the Kara Sea on Sunday:
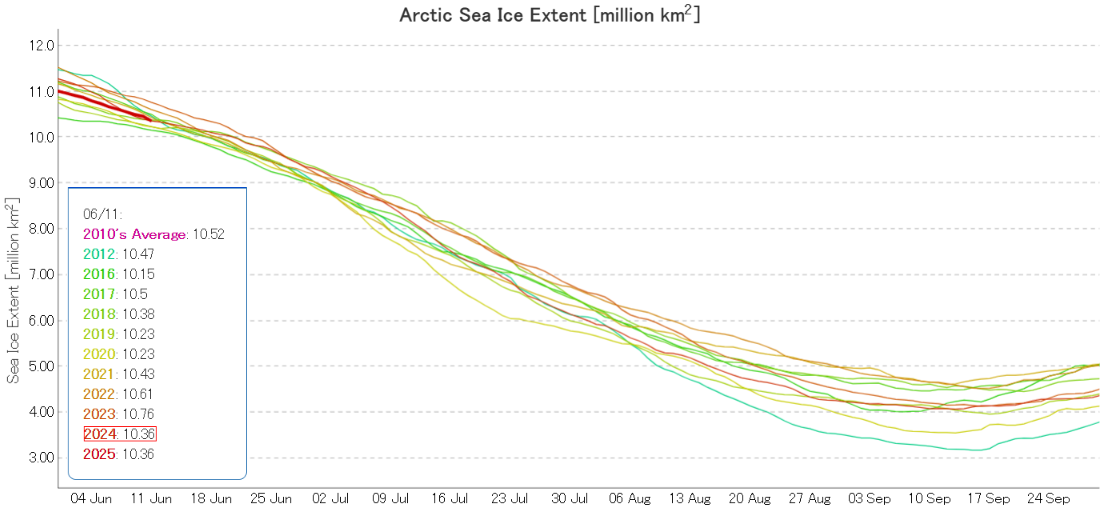
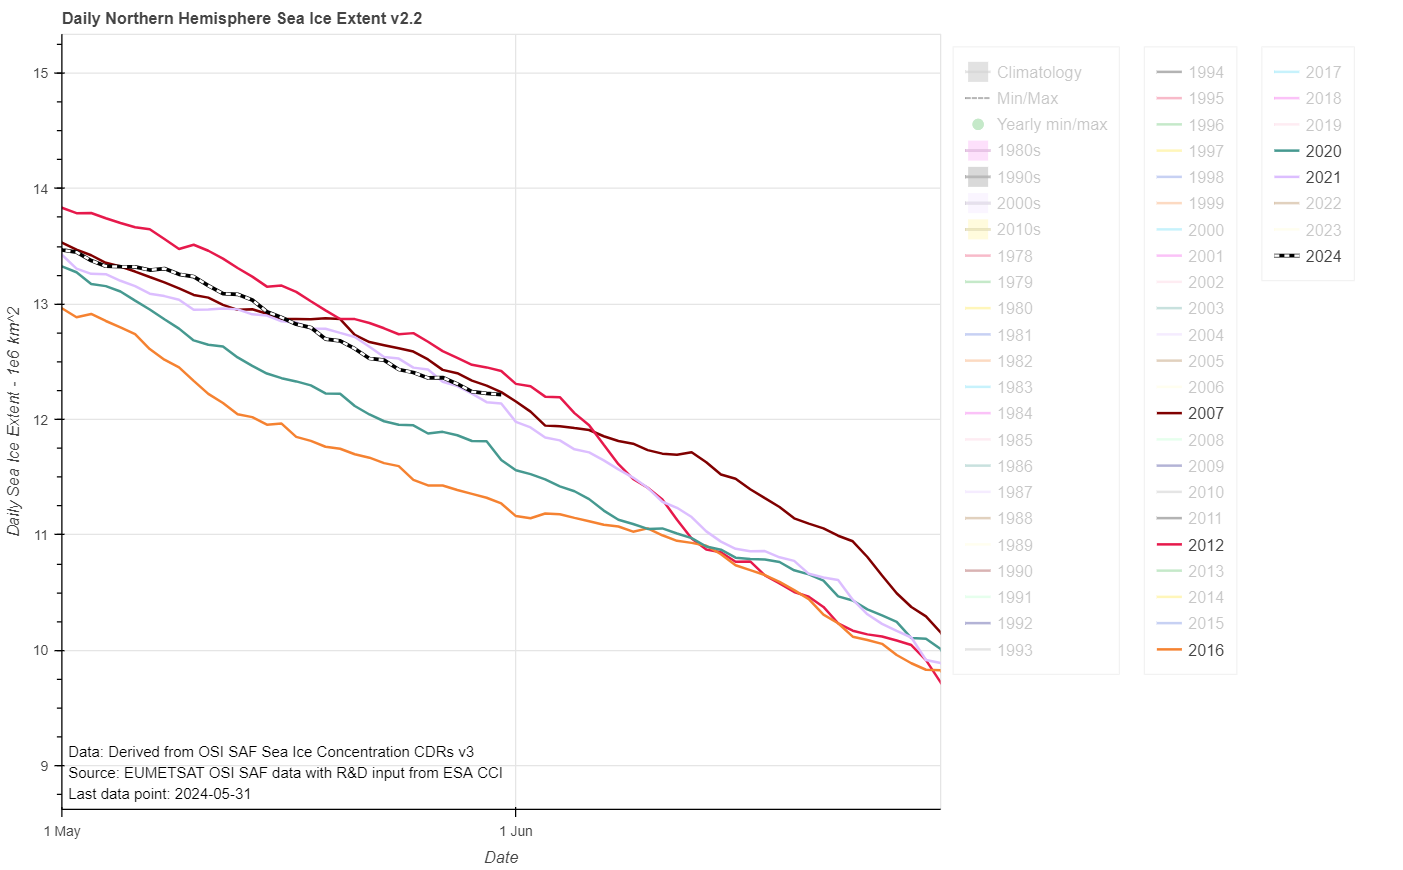
The JAXA/ViSHOP web site is currently down, so here is the current OSI SAF extent graph for the end of May:
2012’s “June cliff” is almost upon us, and if 2024’s current trajectory continues extent will cross above 2012 for the first time since February in a week or so.
By way of a change, which is allegedly as good as a rest, let’s start the new month with a very pretty and almost cloud free “pseudo-colour” image of the Lena Delta and adjacent areas of the Laptev Sea:
“False colour” image of the Lena Delta on June 1st from the MODIS instrument on the Aqua satellite
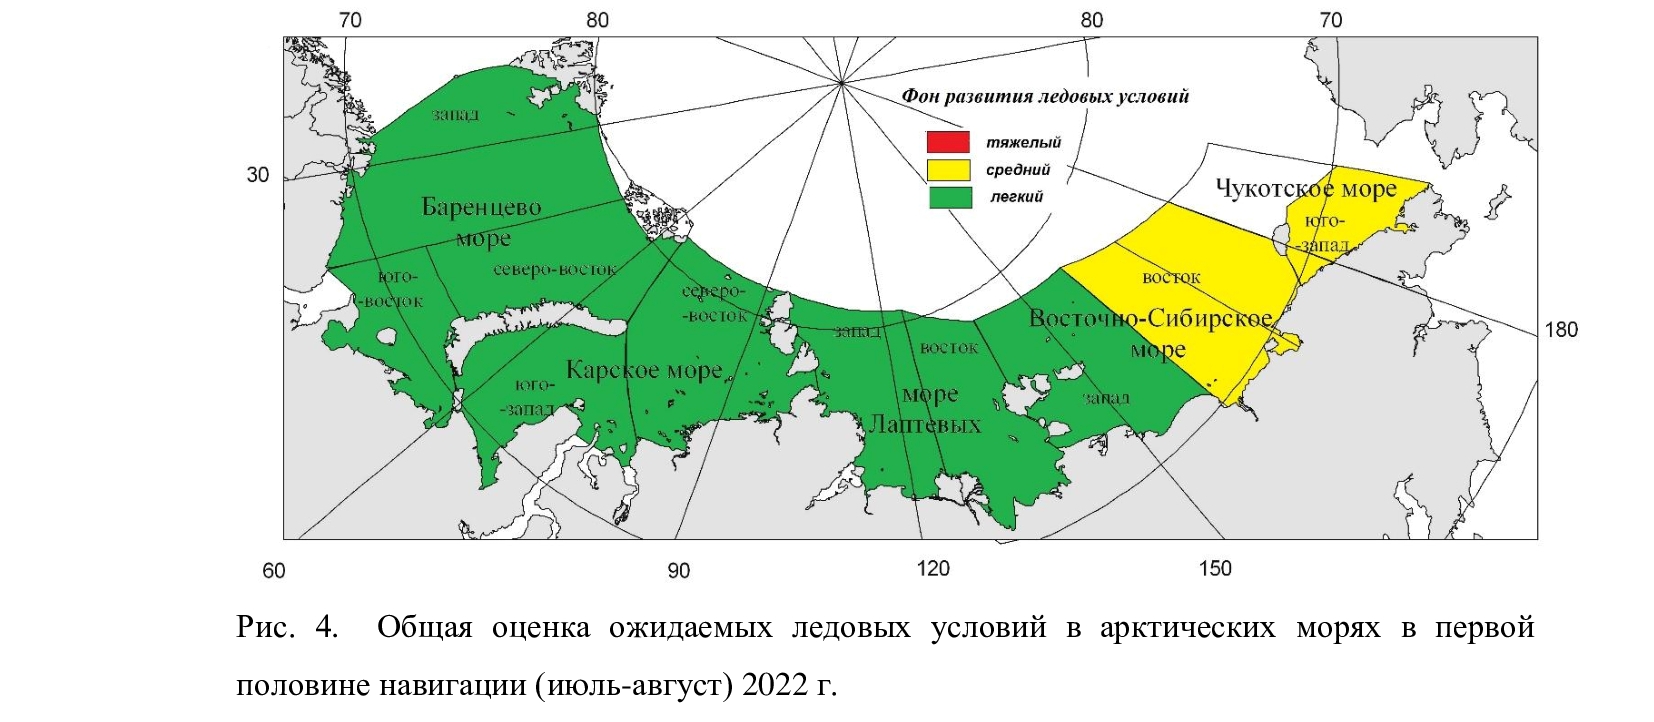
On June 17th the Northern Sea Route Administration published the Arctic and Antarctic Research Institute forecast of ice conditions for June to August 2022. Here’s the summary:
“Favorable” conditions in most areas, but “average” in the eastern East Siberian Sea and south west Chukchi Sea.
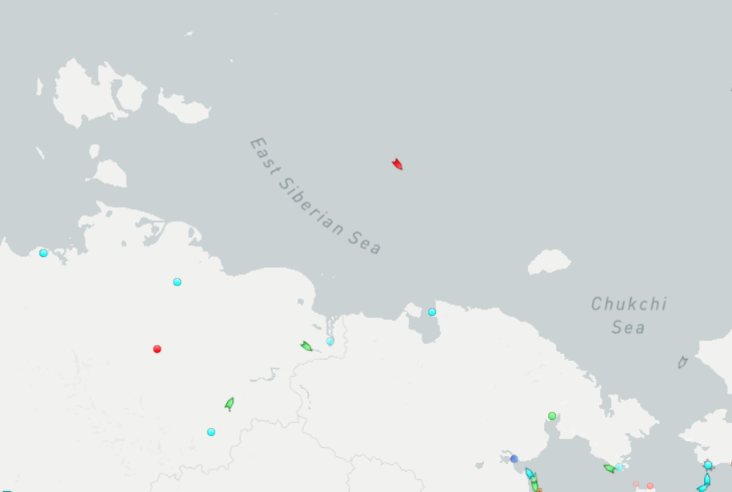
Traffic along the main Northern Sea Route has already begun. Marine Traffic reveals that the liquified natural gas carrier Nikolay Yevgenov is heading for the Bering Strait and has already sailed north of the New Siberian Islands. He is now entering the “average” ice area in the eastern ESS:
Meanwhile the recently commissioned nuclear powered icebreaker Sibir is patiently waiting in the Vilkitsky Strait:
The Northern Sea Route is evidently already “open” for ice hardened LNG tankers, but not yet for more conventional vessels. Here is the current AMSR2 sea ice concentration map:
This website uses cookies to improve your experience. We'll assume you're ok with this, but you can opt-out if you wish. Cookie settingsACCEPT
Privacy & Cookies Policy
Privacy Overview
This website uses cookies to improve your experience while you navigate through the website. Out of these, the cookies that are categorized as necessary are stored on your browser as they are essential for the working of basic functionalities of the website. We also use third-party cookies that help us analyze and understand how you use this website. These cookies will be stored in your browser only with your consent. You also have the option to opt-out of these cookies. But opting out of some of these cookies may affect your browsing experience.
Necessary cookies are absolutely essential for the website to function properly. This category only includes cookies that ensures basic functionalities and security features of the website. These cookies do not store any personal information.
Any cookies that may not be particularly necessary for the website to function and is used specifically to collect user personal data via analytics, ads, other embedded contents are termed as non-necessary cookies. It is mandatory to procure user consent prior to running these cookies on your website.