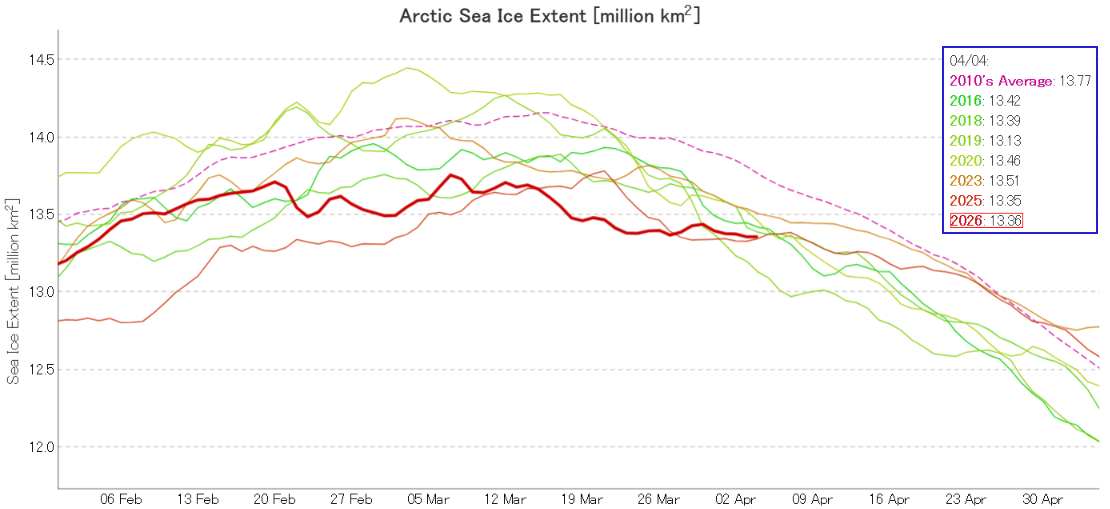
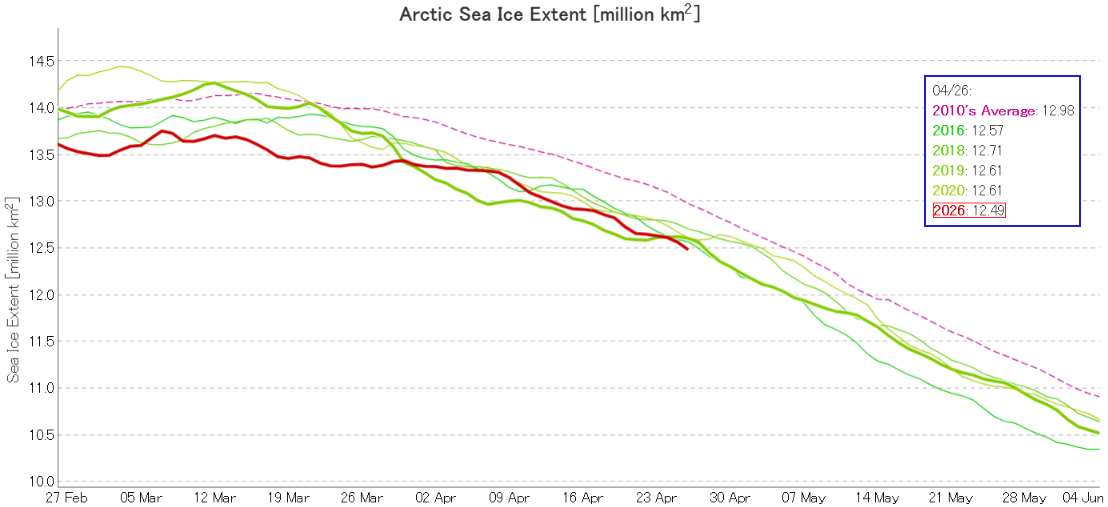
In early April JAXA Arctic sea ice extent is 3rd lowest for the date, albeit in a “statistical tie” with last year:
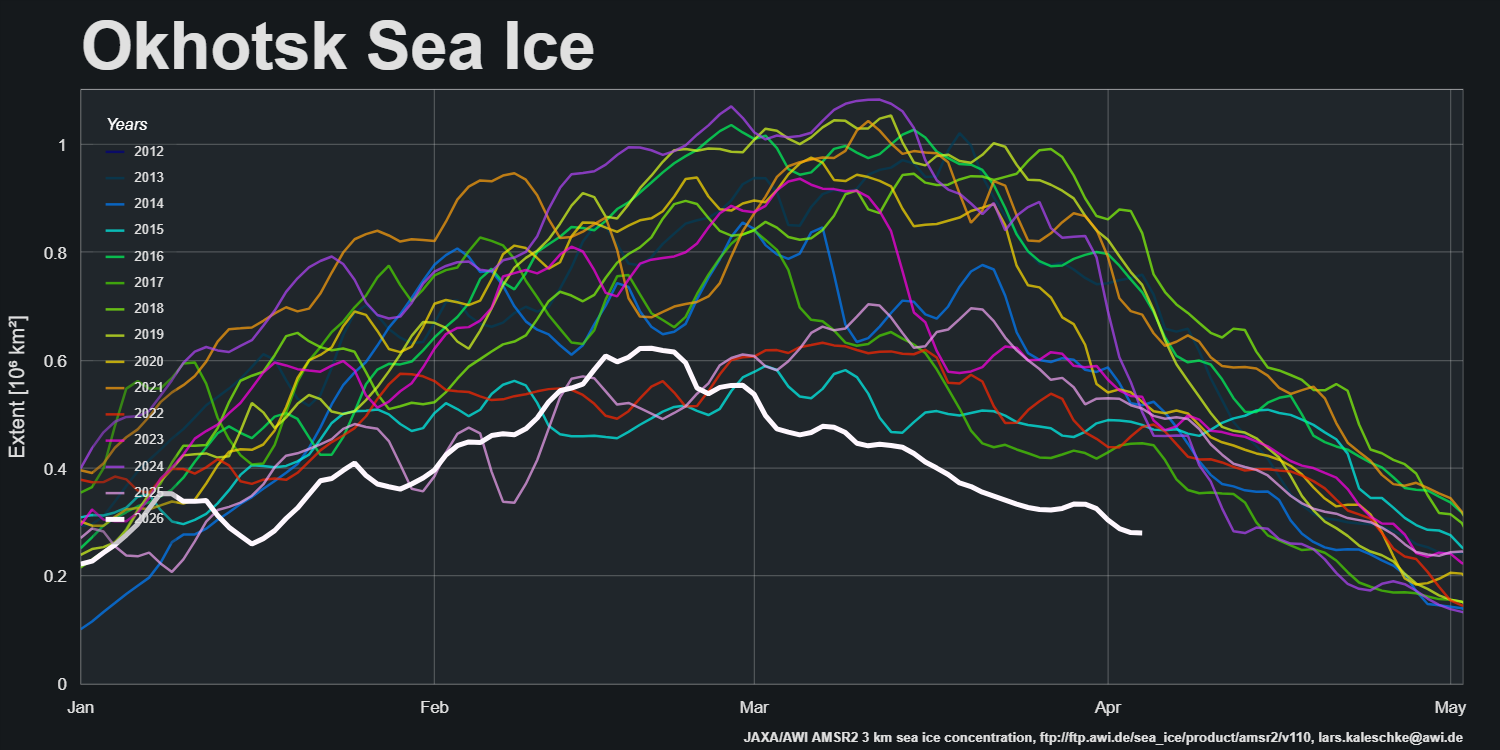
The Alfred Wegener Institute’s regional extent graphs reveal an intriguing divergence on the Pacific periphery, where sea ice extent in the Sea of Okhotsk is at an all time low for the date in the AMSR2 record:
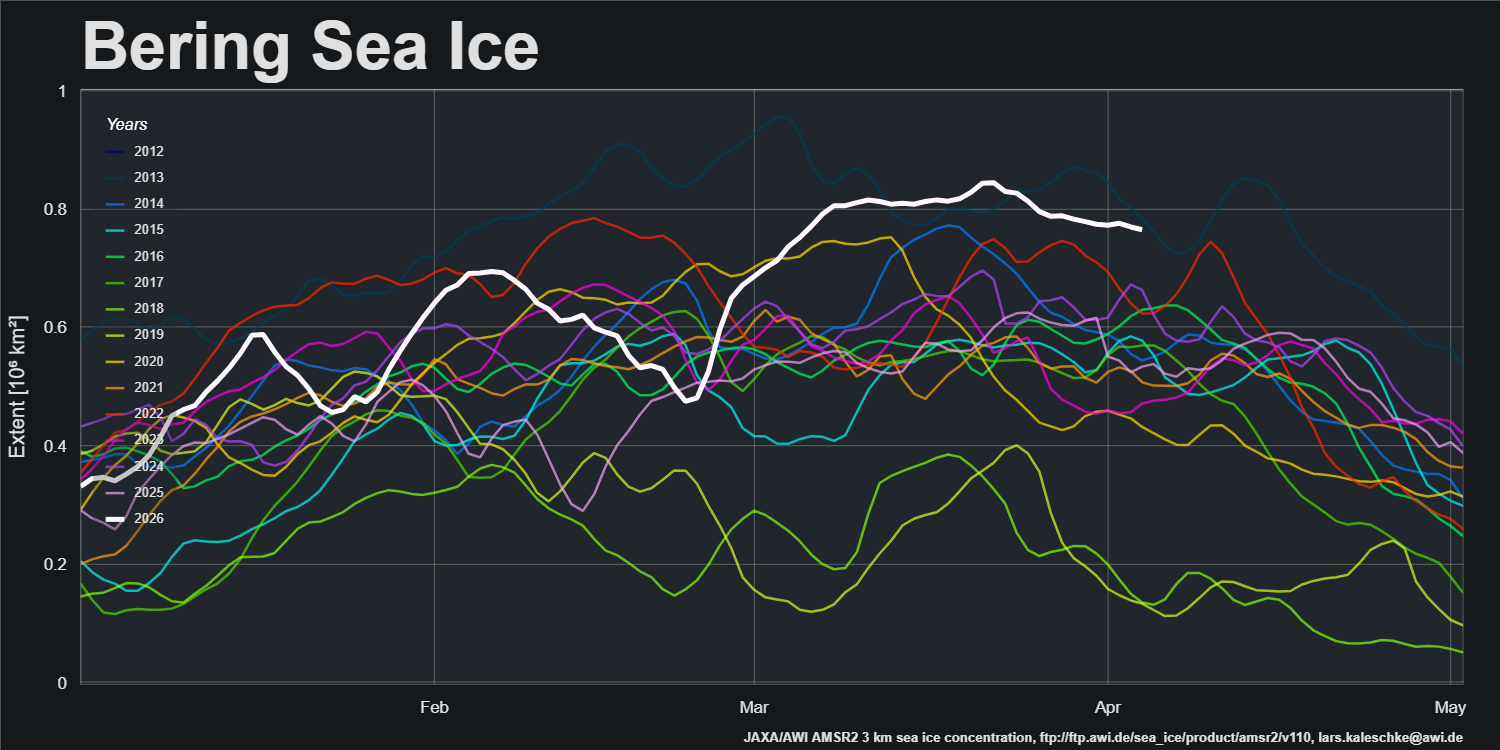
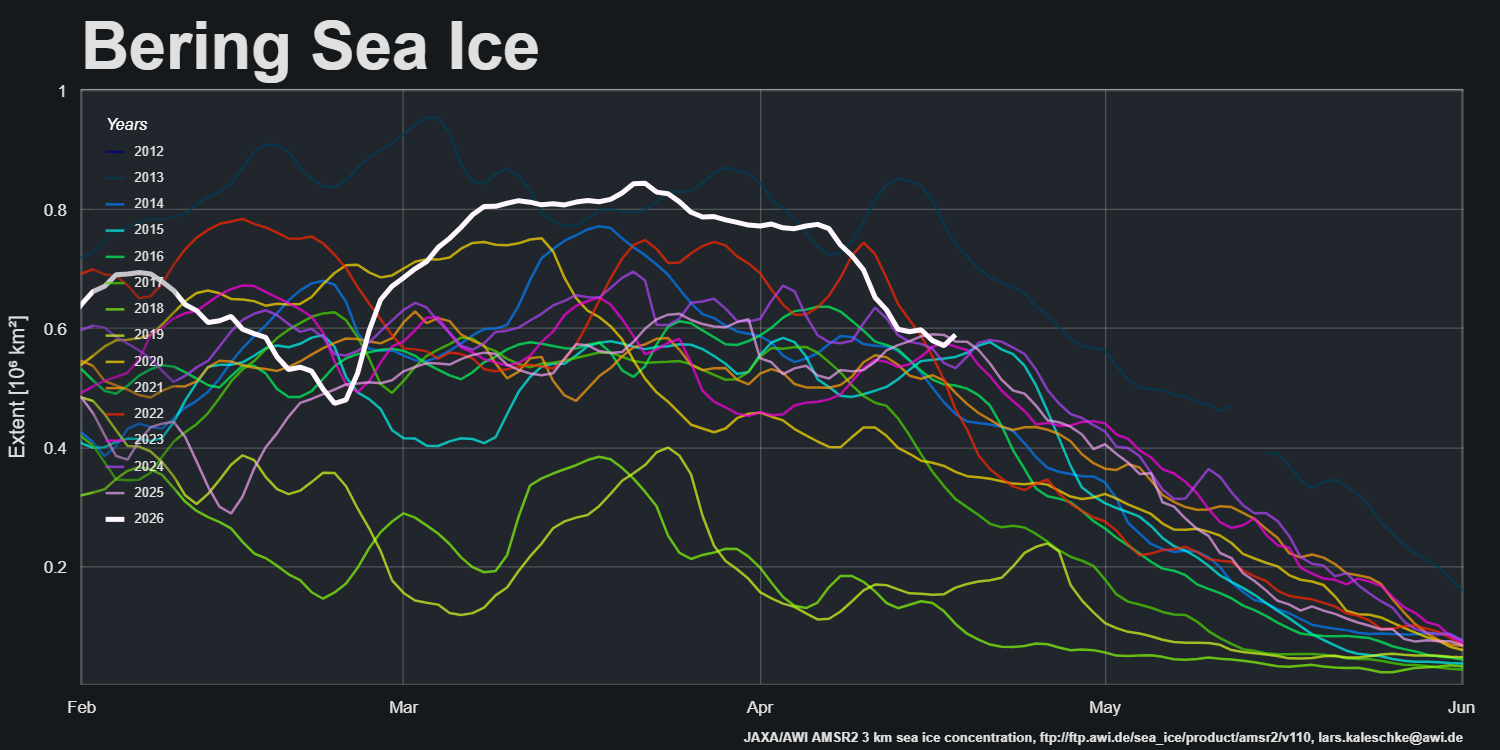
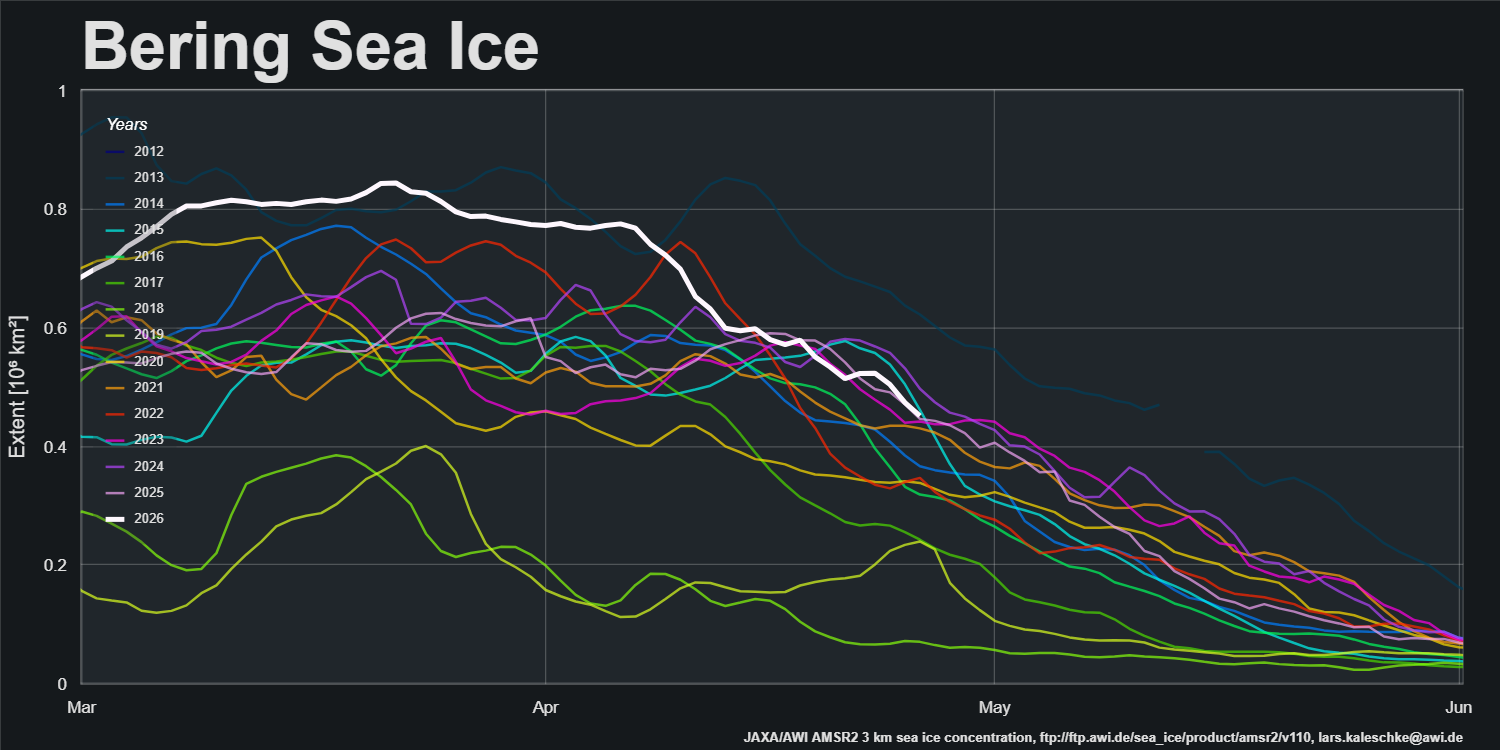
On the other hand extent in the Bering Sea is close to an all time high:
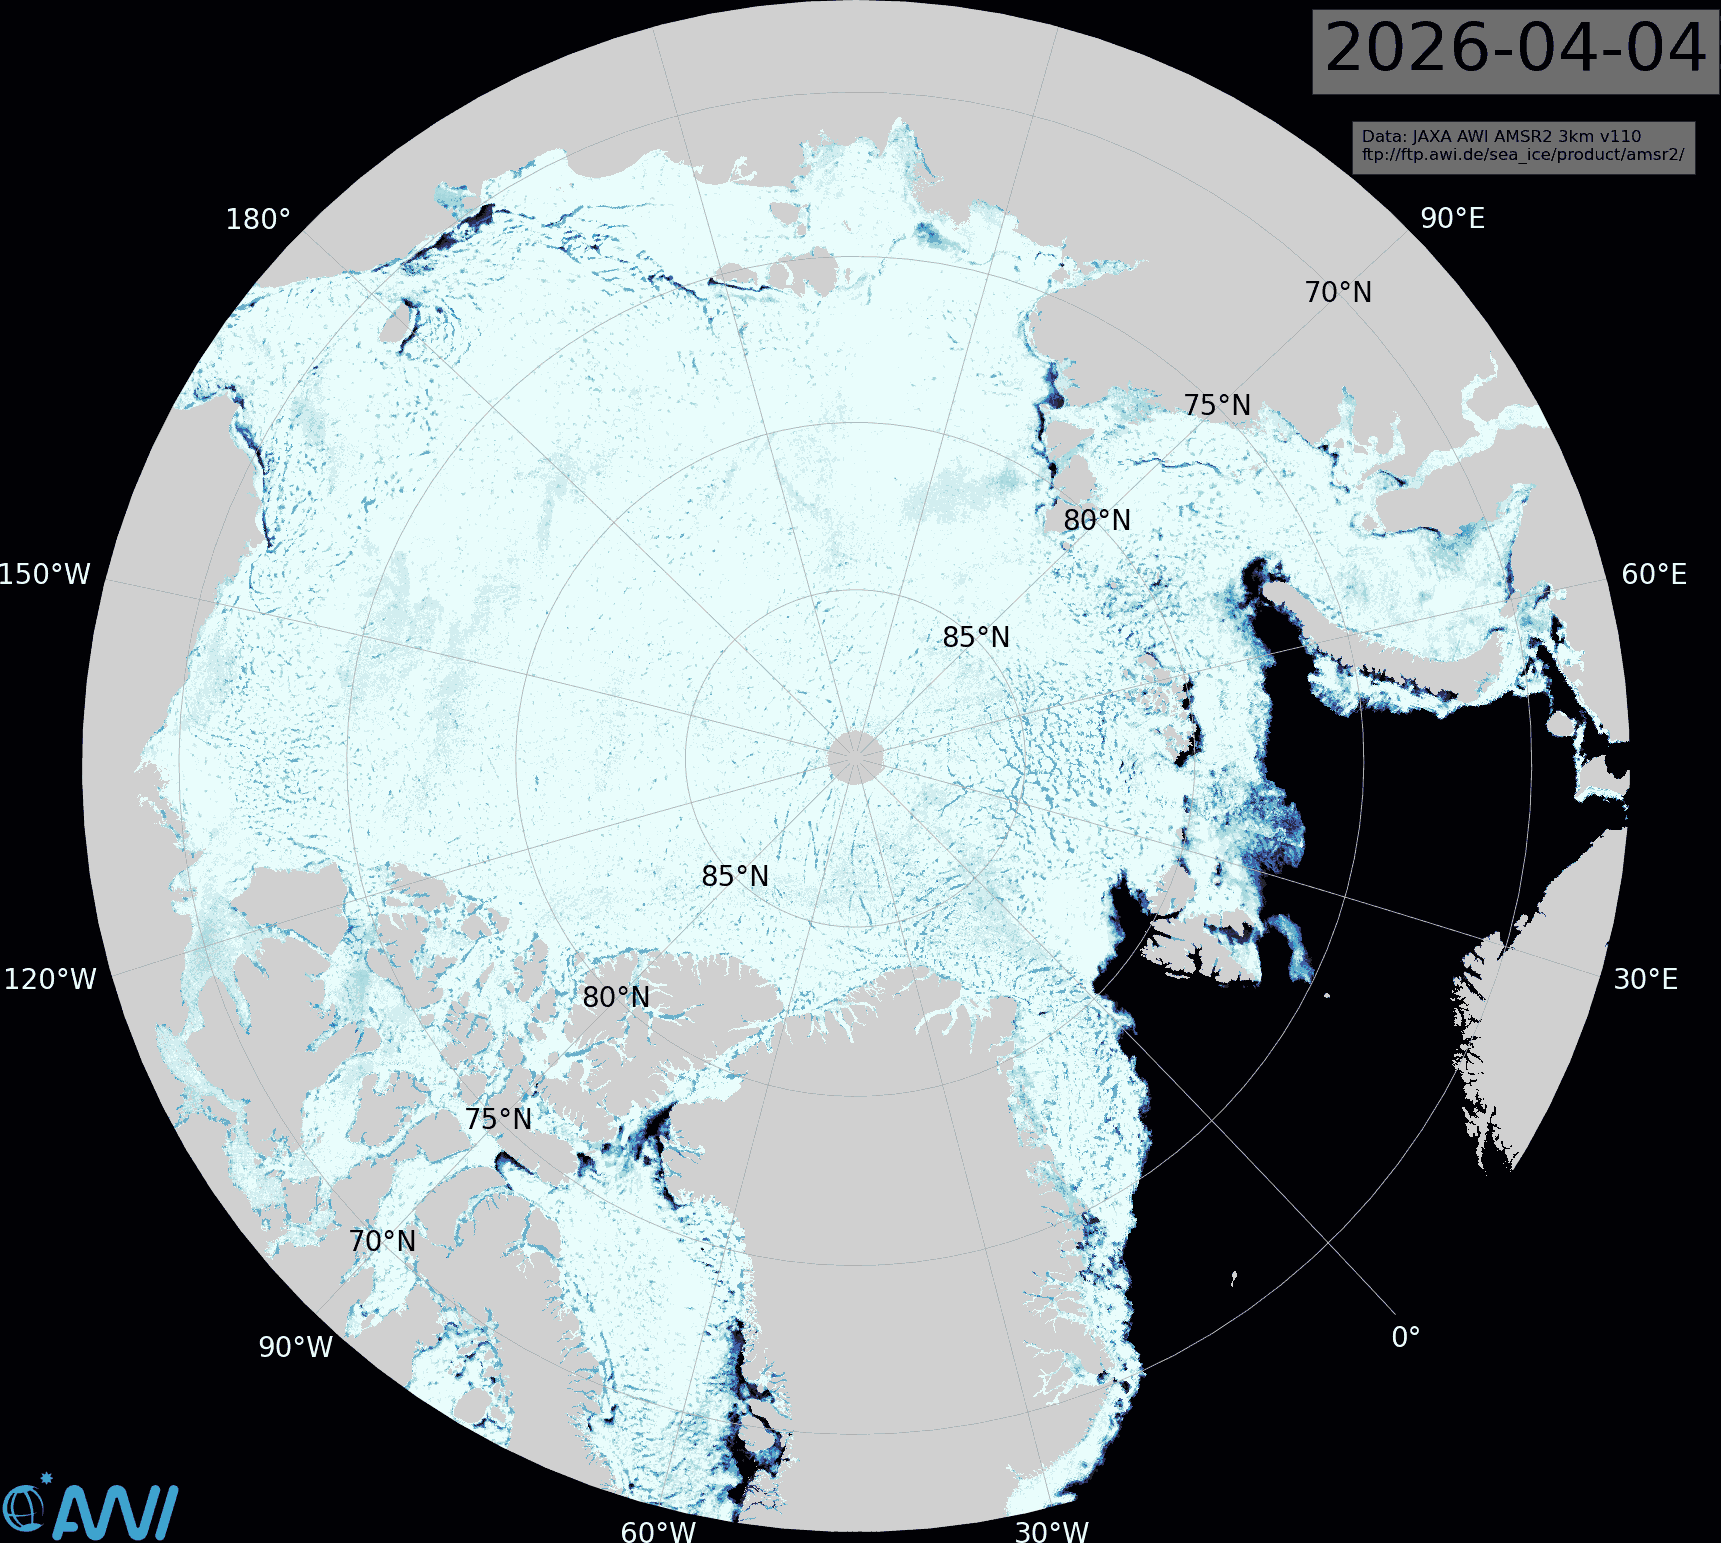
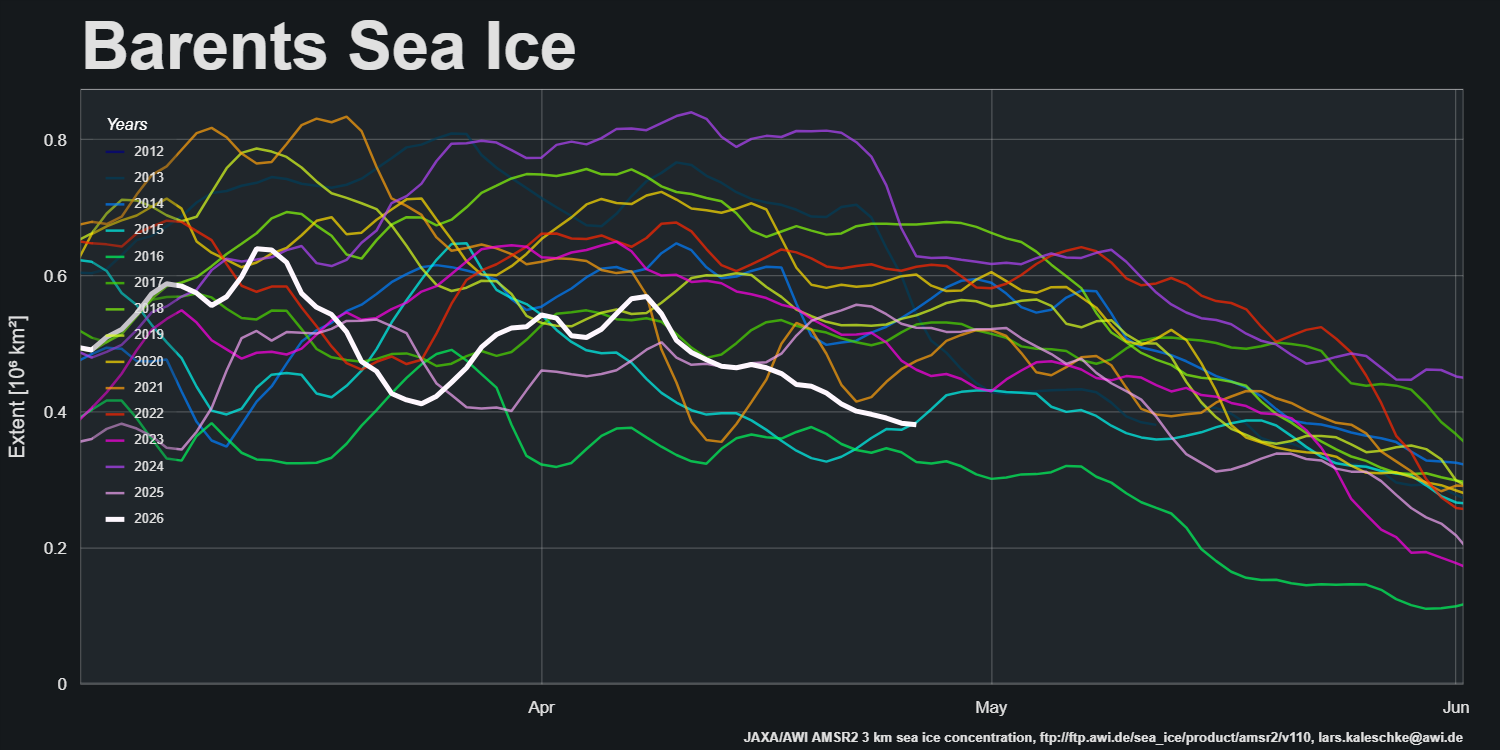
On the Atlantic periphery extent is less extreme, although there is currently open water north of Svalbard:
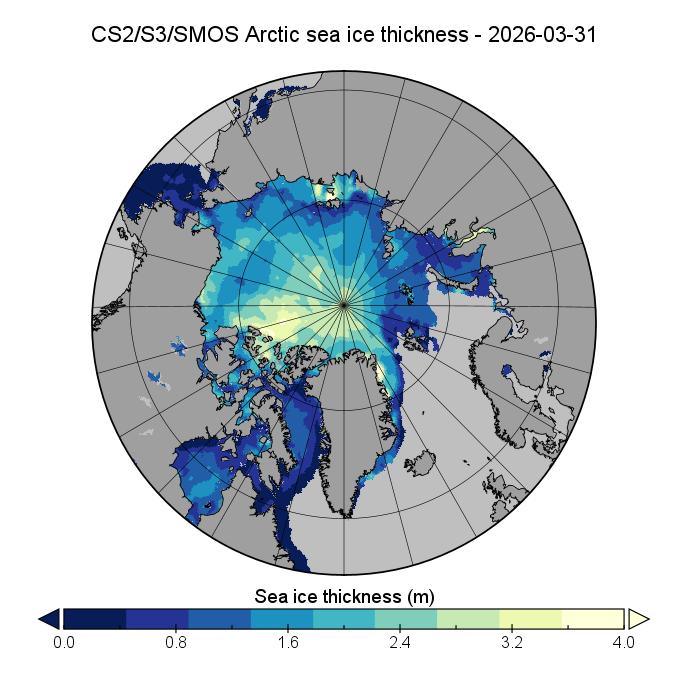
Looking at the third dimension, here is the AWI’s CryoSat-2/Sentinel 3/SMOS Arctic sea ice thickness map at the end of March:
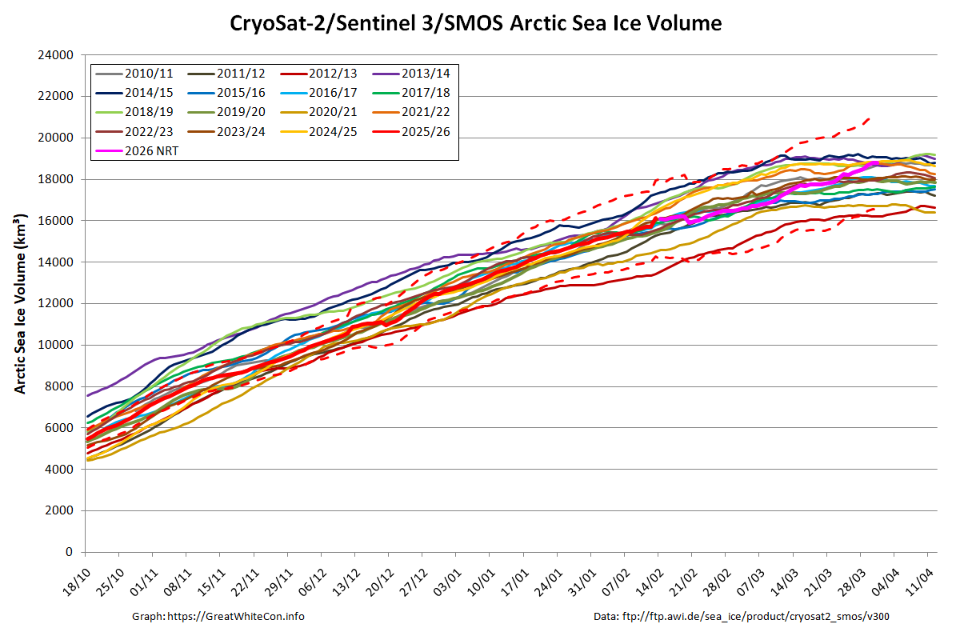
Here too is the associated volume graph:
Note that thickness and hence volume is likely to be biased high on the Atlantic side of the Arctic due to continuous radio frequency interference affecting SMOS data:
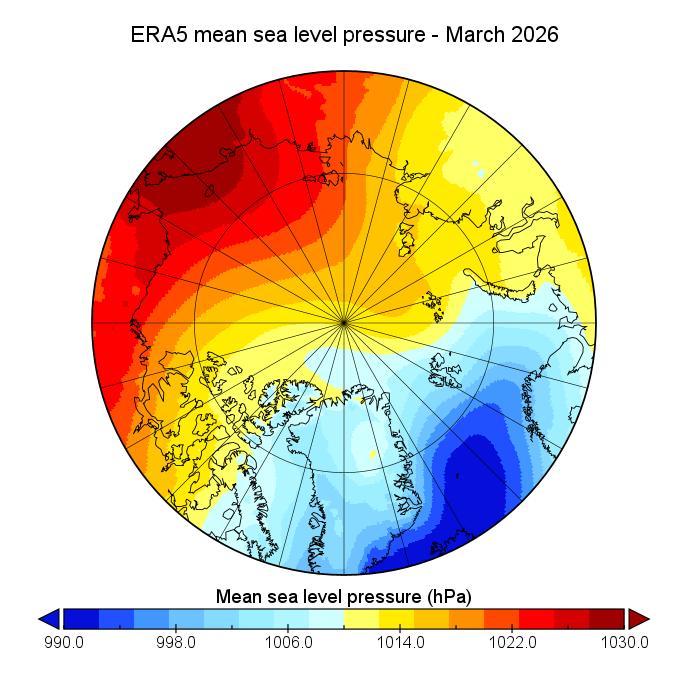
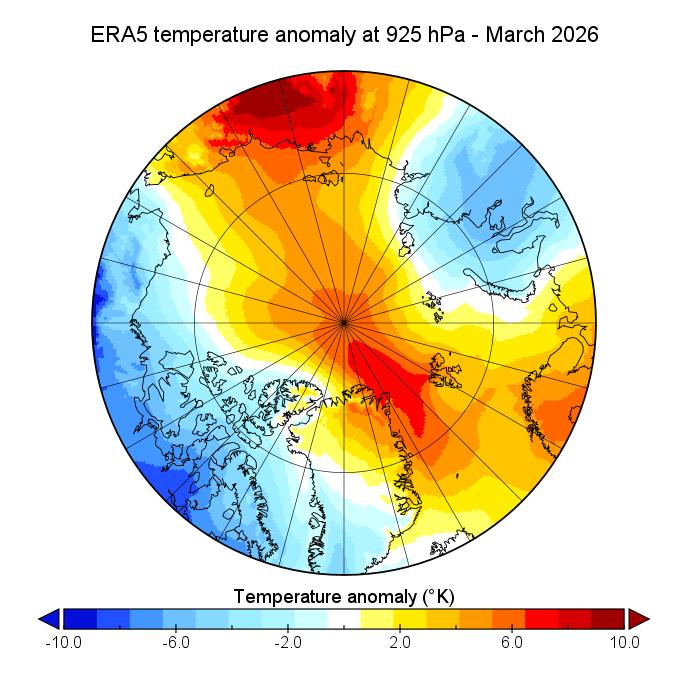
Here’s our NSIDC replacement service, summarising atmospheric conditions over the Arctic during March 2026:
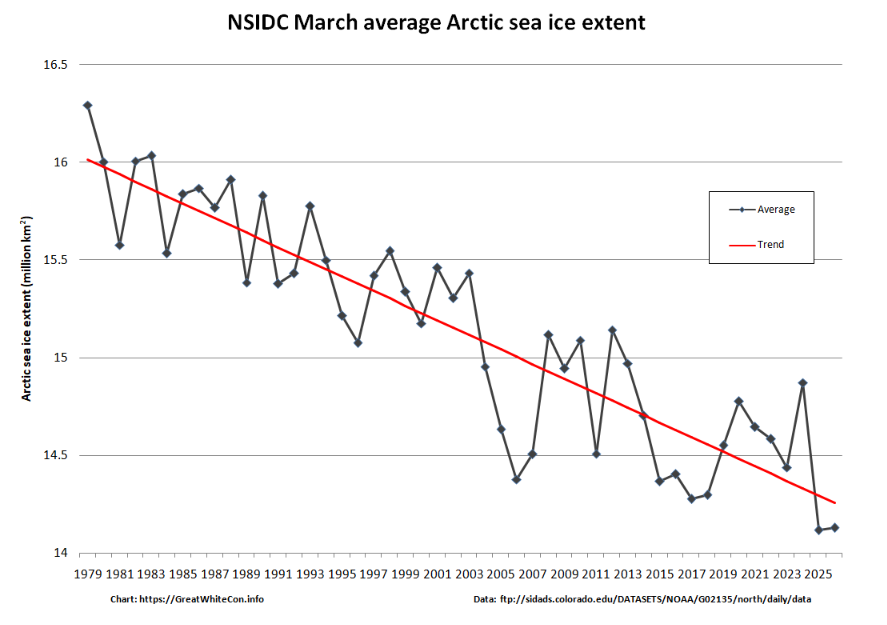
The NSIDC monthly average extent graph for March shows 2026 slightly above last year’s record low:
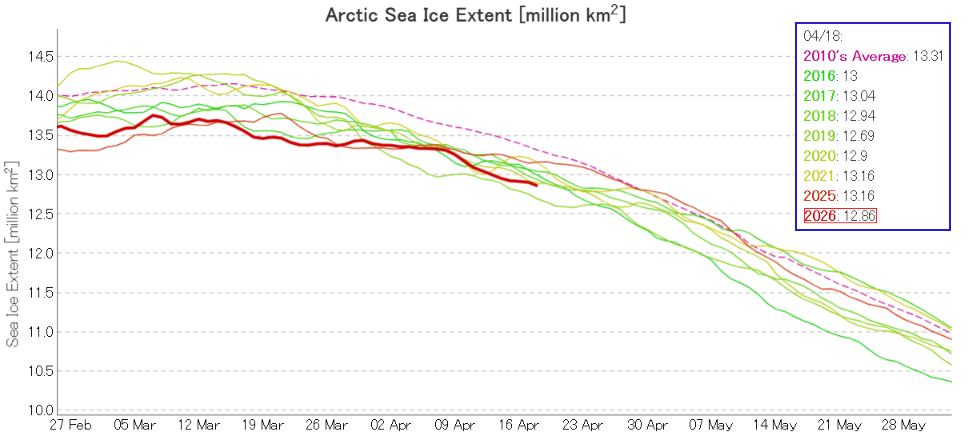
In mid April JAXA extent is second lowest for the date:
After a recent rapid decline Bering Sea extent has stabilised:
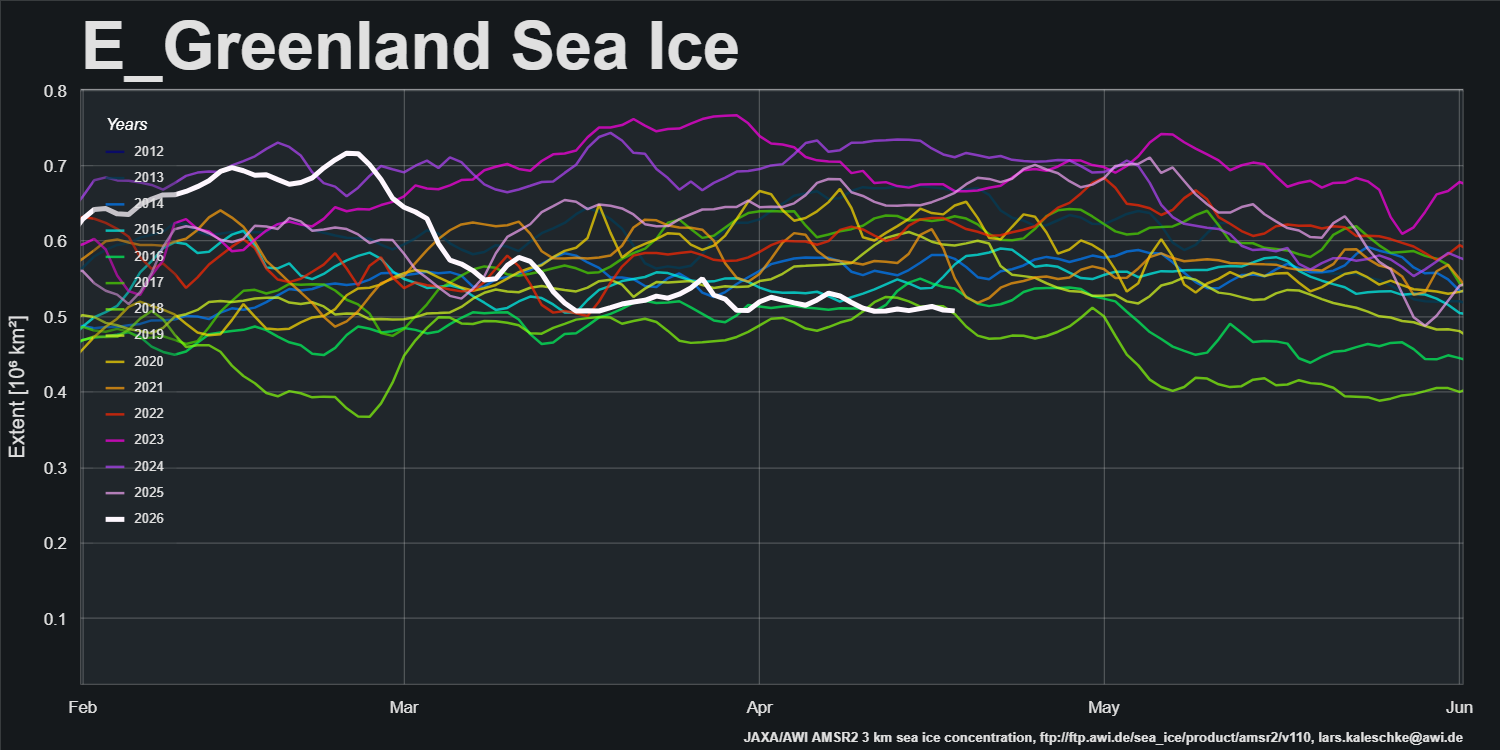
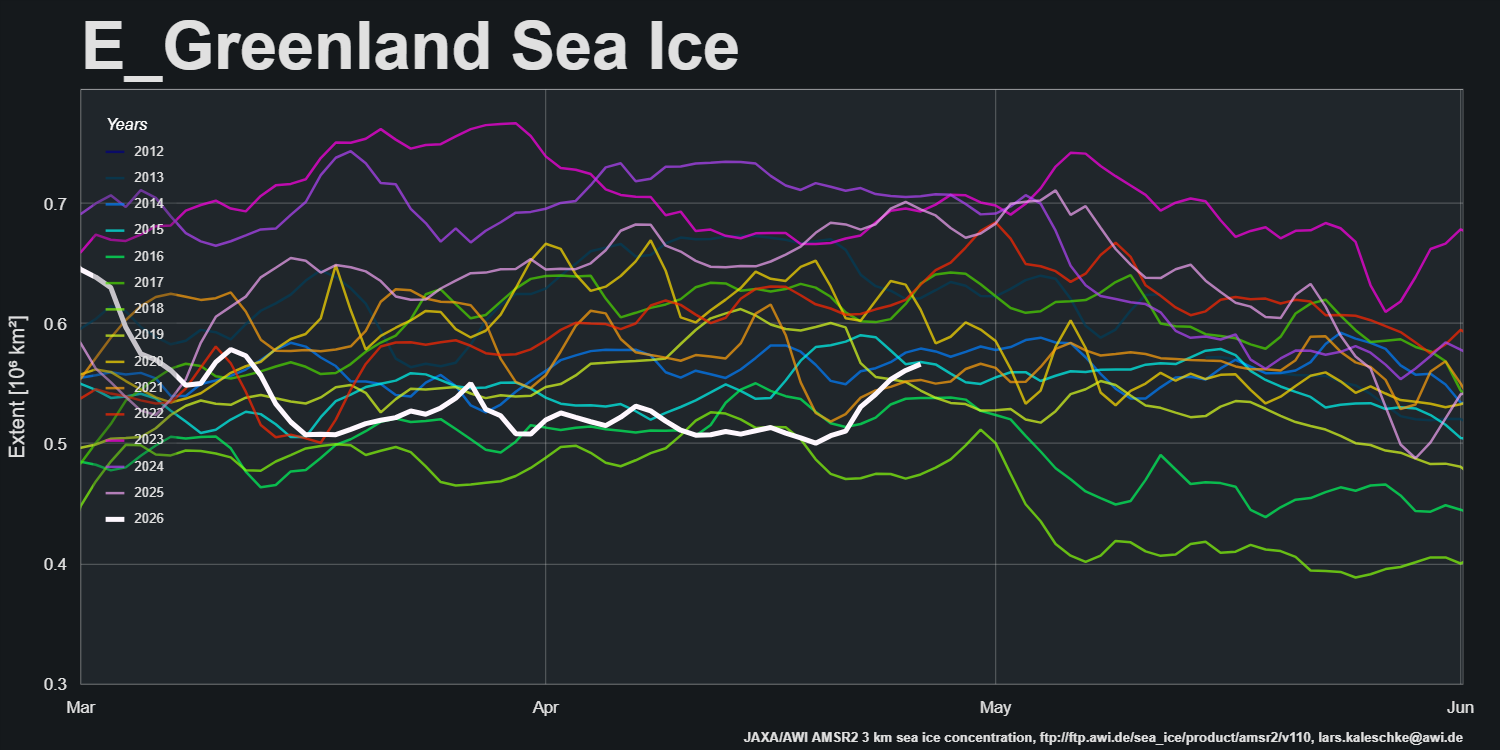
On the opposite side of the Arctic, extent in the East Greenland Sea is in a “statistical tie” for lowest for the date:
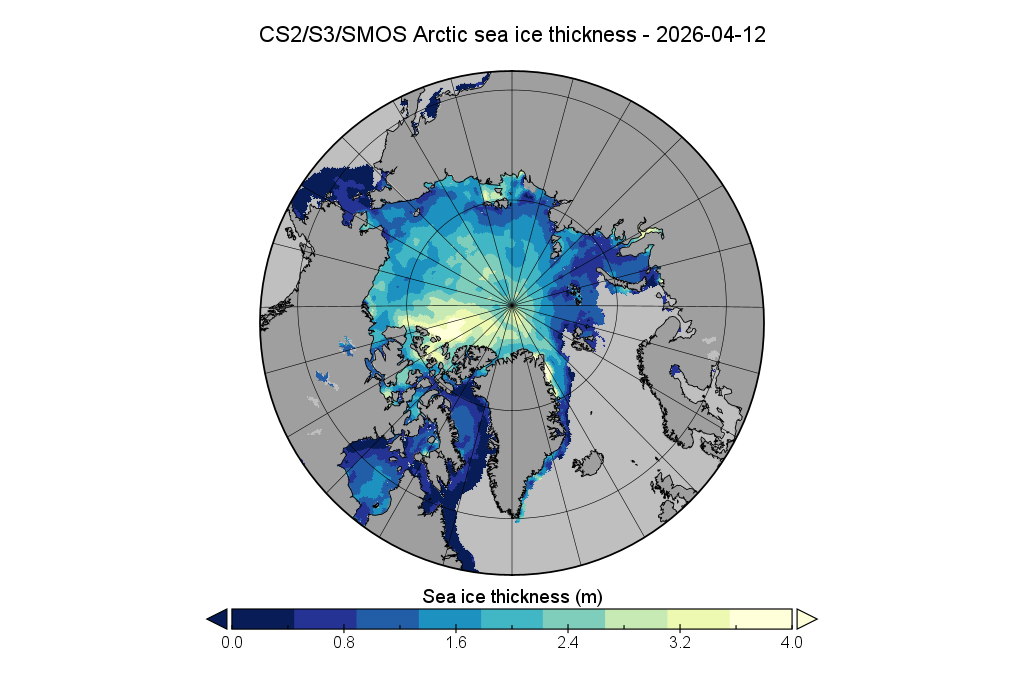
Here’s the final “near real time” CryoSat-2/Sentinel 3/SMOS Arctic sea ice thickness map for the spring of 2026:
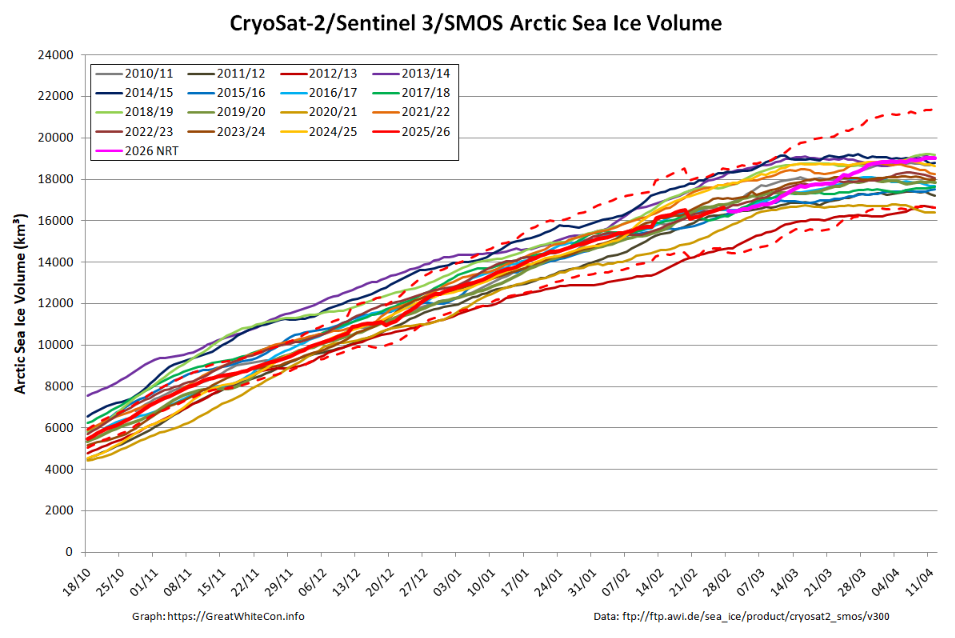
Here too is the associated volume graph:
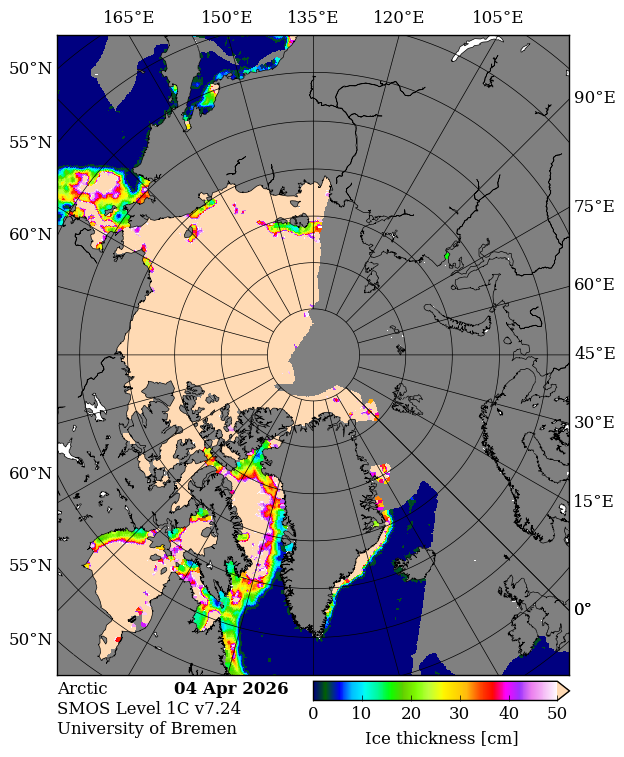
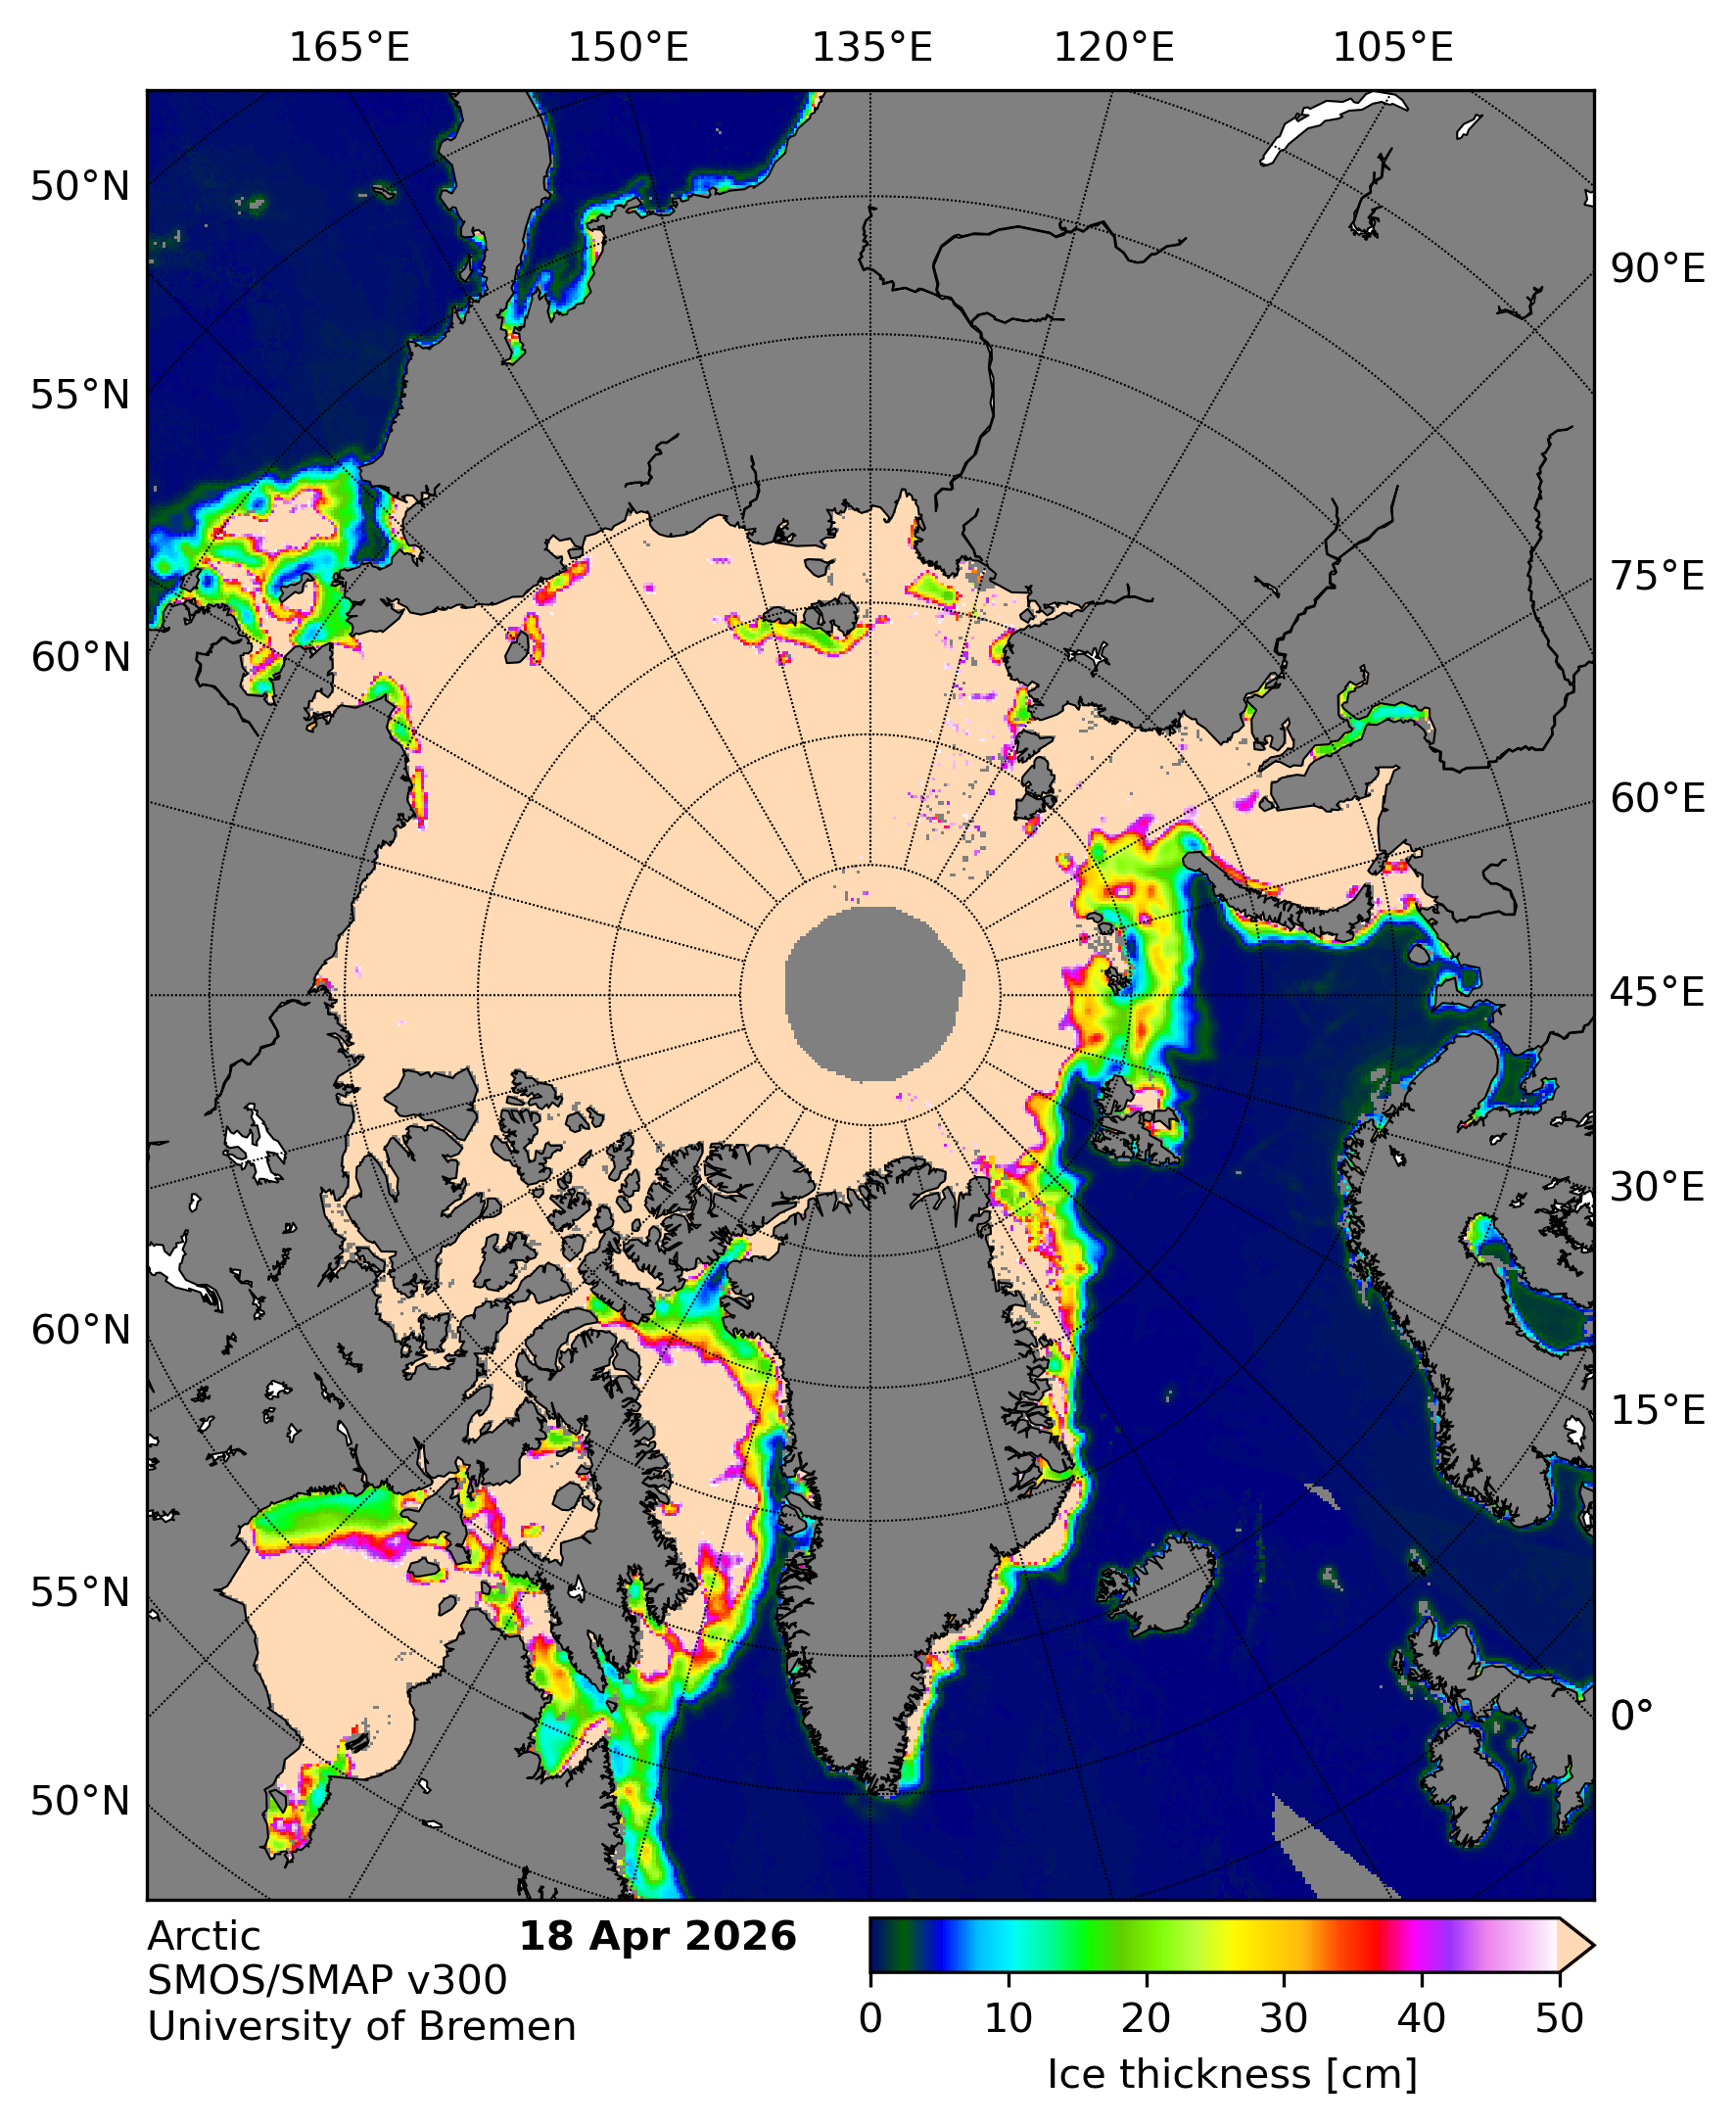
and the latest SMOS/SMAP “thin ice thickness” map:
With the benefit of an 80k drop yesterday, JAXA extent has opened up a significant gap over 2016 in the “lowest for the date” race:
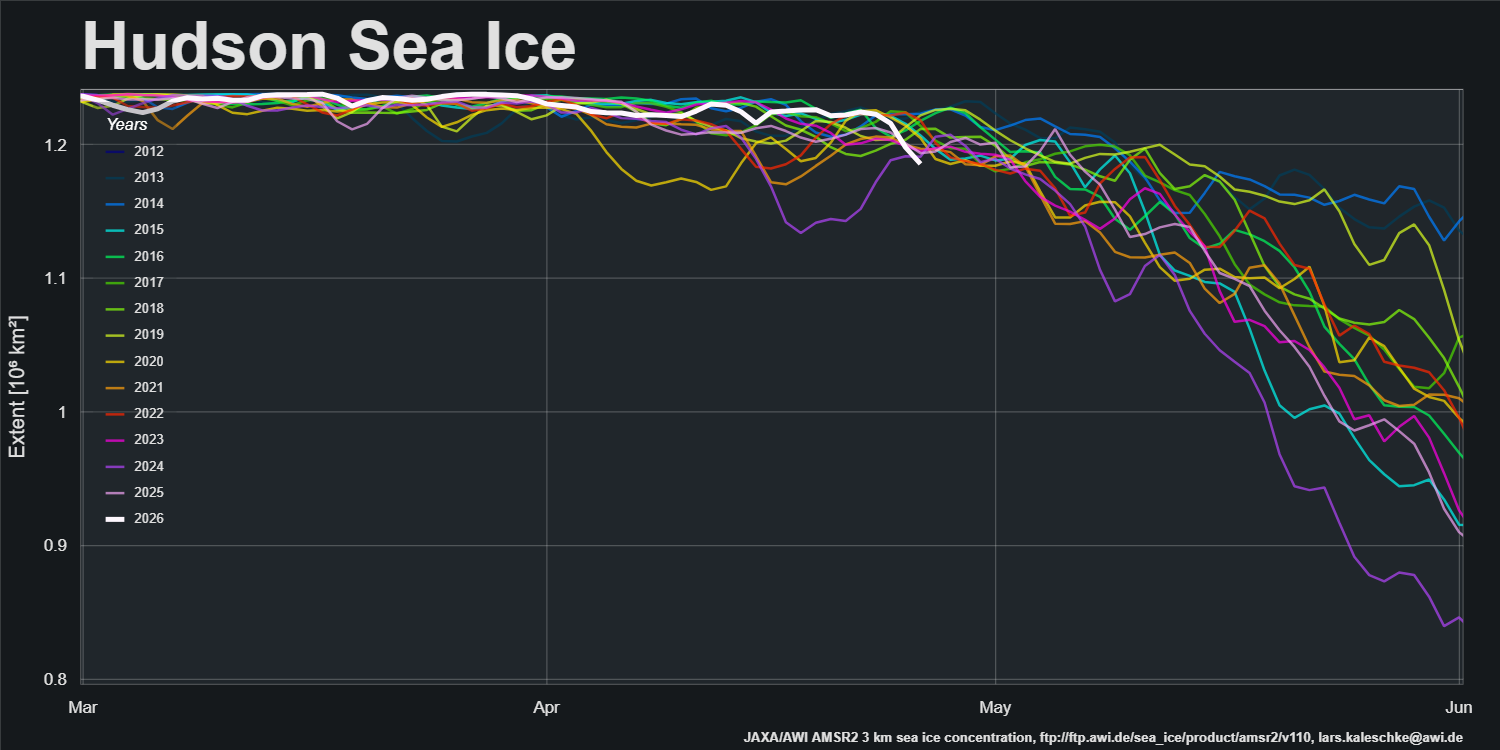
On the Pacific periphery Bering Sea extent is falling quickly once again. On the Atlantic side extent is near all time lows for the date in the the Barents Sea, although extent is increasing east of Greenland. Melt has begun in Hudson Bay, where extent is currently lowest for the date in the AMSR2 era:
The conversation continues over on the May open thread.
(Using CryoSat daily volume deltas to estimate current month Piomas)
Seems like we’re back on track.
Jim, we’re now back at that sweet #1 for low sea ice extent per JAXA.
Meanwhile, on the opposite side of the Planet, we’ve 7th lowest sea ice, which is a first & lowest position this year.
Our old ‘anonymous’ friend Sam Carana thinks there’ll be new record lows and even BOEs for both Antarctica & the Arctic sea ice this year (or, I guess into Feb of next year for the South) at the minima. I’ve gone on record this week saying 2027-28 are more likely to than 2026, based on an El-Niño and delayed warming assessment.
(Using CryoSat daily volume deltas to estimate current month Piomas)