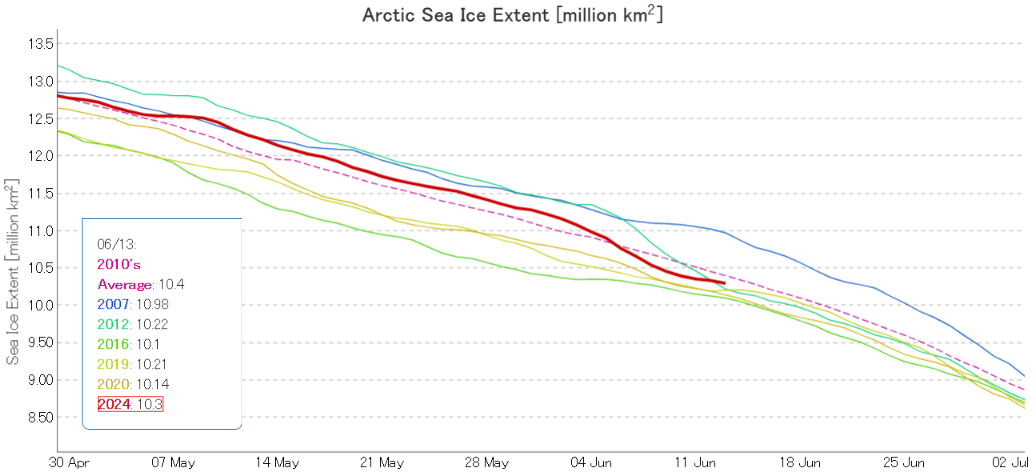
The JAXA/ViSHOP web site is currently down, so here is the current OSI SAF extent graph for the end of May:
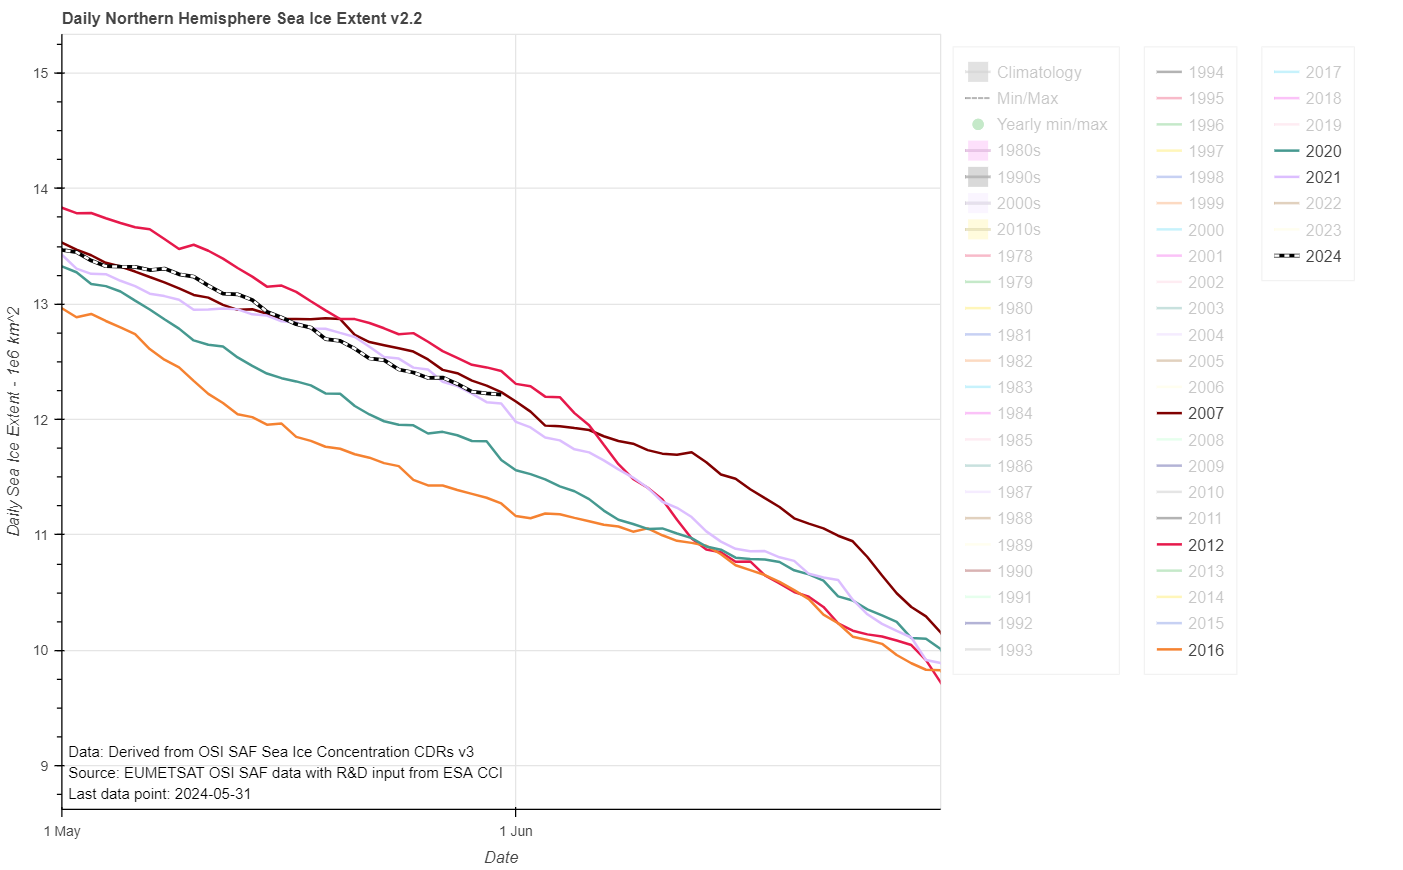
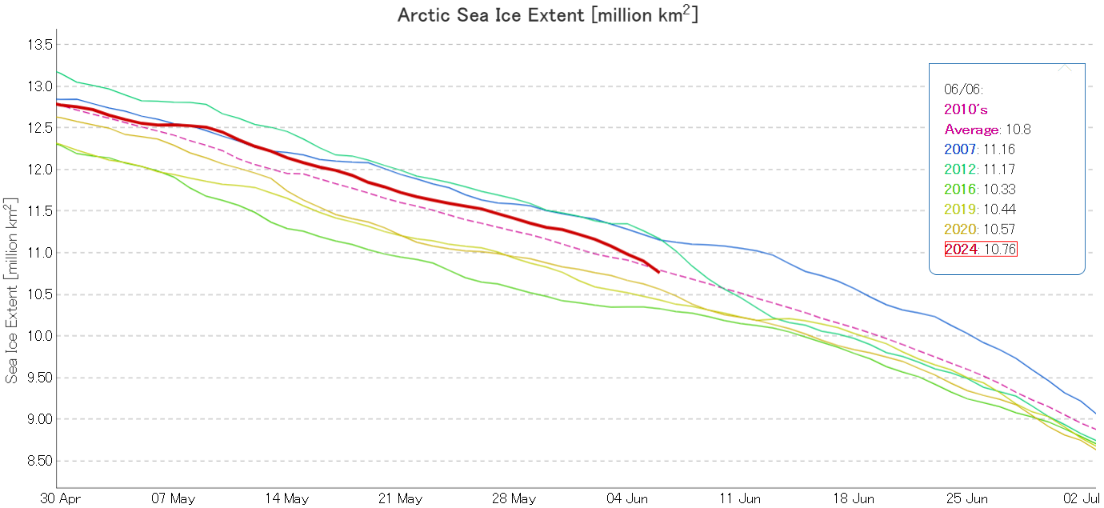
2012’s “June cliff” is almost upon us, and if 2024’s current trajectory continues extent will cross above 2012 for the first time since February in a week or so.
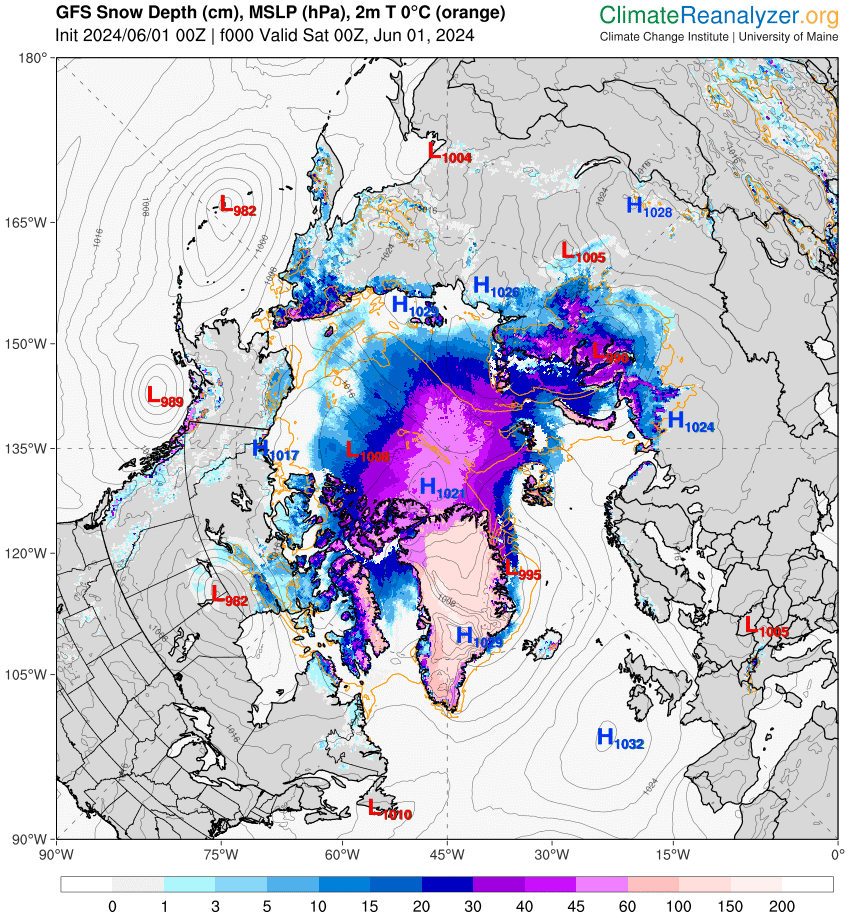
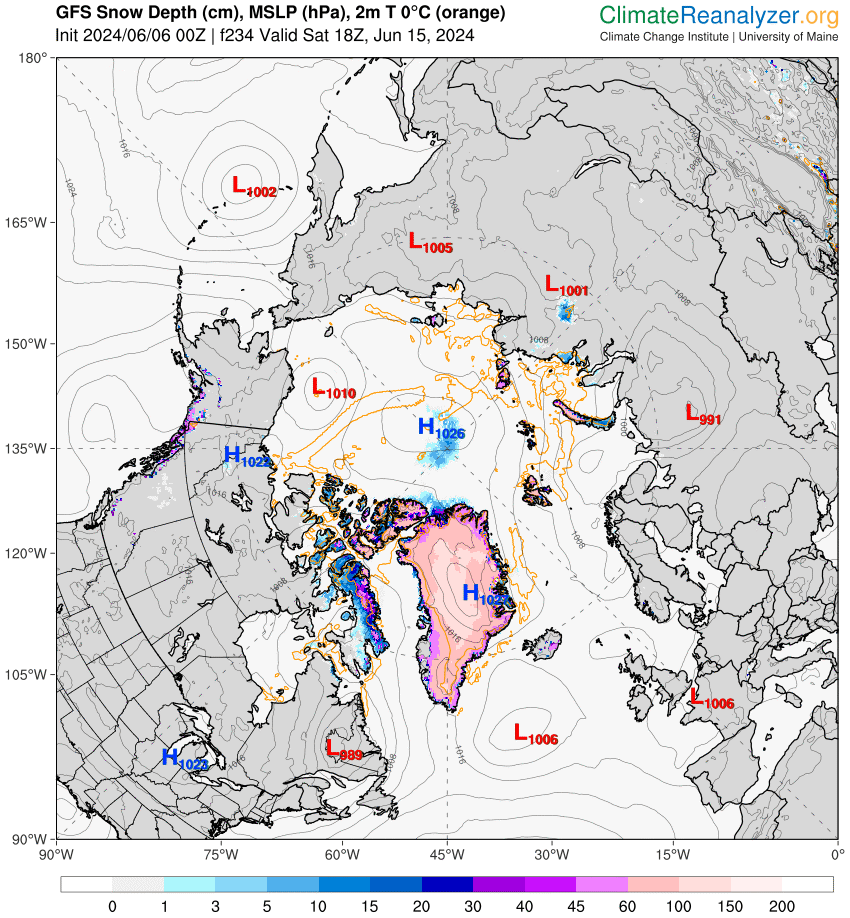
Here’s the GFS model’s current map of snow depth:
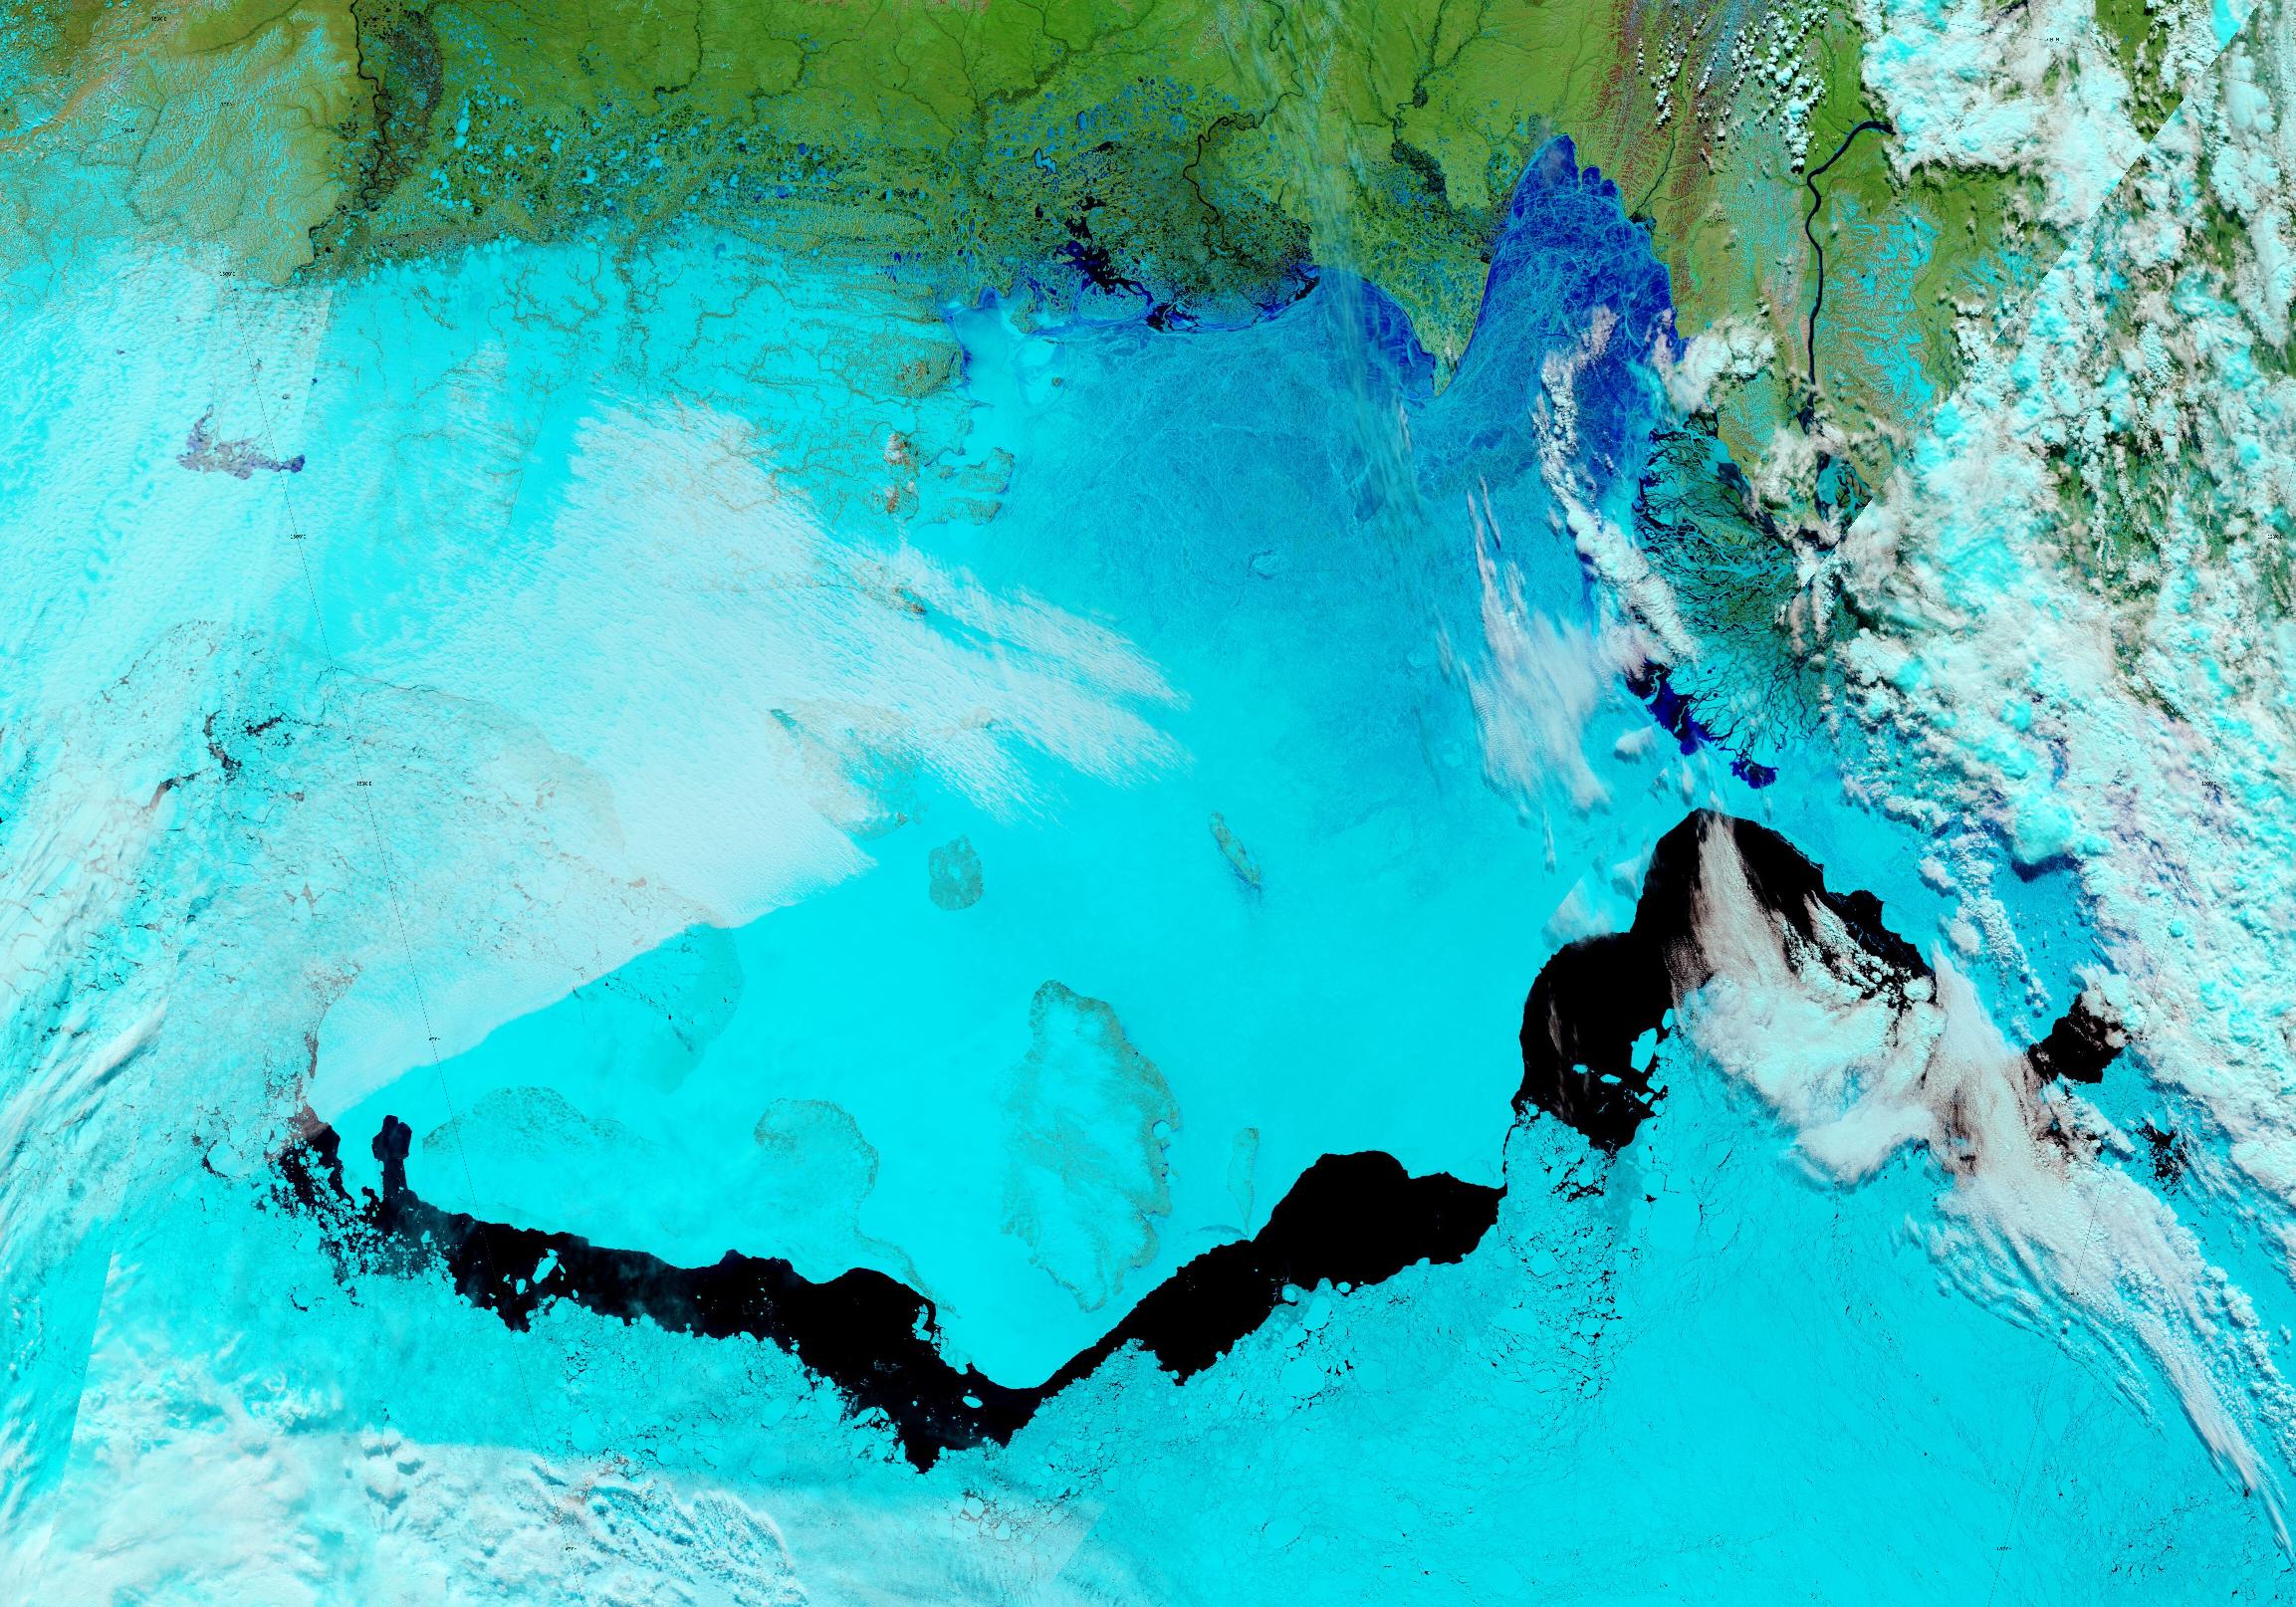
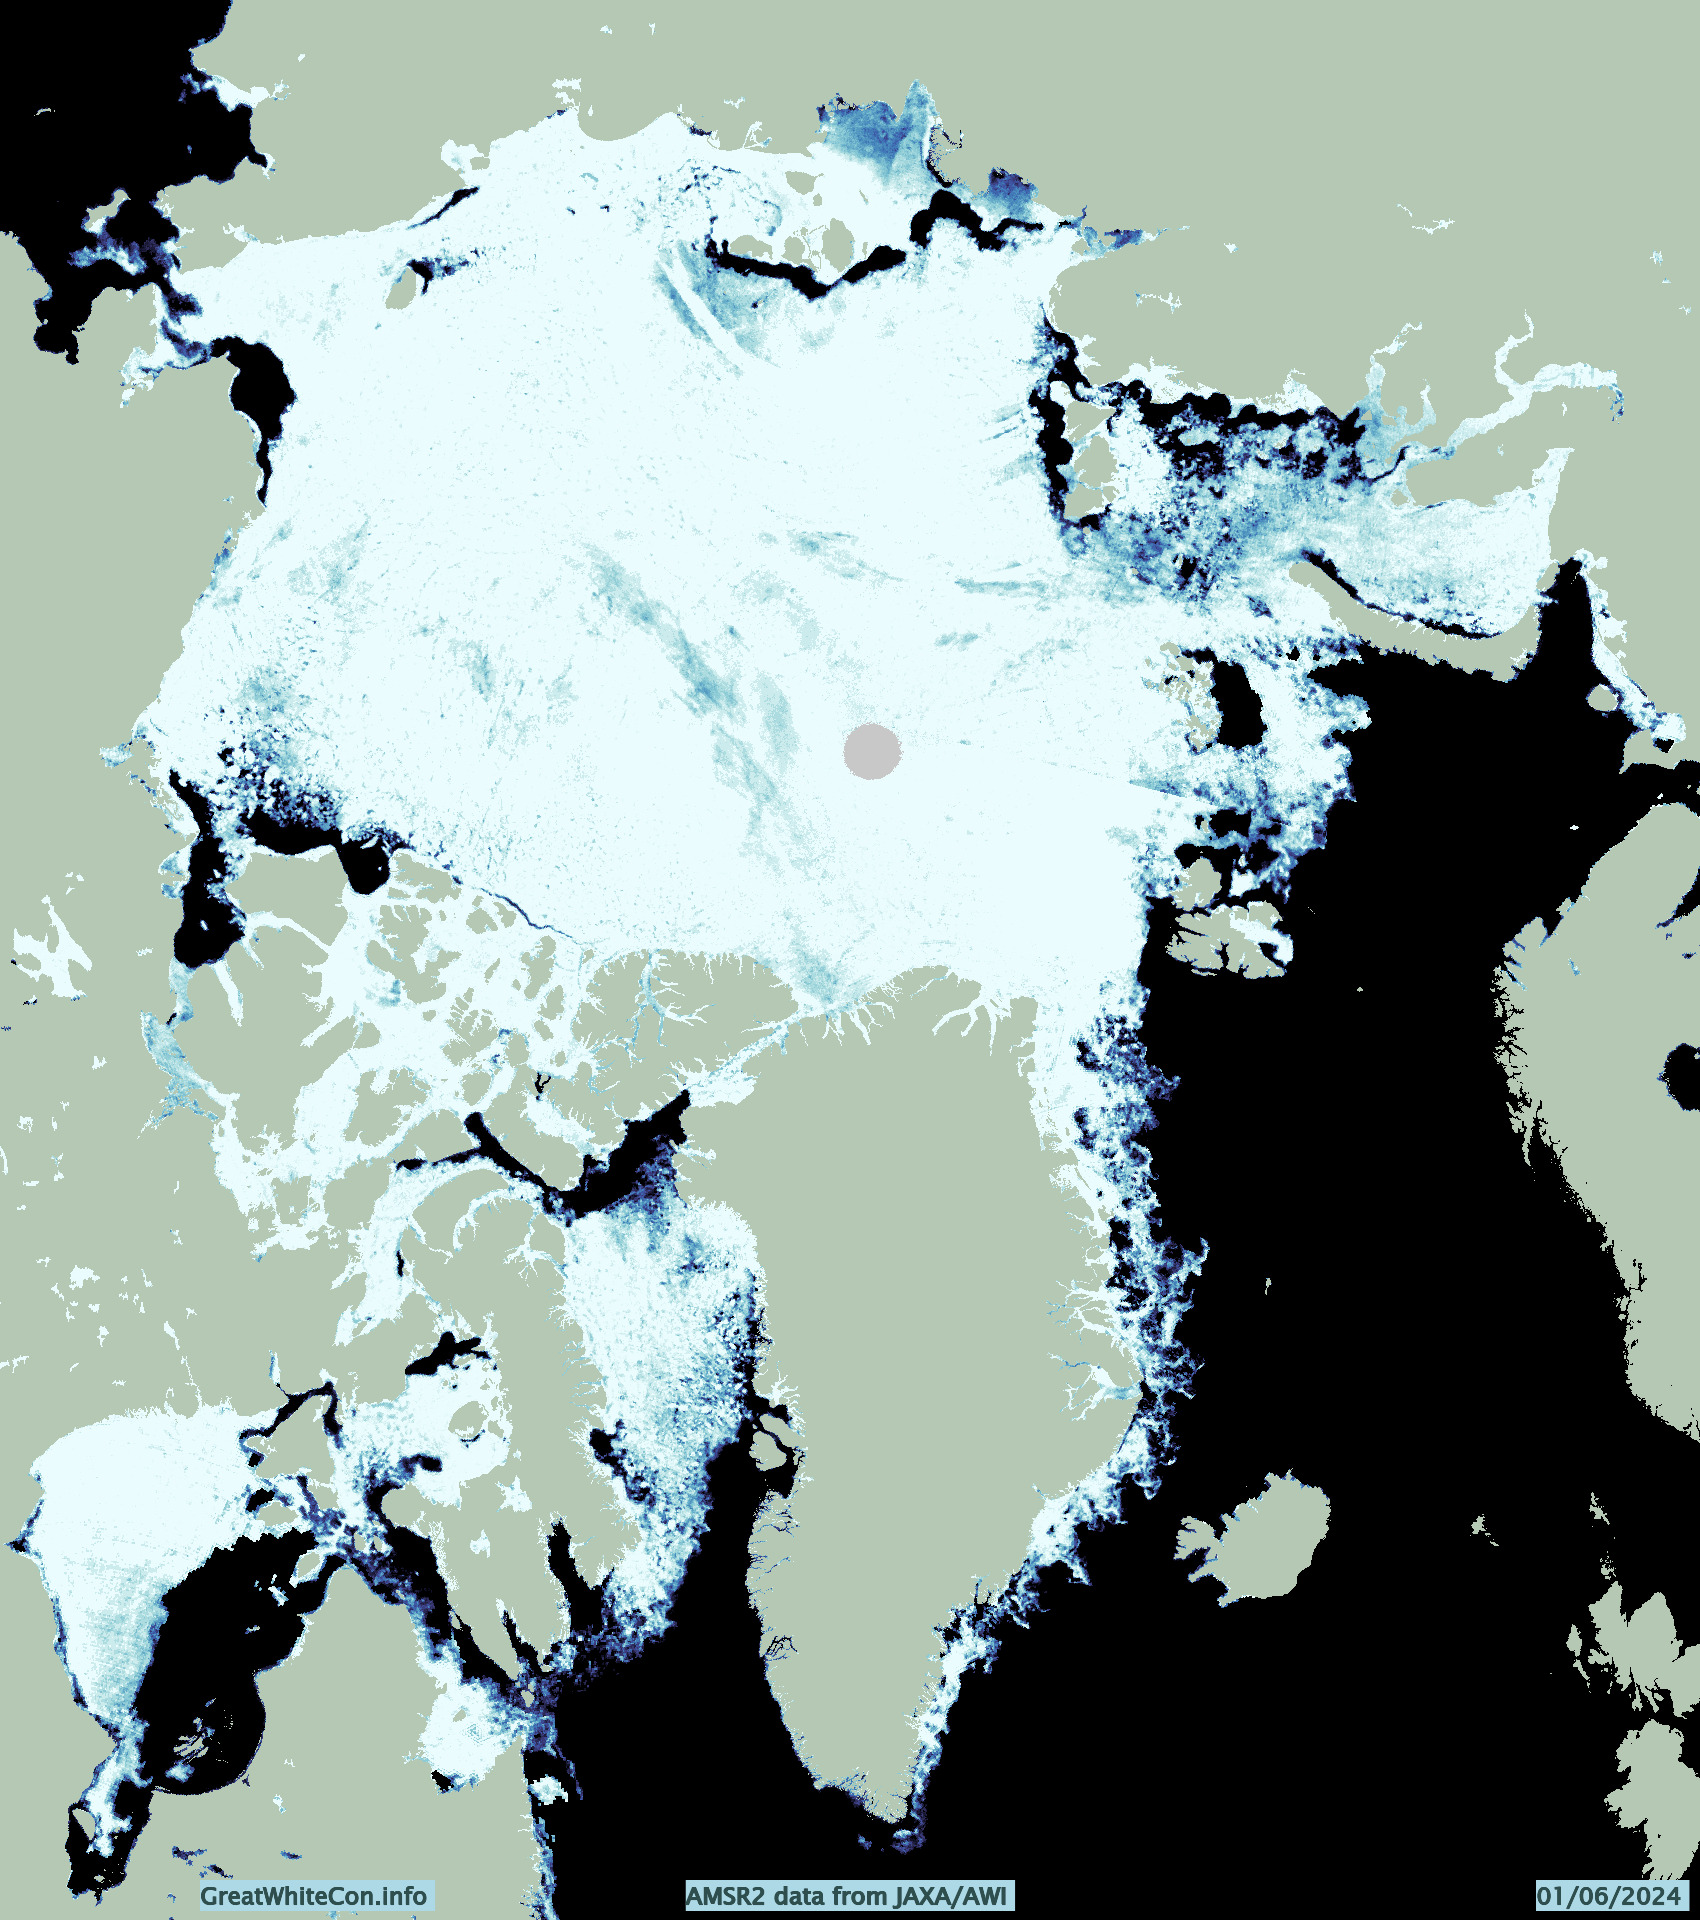
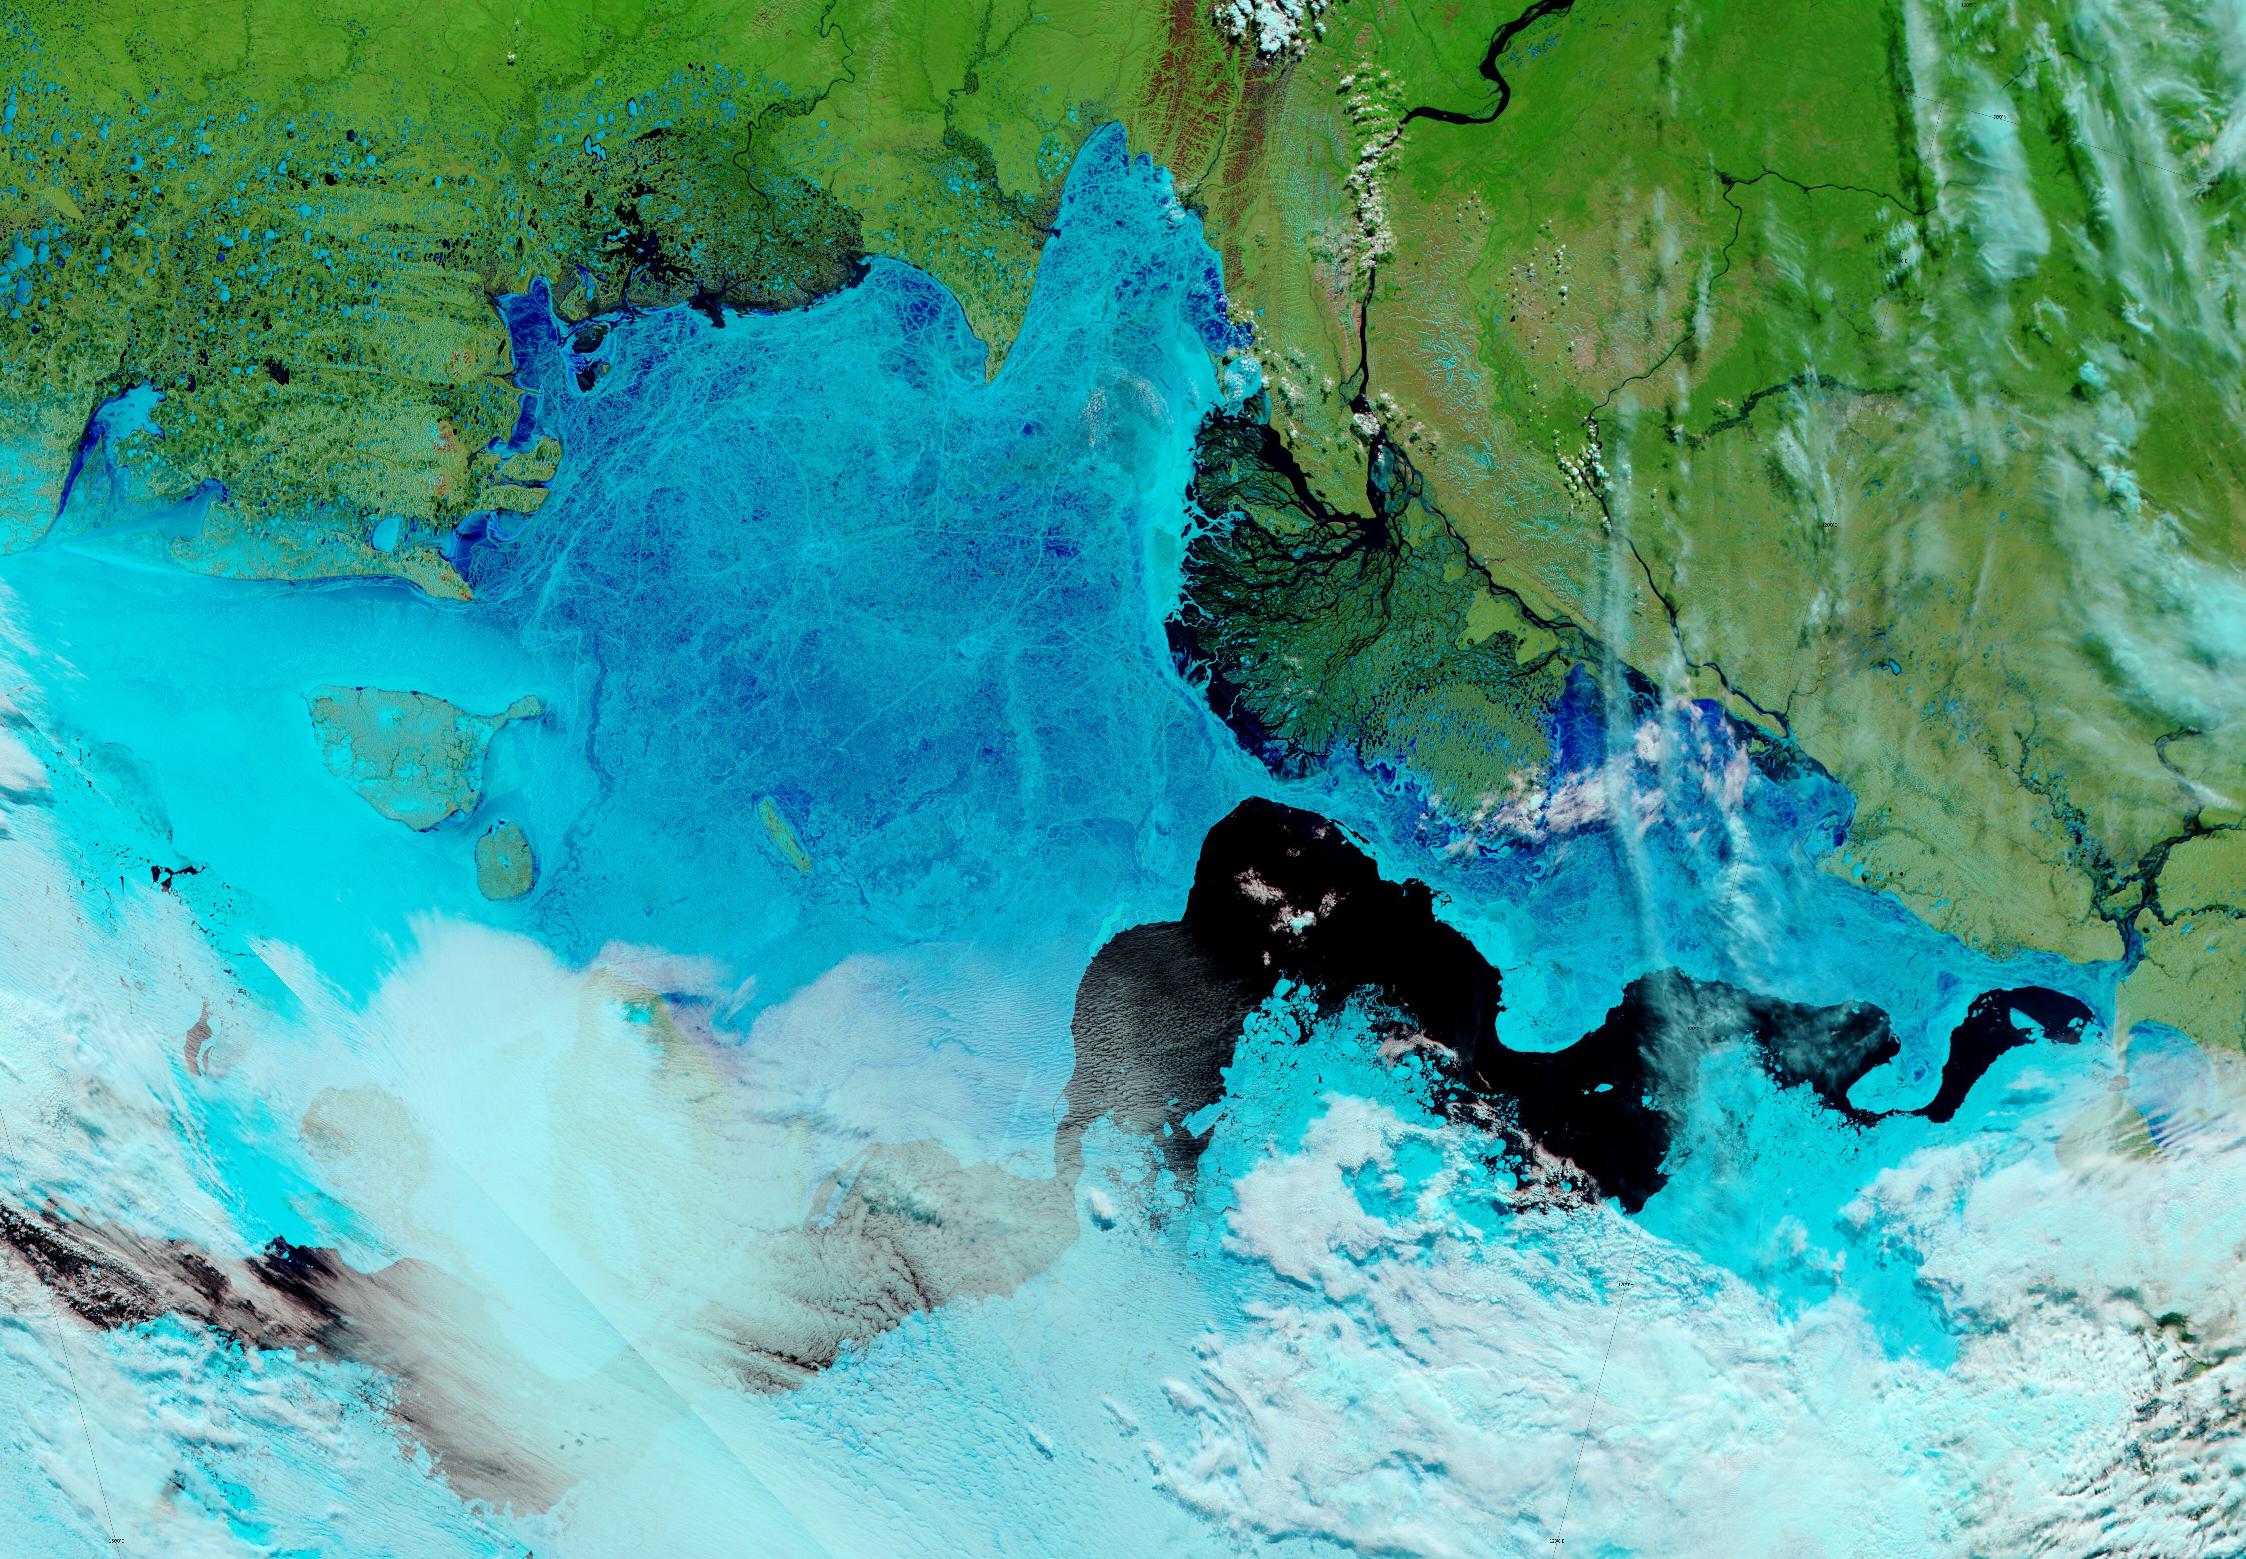
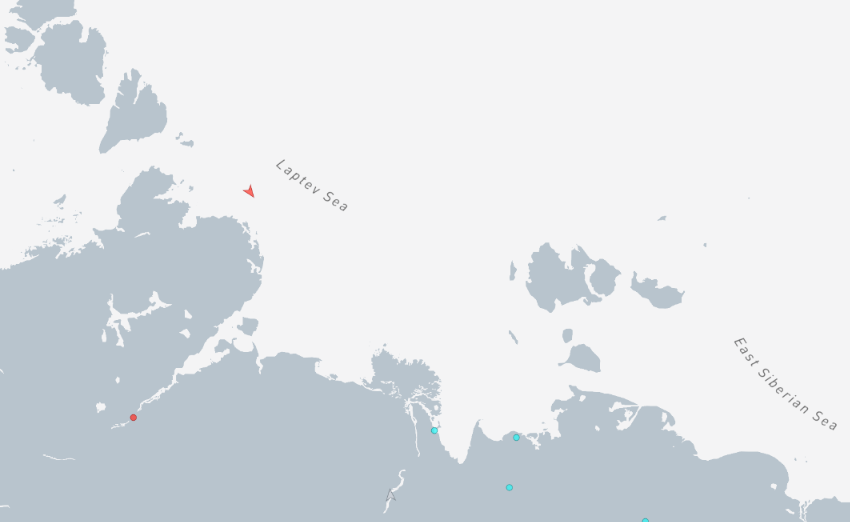
Melt ponds are now visible on the ice in the Laptev Sea:
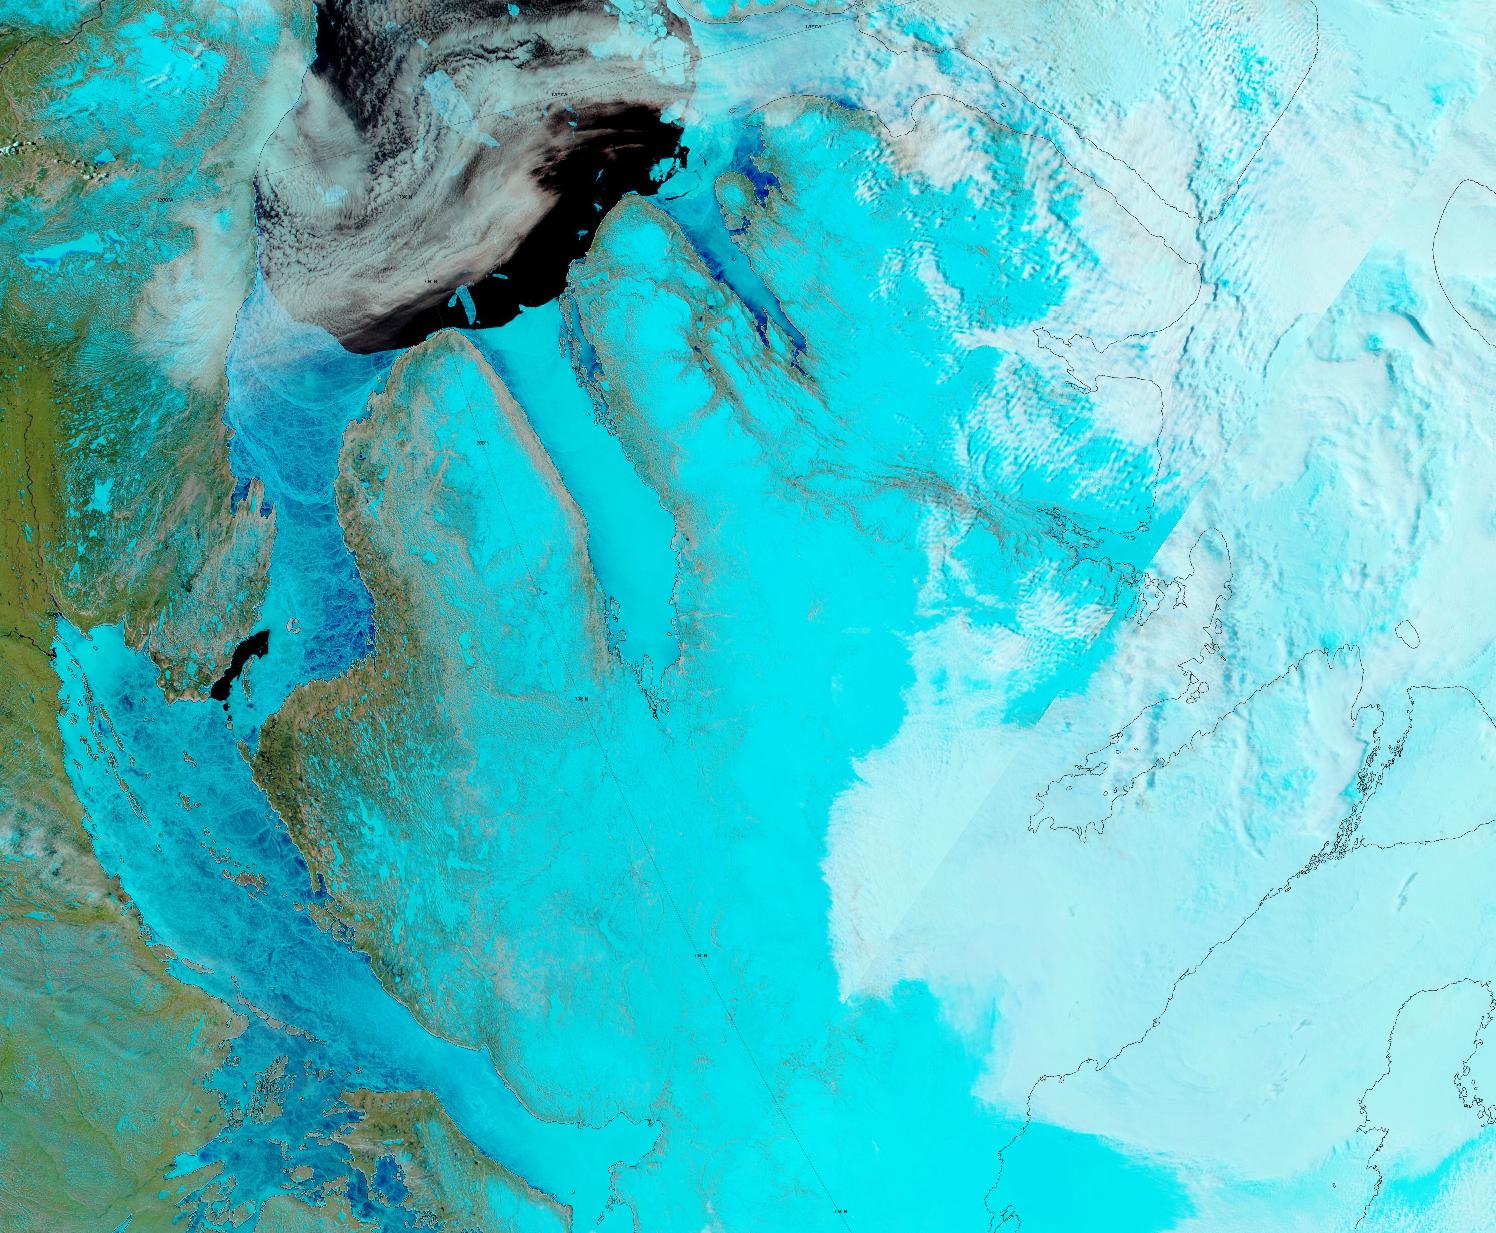
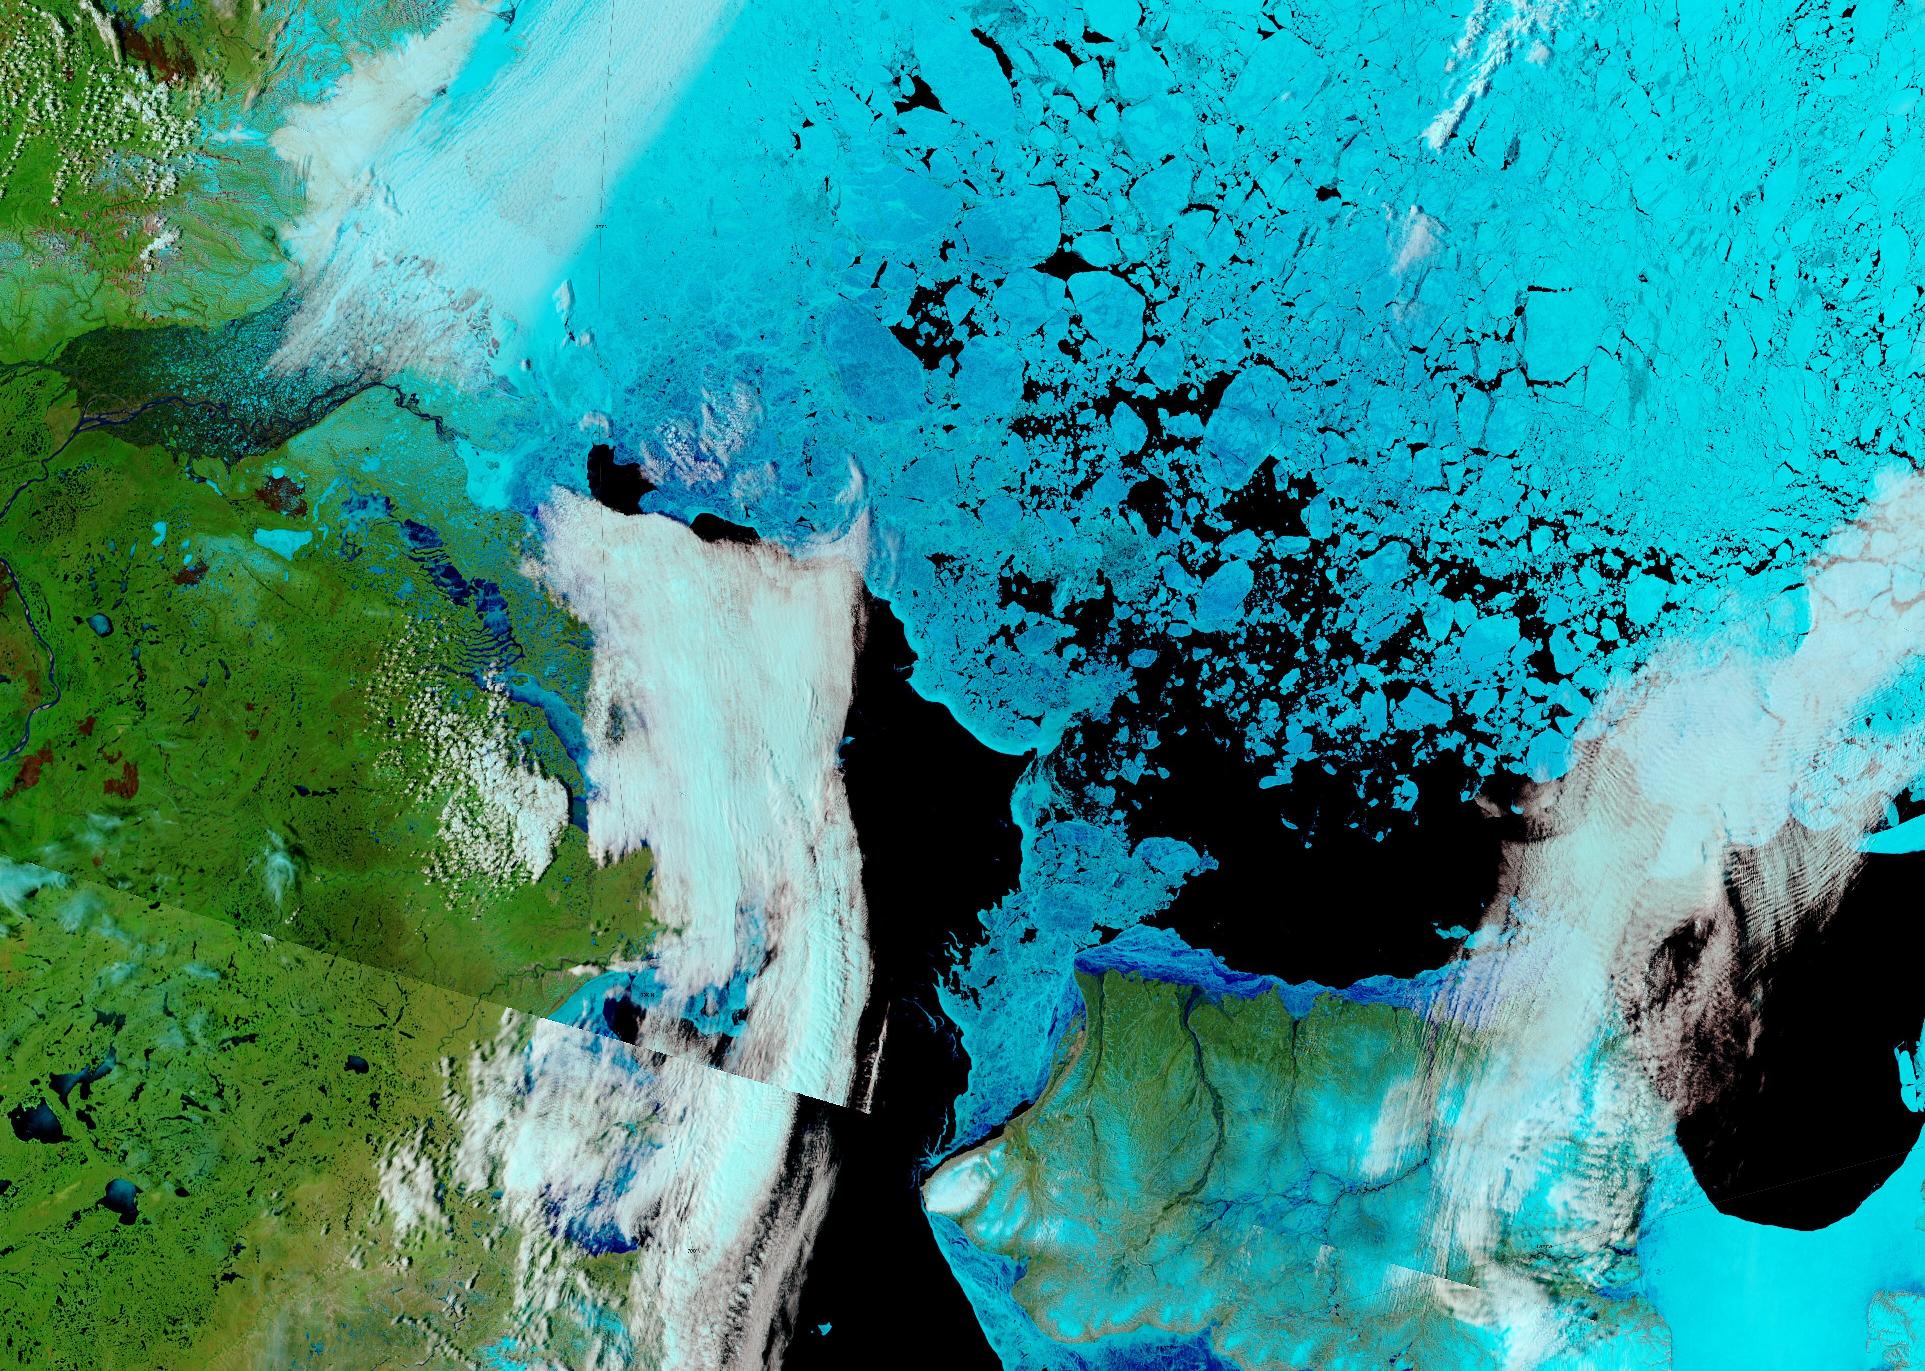
and the Coronation Gulf:
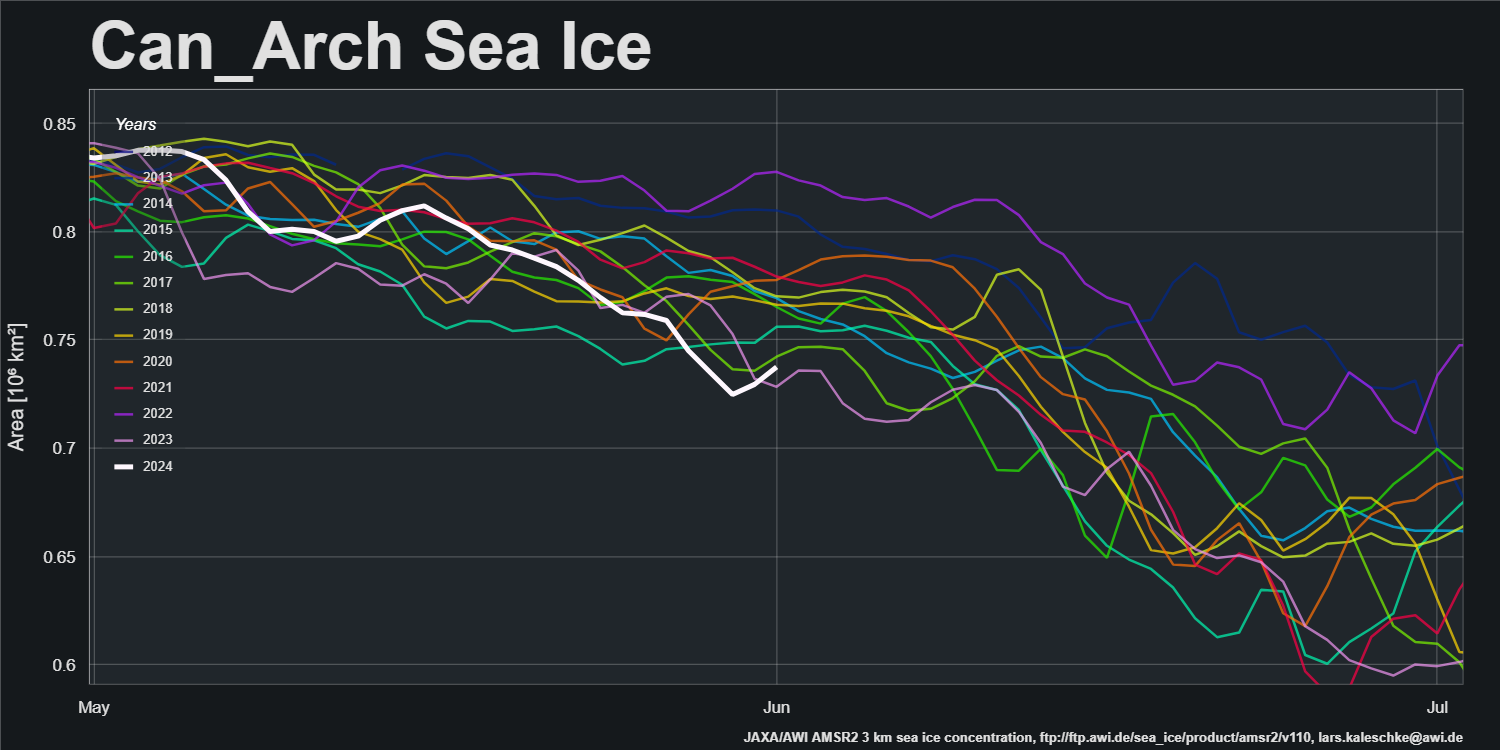
The Amundsen Gulf is almost entirely free from ice, and hence sea ice area in the Canadian Arctic Archipelago is near an all time low for the date in the AMSR2 era:
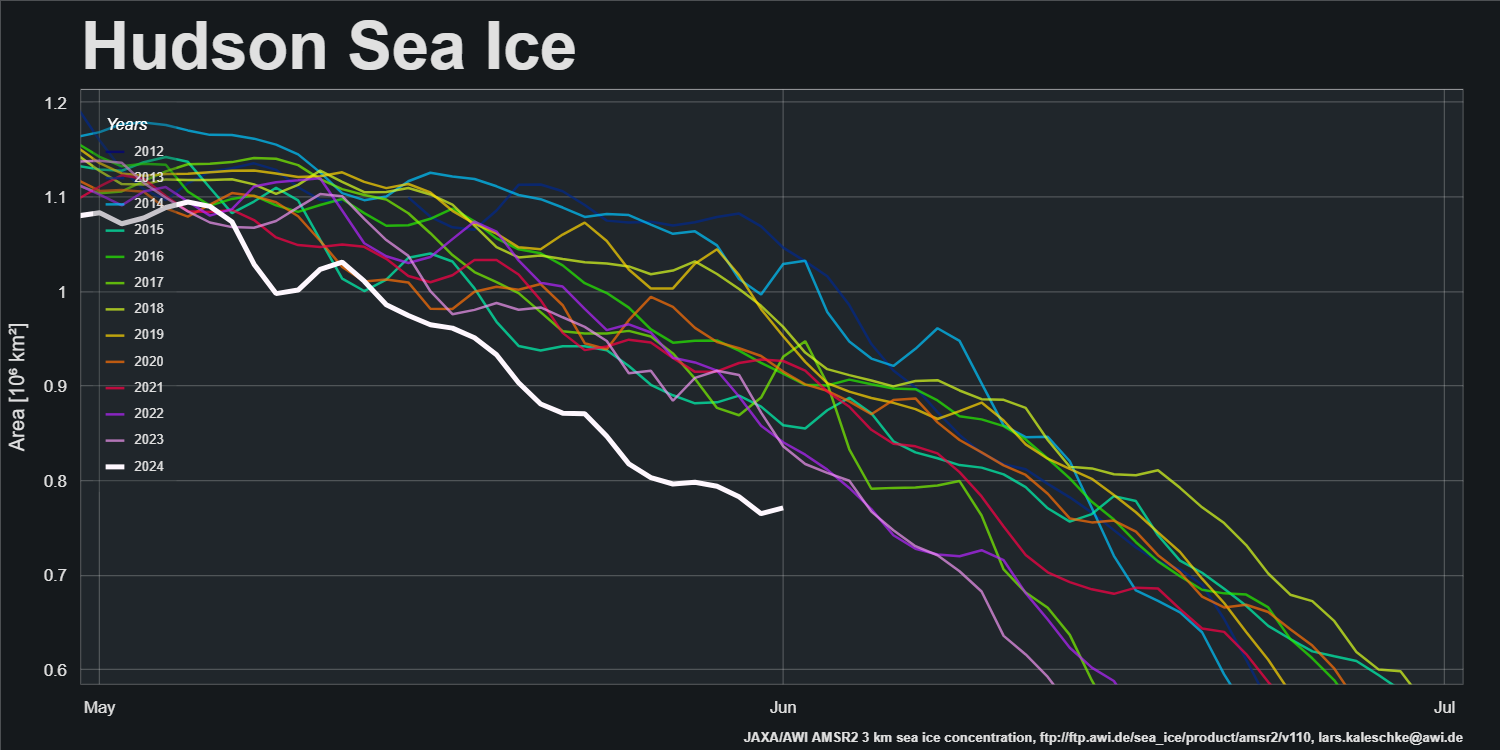
Sea ice area in Hudson Bay is lowest for the date by a considerable margin:
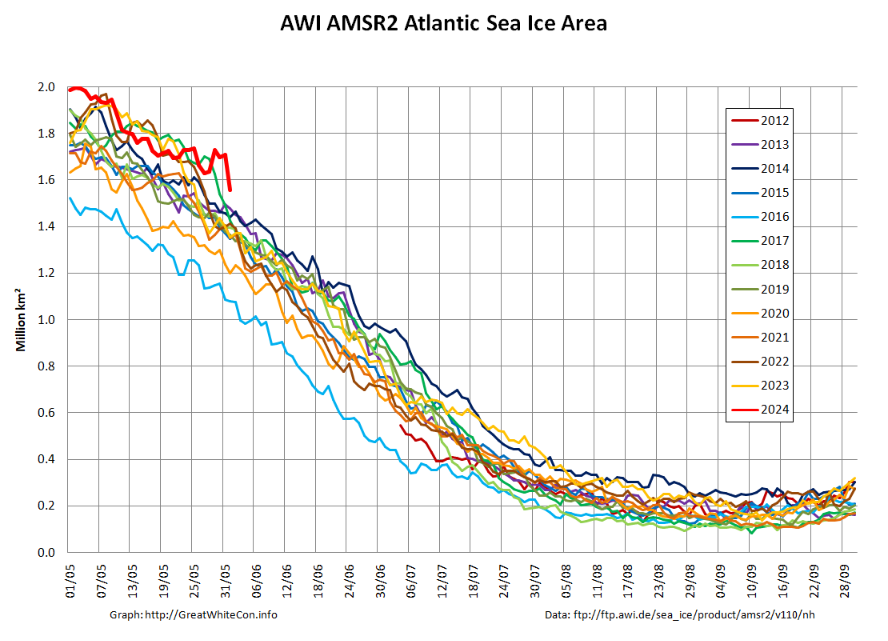
However, sea ice area on the Atlantic periphery is at a record high for the date in the AMSR2 era:
The PIOMAS gridded thickness data for May 2024 is now available. Here’s the end of month volume graph:
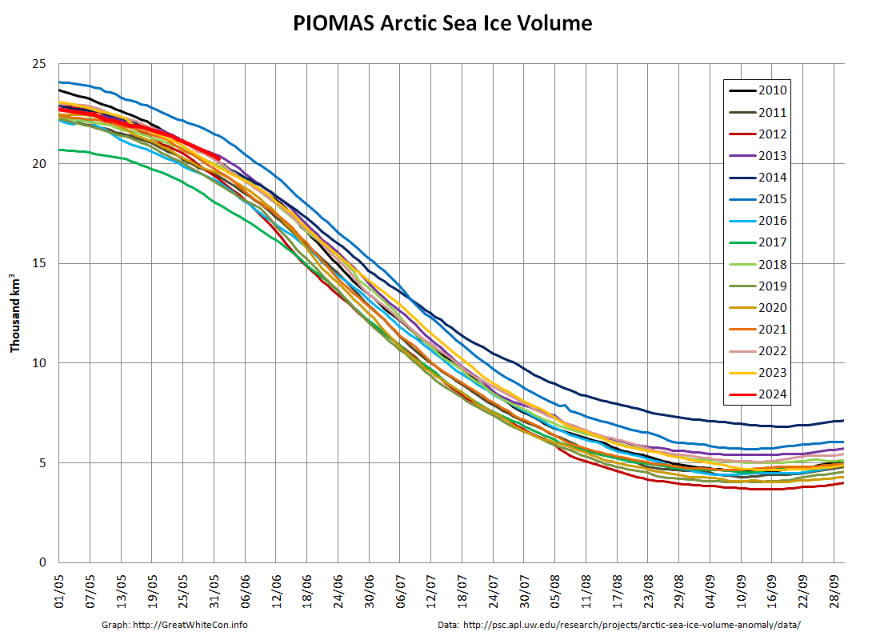
PIOMAS volume is up to 13th lowest in the satellite era. Here too is the end of month thickness map:
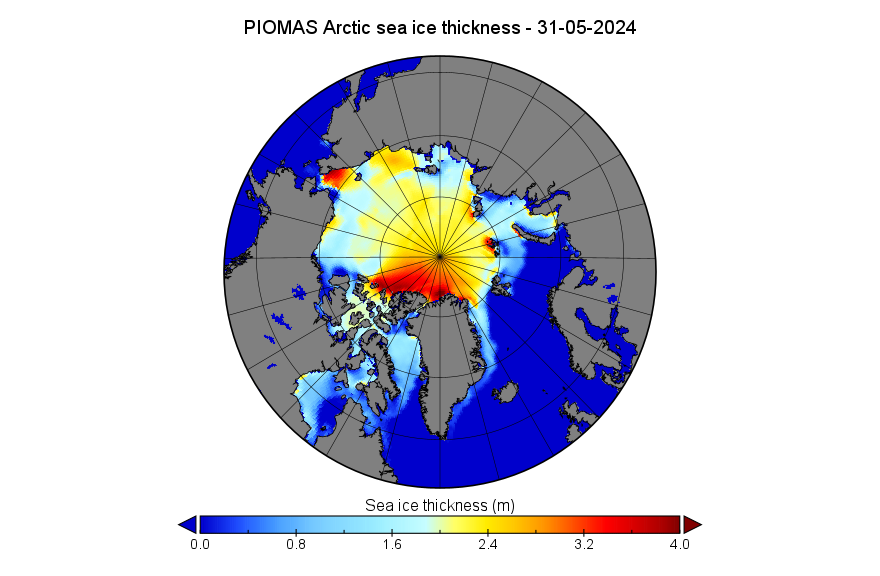
The Beaufort Sea continues to look vulnerable to early melting. The latest Canadian Ice Service chart shows the expected arm of old ice across the northern Beaufort. However, it remains below 2 metres in thickness according to PIOMAS:
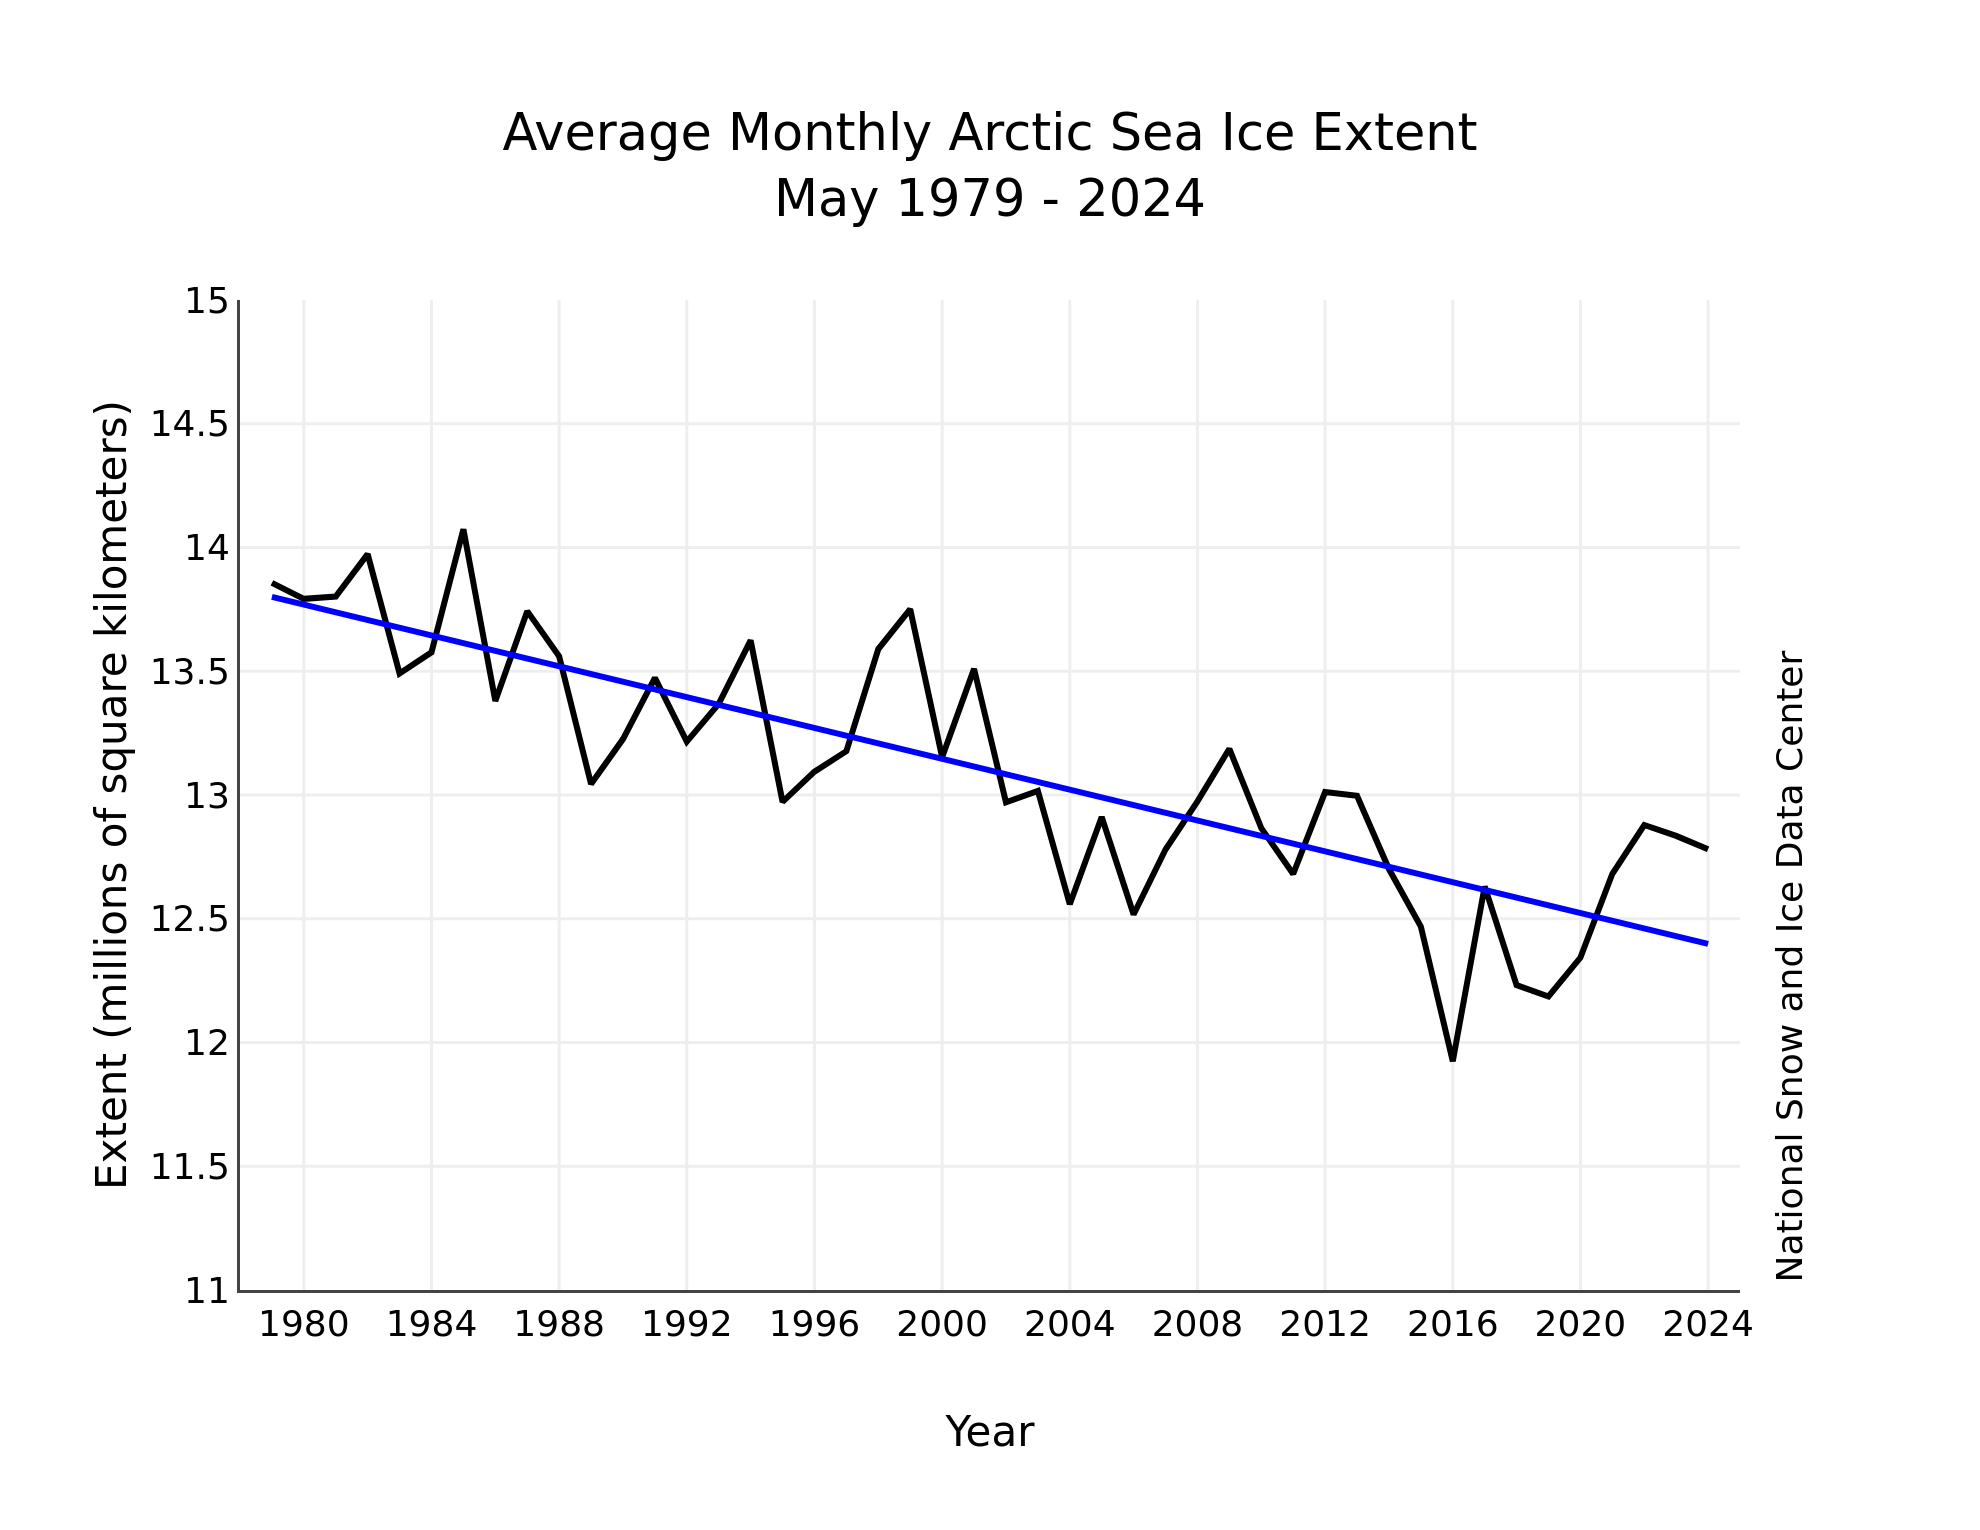
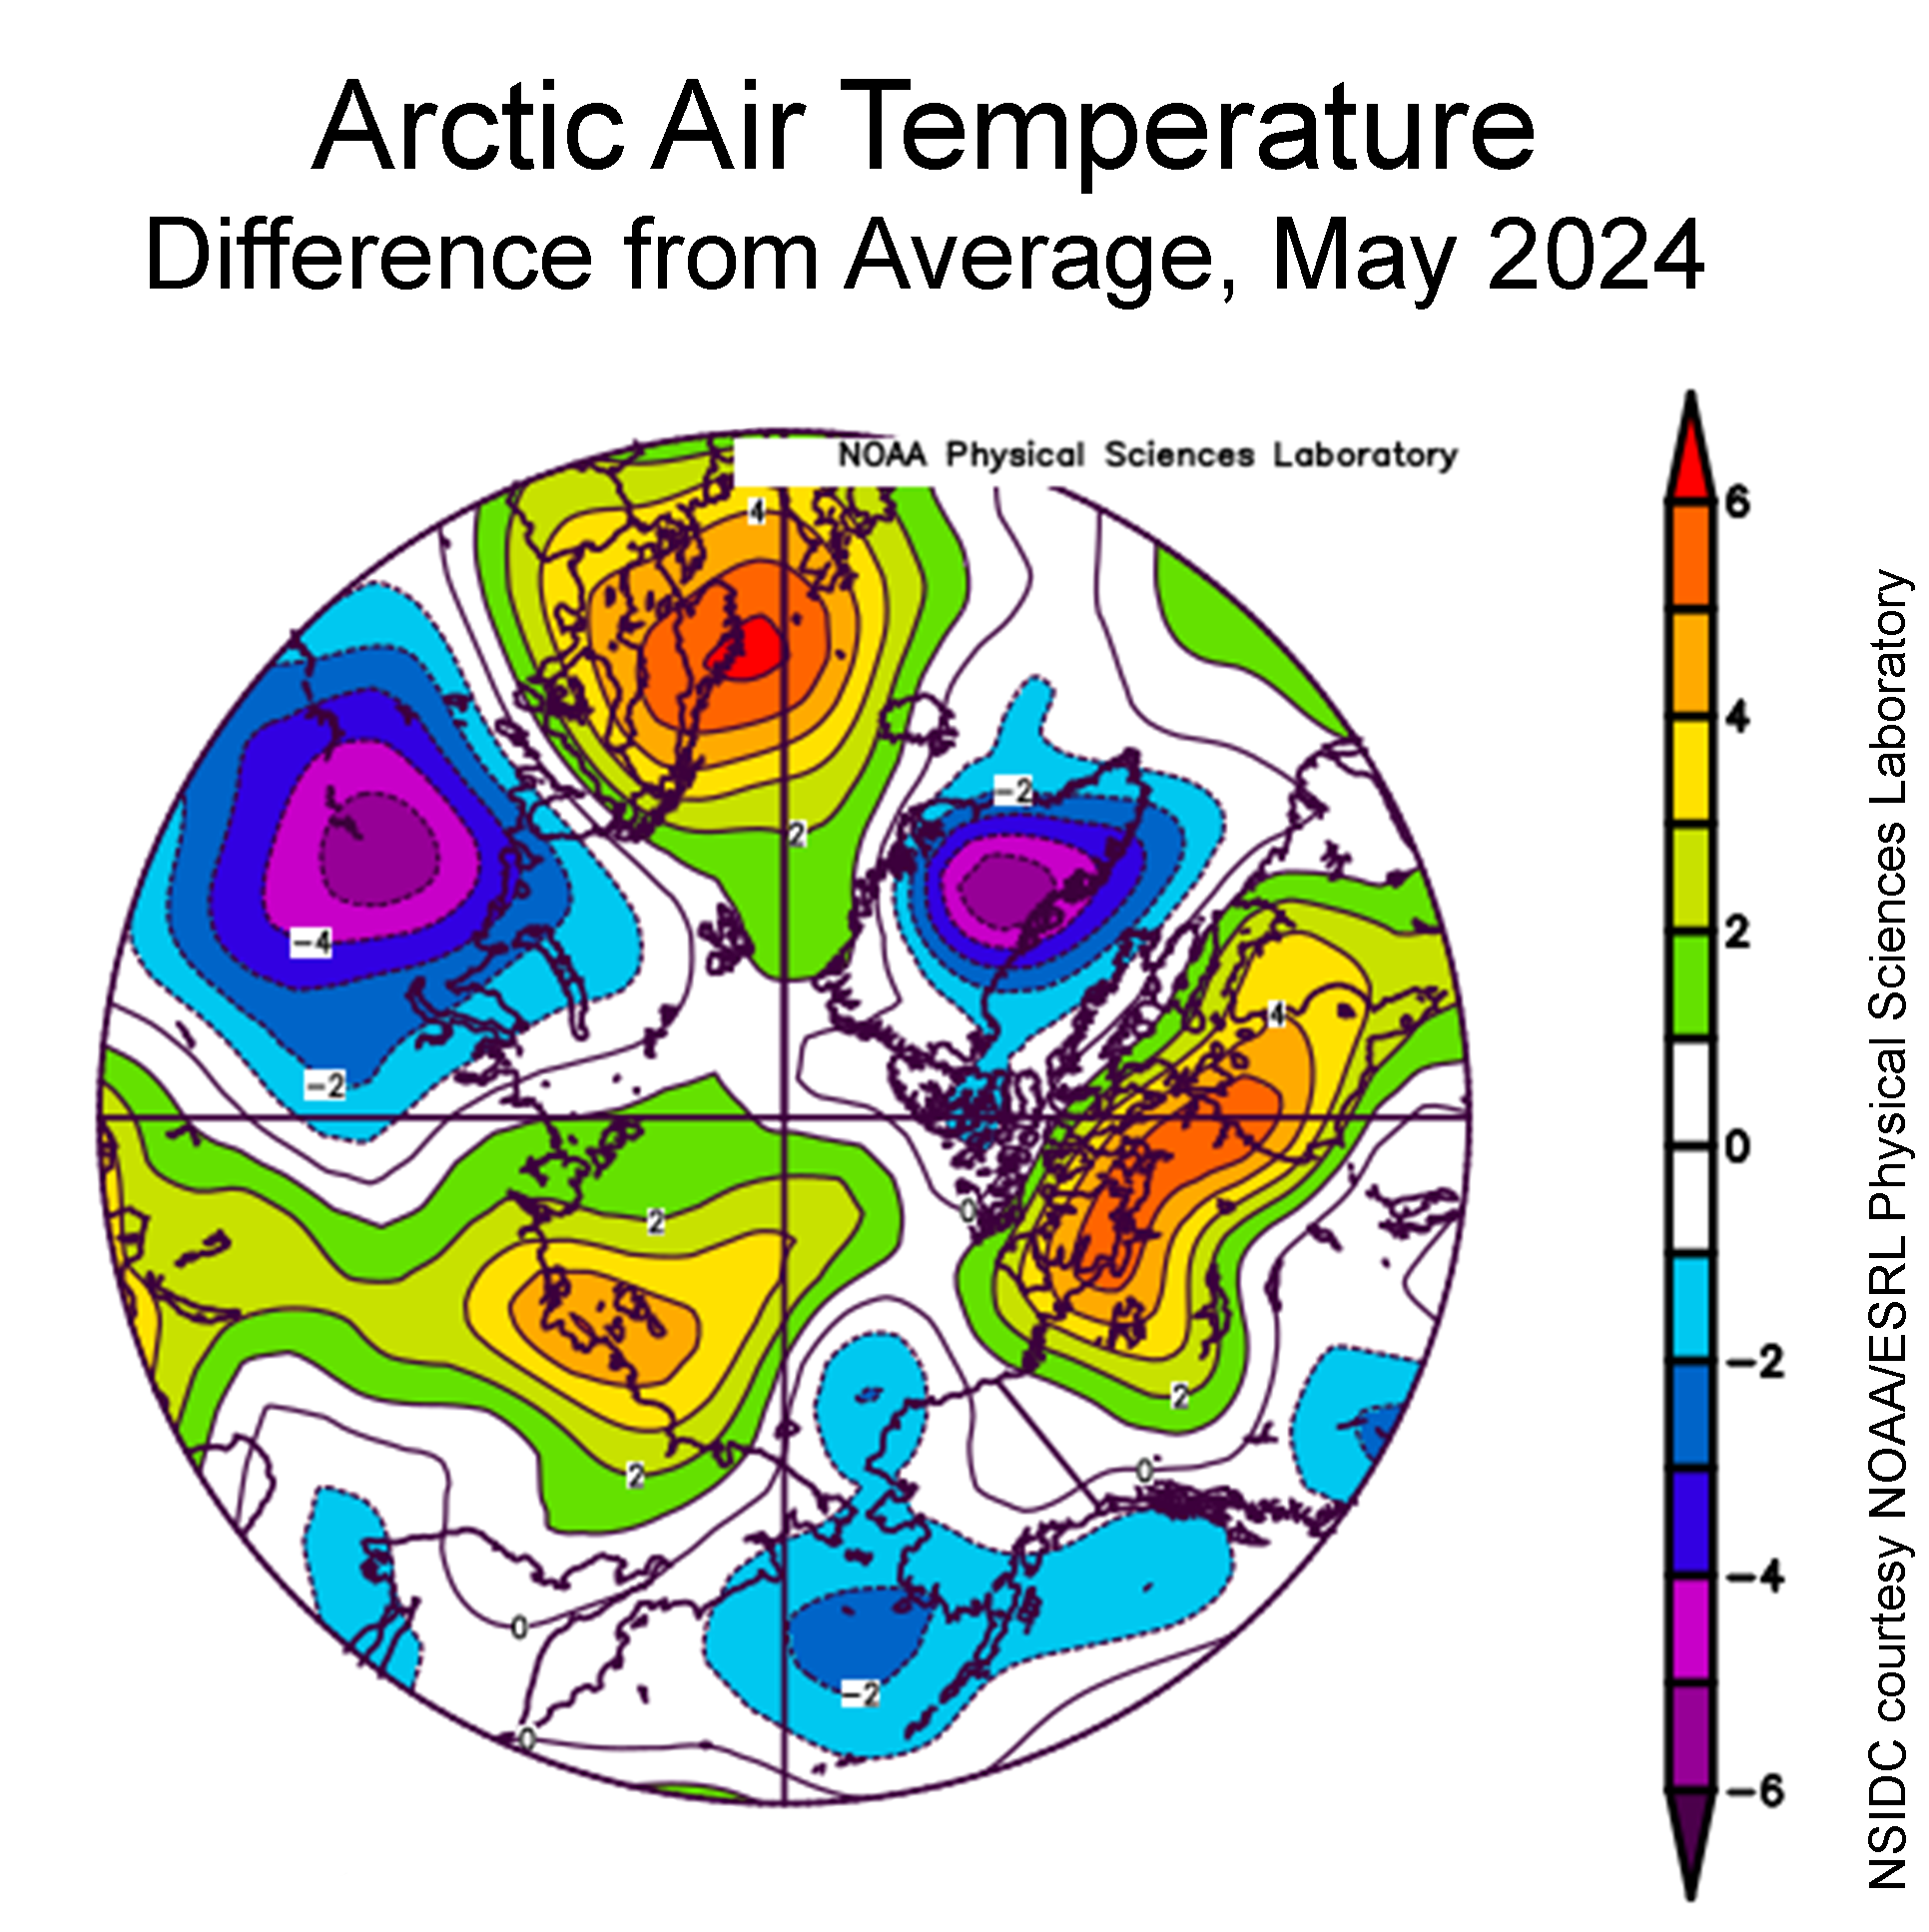
The May edition of the National Snow and Ice Data Center’s Arctic Sea Ice News reports that:
The average Arctic sea ice extent for May 2024 was 12.78 million square kilometers, tying for twelfth lowest with 2007 in the passive microwave satellite record. As of the beginning of June, extent is well below average in the Hudson Bay and slightly below average elsewhere. Some coastal areas around the Arctic Ocean are beginning to open up, particularly in the Beaufort and Chukchi Seas:
Atmospheric conditions over the Arctic were variable during May. Relatively cool conditions reigned over the Bering and Chukchi Seas as well as the Barents and Kara Seas, with air temperatures at the 925 millibar level (about 2,500 feet above sea level) 1 to 3 degrees Celsius below average. By contrast, temperatures in the Laptev and East Siberian Seas were 2 to 4 degrees Celsius above average. Temperatures over the Canadian Archipelago and northwestern Hudson Bay were 4 to 5 degrees Celsius above average. It was relatively cool over most of Greenland:
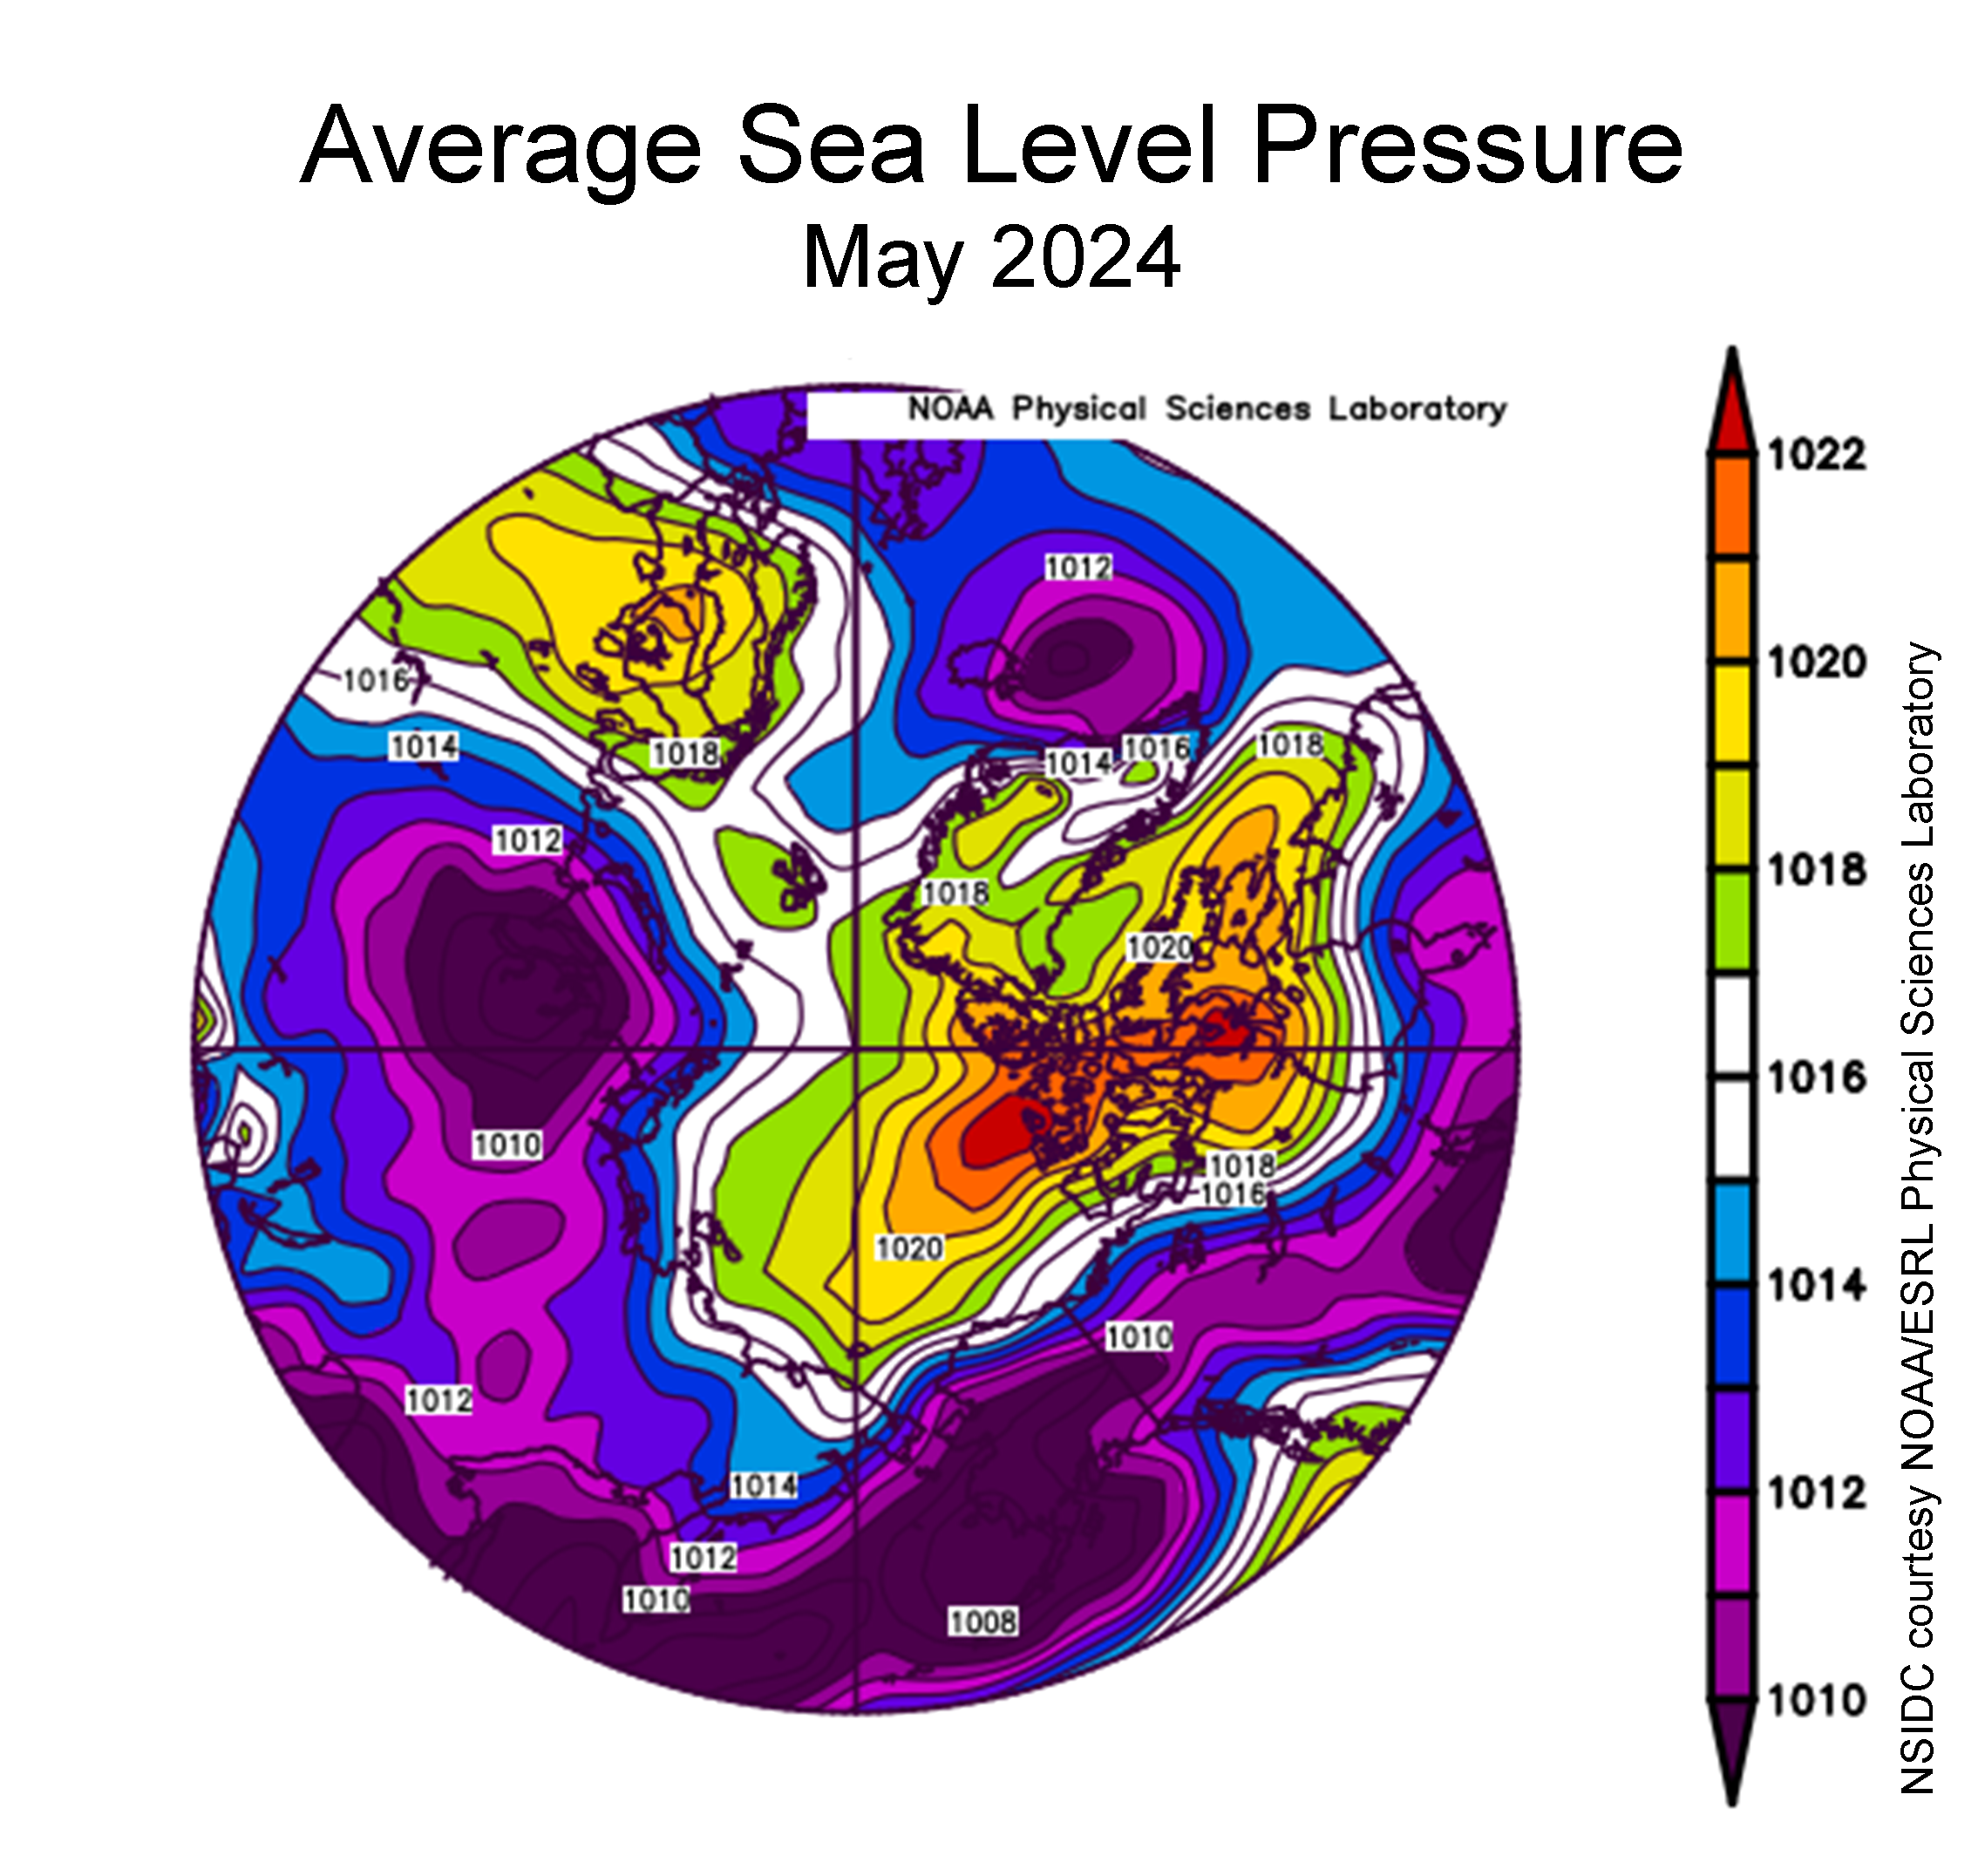
The sea level pressure pattern for May was marked by high pressure centered over the Canadian Archipelago with lower pressures to the south… This played a large role in the opening of the eastern Hudson Bay by fostering winds from the east that pushed the sea ice west. Pressures were somewhat low from central Russia extending east into Canada, as well as southeast of Greenland:
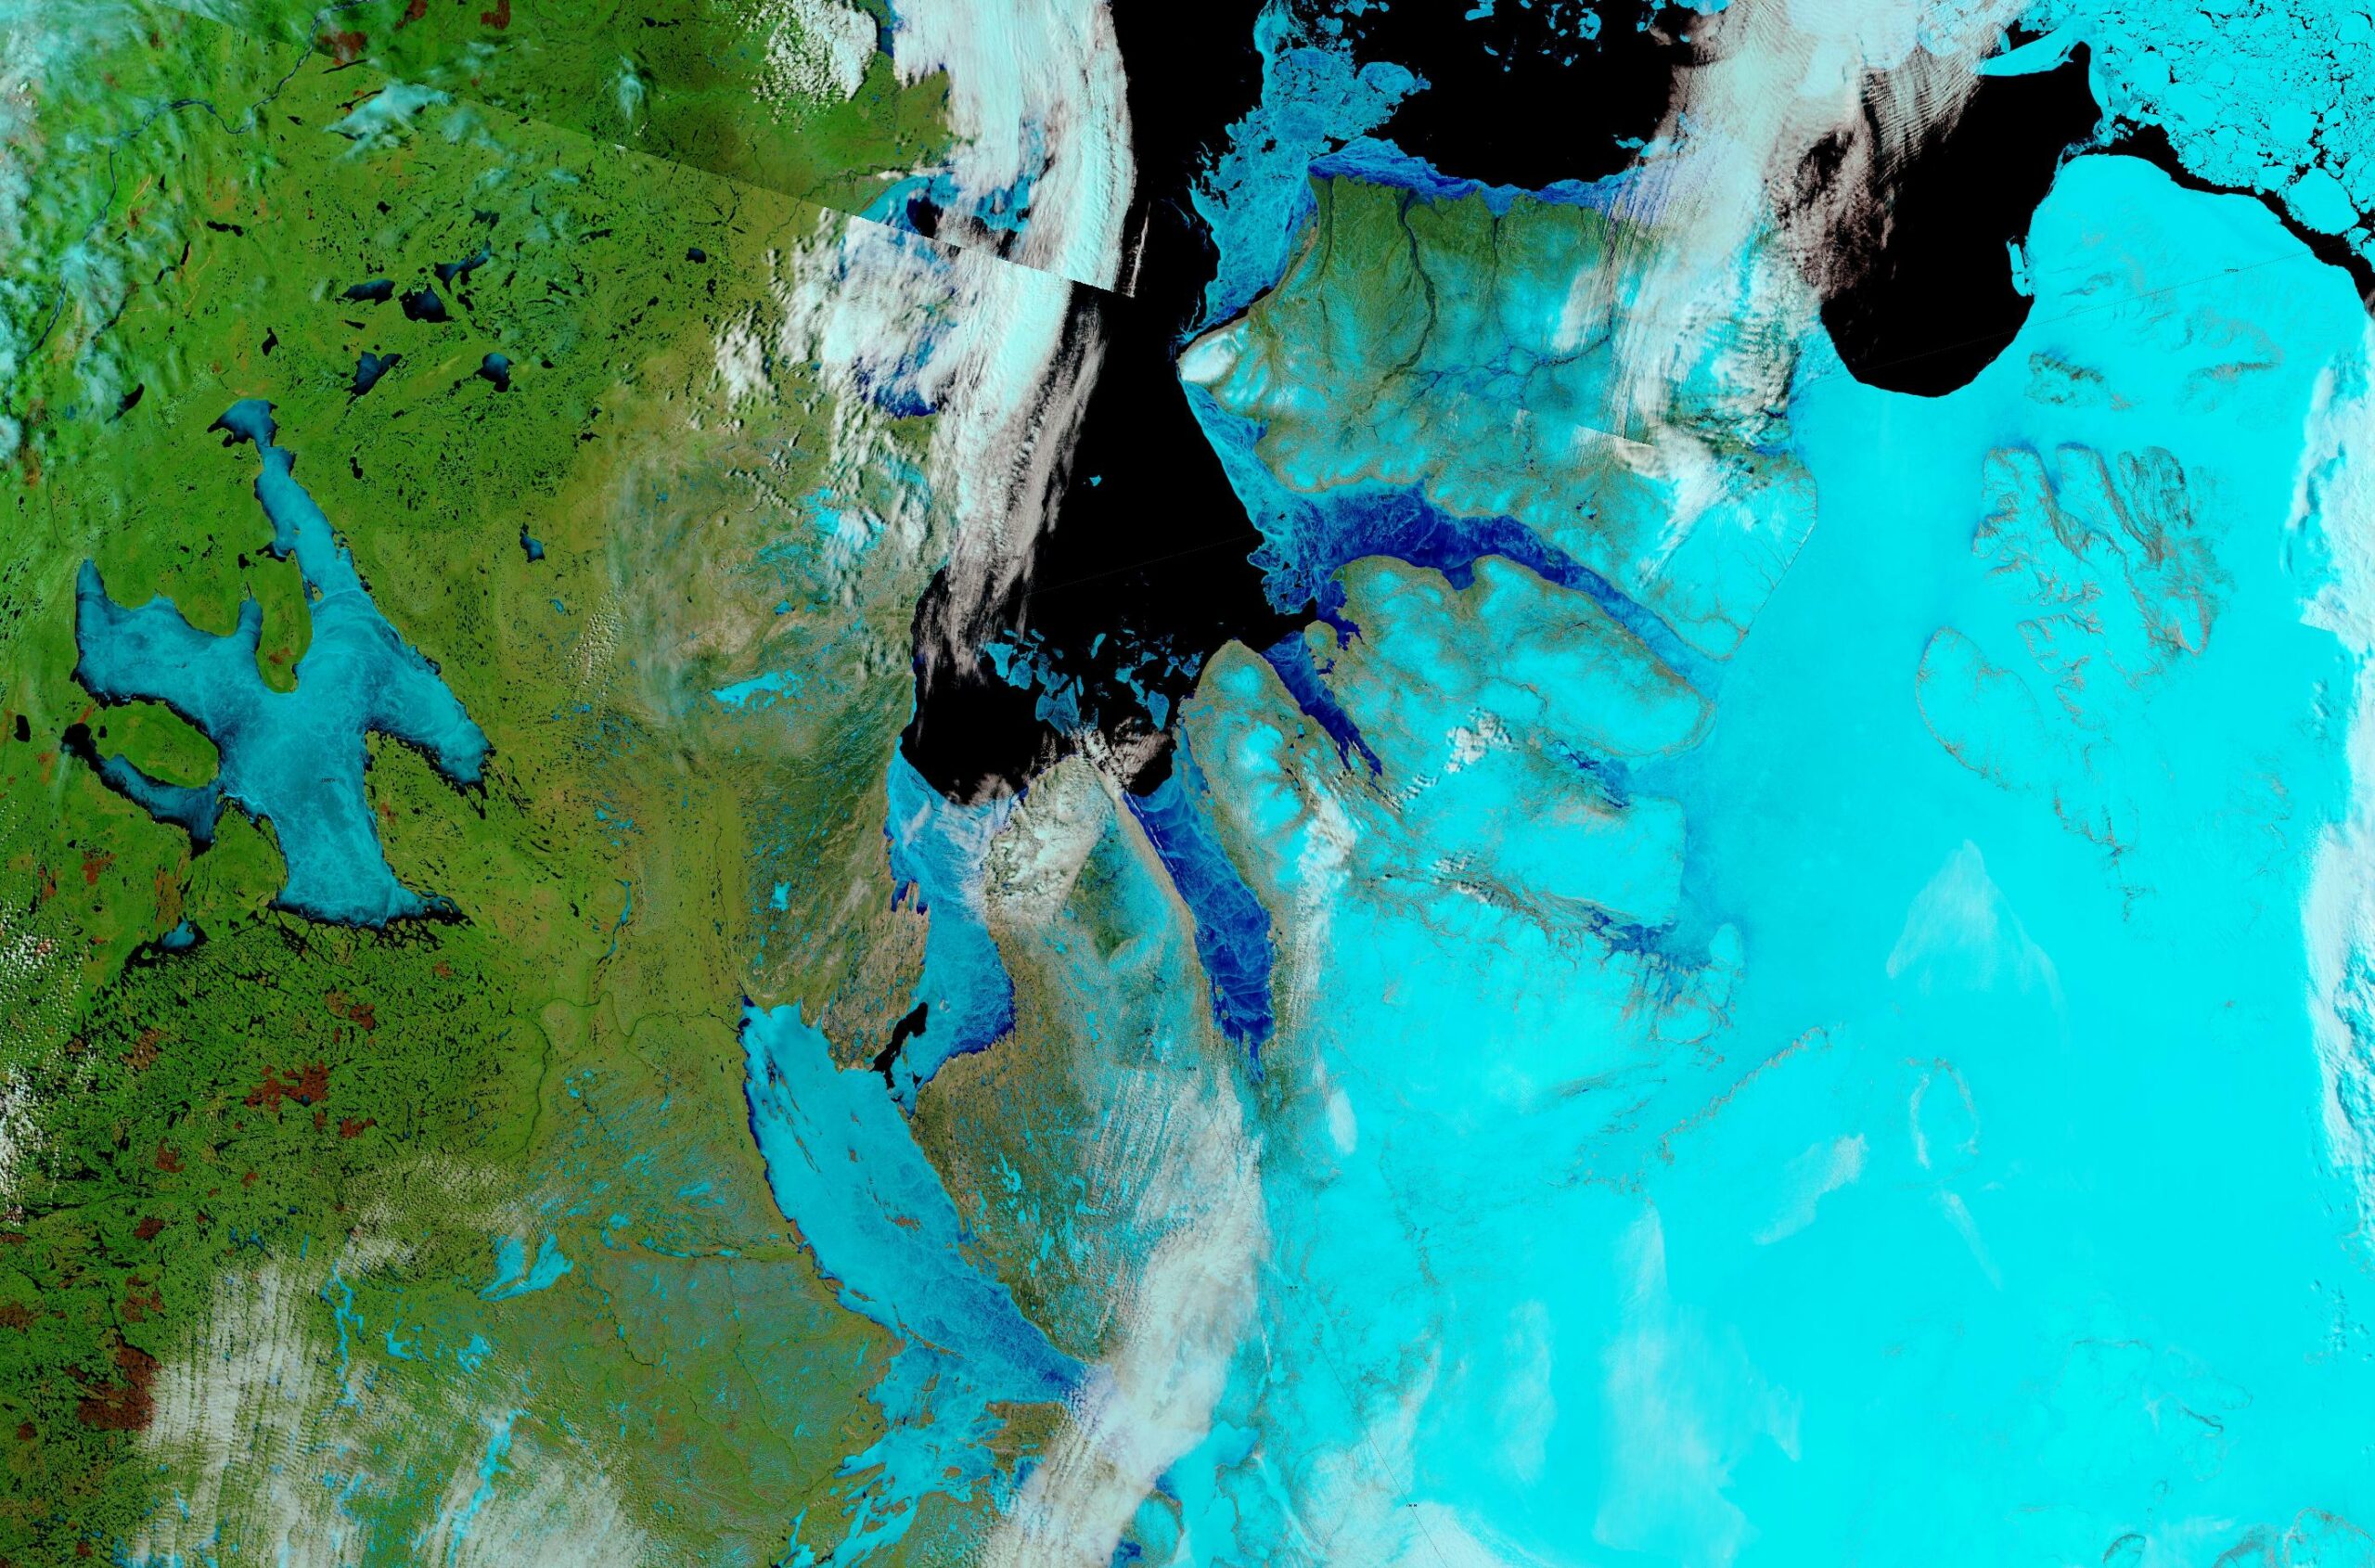
There’s now plenty of surface melt visible across the Laptev Sea:
the eastern Beaufort Sea:
and the western Canadian Arctic Archipelago:
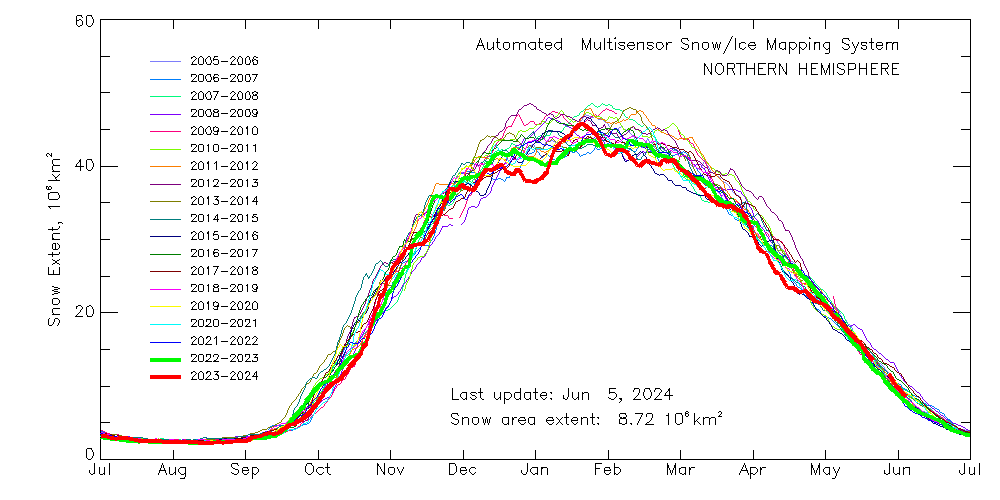
Here’s the current Northern Hemisphere Multisensor Snow Extent graph :
GFS currently predicts that persistent high pressure over the central Arctic will result in the loss of almost all snow cover across the Arctic Ocean by the end of the forecast period:
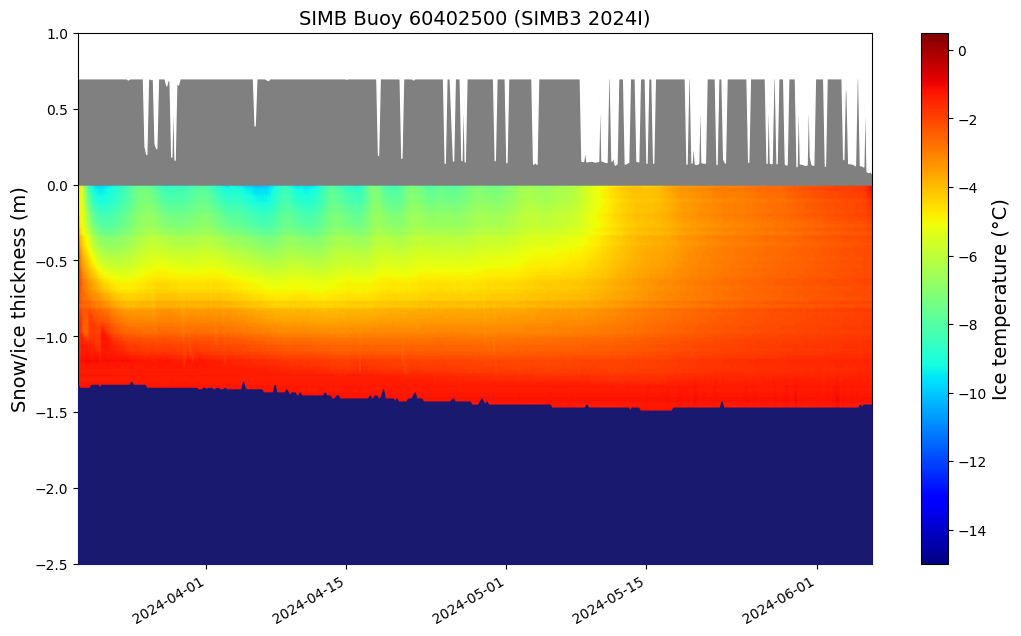
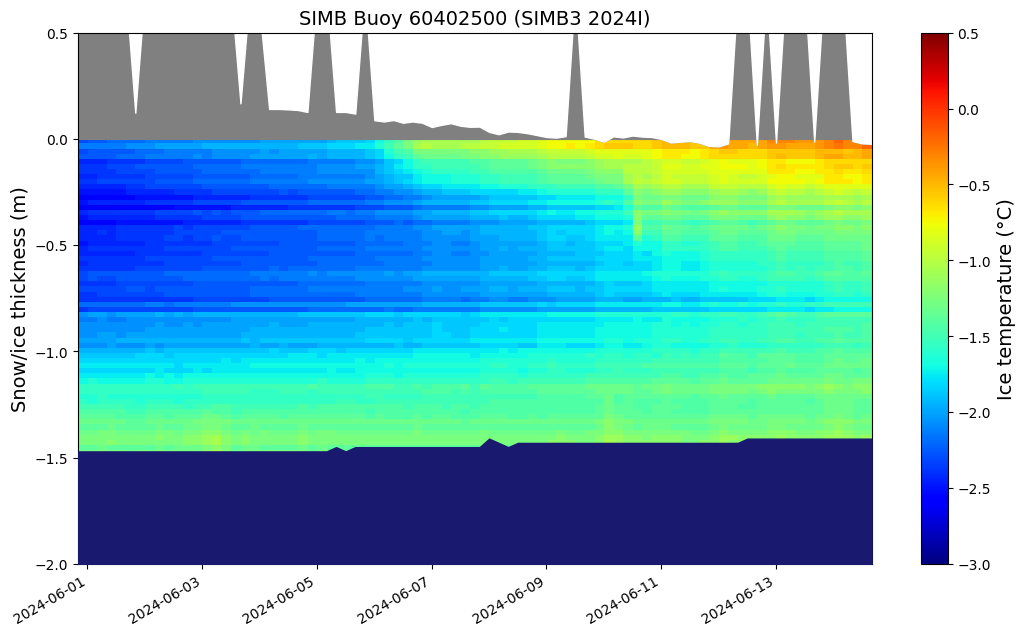
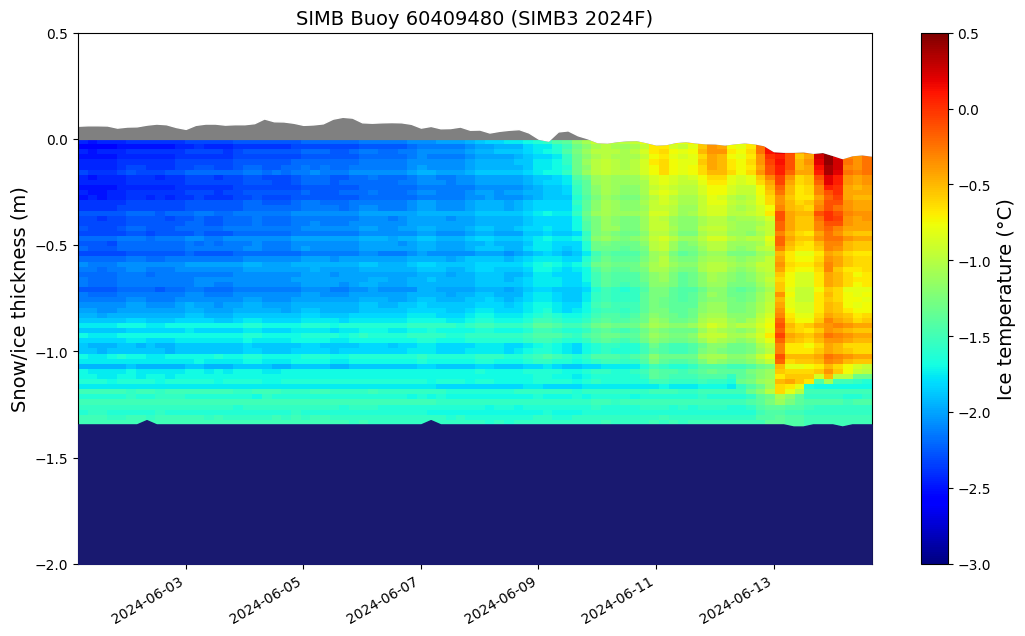
Snow melt and bottom melt appear to have started at ice mass balance buoy 2024I, currently located at 75.34 N, 147.40 W:
The JAXA web site is back in action, and reveals that their flavour of extent has dropped below the 2010s average again, and won’t be crossing above the 2012 curve just yet.
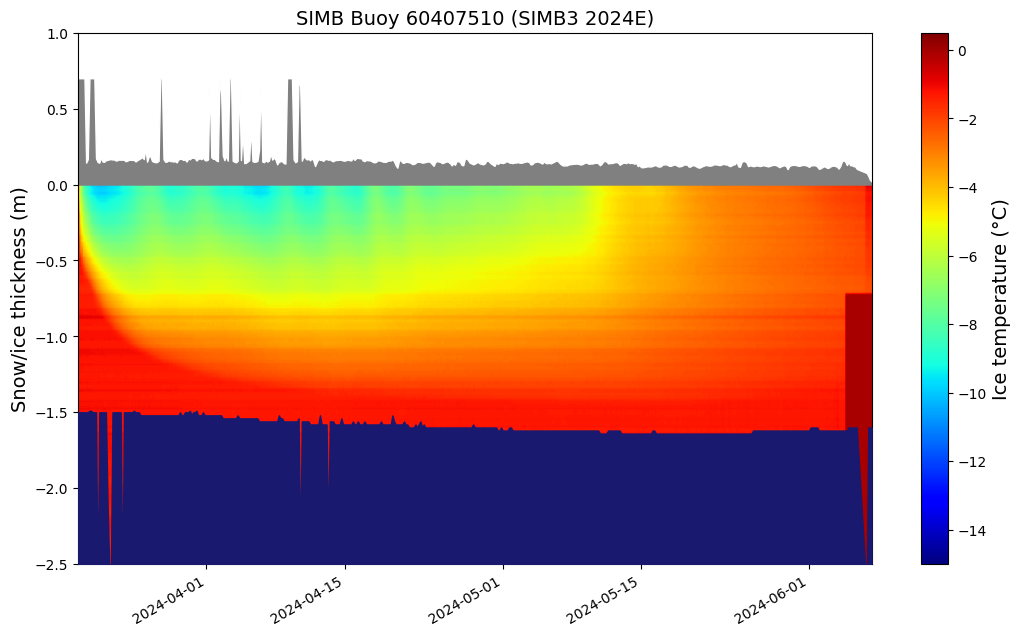
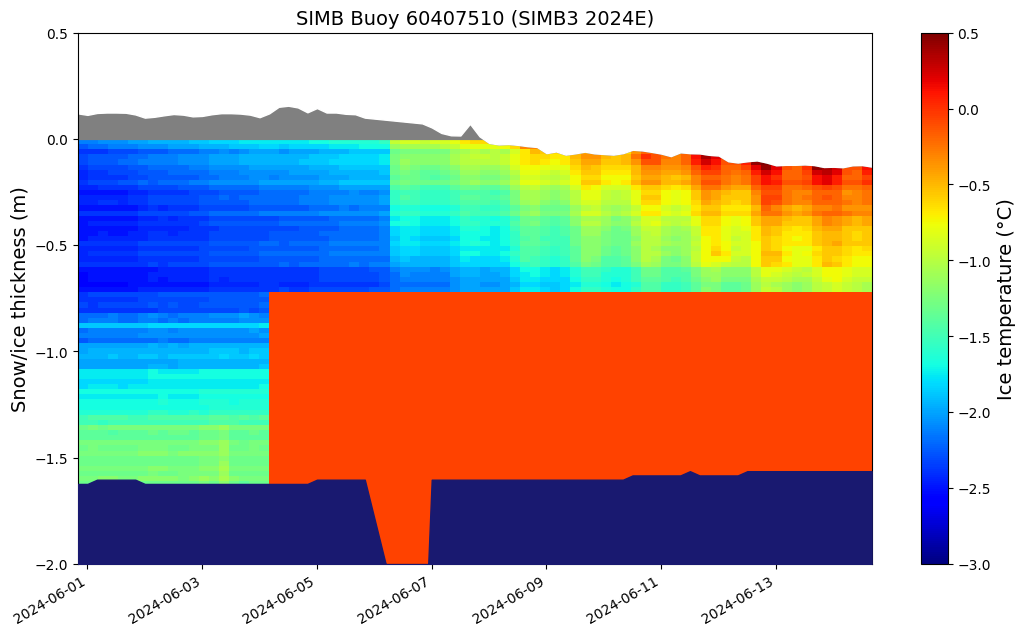
Most of the snow that surrounds ice mass balance buoy 2024E has melted. The buoy is currently located at 74.68 N, 151.70 W:
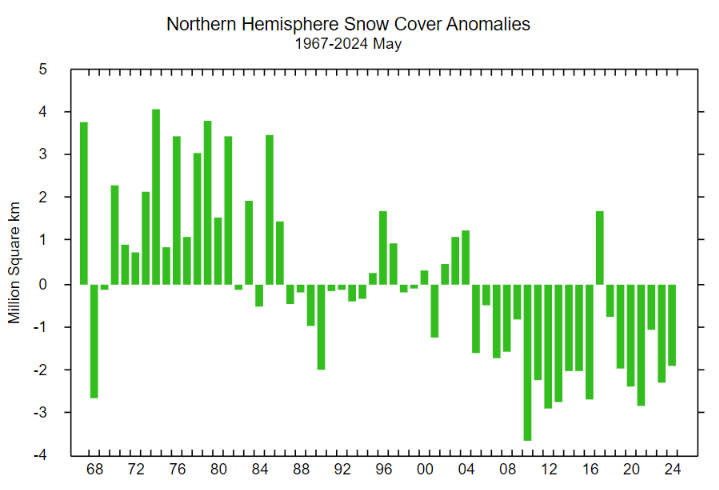
Whilst we’re on the topic of snow cover, The May Rutgers Global Snow Lab northern hemisphere snow cover anomaly data has been released:
Finally, for the moment at least, here is the latest map of Arctic sea ice age:

JAXA extent is forming a “June cliff” in 2024. Having dropped by 500,000 km² in 5 days it’s now 6th lowest for the date in the satellite era.
Surface melt has started at IMB buoy 2024E. It’s a pity that part of the thermometer chain has failed just as things start to get really interesting:

Plenty of surface melt is now visible in the channels between Ellesmere and Axel Heiberg Islands:
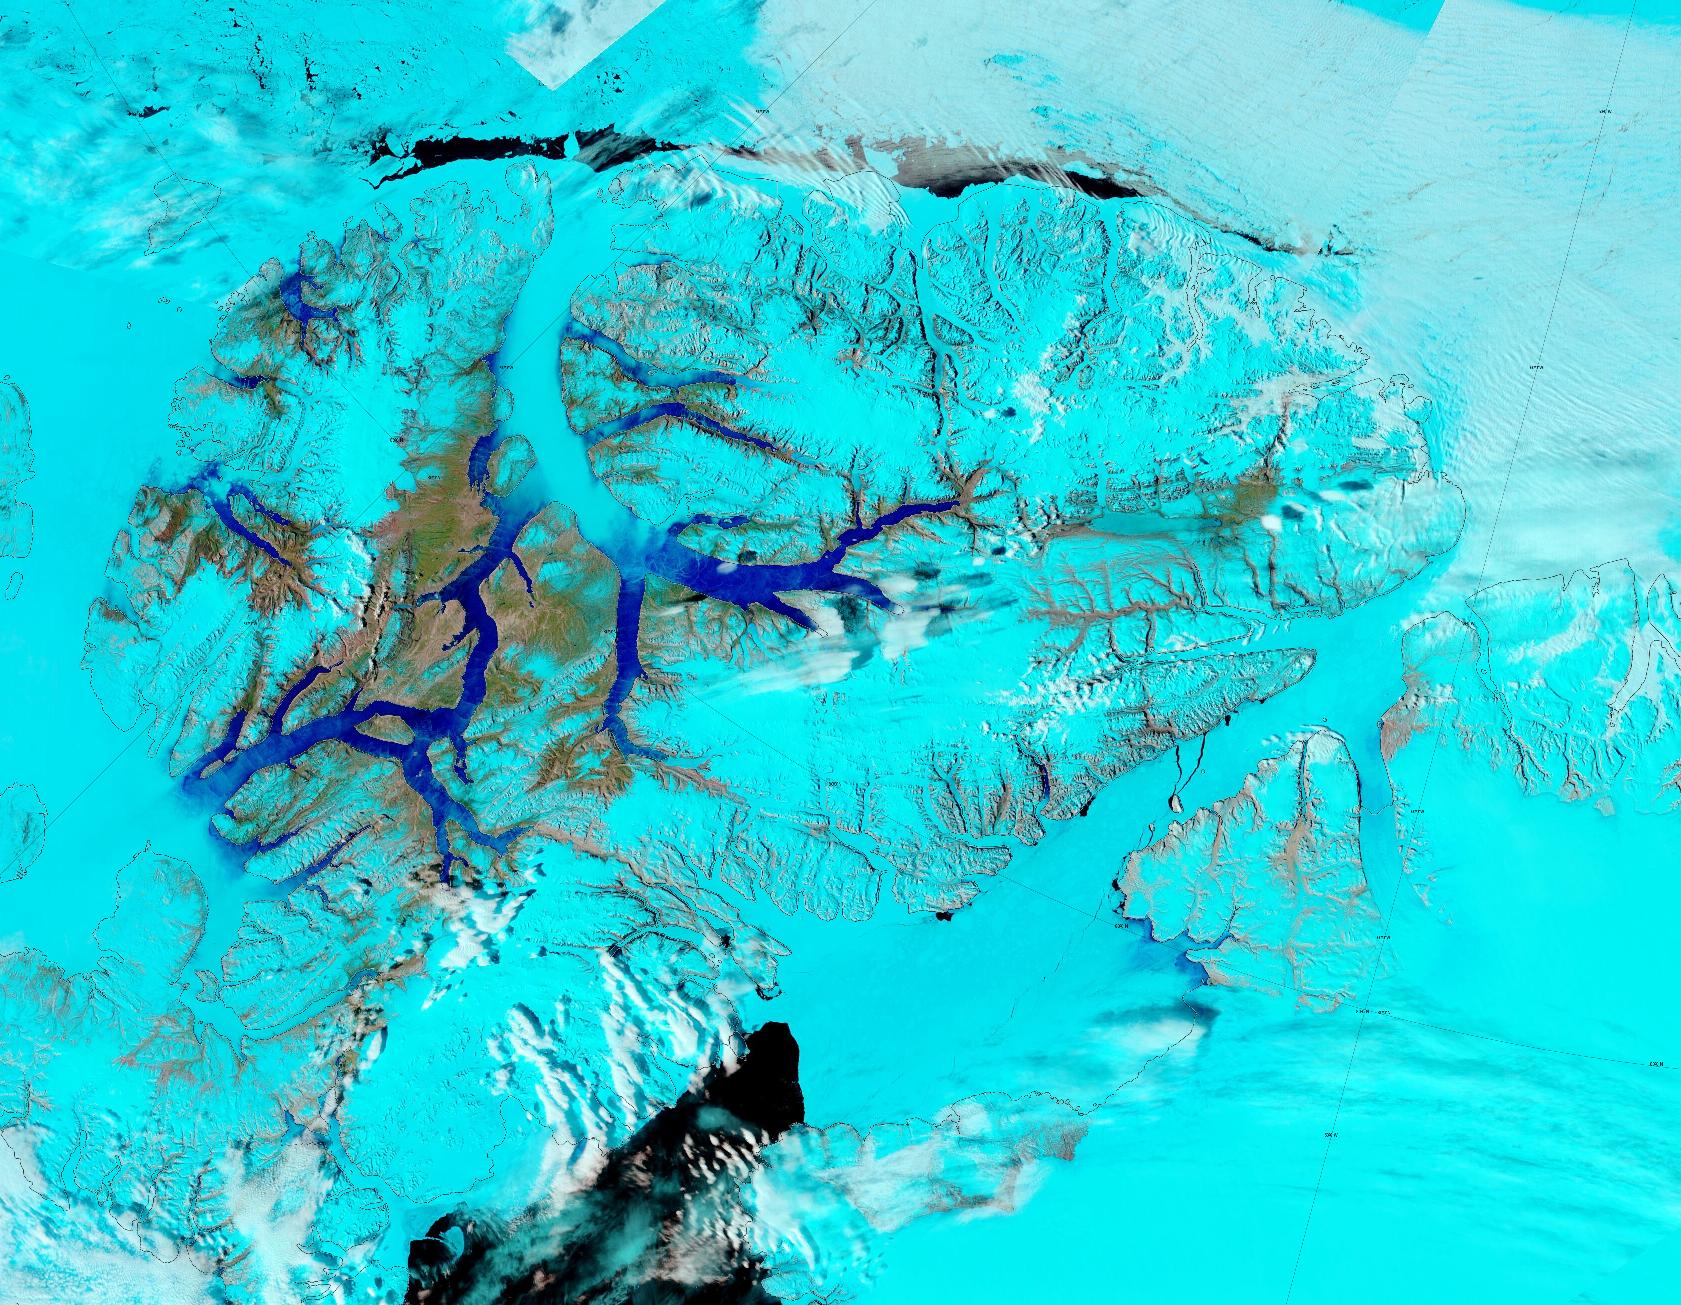
There are also large cracks visible in the (currently!) fast ice in the Nares Strait, and signs of surface melt beginning in the Kane Basin and on Petermann Glacier.
[Update – June 14th]JAXA extent is now higher than on the same day of the year in 2012 for the first time since February:
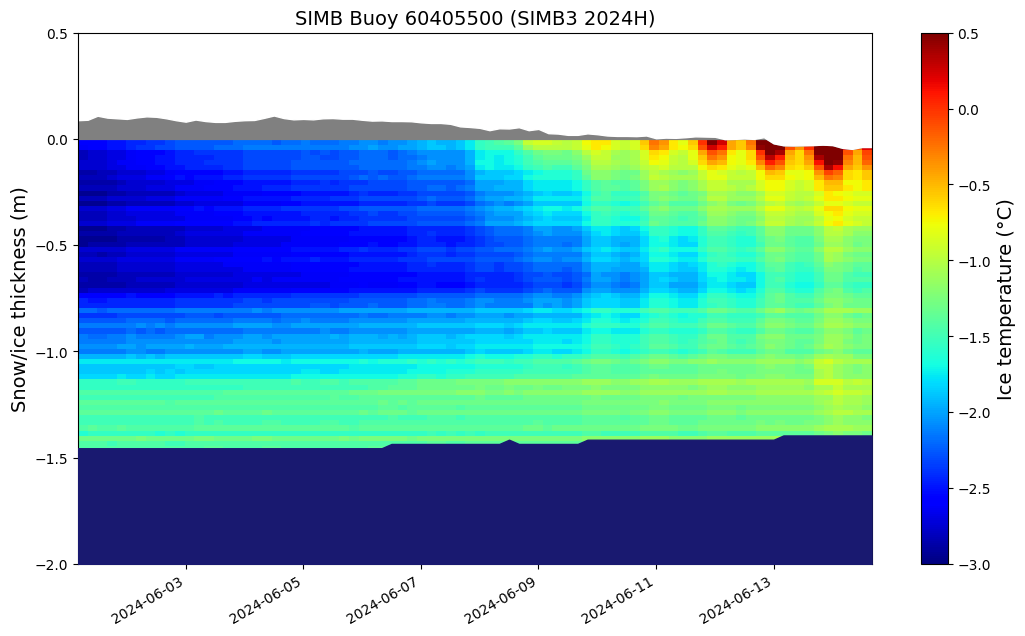
Ice surface melt has now started at buoys 2024F, 2024H and 2024I:
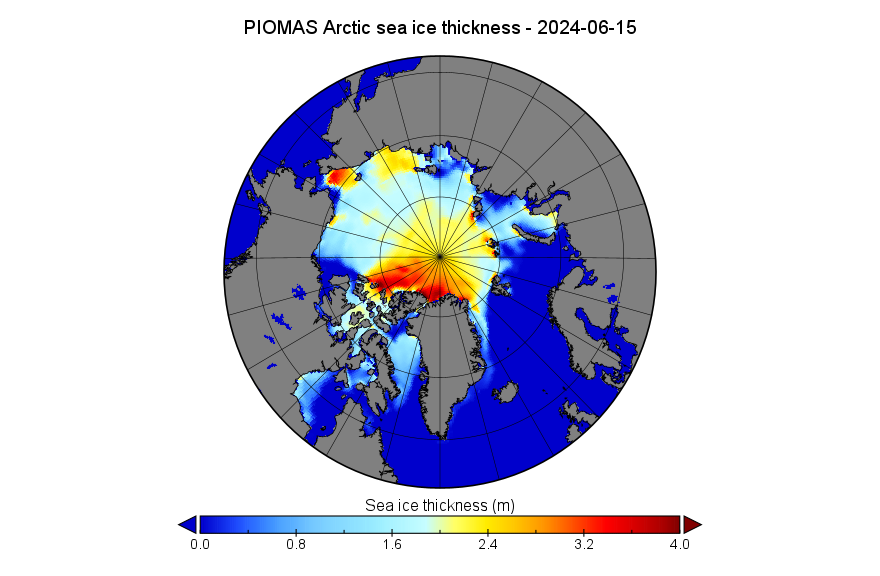
The mid month PIOMAS gridded thickness data has been published, so here is the PIOMAS thickness map for June 15th 2024:
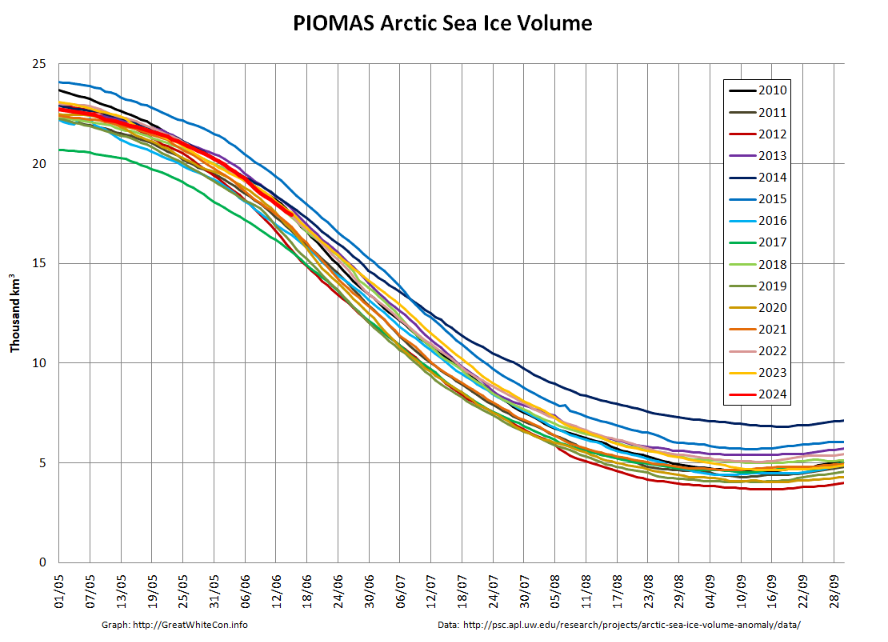
Here too is the mid month volume graph, currently 12th lowest for the date in the satellite era:
In this year’s first voyage along the entire Northern Sea Route, Arctic 7 class oil tanker Shturman Skuratov has entered the Laptev Sea heading for China:
The conversation continues over on the July open thread.
Looks like it could be a bad year for the Beaufort again (even this early on)
Which in my opinion is bad, the older ice on the other side of the arctic usually ends up out the Fram Straight
It looks that way to me too Tom. The Amundsen Gulf and Eastern Beaufort appear to be in a worse state than on the same date in 2012, for example.
arctic-news blogspot has a new post saying volume of arctic ice is at record low. Also comparing extent to area and concentration. Seems like extent is not the best indicator – unless someone is a DeNile-ist.
Extent is certainly not the only indicator, or indeed the best one. Particularly at this time of year.
Whilst DMI’s version may agree with Sam that the “volume of arctic ice is at record low” (for the satellite era), PIOMAS does not. See above.
And despite having it explained slowly on XTwitter by yours truly and Bremen University, Sam still bizarrely asserts that:
“The Uni of Bremen image on the left shows sea ice thickness in cm on June 11, 2024”
The Bremen web site states that:
So you’re saying it’s …. well if we keep reading on they clarify to only rely on a larger scale reading of both data sources combined?
“During the polar summers due to melting or other morphological changes of the sea ice surface that change the emisivity, the retrieved sea ice thickness will not be considered meaningful.
The resolution of both satellites is approximately 40~km, so just retrievals over this area or larger, should be considered to be correct. Due to the large resolution, the thin sea ice at the ice edge should be considered with care due to smearing effects. The same problem appears in coastal areas where the ocean pixels will be contaminated by land emissions, generating SIT all along the coasts. ”
Why else do they even post the data during the summer time period – outside those “accurate” reading months?
“Why else do they even post the data during the summer time period”
They don’t, on the main SMOS page at least. In the northern hemisphere summer it shows “thin ice thickness” in Antarctica.
However, if you know where to look the algorithm keeps running all year round. Folks on the Arctic Sea Ice Forum try to use the data as an indicator of “surface melt area” for example:
Fast ice in the Laptev taking a battering at the moment!
JAXA sea ice extent at month end was 163K sq.km. ABOVE the 2010’s mean.
What will happen through July?
arctic ice volume is a record low – therefore the extent is very thin.
https://arctic-news.blogspot.com/2024/07/temperature-rise-threatens-to-accelerate-even-more.html
Arctic ice volume…record low…”
Source? POIMAS doesn’t think so, see their report for June. No trend in 13 years…
Unlike PIOMAS, DMI’s modelled volume has been consistently low this year:
Yes, Jim, DMI volume has been low this year, but the statement I was refuting was that it was a ‘record low’. The graph only shows the past 4 years, which were certainly higher, but none were records.
DMI’s user interface is less than ideal for these purposes, but it looks like a “record” low for the date to me Taylor?
Thanks for the charts, Jim. I stand corrected on DMI volume. However, since I usually follow PIOMAS for these numbers, I think this DMI result makes Tom’s question a good one. As with extent, area and global avg temp, it’s a bit frustrating to have so many sources of ‘data’ that disagree so widely…
Maybe a question for the ASIF, but why do PIOMAS and DMI have such different results for the sea ice mass?
From PIOMAS:
“June 2024 Monthly Update
Average Arctic sea ice volume in June 2024 was 17.4 103 km3. This value is the 12th lowest on record for June, about 2.0 103 km3 above the low record set in 2017.”
Arctic sea ice extent is above the low of 2012 despite the “global boiling” how do you explain that?
I suppose one might ask why global sea ice extent is above 2023… Which by a margin was the lowest ever.
Never heard of any major bodies of water boiling away myself!
It’s not the middle of September yet!
However, JAXA extent is now below the same day of the year in 2012.
NSIDC area has been within touching distance for a “record low for date” these last few days too!