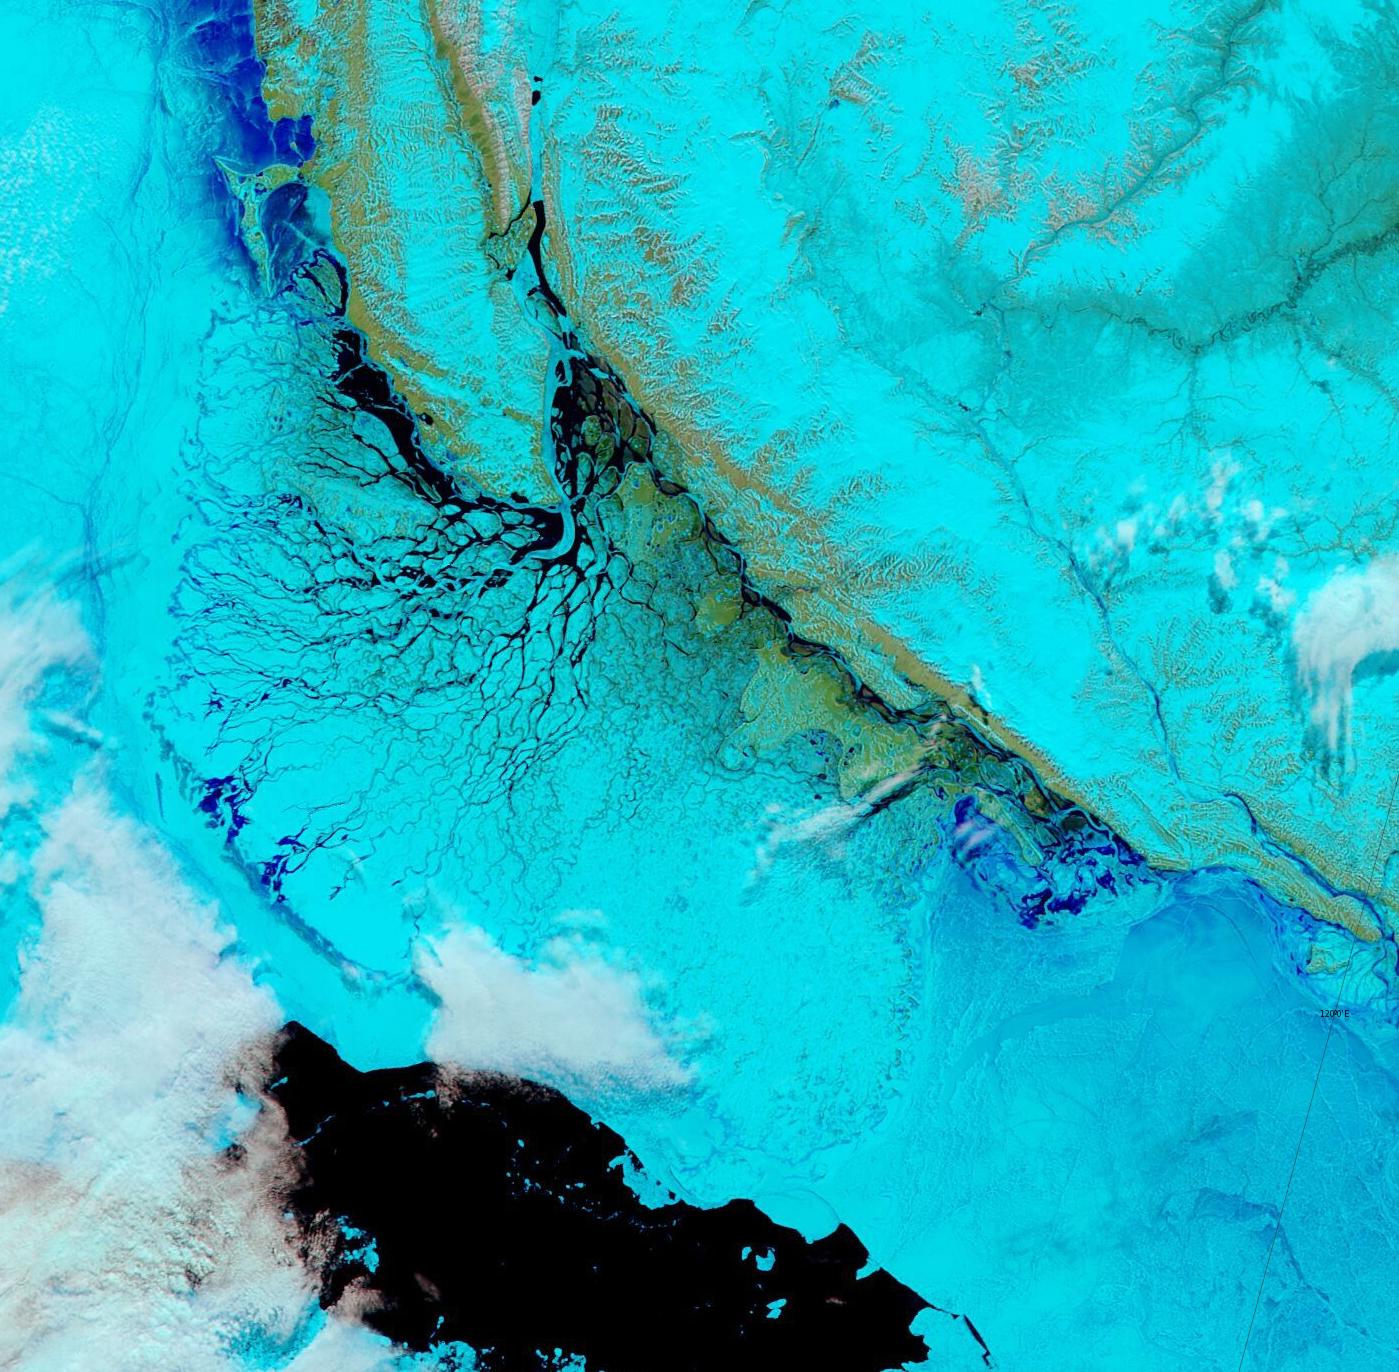
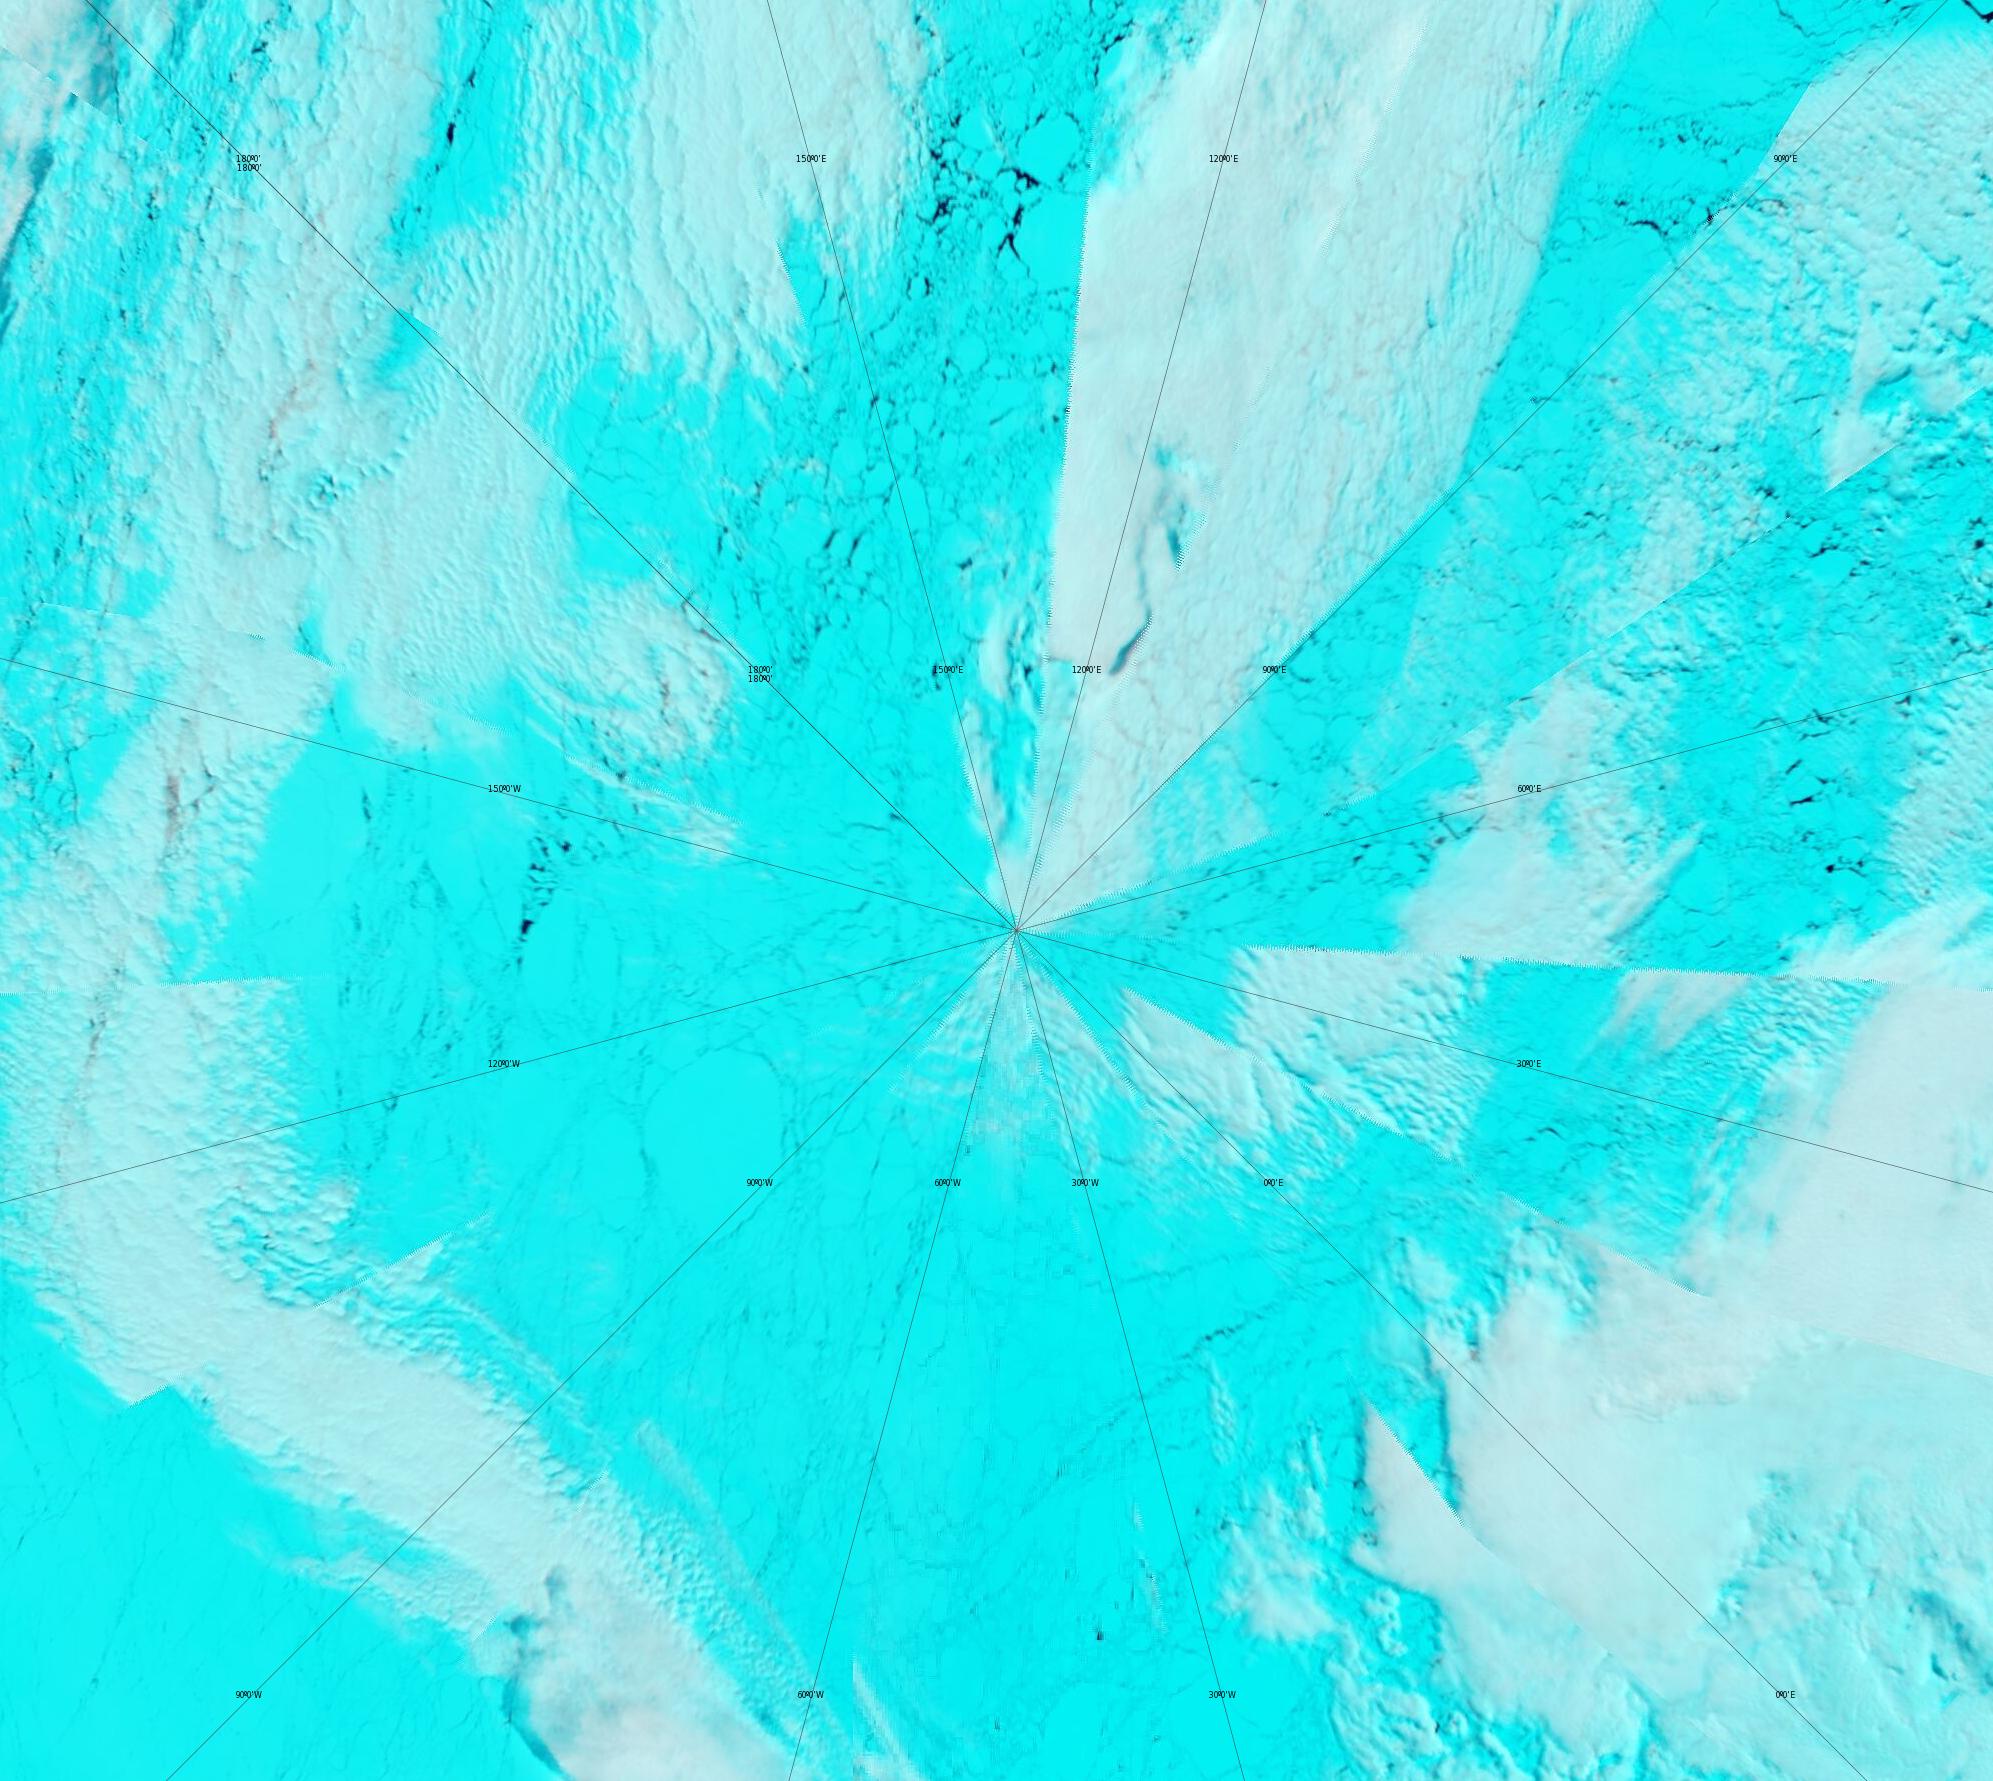
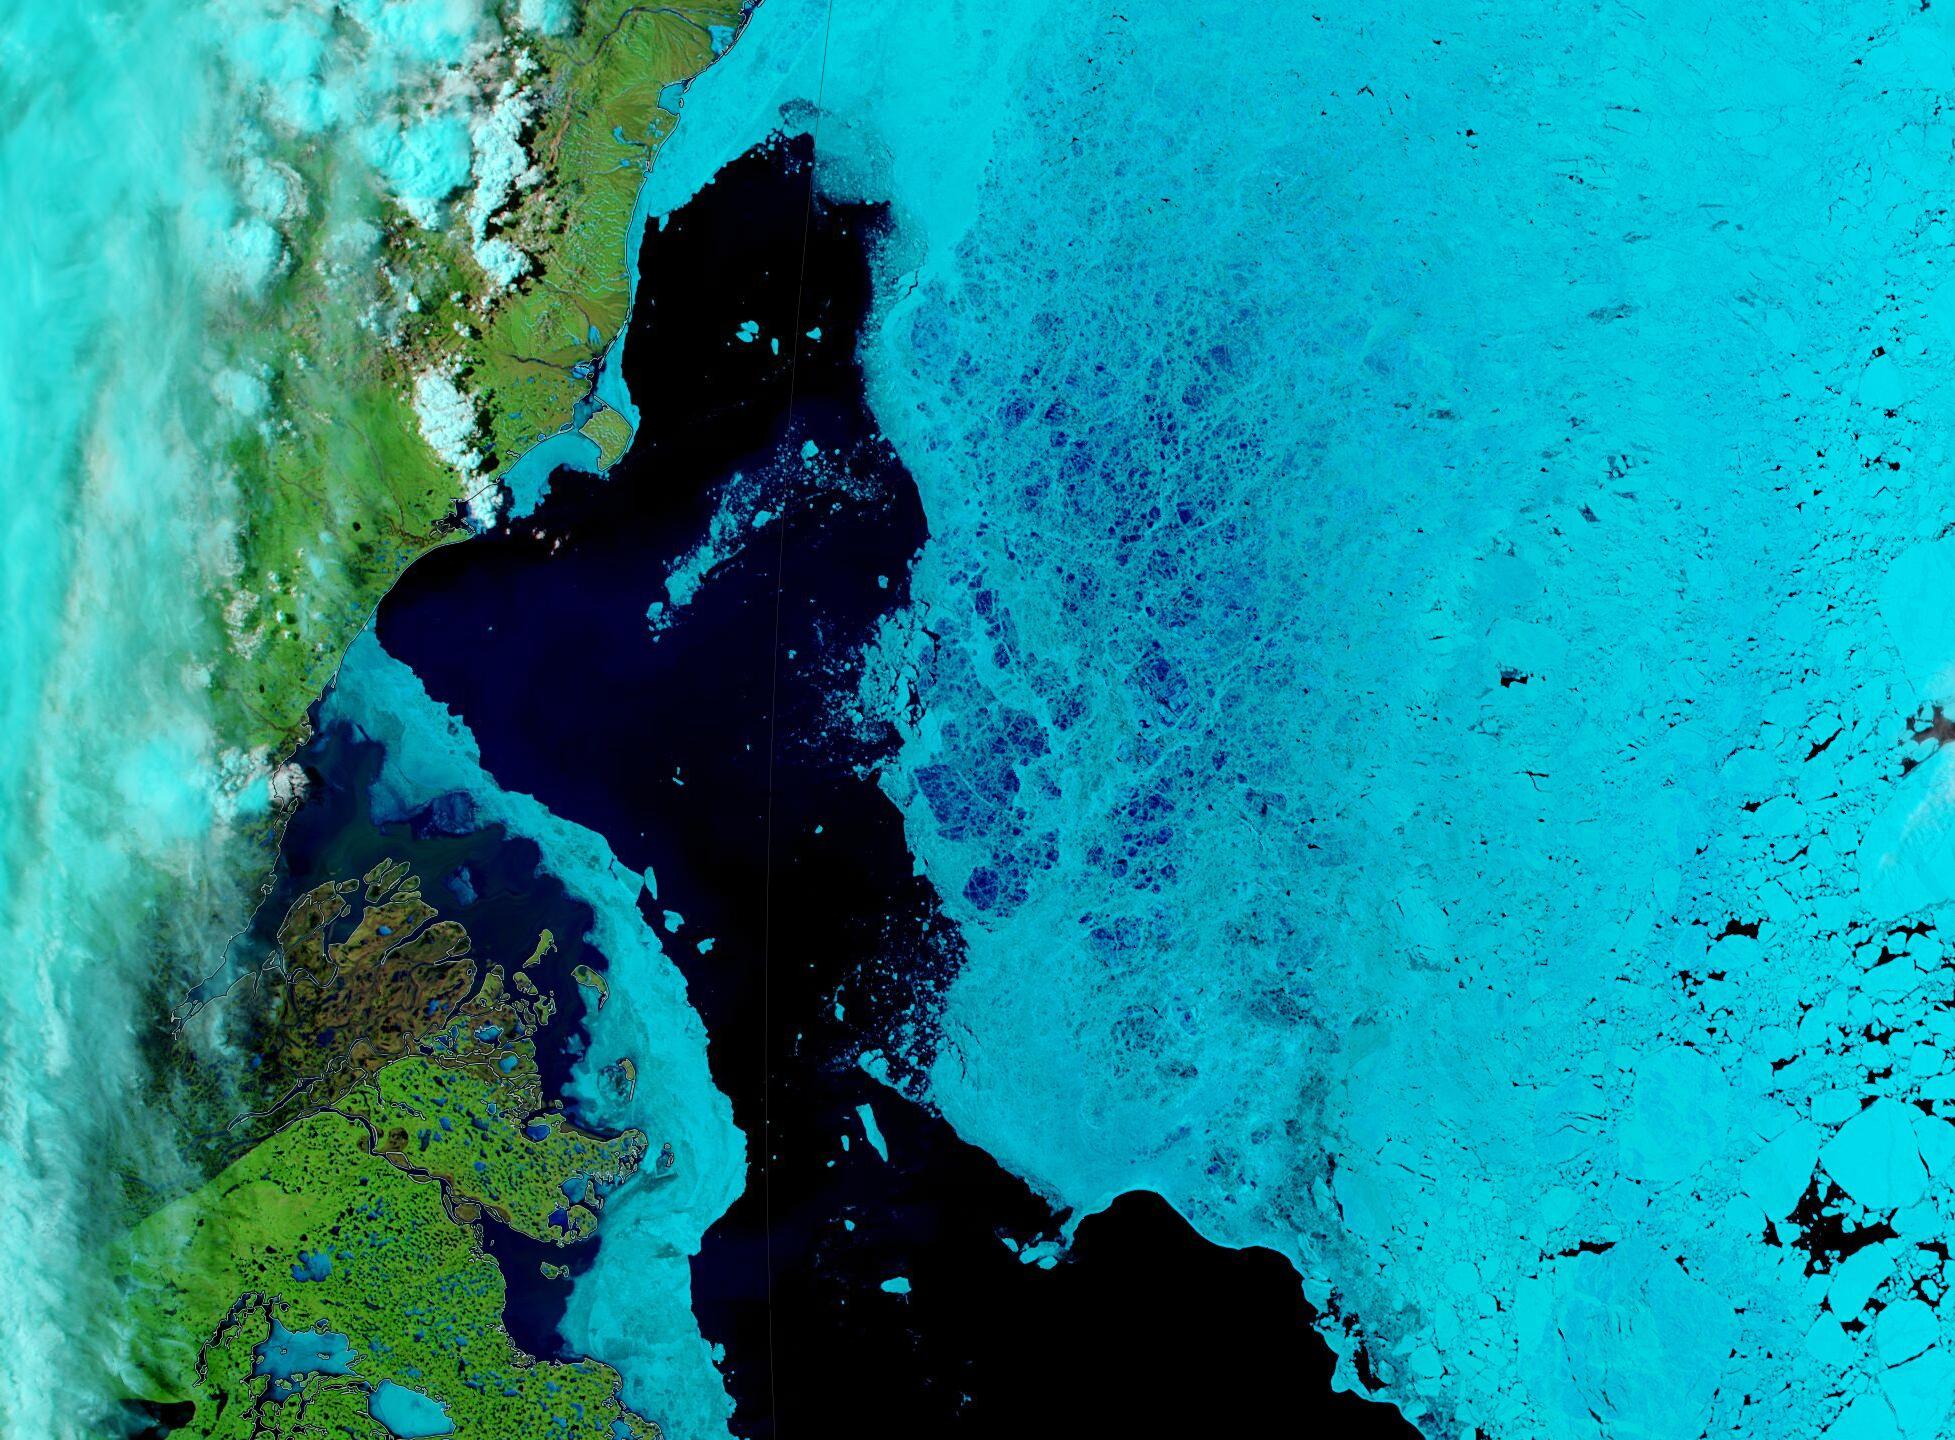
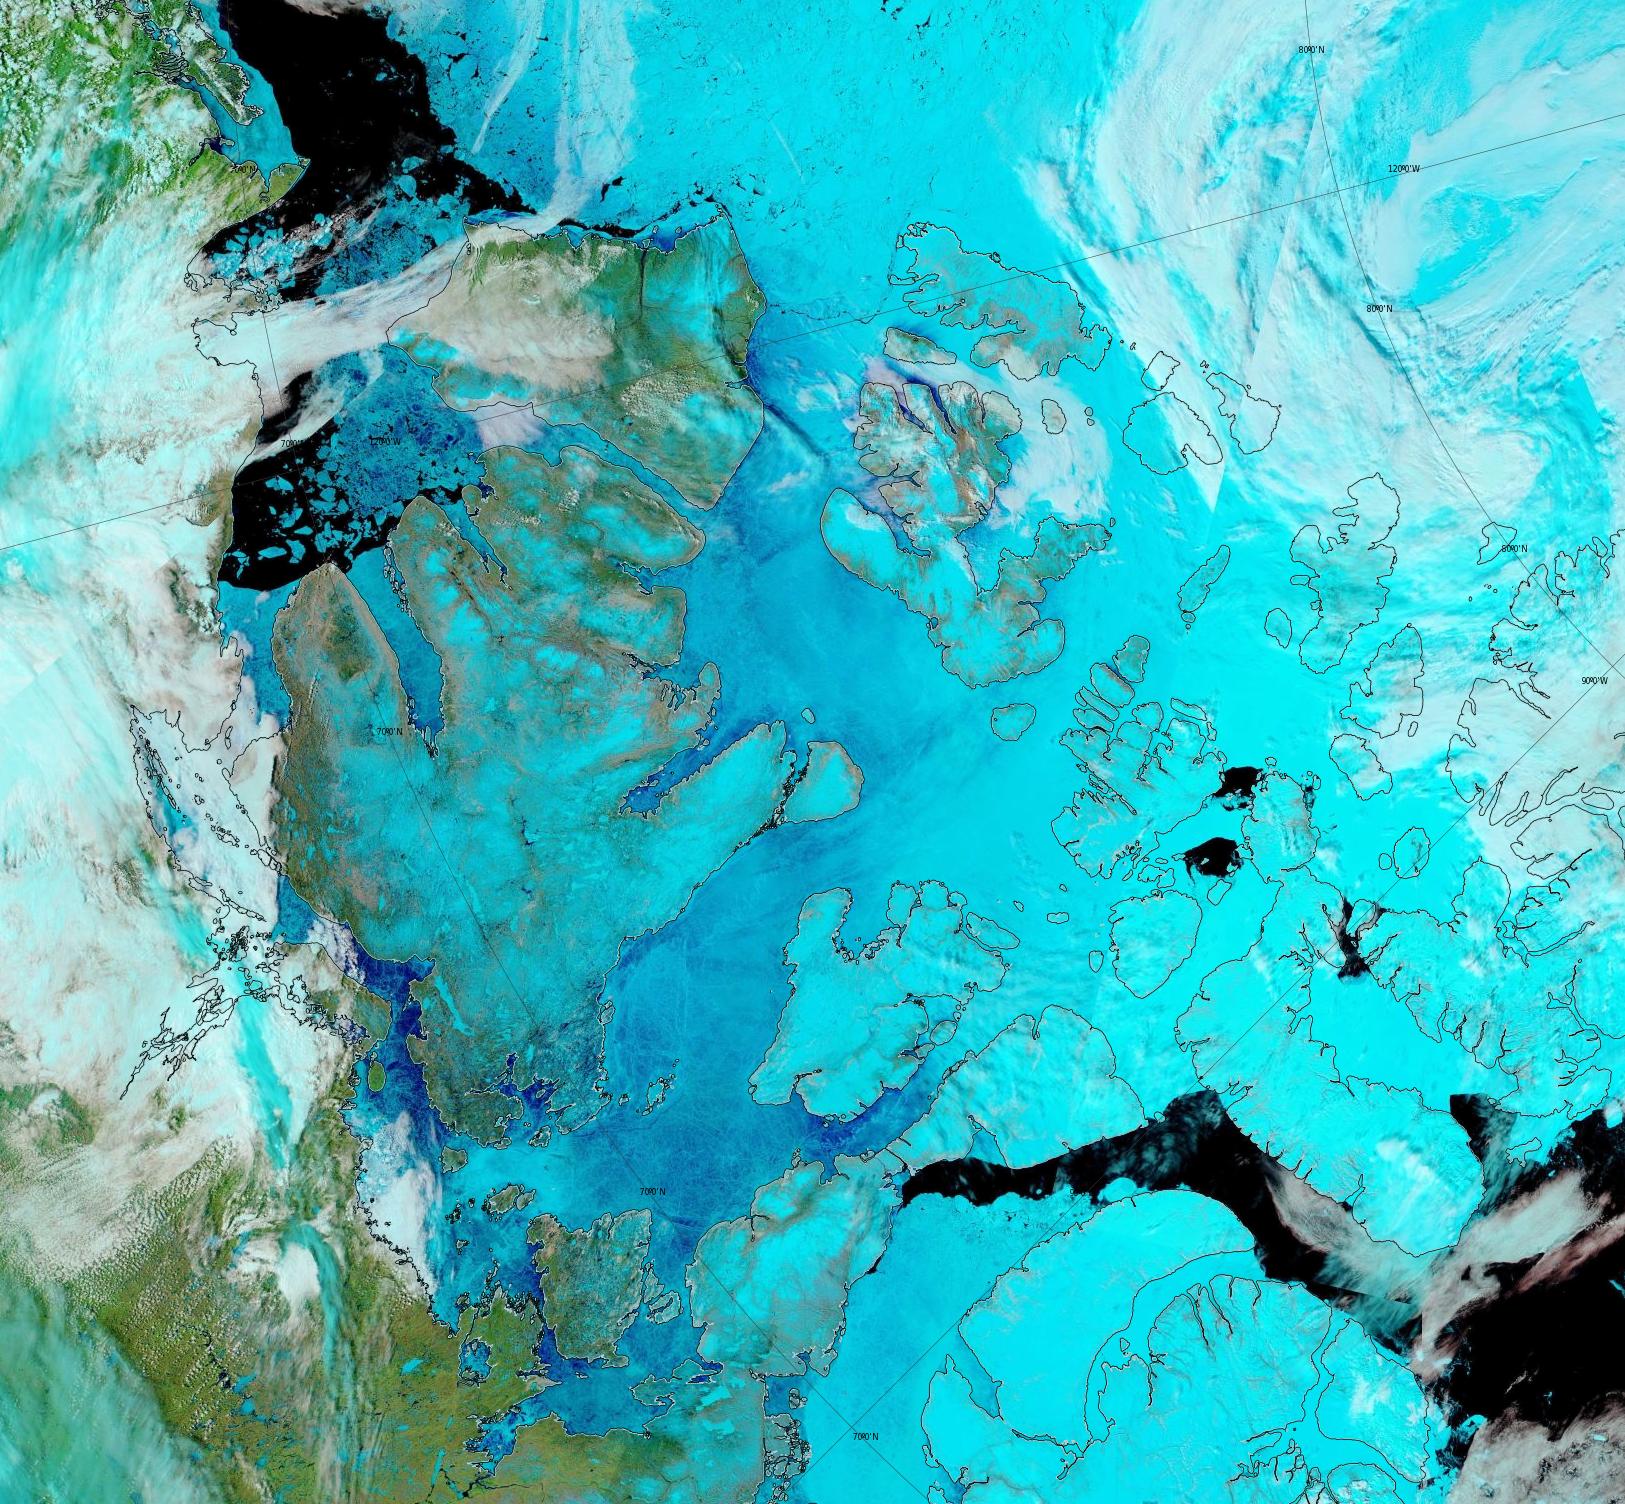
By way of a change, which is allegedly as good as a rest, let’s start the new month with a very pretty and almost cloud free “pseudo-colour” image of the Lena Delta and adjacent areas of the Laptev Sea:
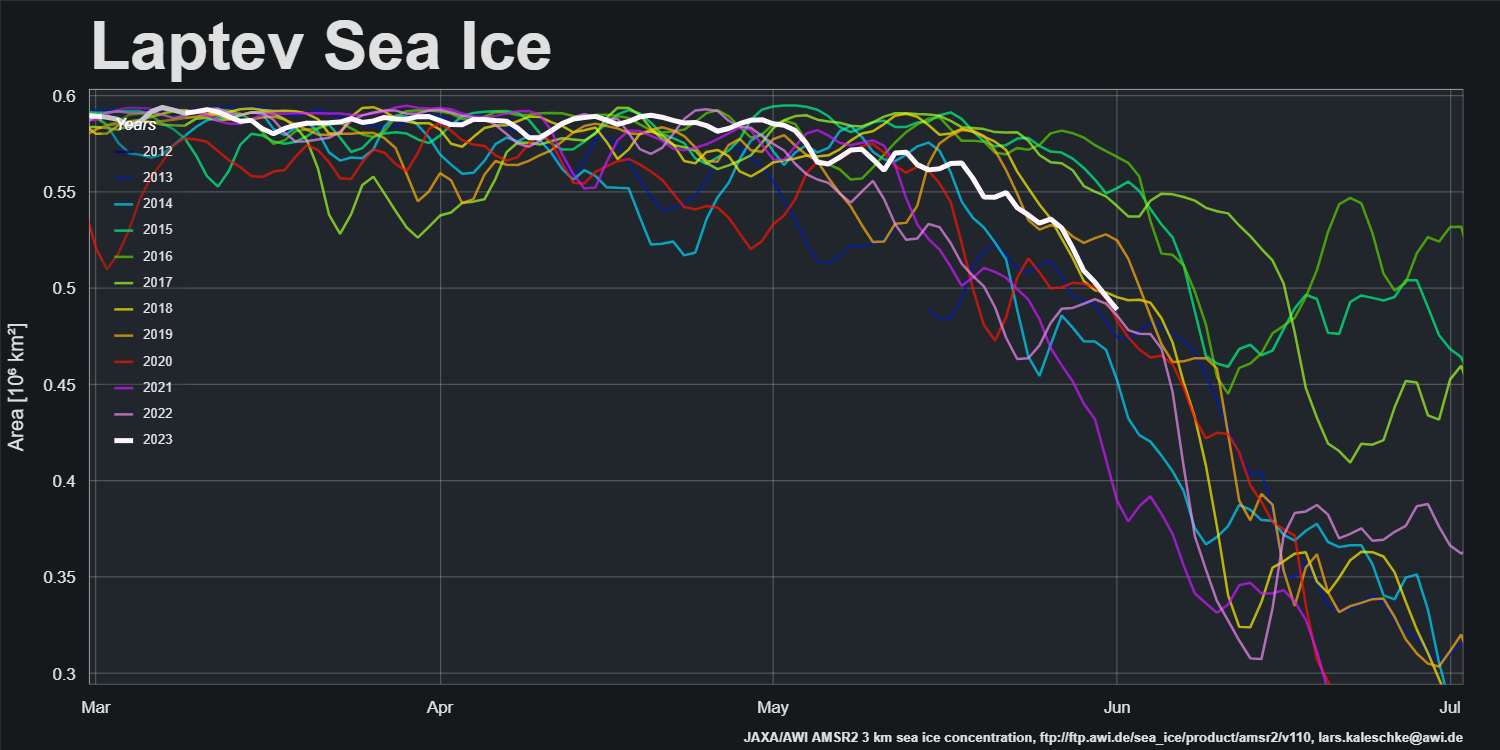
Laptev sea ice area decline has been in high gear recently:
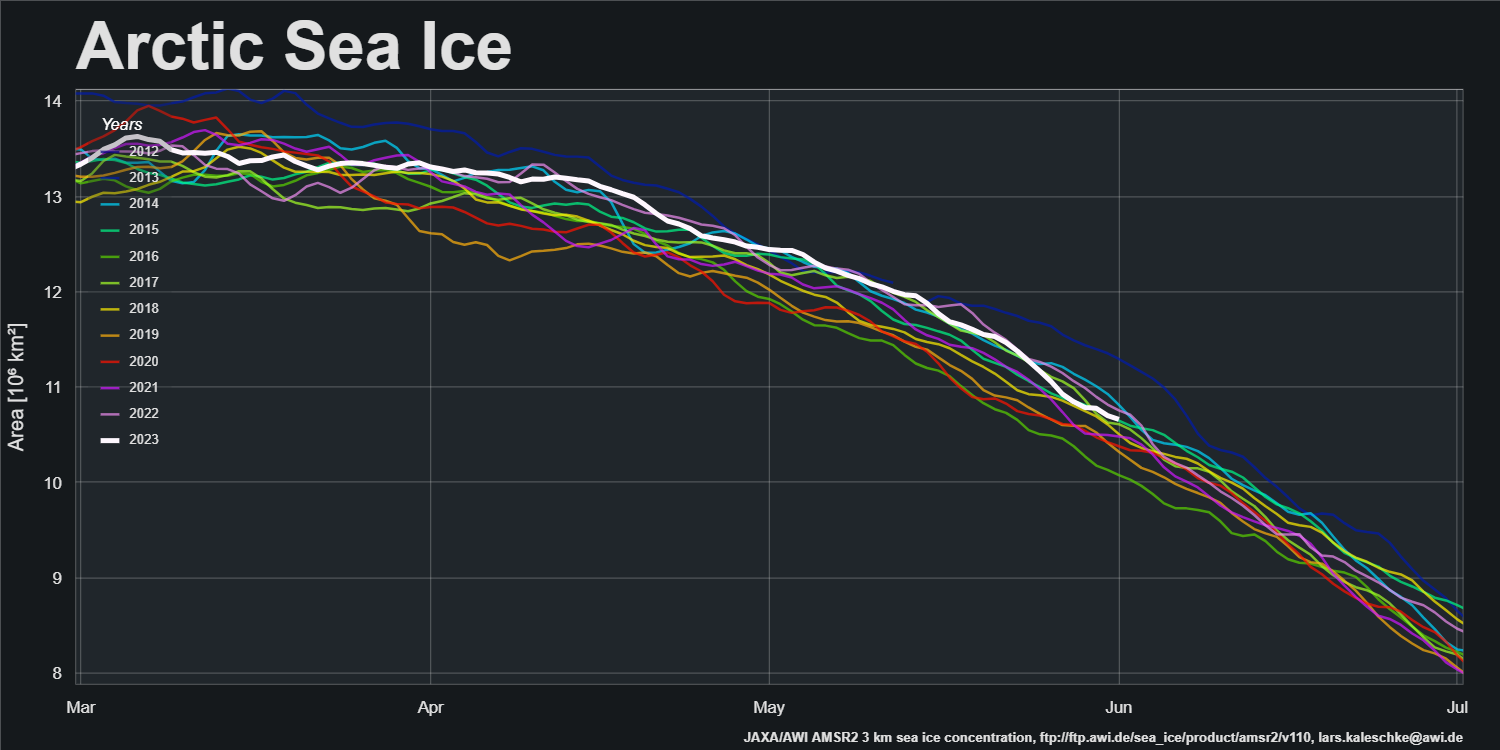
Sea ice area for the Arctic as a whole is still in the upper half of the AMSR2 era range:
Finally, for the moment at least, here is the final DMI high Arctic freezing degree days graph for 2022/23:
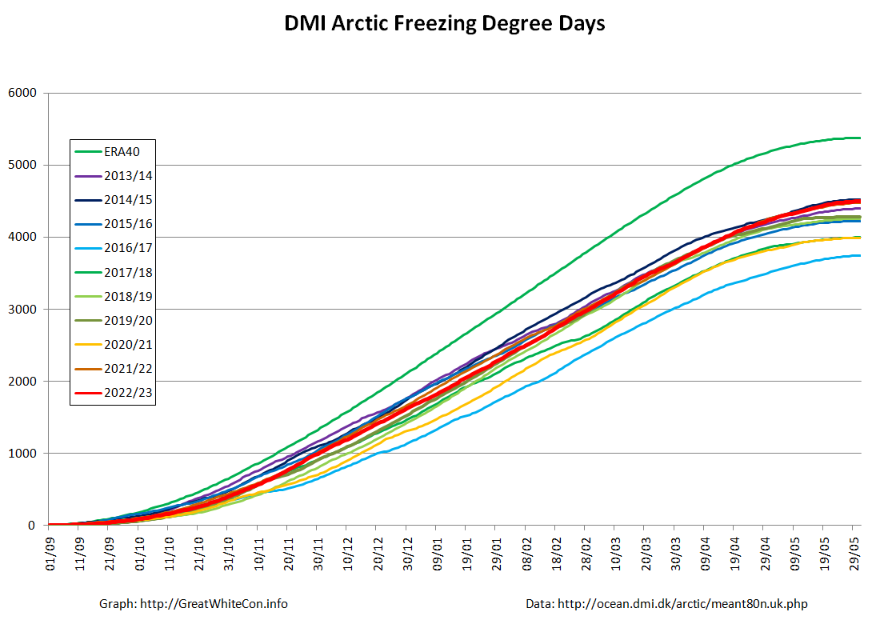
It’s been a bit on the chilly side near the North Pole this winter!
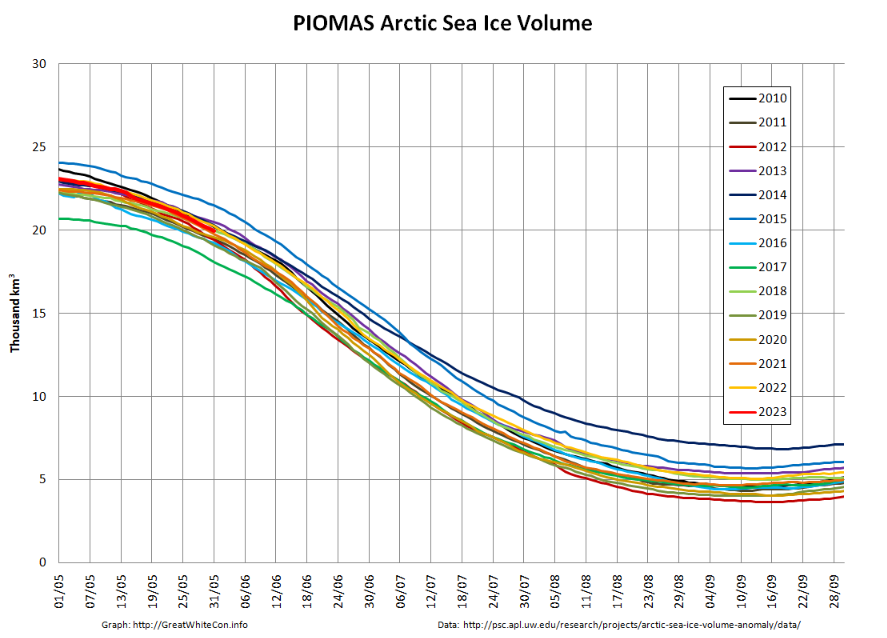
[Edit – June 4th]The PIOMAS gridded thickness data for May show that modelled Arctic sea ice volume had dropped to 19,949 km3 by May 31st, which is 8th lowest in the satellite era:
Here too is the PIOMAS thickness map for May 31st:
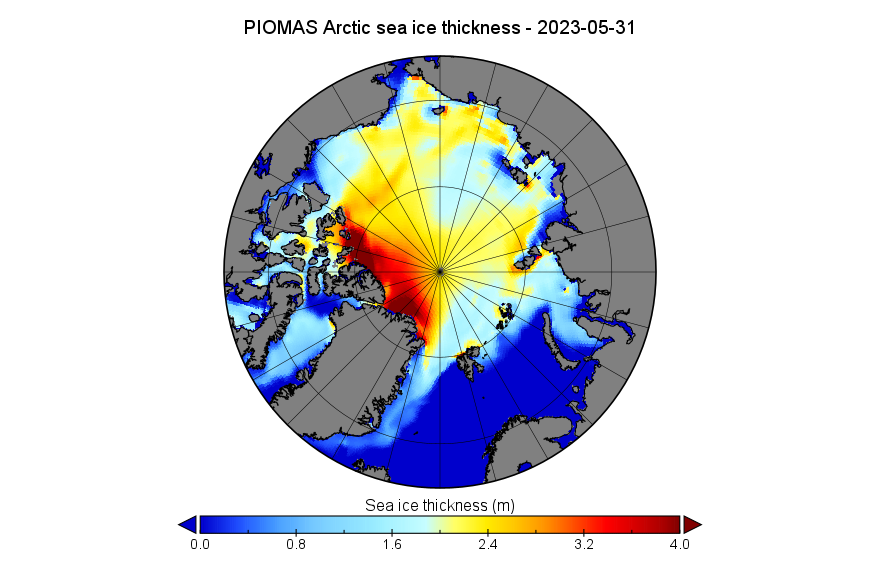
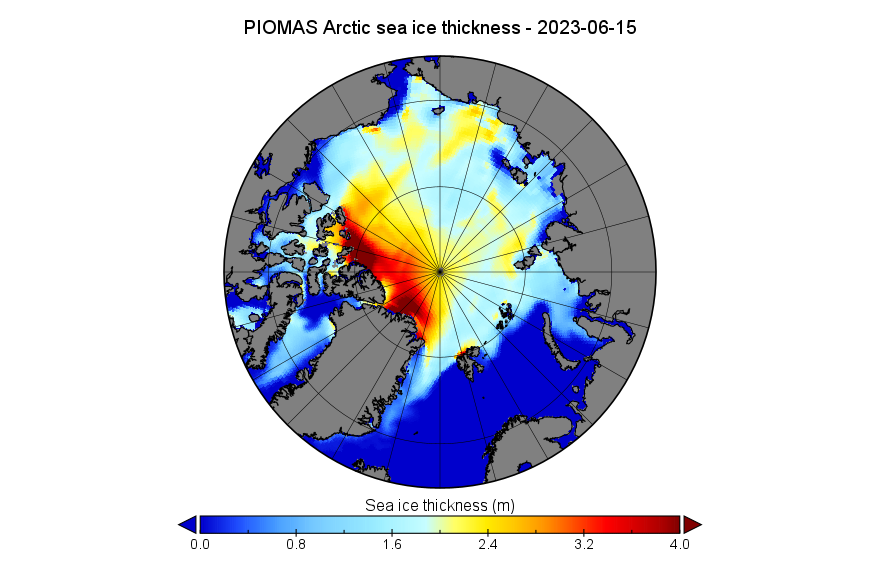
Within the Arctic Basin it shows large areas of thinner ice in the Laptev Sea and eastern Beaufort Sea.
[Edit – June 10th]The southern arch in the Nares Strait has collapsed:
and there is plenty of open water in the Lincoln Sea near the northern entrance to the Strait:
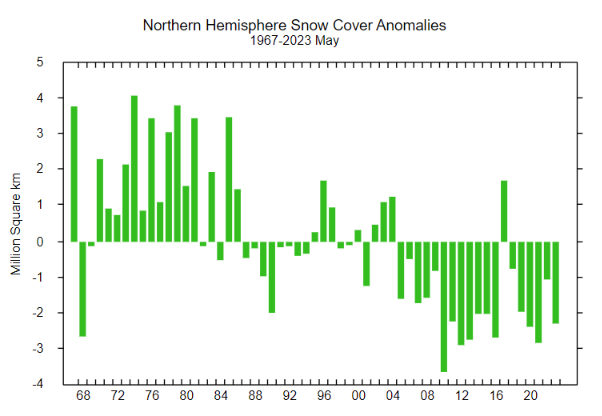
In other news, northern hemisphere snow cover has crashed in May, after being near the 1981-2010 average in April:
A glimpse of the North Pole from on high:
The remaining ice off the Mackenzie Delta doesn’t have long to live:
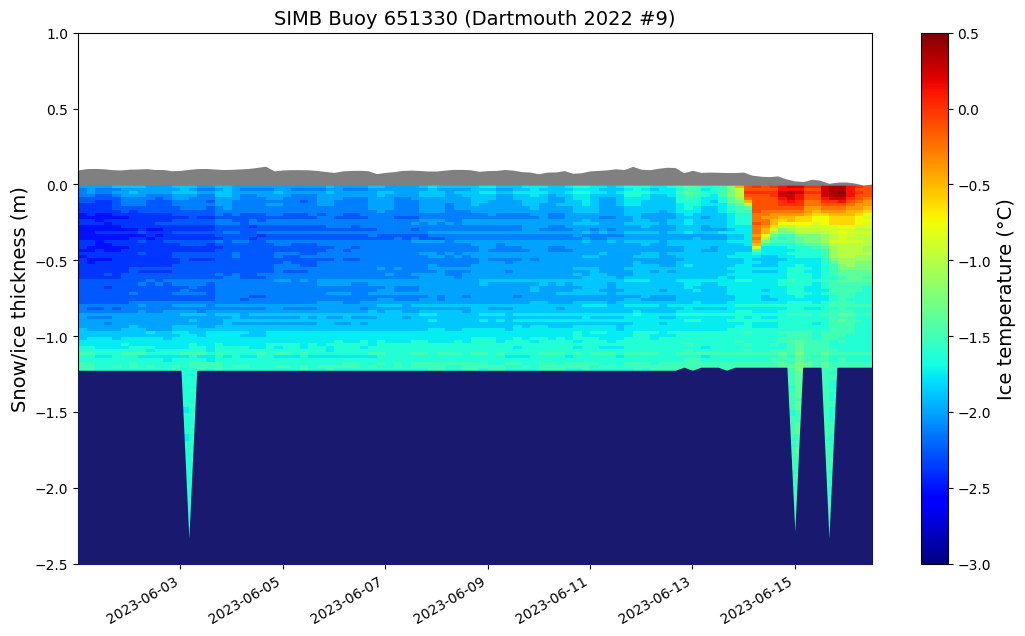
Surface melt has started in the western Beaufort Sea at 75.17 N, 152.31 W, the location of ice mass balance buoy 651330:
Surface melt is also now visible across much of the Canadian Arctic Archipelago:
Somewhat belatedly, here is the PIOMAS mid month map of Arctic sea ice thickness:
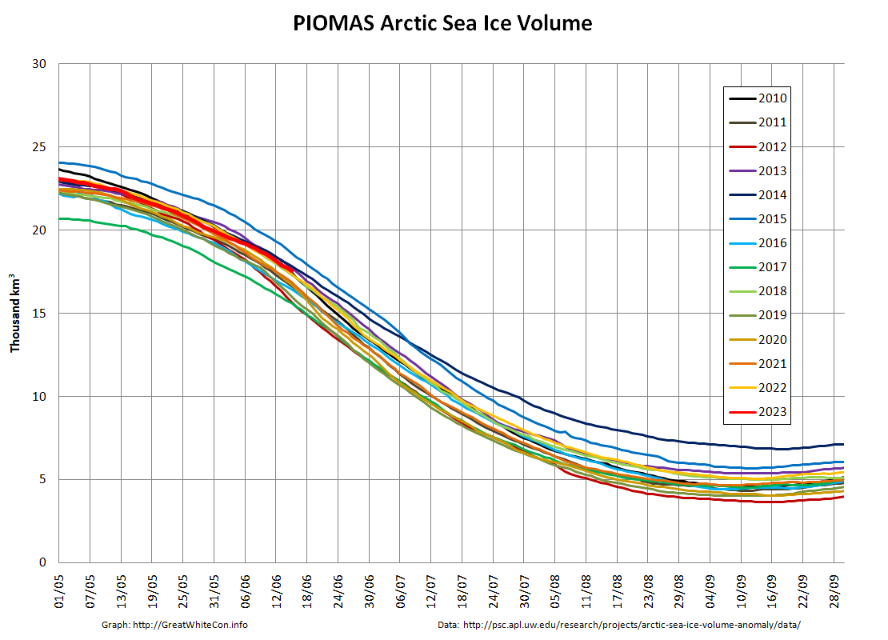
plus the volume graph up to June 15th:
Further news is now available on the July open thread.
the Advanced Microwave Scanning Radiometer 2) ice extent and ice edge in the Arctic… Jennifer MacKinnon was quoted in a California news story as claiming the arctic ice could be gone in a year – during the summer – but the interview with her never has her saying this. It made me skeptical – I think the local news reporter got “decade” mixed up – MacKinnon meant in one decade. I emailed her about it to get a clarification – and I received no response.
Peter Wadhams says parts of the arctic are heating up 7 times faster than the rest of the planet, and scientists are not discussing this since there’s no known real cause. I guess the ocean heat now is so strong that the “heat blobs” from both sides, Pacific and Atlantic, are doing their thing.
Since multiyear ice is almost all gone – it seems like it would be easier for the extent to go very fast. What do you think of this possibility? Jennifer Francis seems to think this is also possible.
I think it is warming 7 times faster, because there is no sold ice. Then the ocean surface temperature is stuck in the latent heat phase. I think this will happen to the entire Arctic ocean in a very short time and after a blue ocean event the latent heat phase is replaced by sensible heat and there will be a warming spike. This spike will cause a refreezing delay according the superposition principle in thermodynamics. And Arctic will be ice free within 5 years after first blue ocean event in the winter as well, because the refreezing delay will double every year.
I’m looking with anticipation to the PIOMAS release for May. DMI dailies have volume plummeting during May, while extent stays (somewhat) high. If both situations are true, then average thickness is significantly down. I would expect extent to start plummeting as well. Thoughts, Jim? Any projections for end of June?
I for one predict the North West passage could open early, it’s been warm there, maybe some of the thicker ice is melting there!
Here you go Tom:
https://GreatWhiteCon.info/2023/06/the-northwest-passage-in-2023/
The & times faster area heatin lately is a jet stream vortex effect and it and others are rekeying off greenland as the laten ice play less a role and othe rfactors chime in….a loose jet stream makes averages more deceptive and the lag times of tipping points give rise to false predictions….The ice sheet as such is changing In baffin bay 10% of the extent…..so regional contrats emerge.
This could be dramatic: those graphs of the Laptev here and the CAA in your other article seem mighty interesting, Jim.
I believe there was a thickness graph perhaps on the forum showing nothing serious yet apart from its starting value.
Australia, or atleast the Western bit where I am, started off its winter a bit warm so I wonder if that forebodes?
(Bugger all rain as well but some nice ️ ⚡ to make up for it.)
What is the score on multi-year ice I wonder because people are saying there’s been no decent floes yet but deterioration is absolutely visible: multi year ice you would expect be saying a fast break up this June is on the cards.
I wait with mouth agape… Should be good sattelite viewing I say from here on in for awhile, if you’re into drama that is.
The Arctic extent record for May would have to be surmised as 2016, 2018, 2019 representing outlier years to a decades long trend of stable numbers in May, imho.
Is that fair?
This would be expected to continue for the foreseeable future! Would that also be a fair comment?
Lol, I didn’t even mention PIOMAS.
Mama Mia… Put your raybans on fellas…
The skies were clear over the Lena Delta again this morning:
Jan.31.—-16th.lowest. +333,064 sq.km. above 2010’s average.
Feb.28.—-11th.lowest +116,764 sq.km. above 2010’s average
Mar.31.—-10th.lowest -127,470 sq.km. BELOW 2010’s average
Apr. 30.—-14th.lowest +16,886 sq.km. above 2010’s average
May. 31.—15th lowest +395,097 sq.km. above 2010’s average
Jun. 30.—–10th.lowest +35,744 sq.km above 2010’s average
Jul. 31.—–12th lowest +228,905 sq.km. above 2010’s average
Aug.31.—-11th.lowest +203,902 sq.km. above 2010’s average
Sep.30.—-–7th lowest +115,918 sq.km. above 2010’s average
Oct.31.– 11th lowest, +269,119 sq.km. above 2010’s average
Nov30.——5th lowest, -183,803 sq.km. BELOW 2010’s average
Dec.31—–4th.lowest,-138,700 sq.km. BELOW 2010’s average
Jan.31—-2nd.lowest, -302,000 sq.km. BELOW 2010’s average
Feb.28——9th.lowest, -36,000 sq.km. BELOW 2010’s average
Mar.31—–7th.lowest, -274,000 sq.km. BELOW 2010’s average
Apr.30—–11th.lowest, +50,500 sq.km. above 2010’s average
May 31—-11th.lowest, +124,000 sq.km. above 2010’s average
June 9—–12th.lowest, +254,000 sq.km. above 2010’s average
The May sea ice extent remained above 2010’s average to month end, but significantly lower than 2022.
So far, the June sea ice extent has remained well above the 2010’s average.
Well, PIOMAS is out, and proves once again my poor skil as a forecaster. The early dip in the DMI numbers recovered, and once again PIOMAS sees no trend for the last 12 years, although they are rewording that claim a bit – guess it was getting monotonous. I was convinced that the rather high extent meant the ice was thin and would quickly melt. That might still happen, but clearly not yet. June should be interesting…
2022
Jan.31.—-16th.lowest. +333,064 sq.km. above 2010’s average.
Feb.28.—-11th.lowest +116,764 sq.km. above 2010’s average
Mar.31.—-10th.lowest -127,470 sq.km. BELOW 2010’s average
Apr. 30.—-14th.lowest +16,886 sq.km. above 2010’s average
May. 31.—15th lowest +395,097 sq.km. above 2010’s average
Jun. 30—-10th.lowest +35,744 sq.km above 2010’s average
Jul. 31.—–12th lowest +228,905 sq.km. above 2010’s average
Aug.31.—-11th.lowest +203,902 sq.km. above 2010’s average
Sep.30.—-–7th lowest +115,918 sq.km. above 2010’s average
Oct.31.– 11th lowest, +269,119 sq.km. above 2010’s average
Nov30.——5th lowest, -183,803 sq.km. BELOW 2010’s average
Dec.31—–4th.lowest,-138,700 sq.km. BELOW 2010’s average
2023
Jan.31—-2nd.lowest, -302,000 sq.km. BELOW 2010’s average
Feb.28——9th.lowest, -36,000 sq.km. BELOW 2010’s average
Mar.31—–7th.lowest, -274,000 sq.km. BELOW 2010’s average
Apr.30—–11th.lowest, +50,500 sq.km. above 2010’s average
May 31—11th.lowest, +103,000 sq.km. above 2010’s average
Jun.30— 11th.lowest, +81,754 sq.km. above 2010’s average
Last year, the June sea ice extent fell dramatically in June.
This year, the June sea ice extent has remained well above the 2010’s average.
The June 2023 sea ice extent was greater than all the years since 2010, except 2015 and 2018.
June 2023 was 81,754-35,744 = 46,010 sq.km. higher than June 2022
What will happen in July?
We have seen a few “Century break” drops in extent the last week or so on the JAXA metric, catching up somewhat with recent years.
I note Climate reanalyser is forecasting a lot of warmth coming from Alaska over the next week.
I would expect a decline in Volume in July,at least, as the thickest ice will take the brunt of the heat.