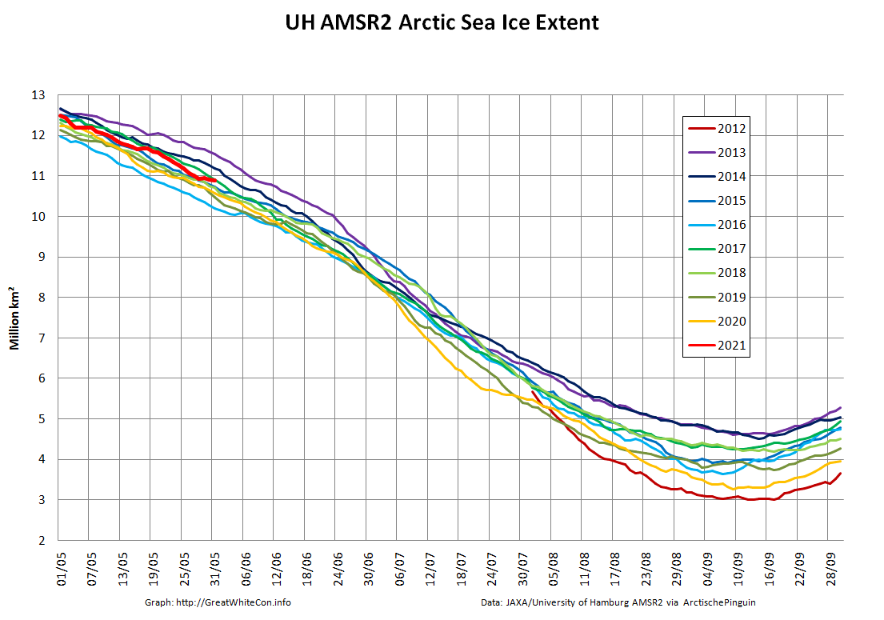
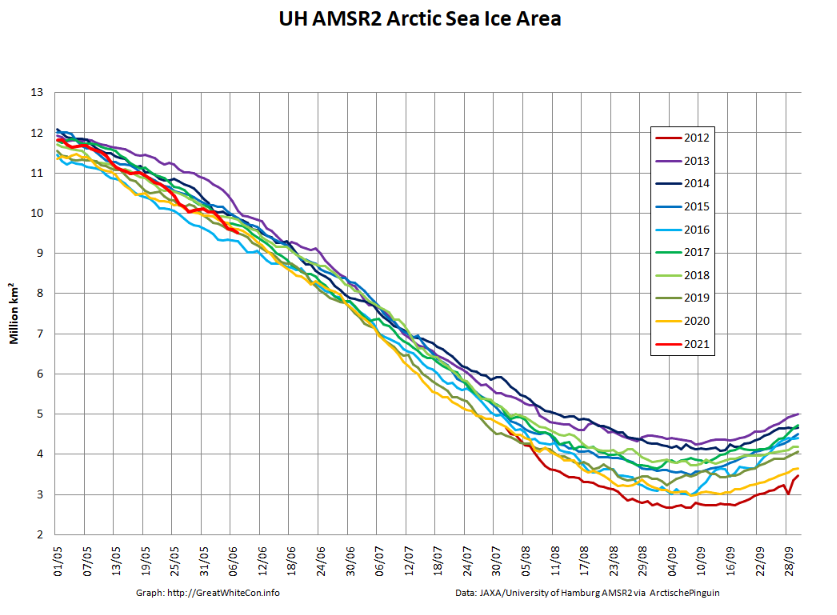
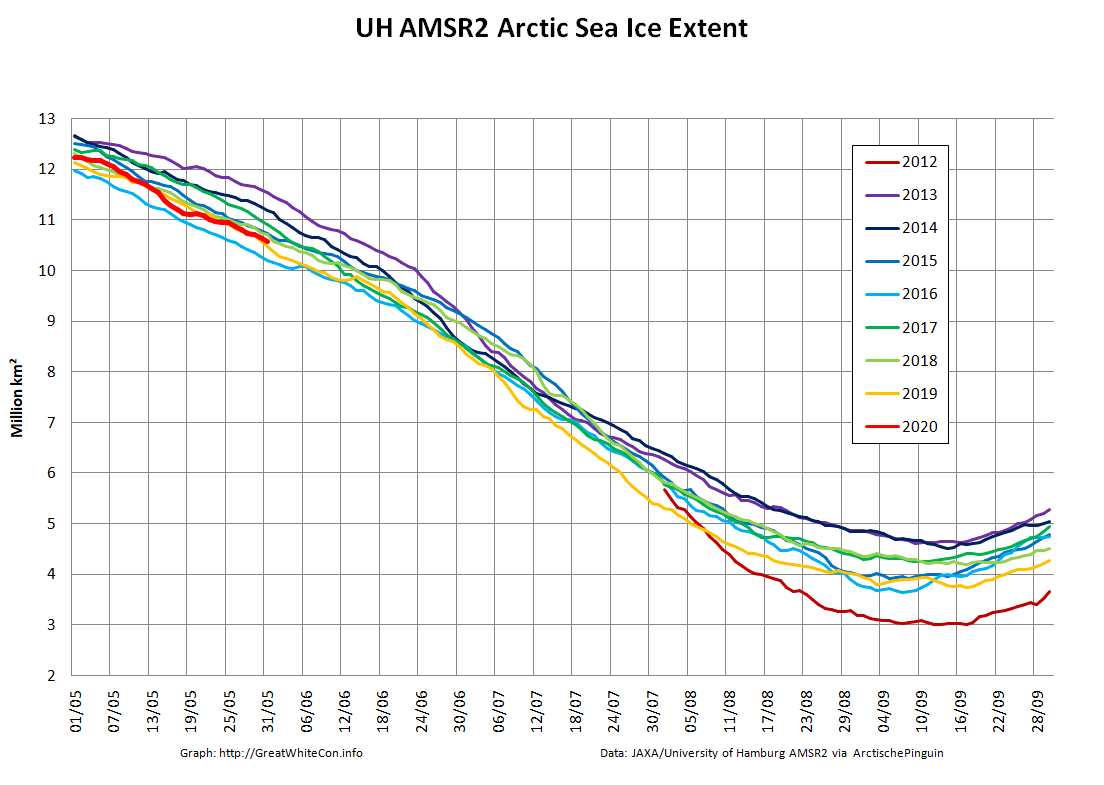
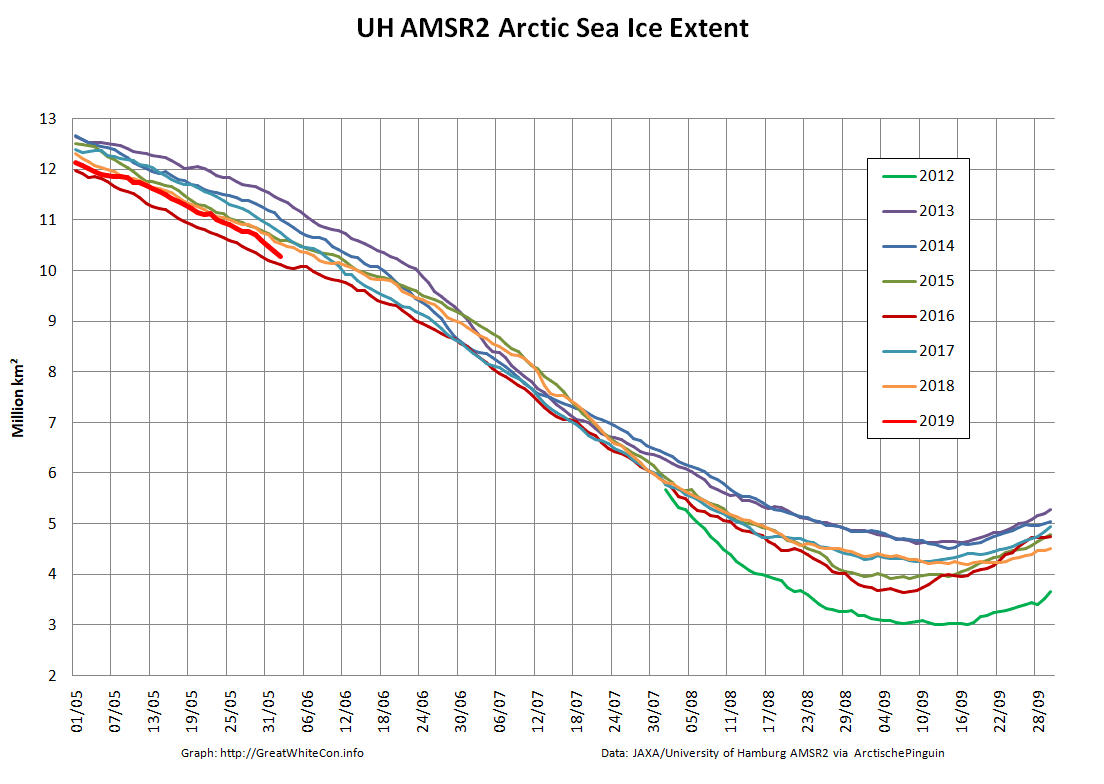
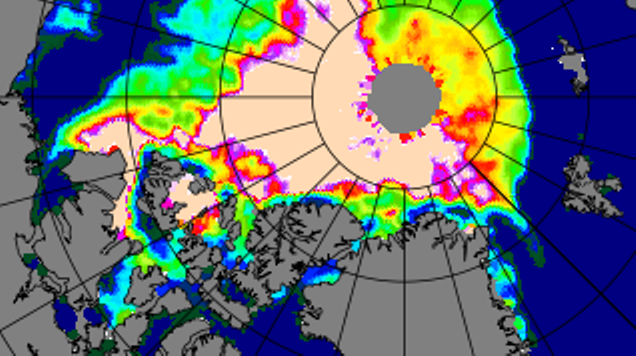
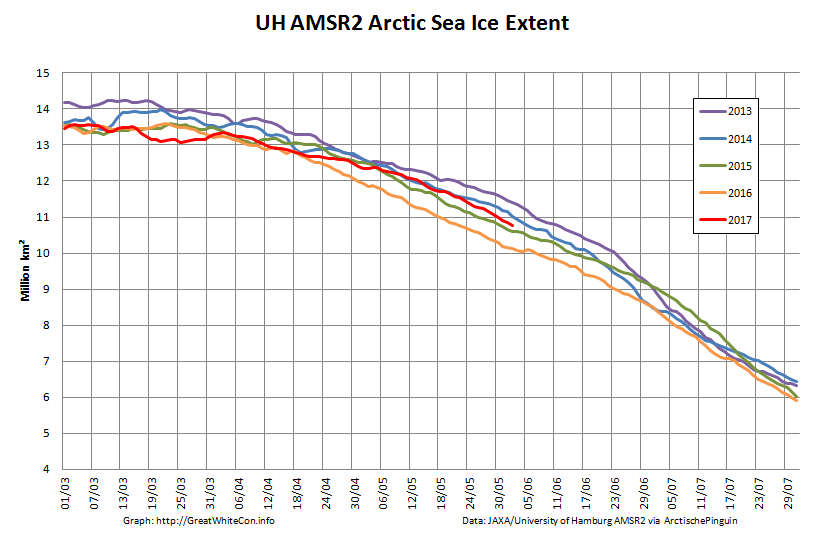
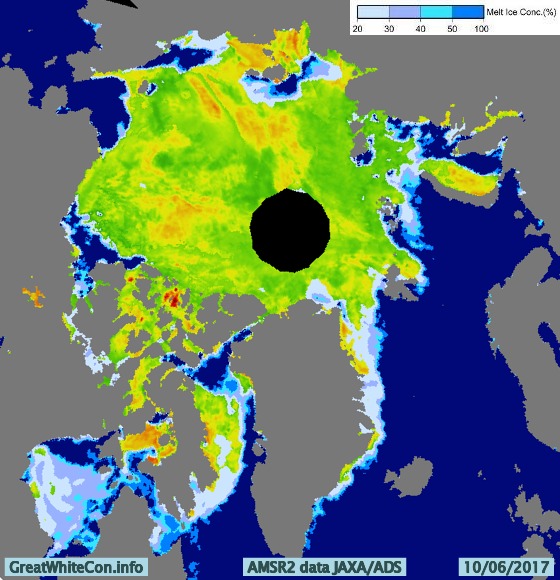
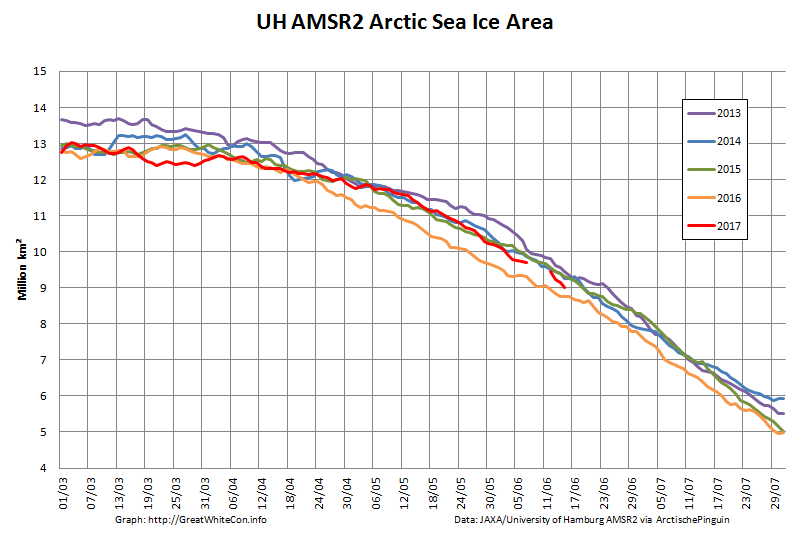
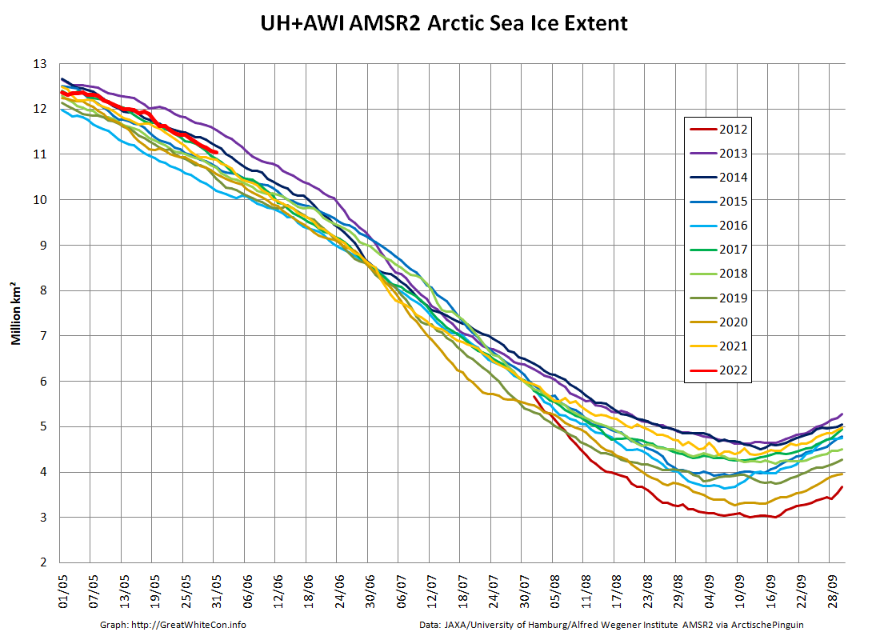
May 2022 proved to be fairly uneventful in the Arctic. High resolution AMSR2 Arctic sea ice extent has remained towards the top of the recent pack:
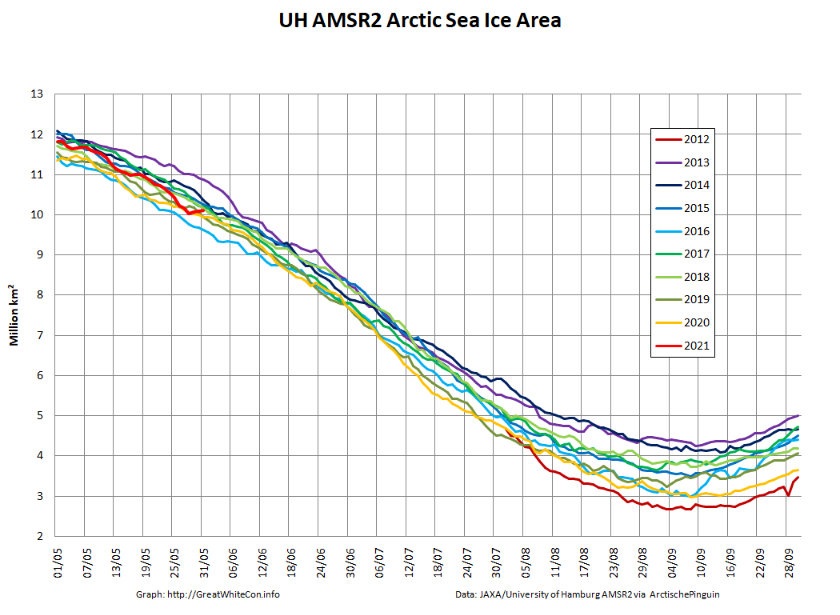
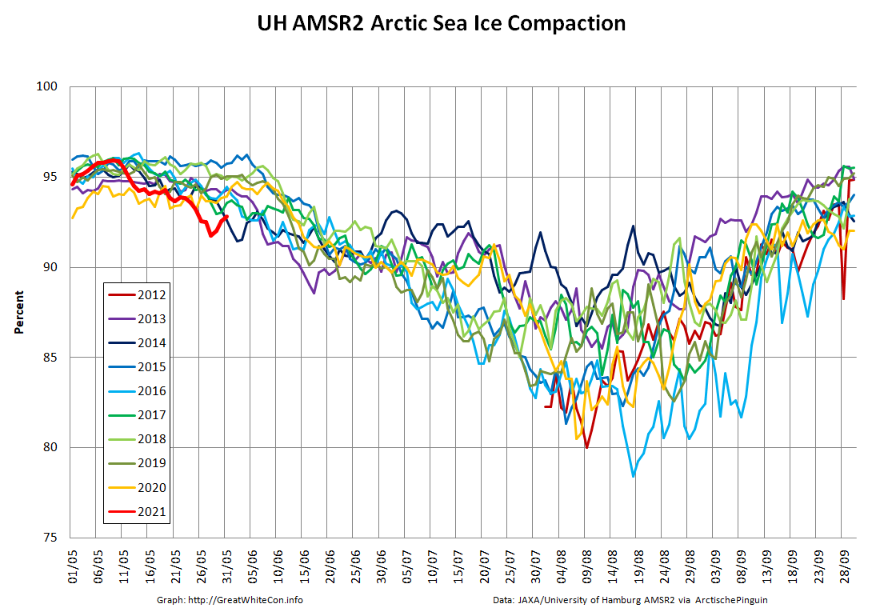
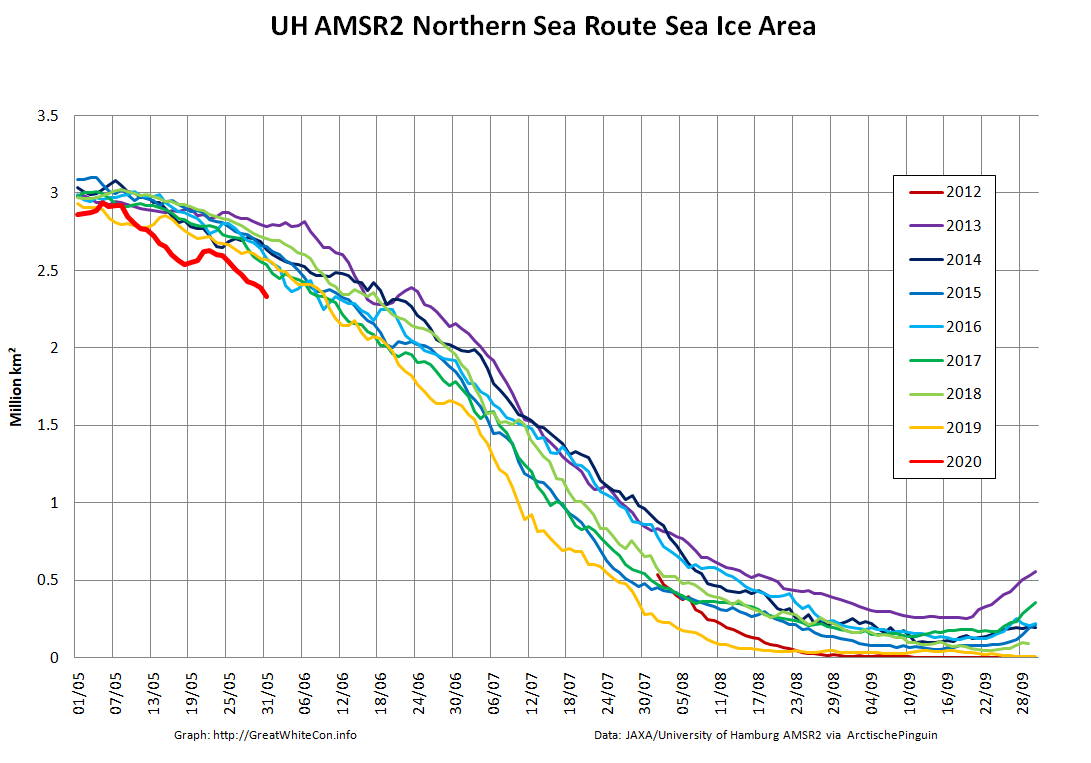
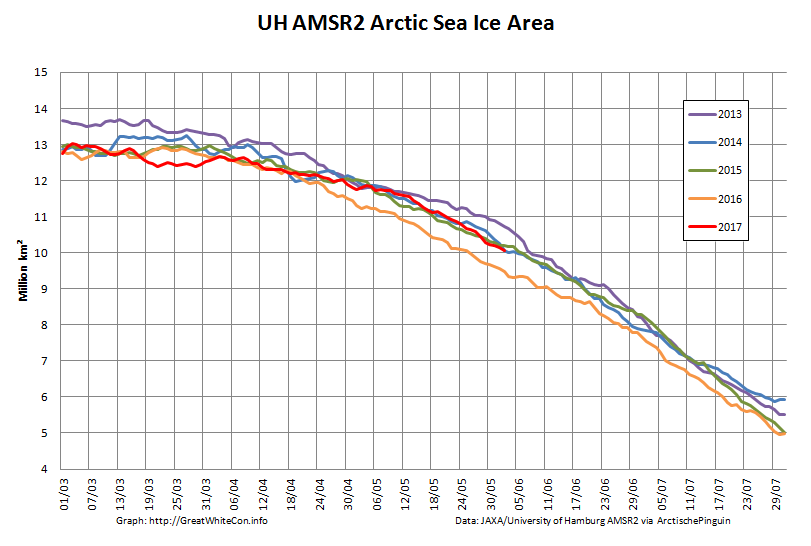
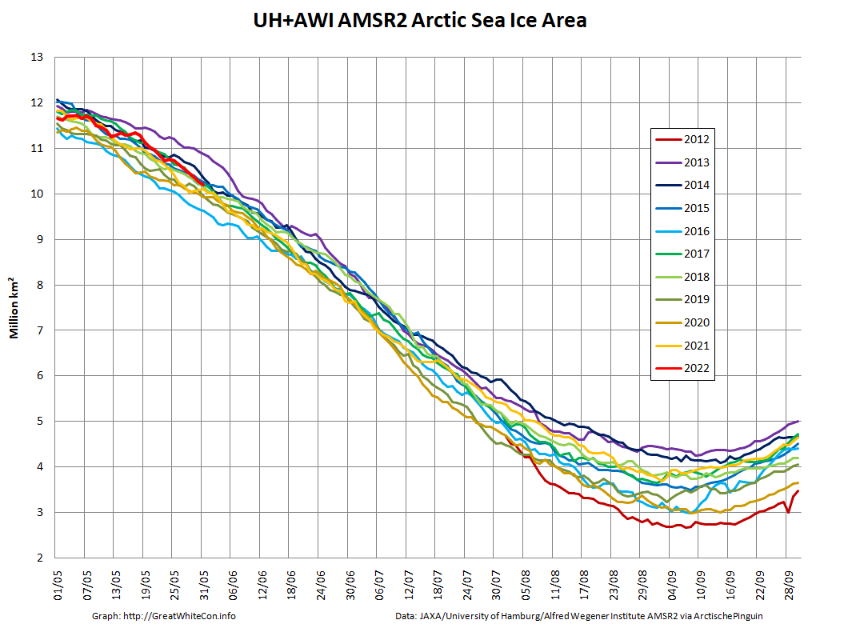
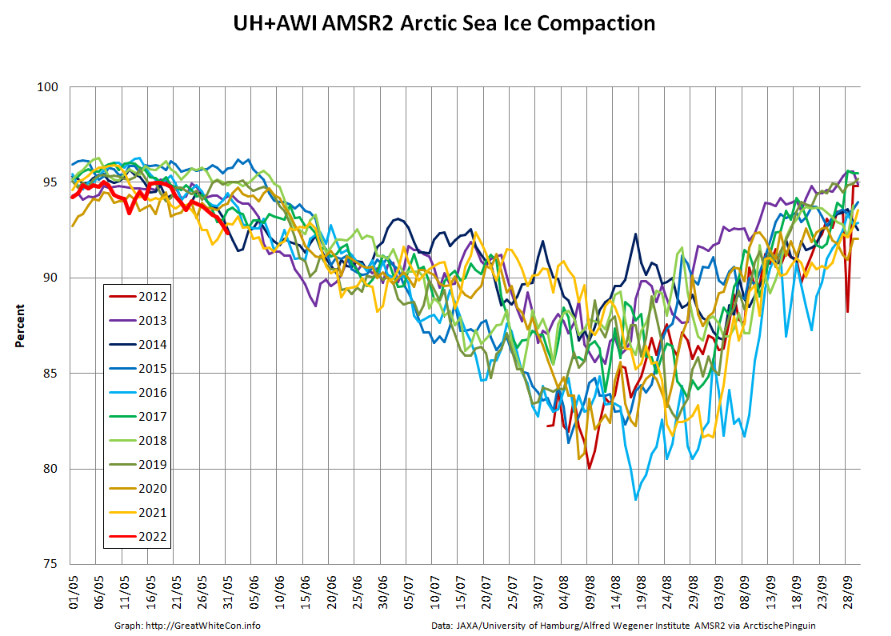
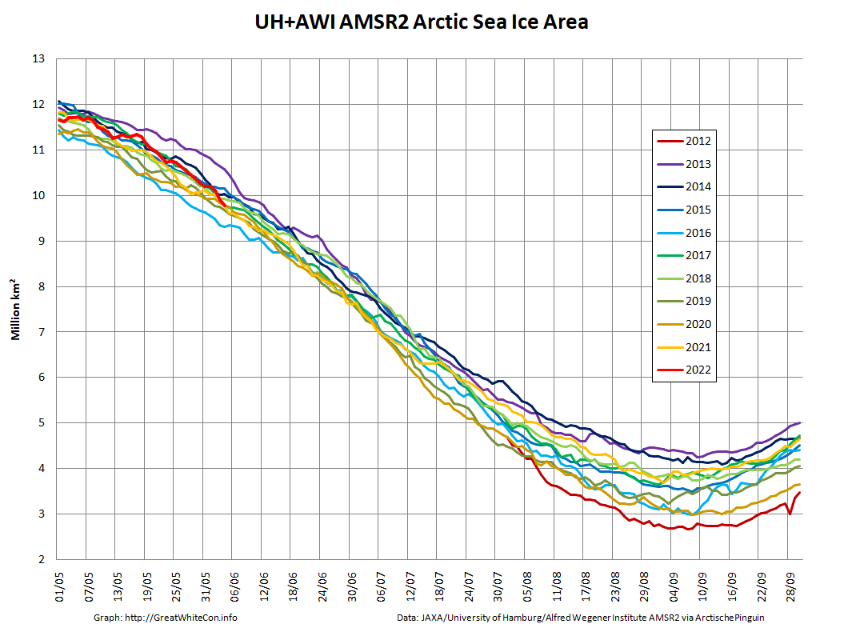
However Arctic sea ice area has been declining more quickly recently, and compaction is now lowest for the date in the AMSR2 record:
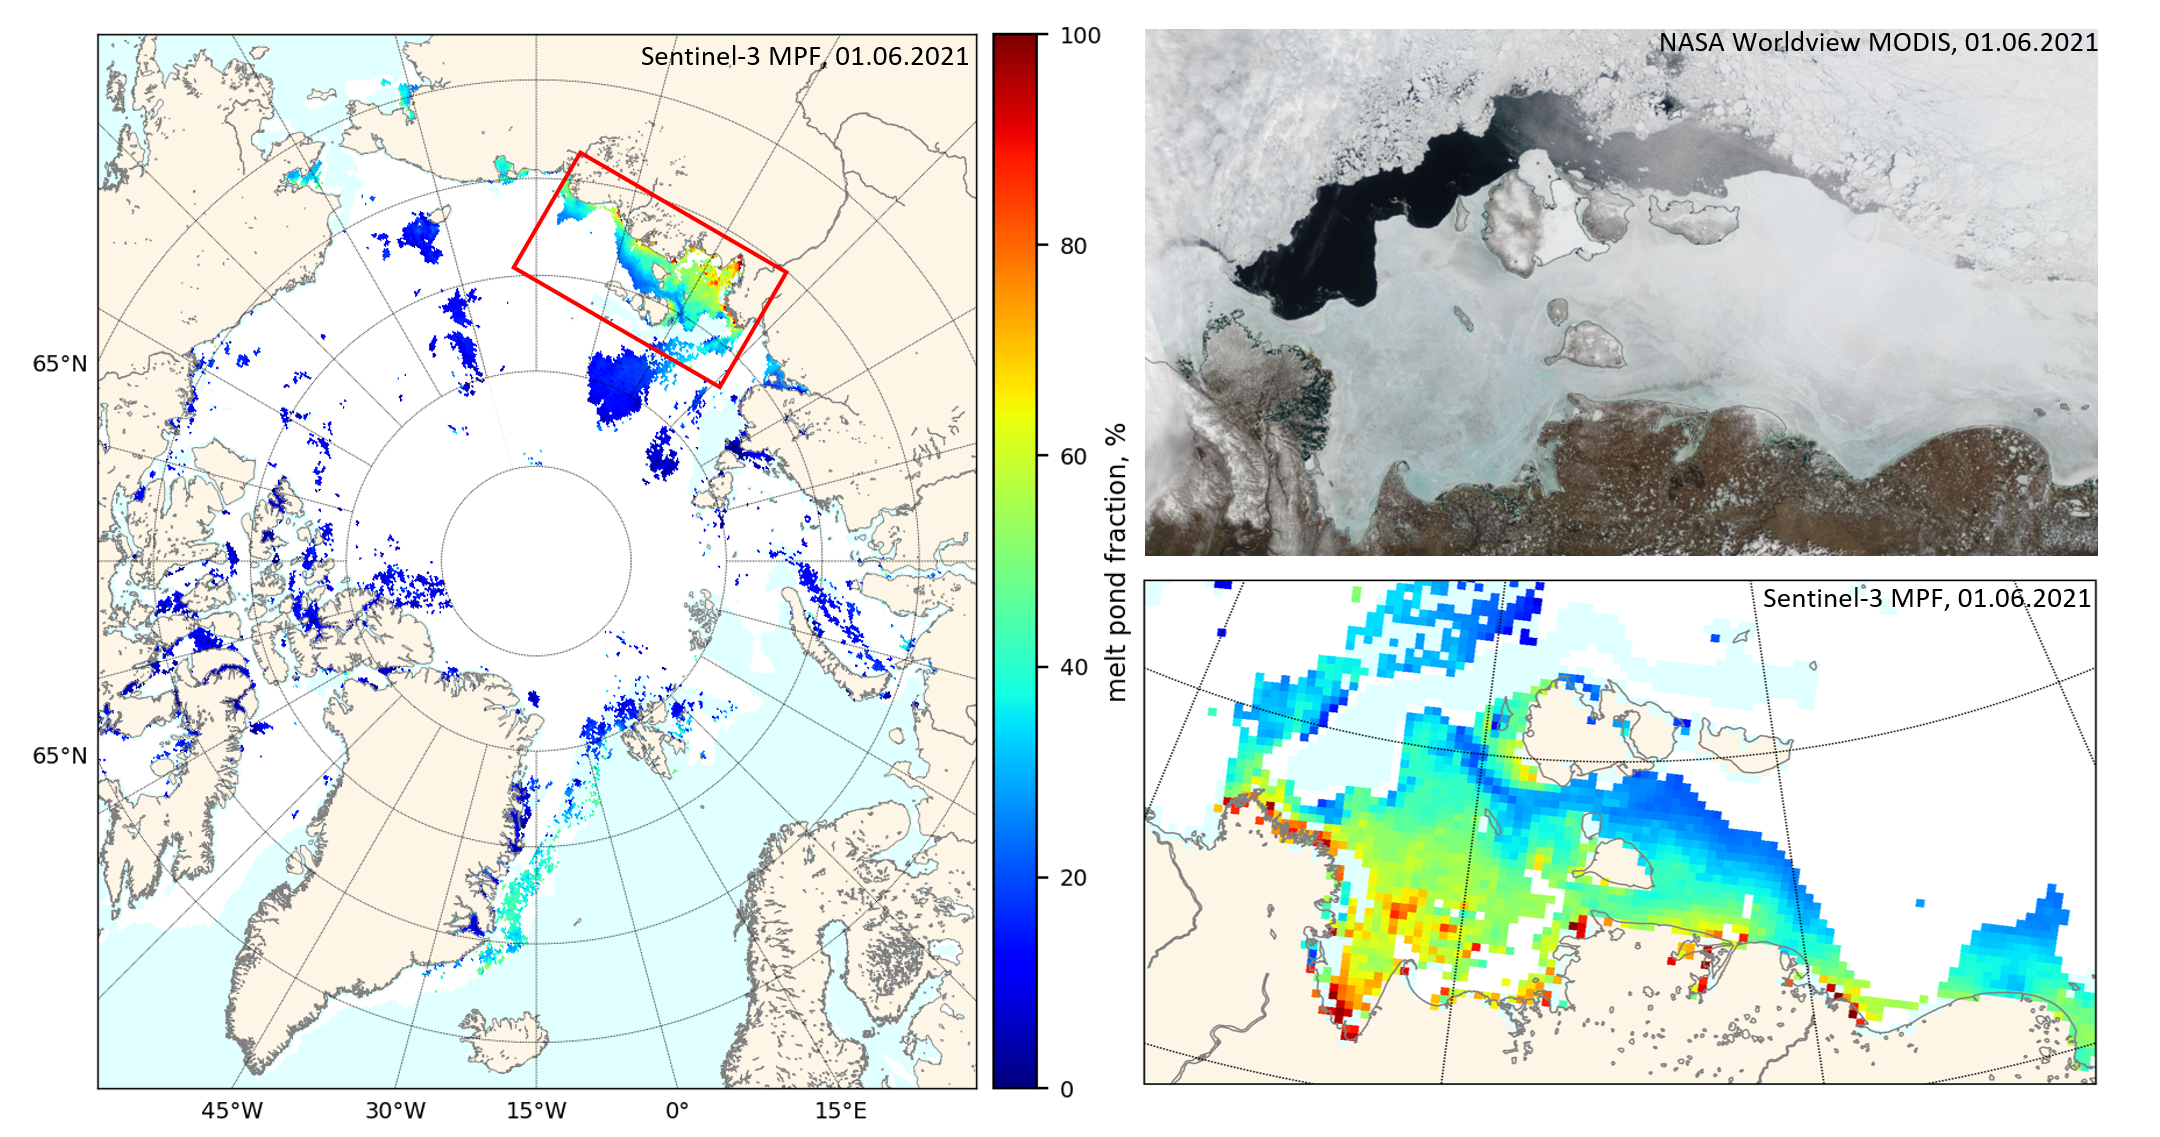
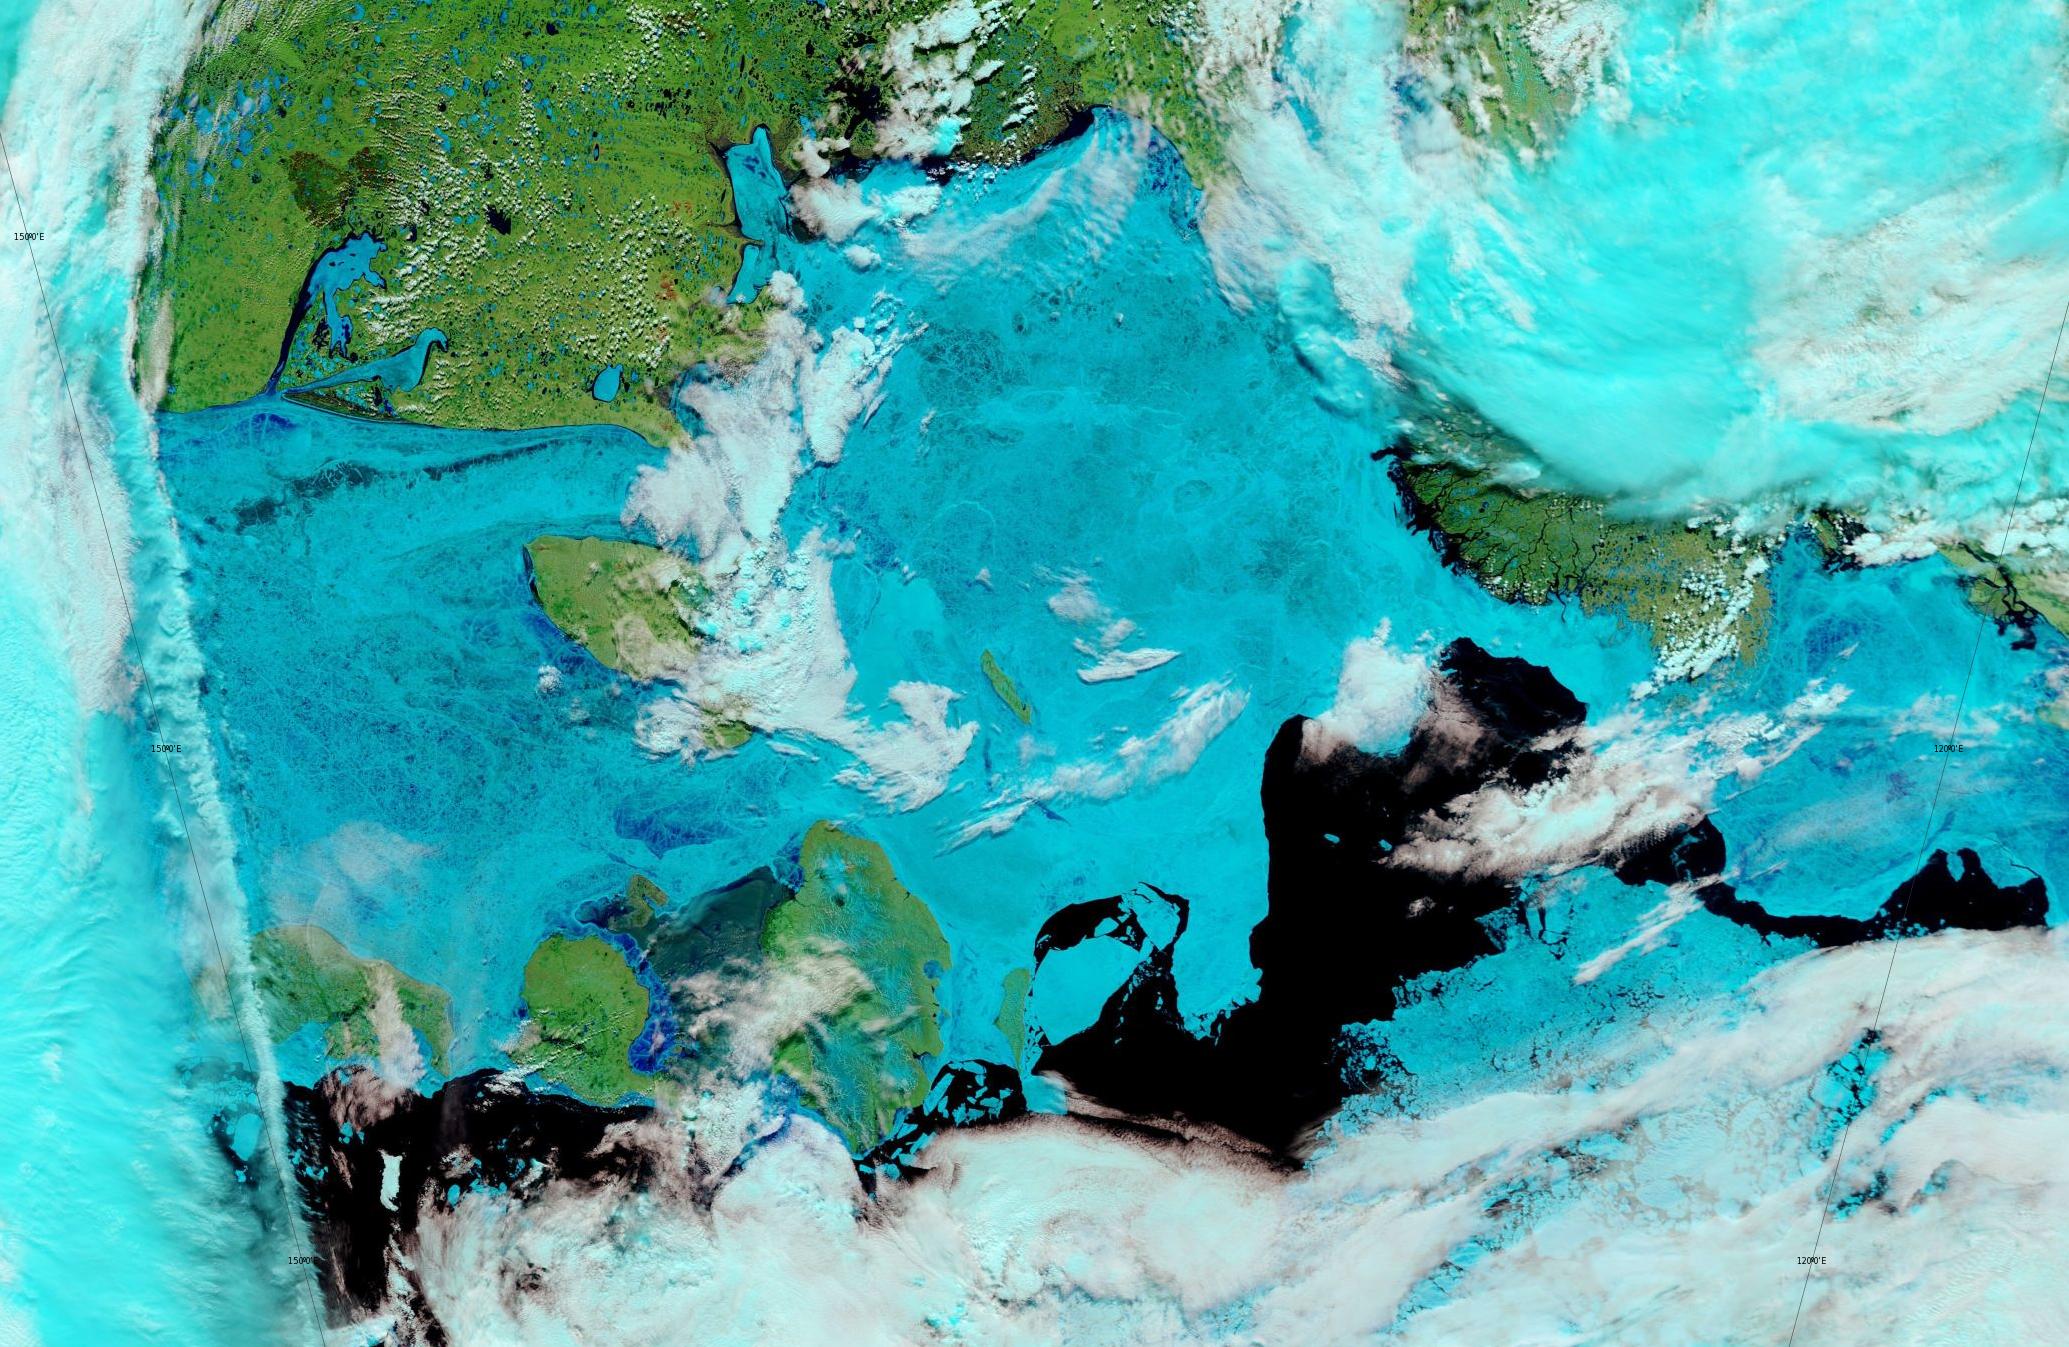
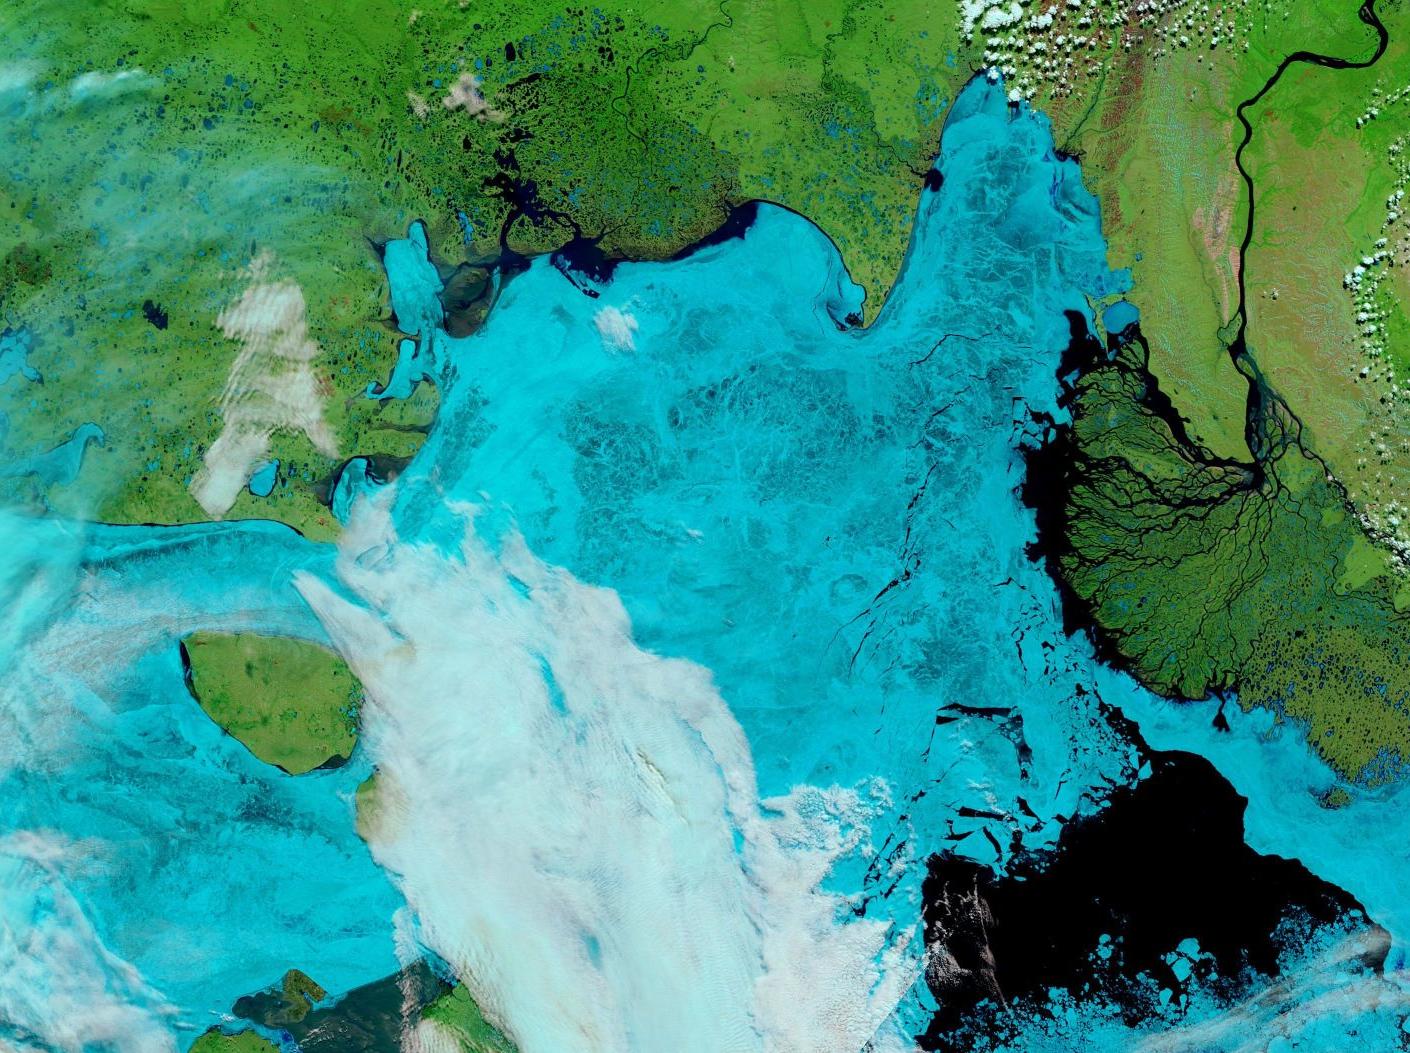
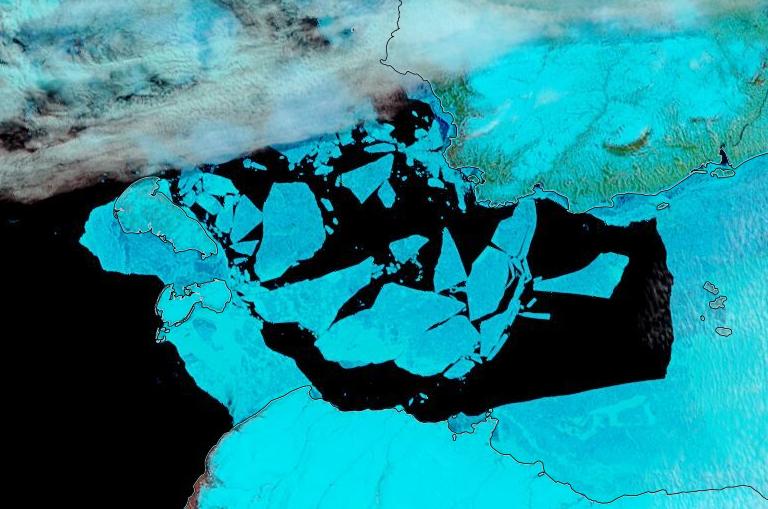
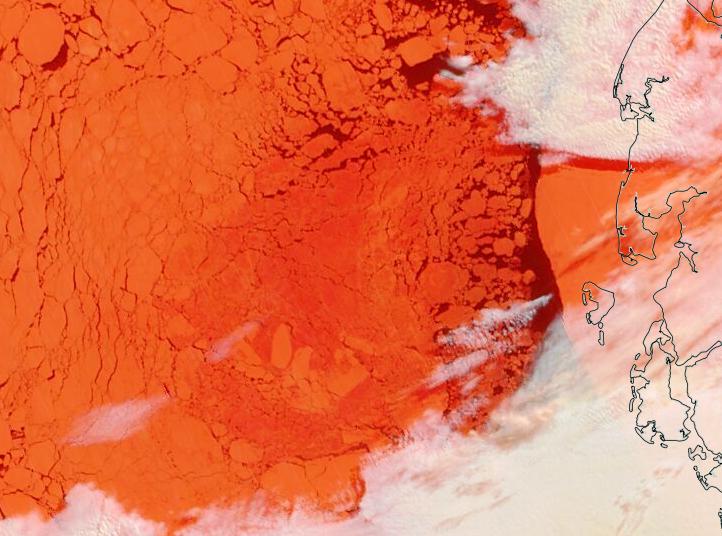
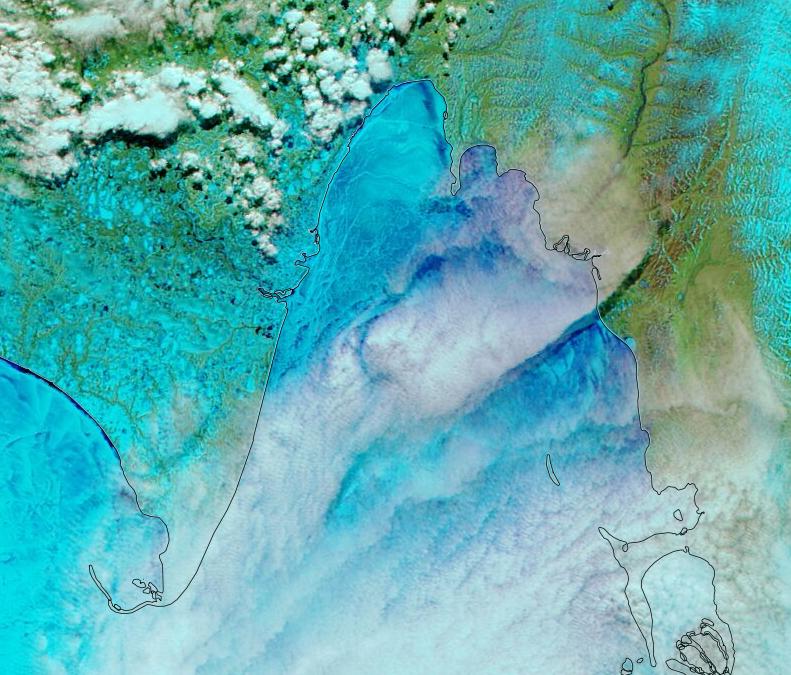
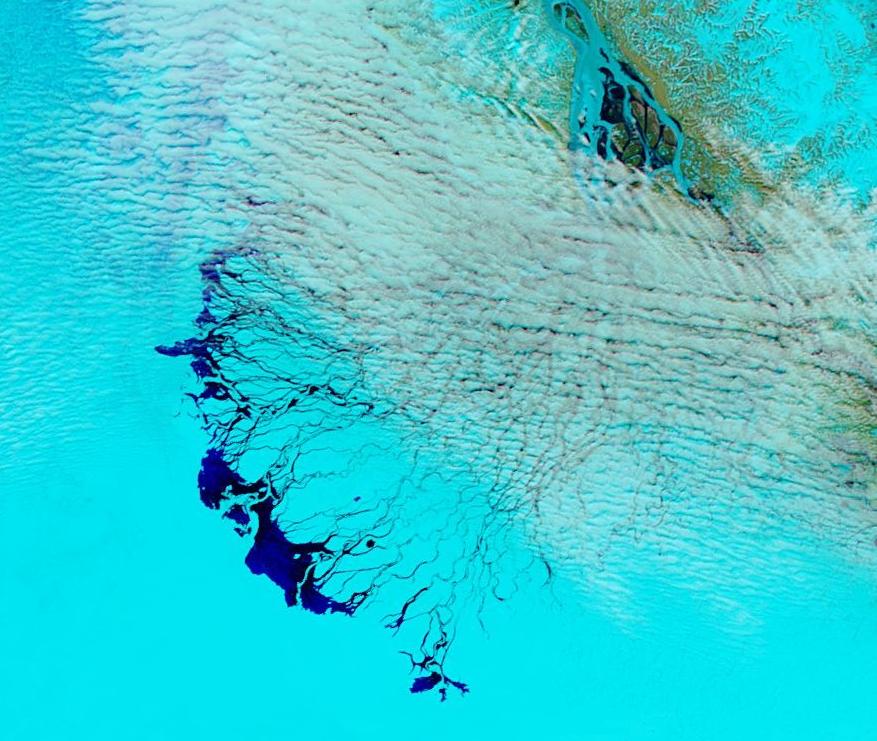
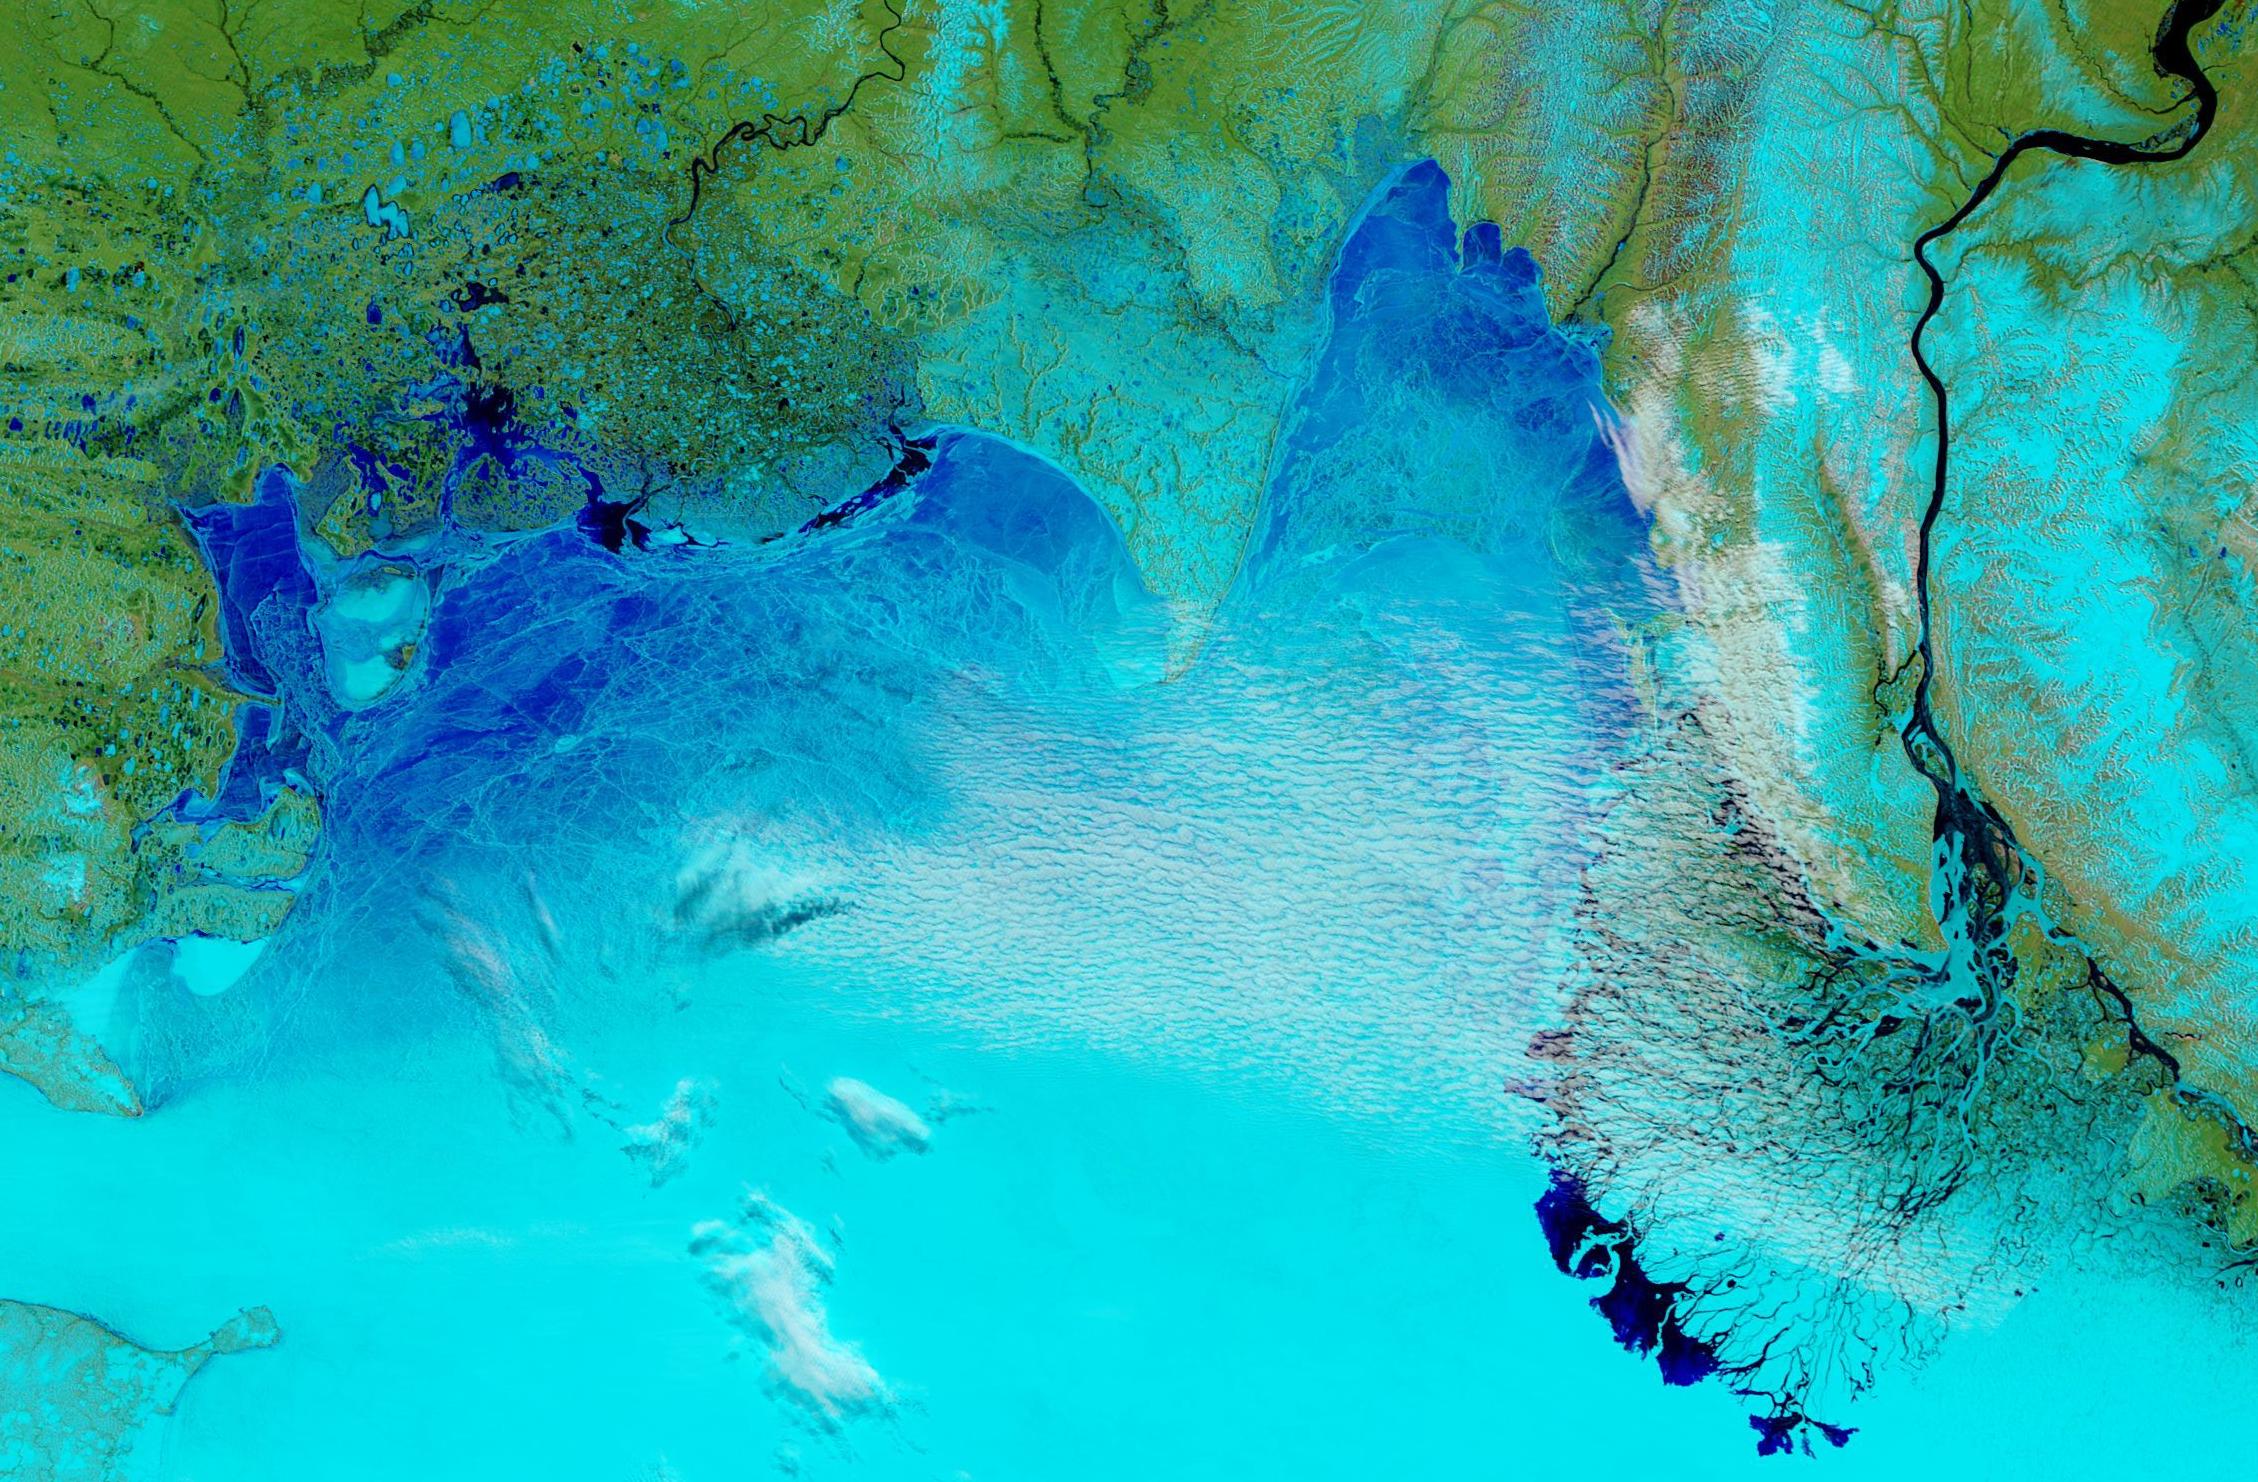
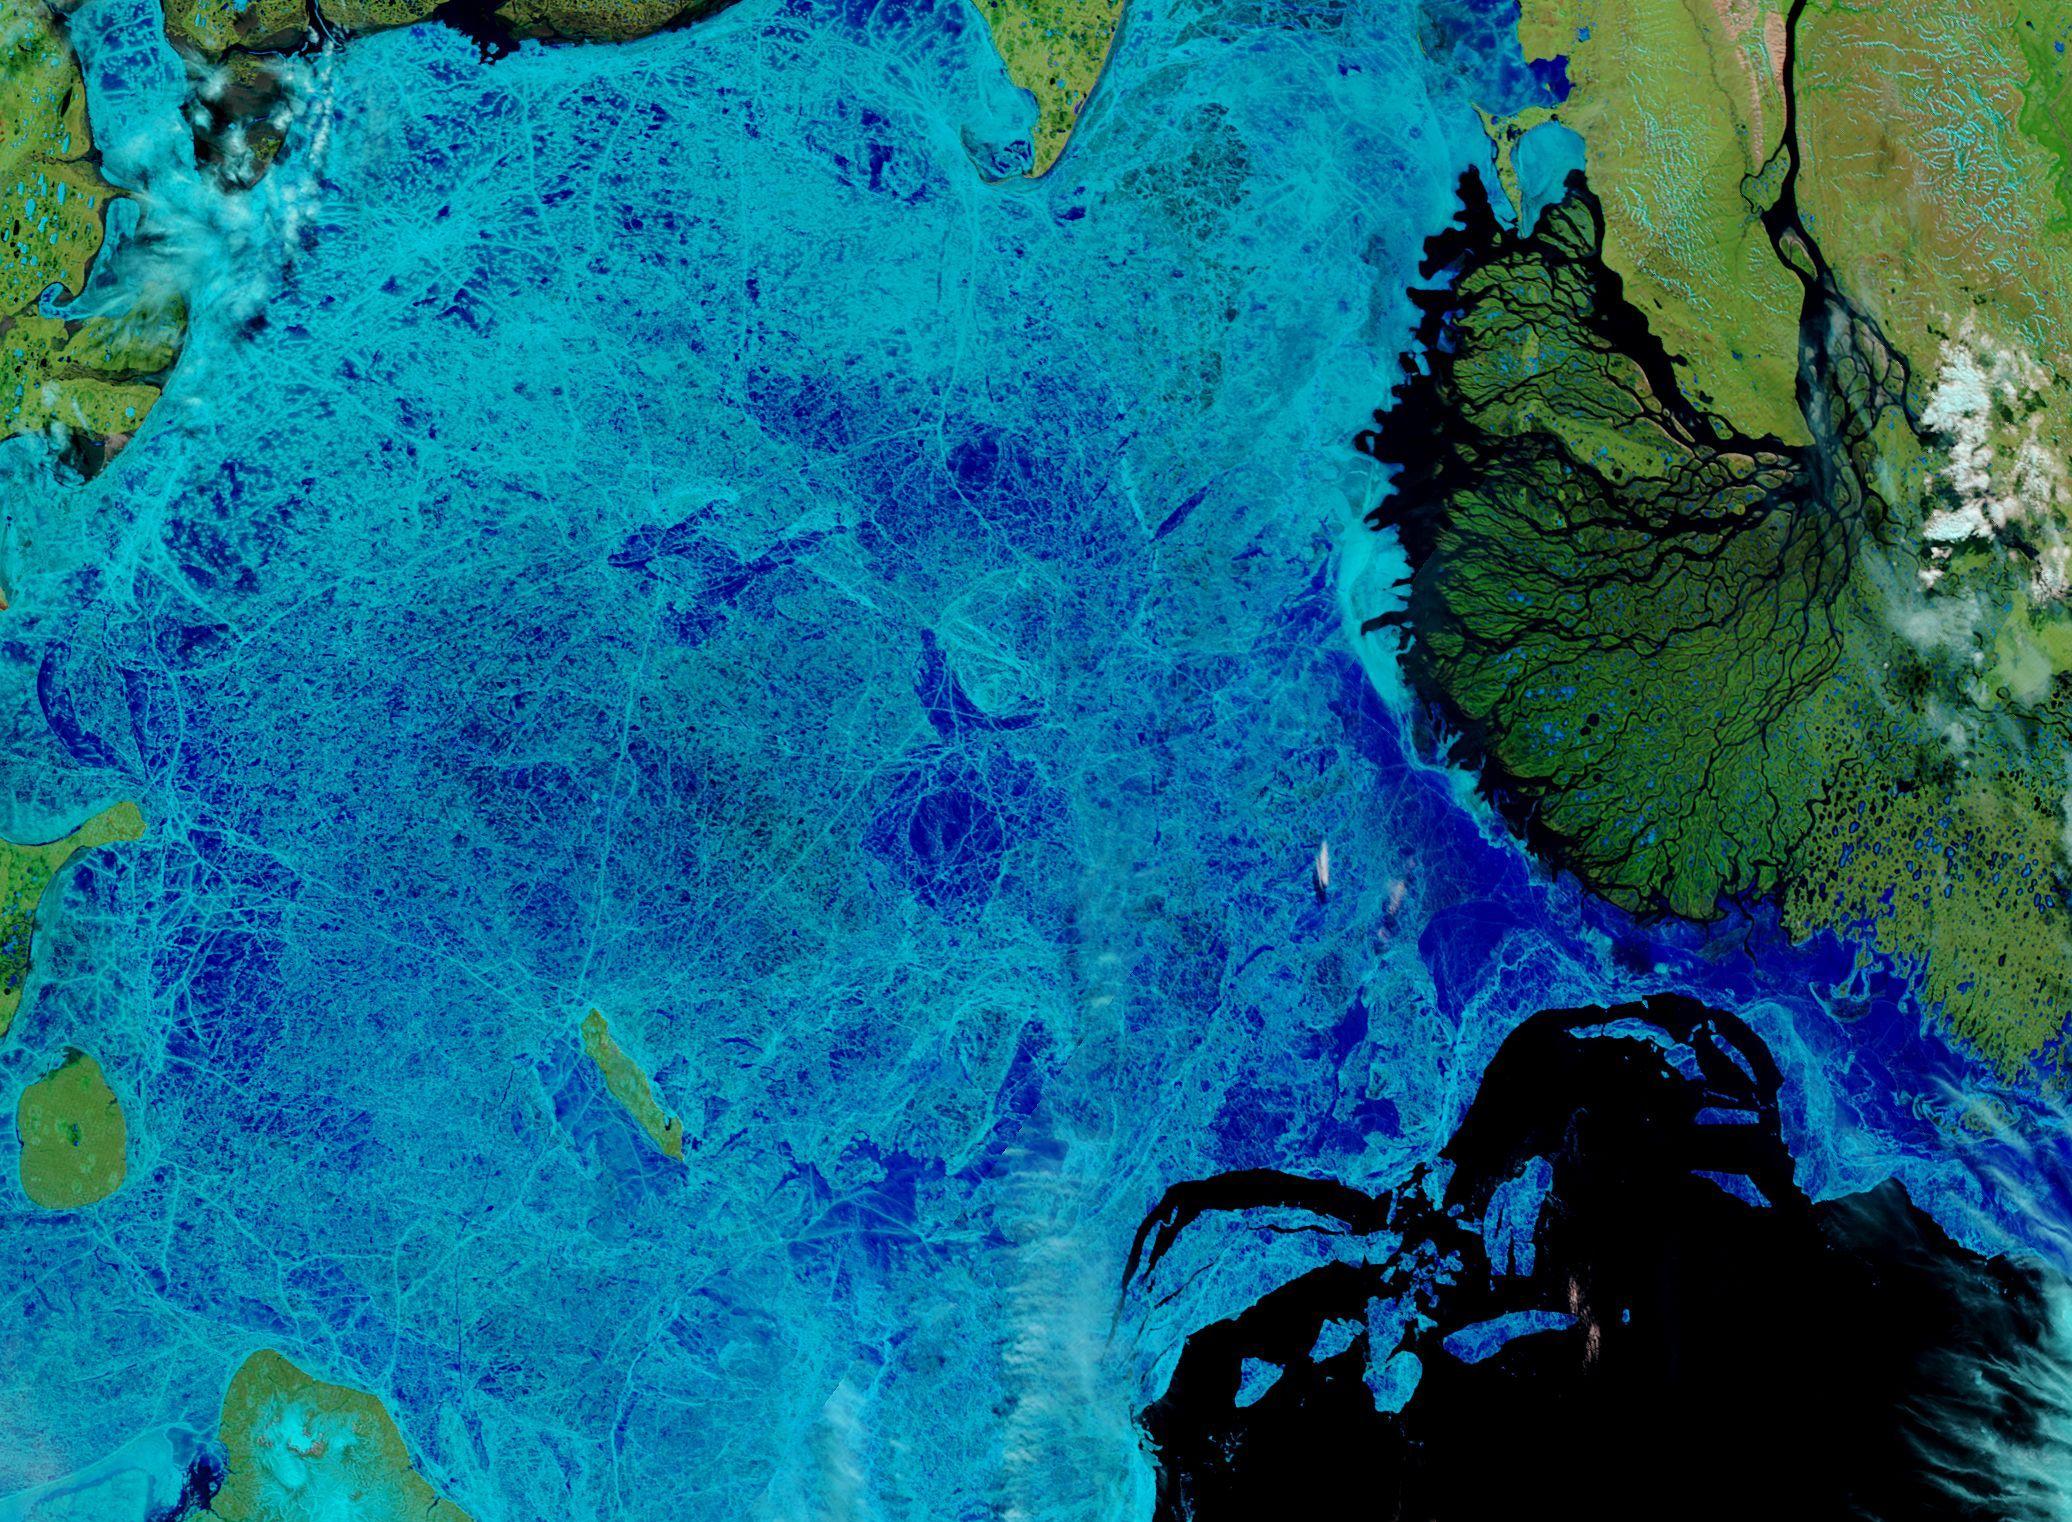
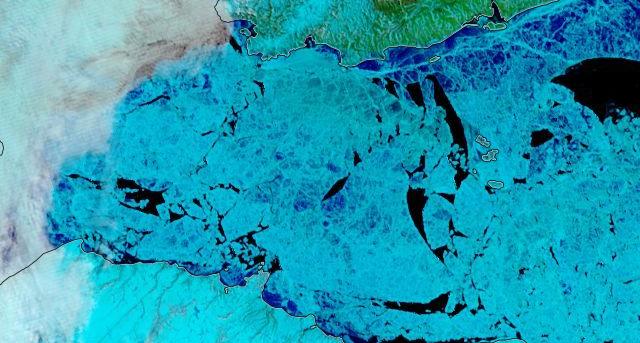
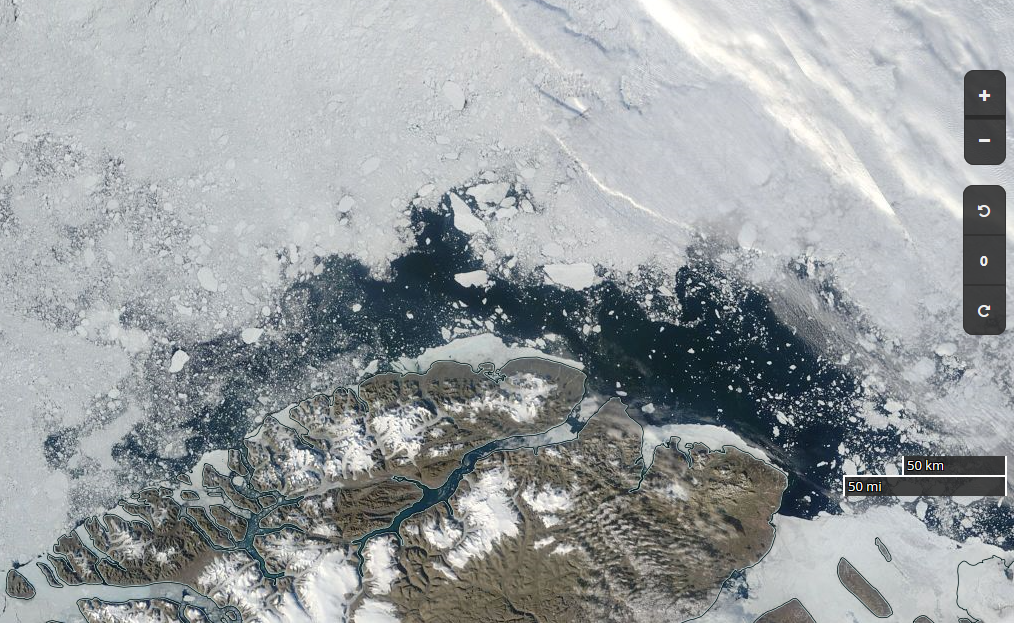
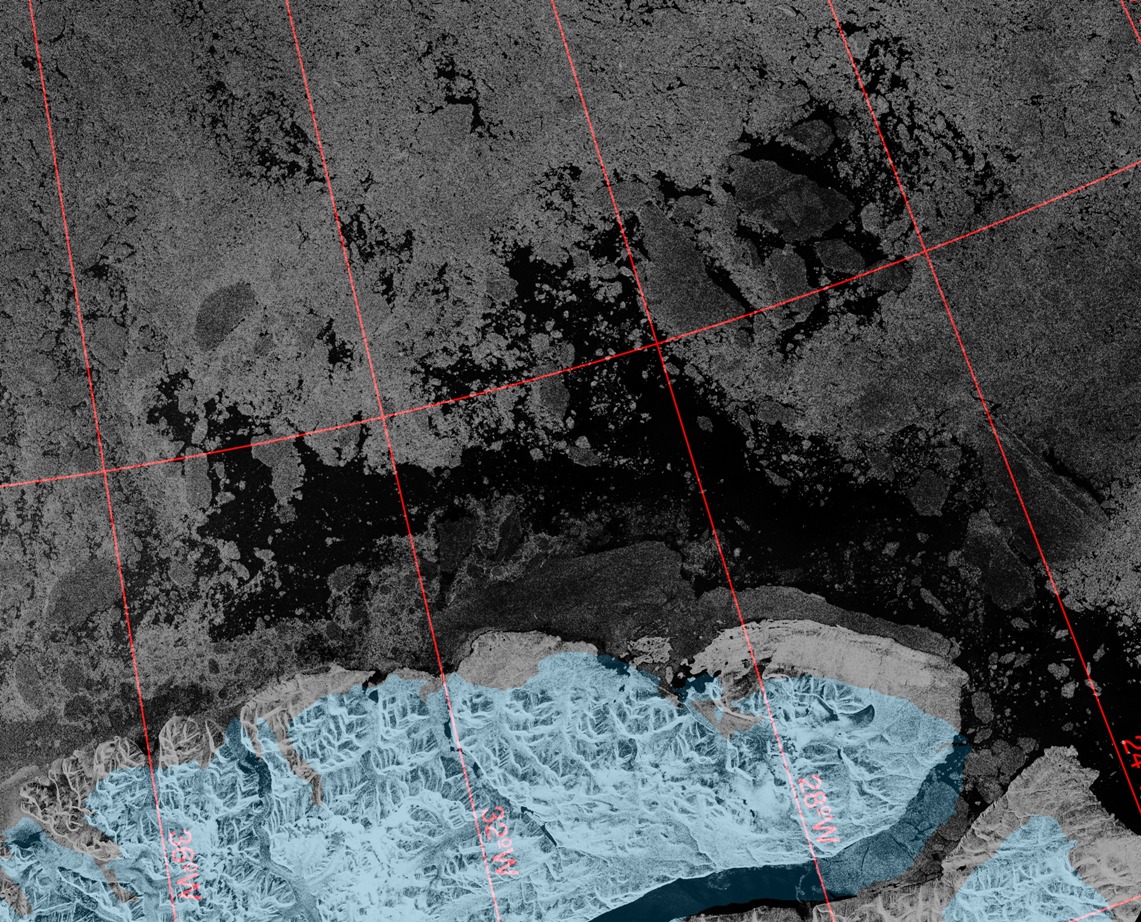
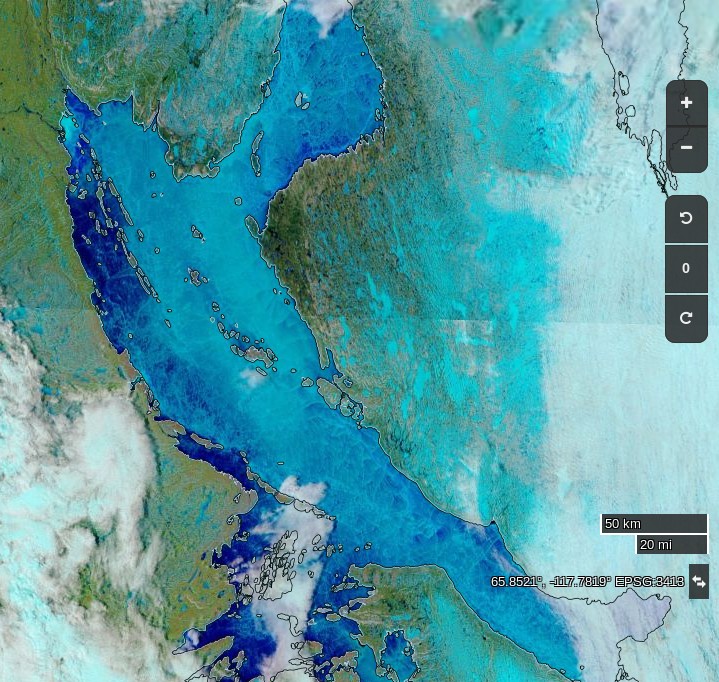
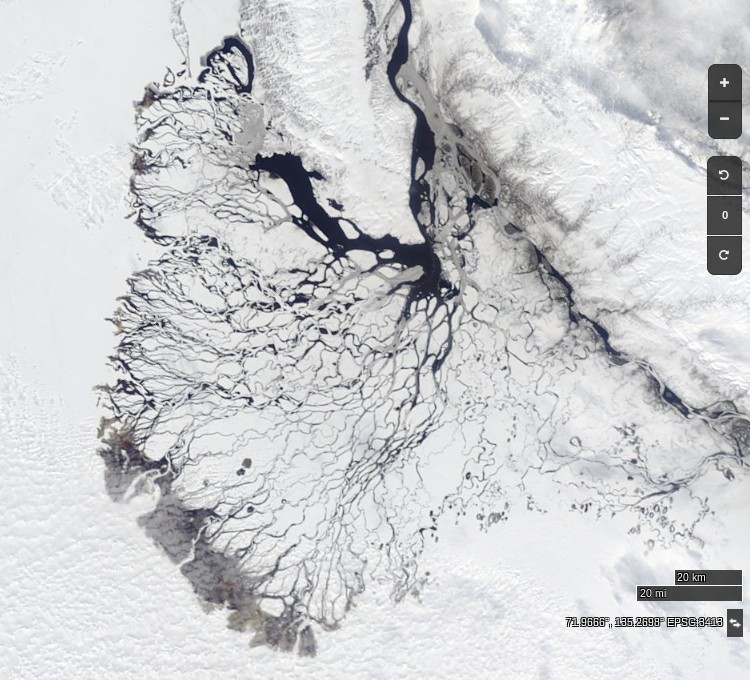
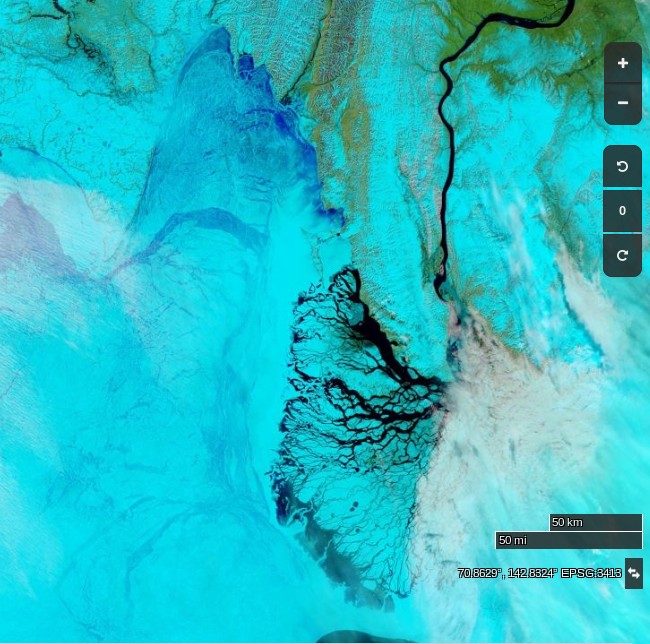
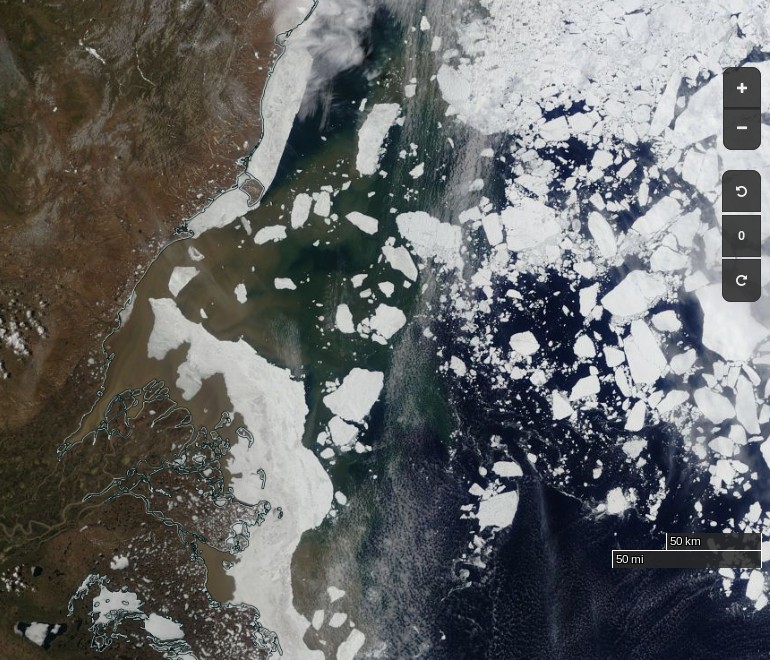
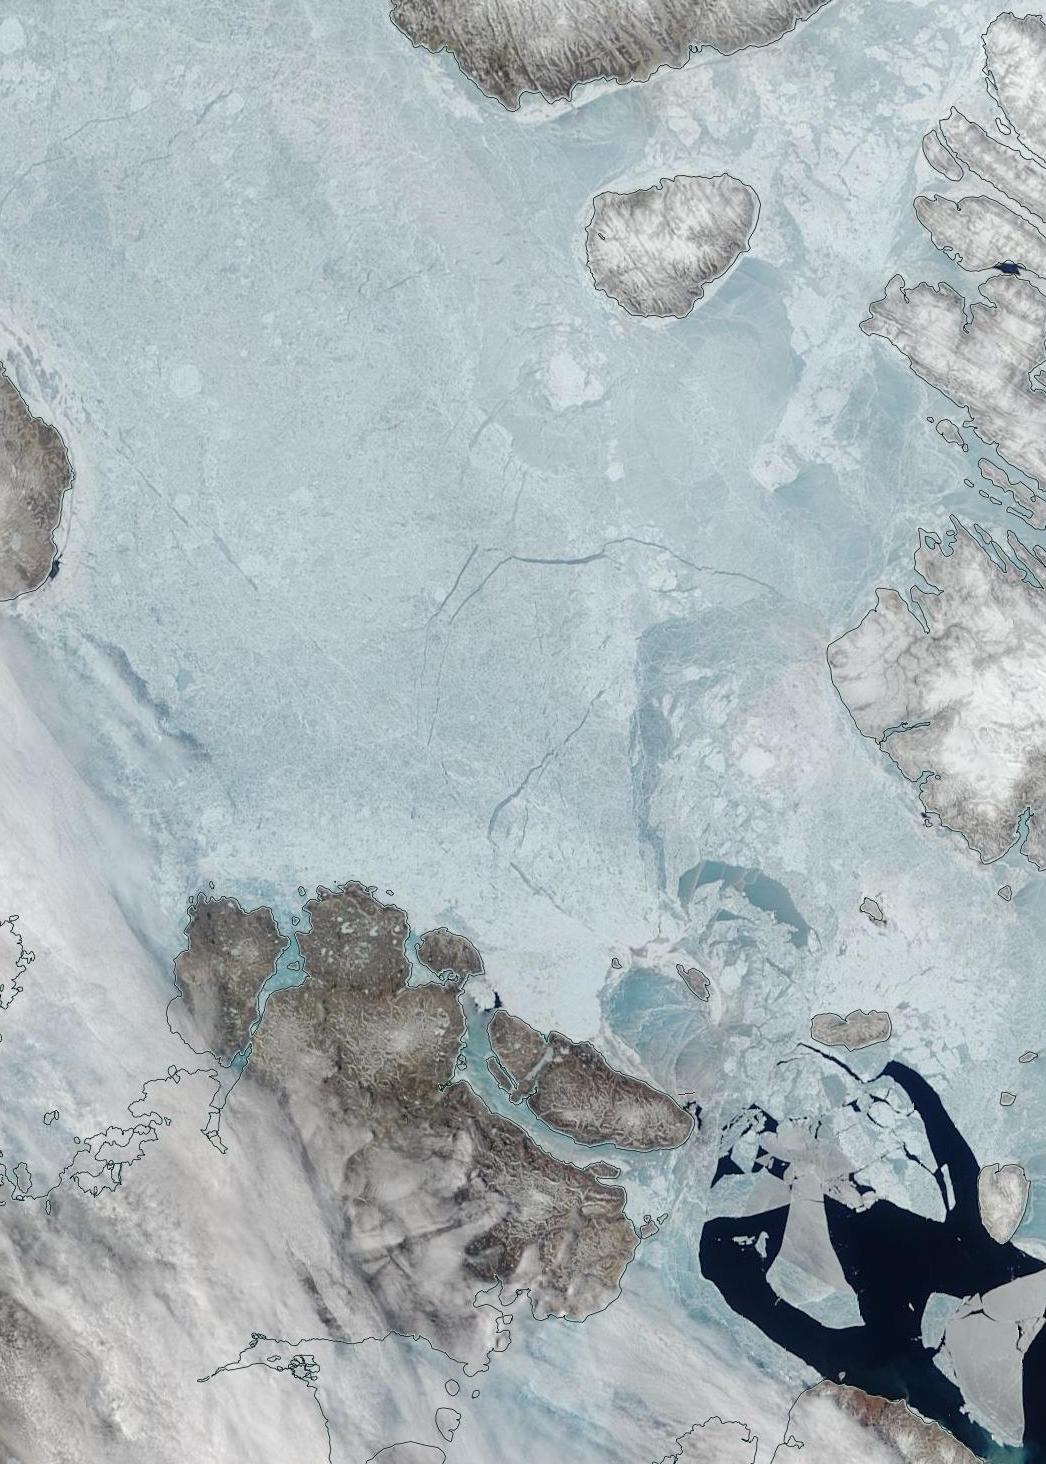
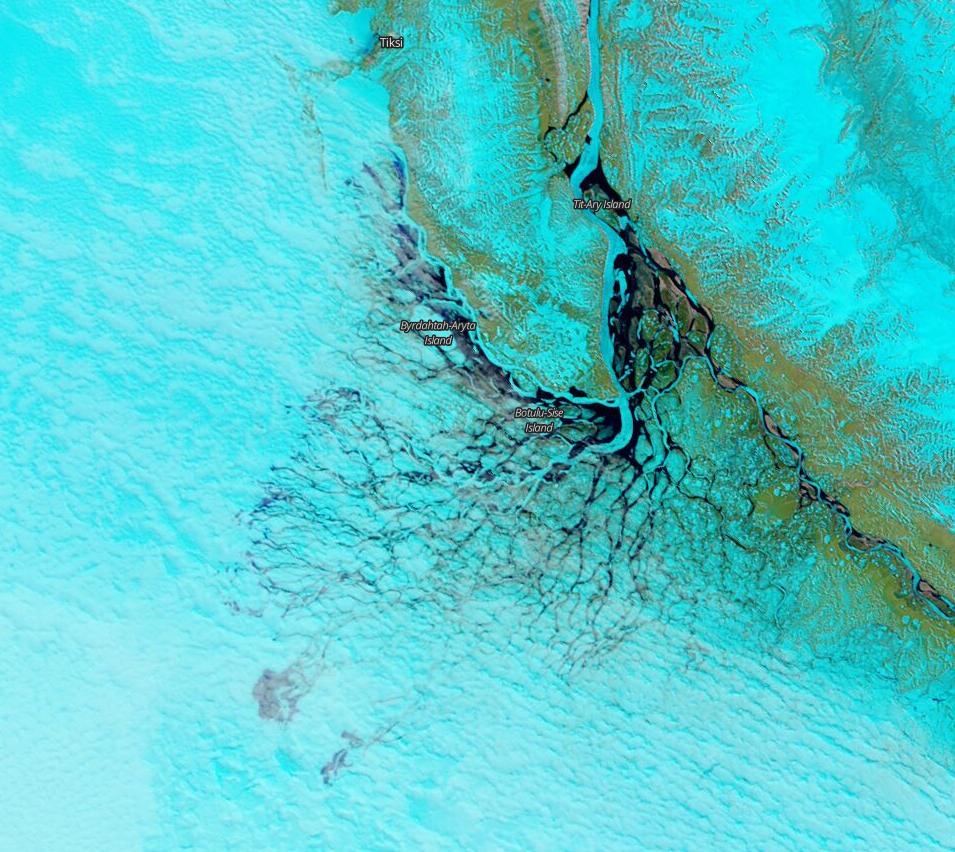
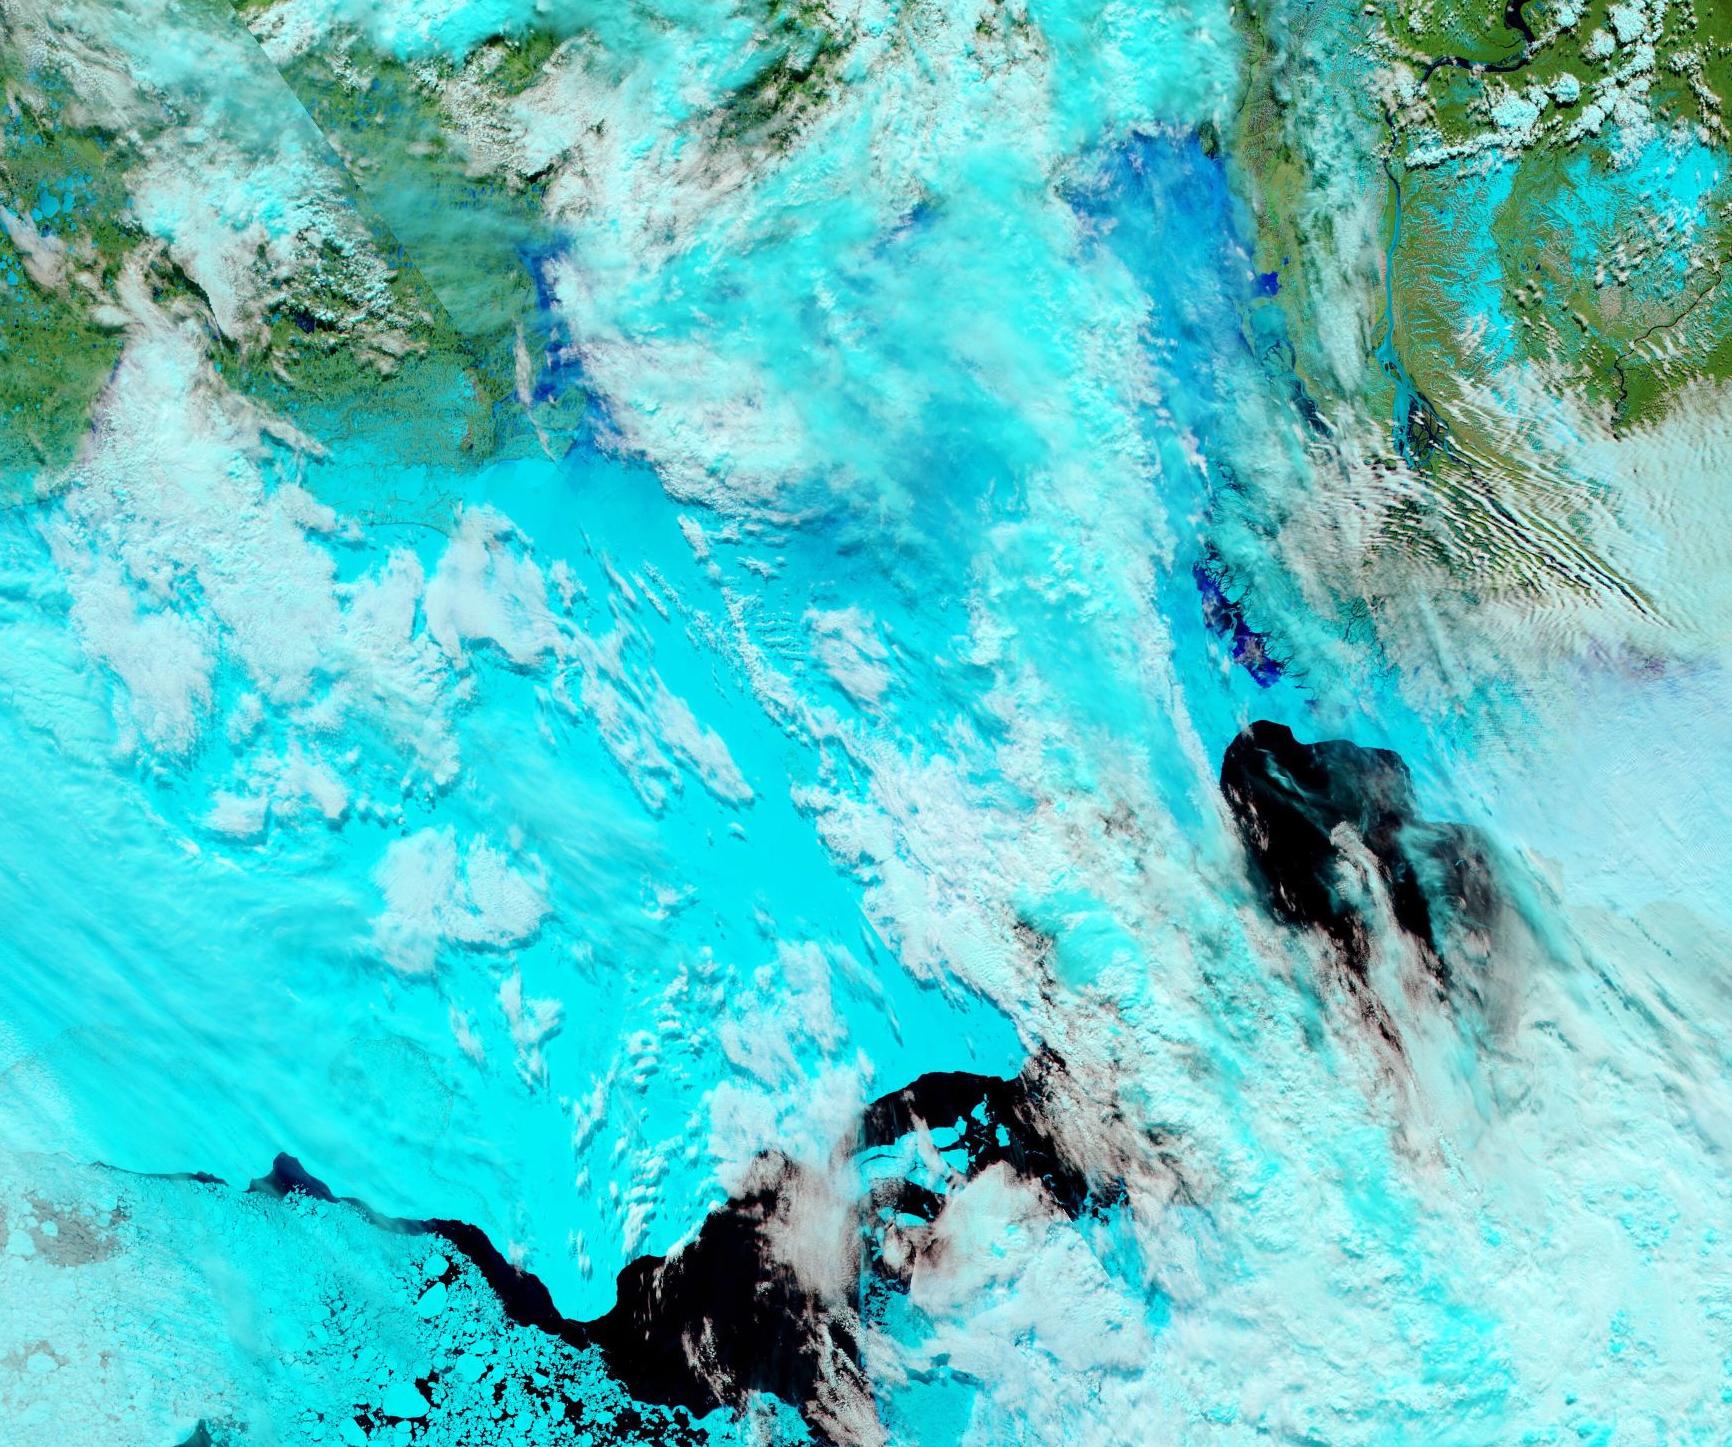
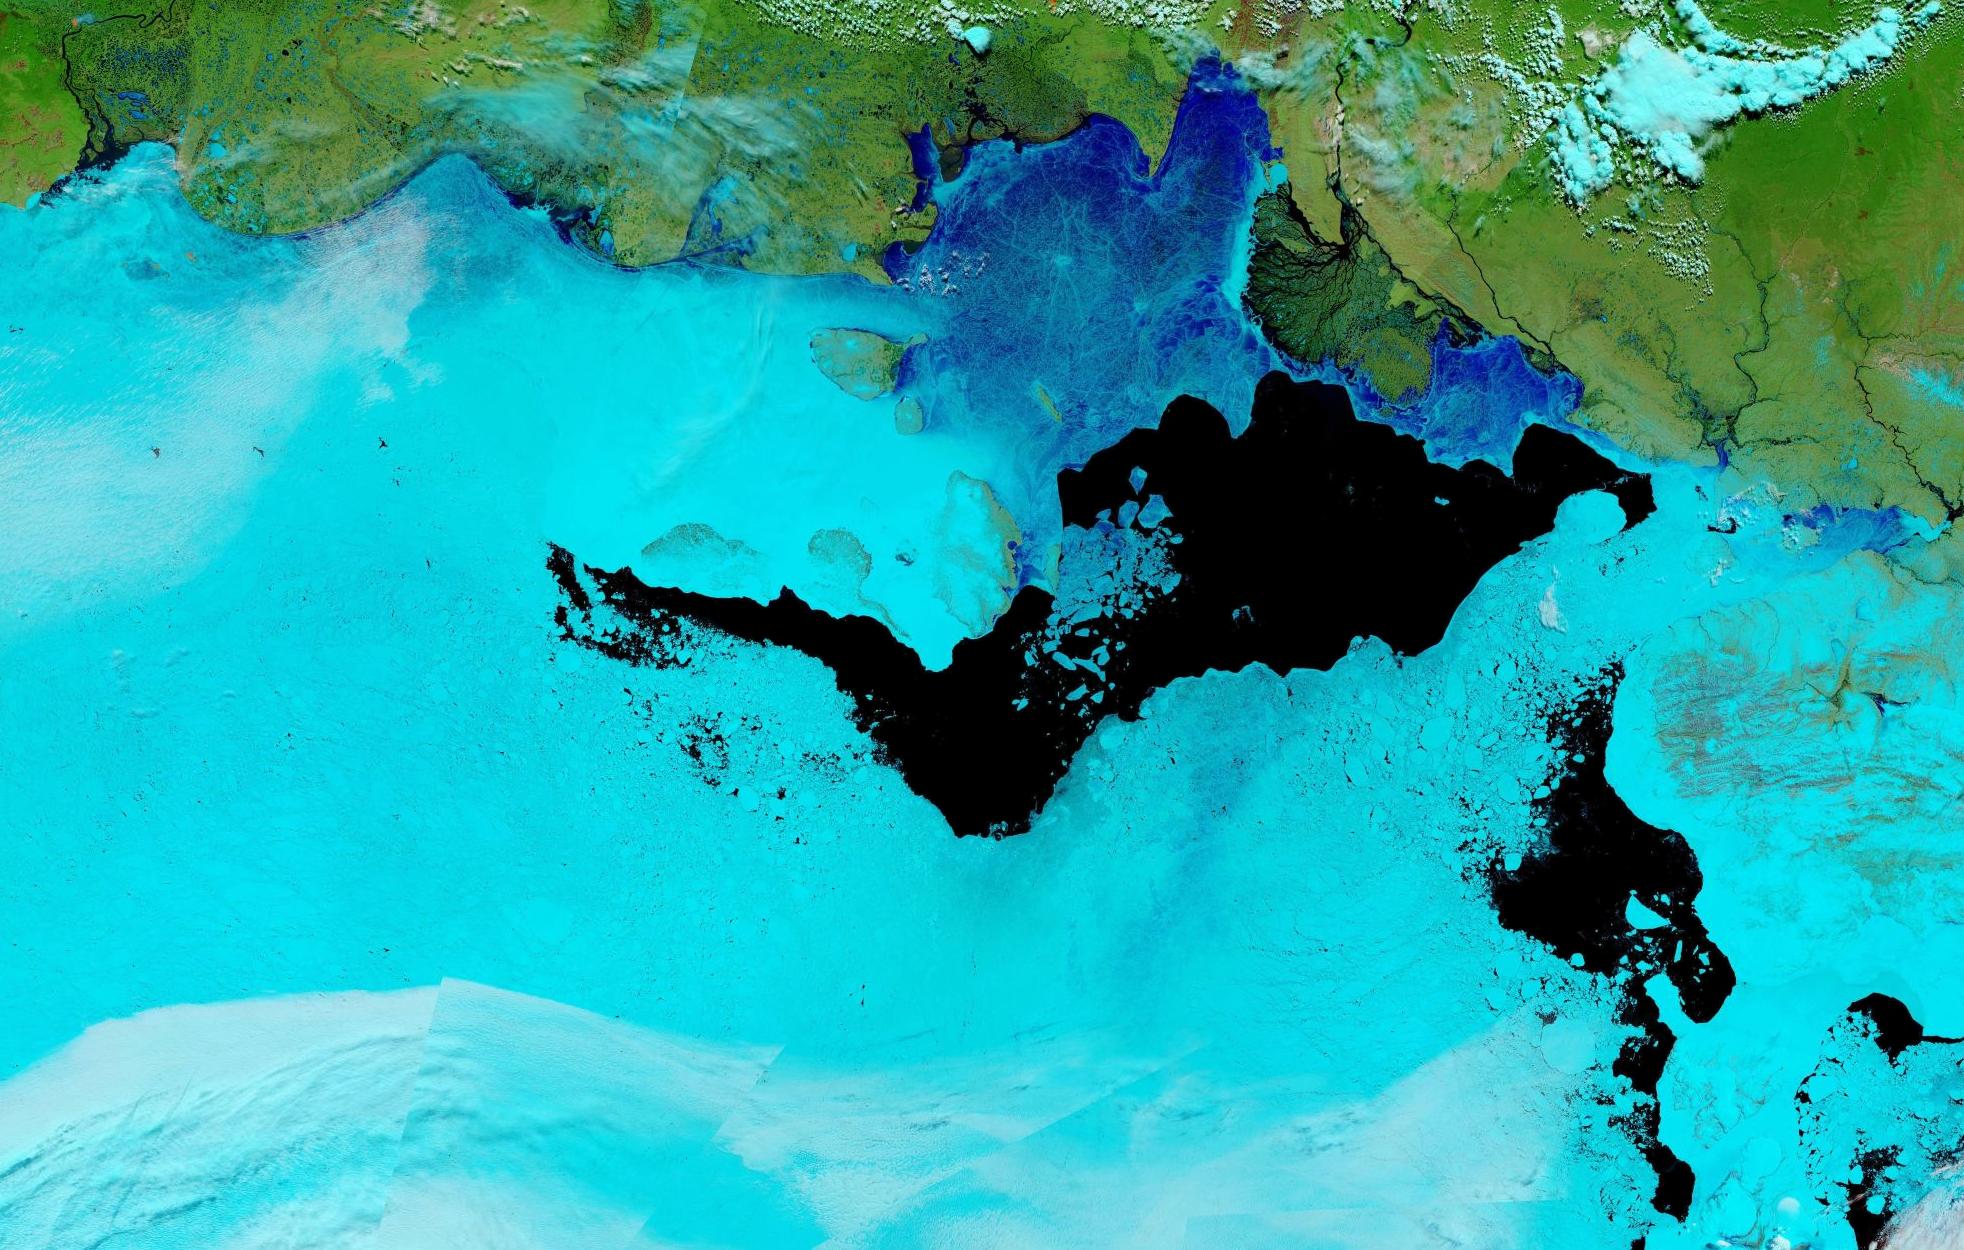
The clouds over the Lena Delta have thinned, to reveal melt water beginning to spread across the fast ice in the Laptev Sea:
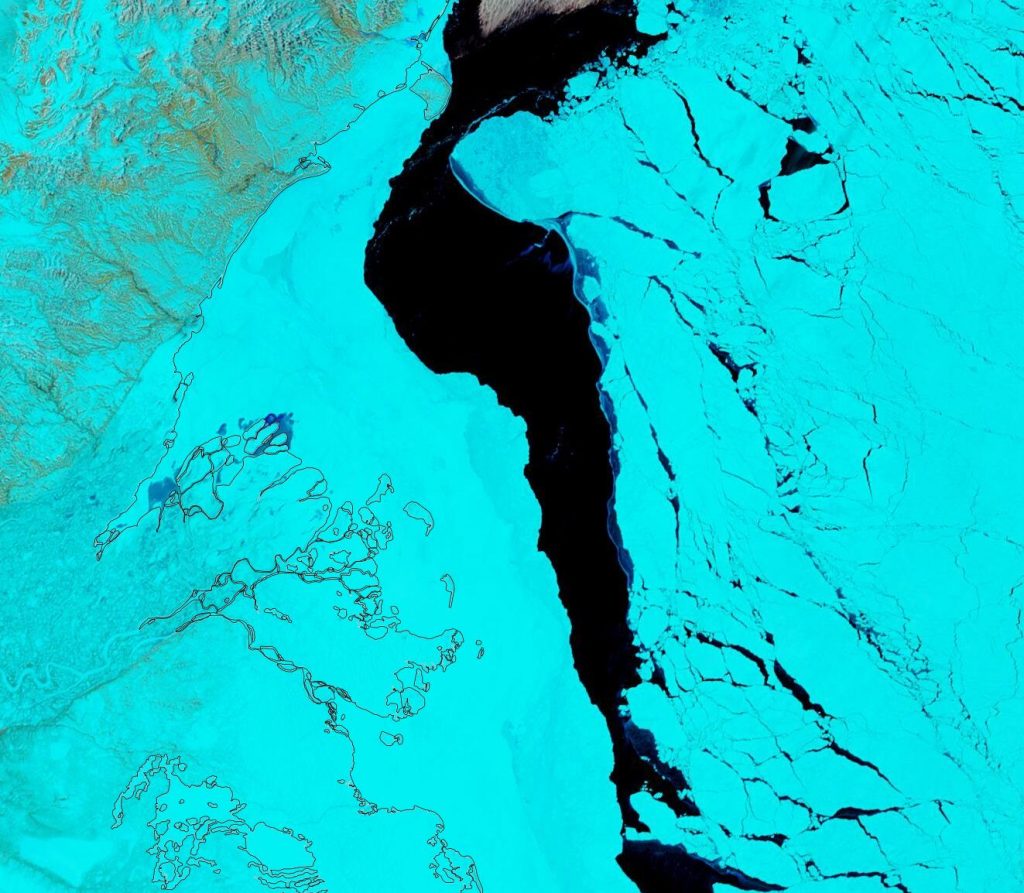
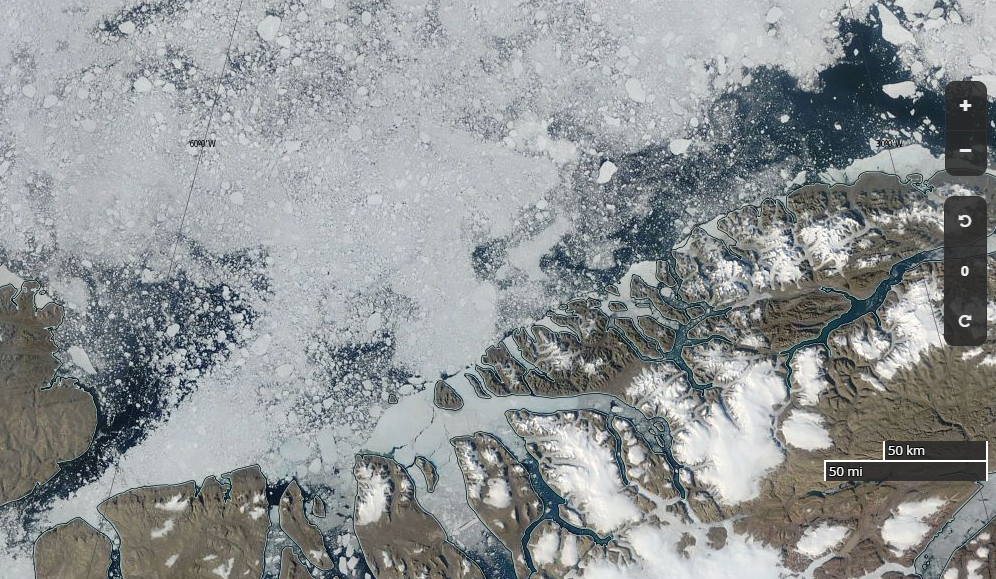
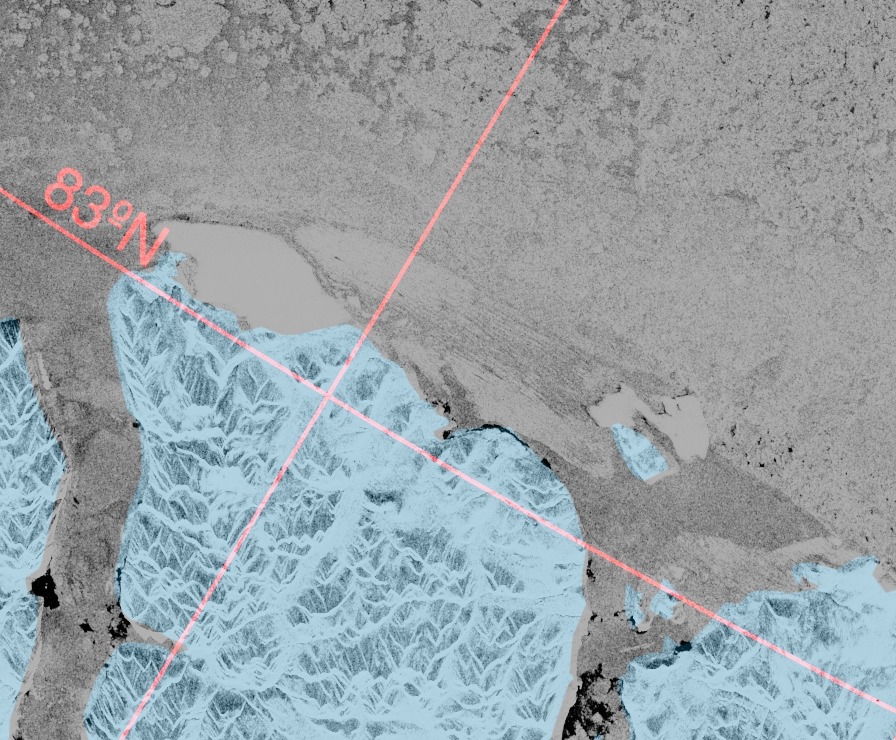
The clouds have also cleared over the North Pole, to reveal a network of leads:
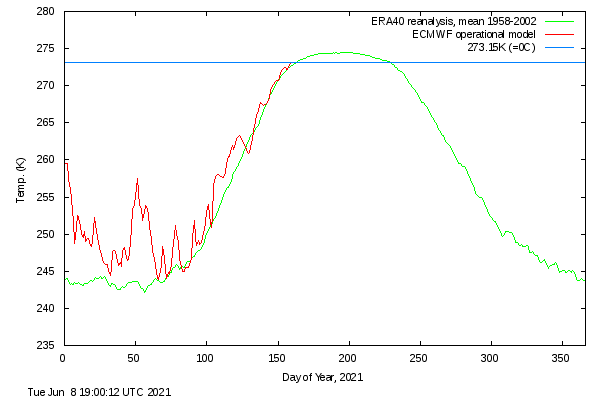
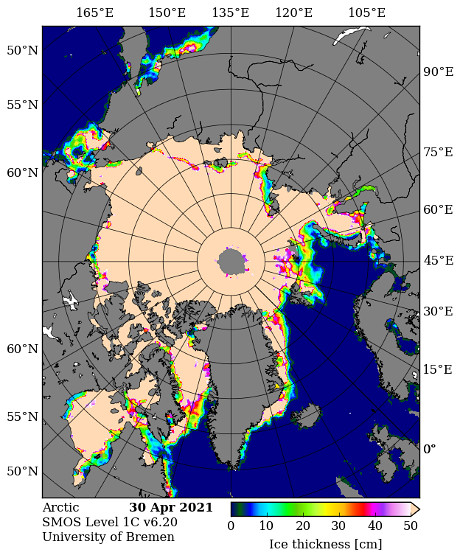
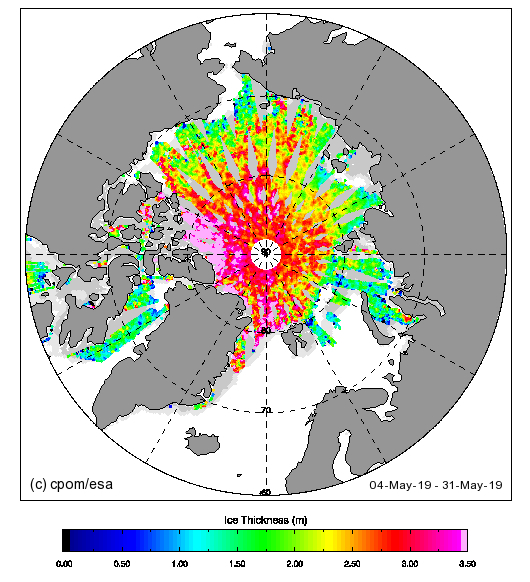
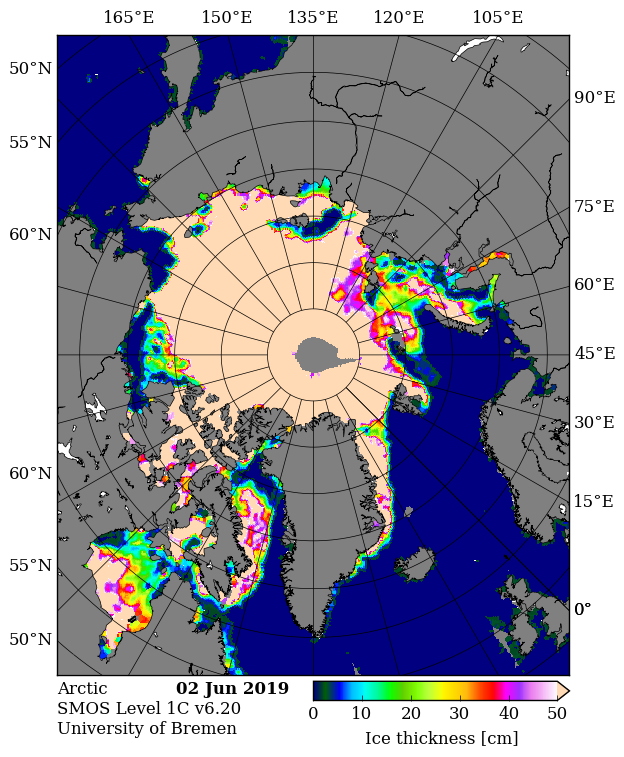
The Alfred Wegener Institute have recently released the reanalysed CryoSat-2/SMOS sea ice thickness data for mid April:
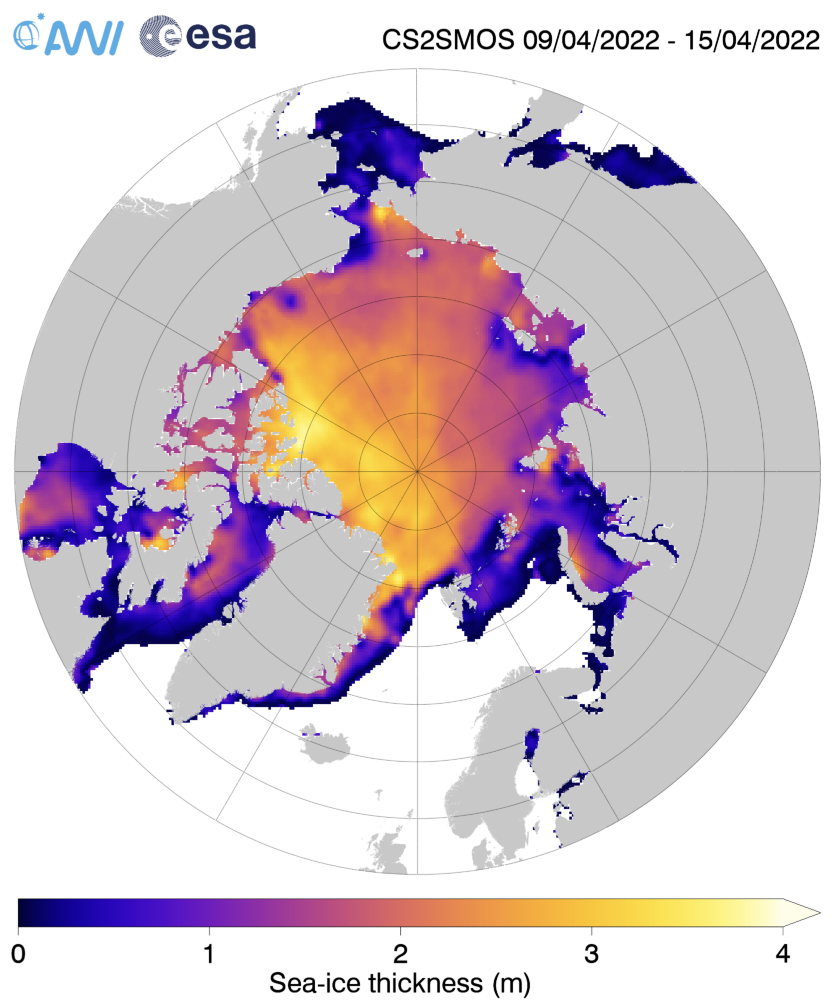
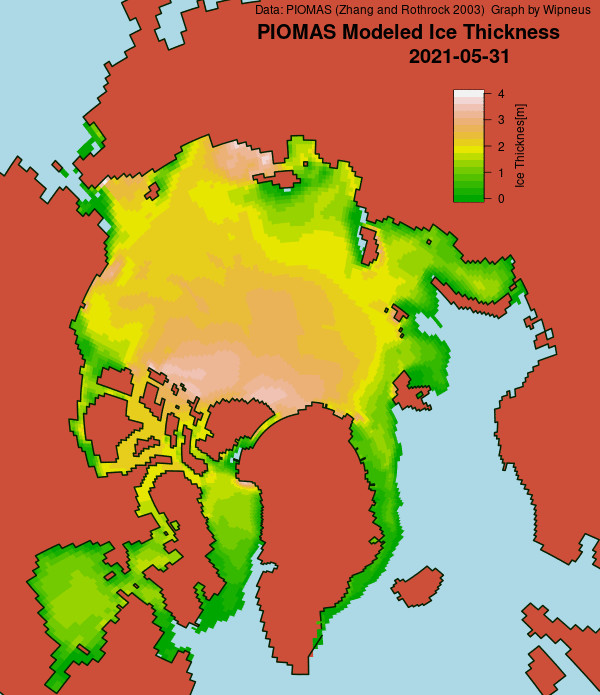
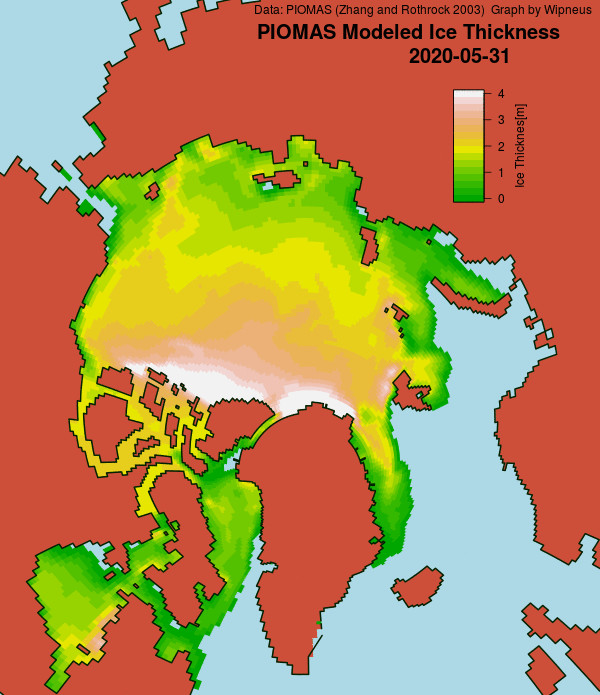
We now anxiously await the PIOMAS modelled thickness data for May. Meanwhile the AWI data suggest that the thickest ice in the Central Arctic Basin is currently to be found north of Axel Heiberg Island, with the thin ice in the Laptev Sea ripe for further extent reductions:
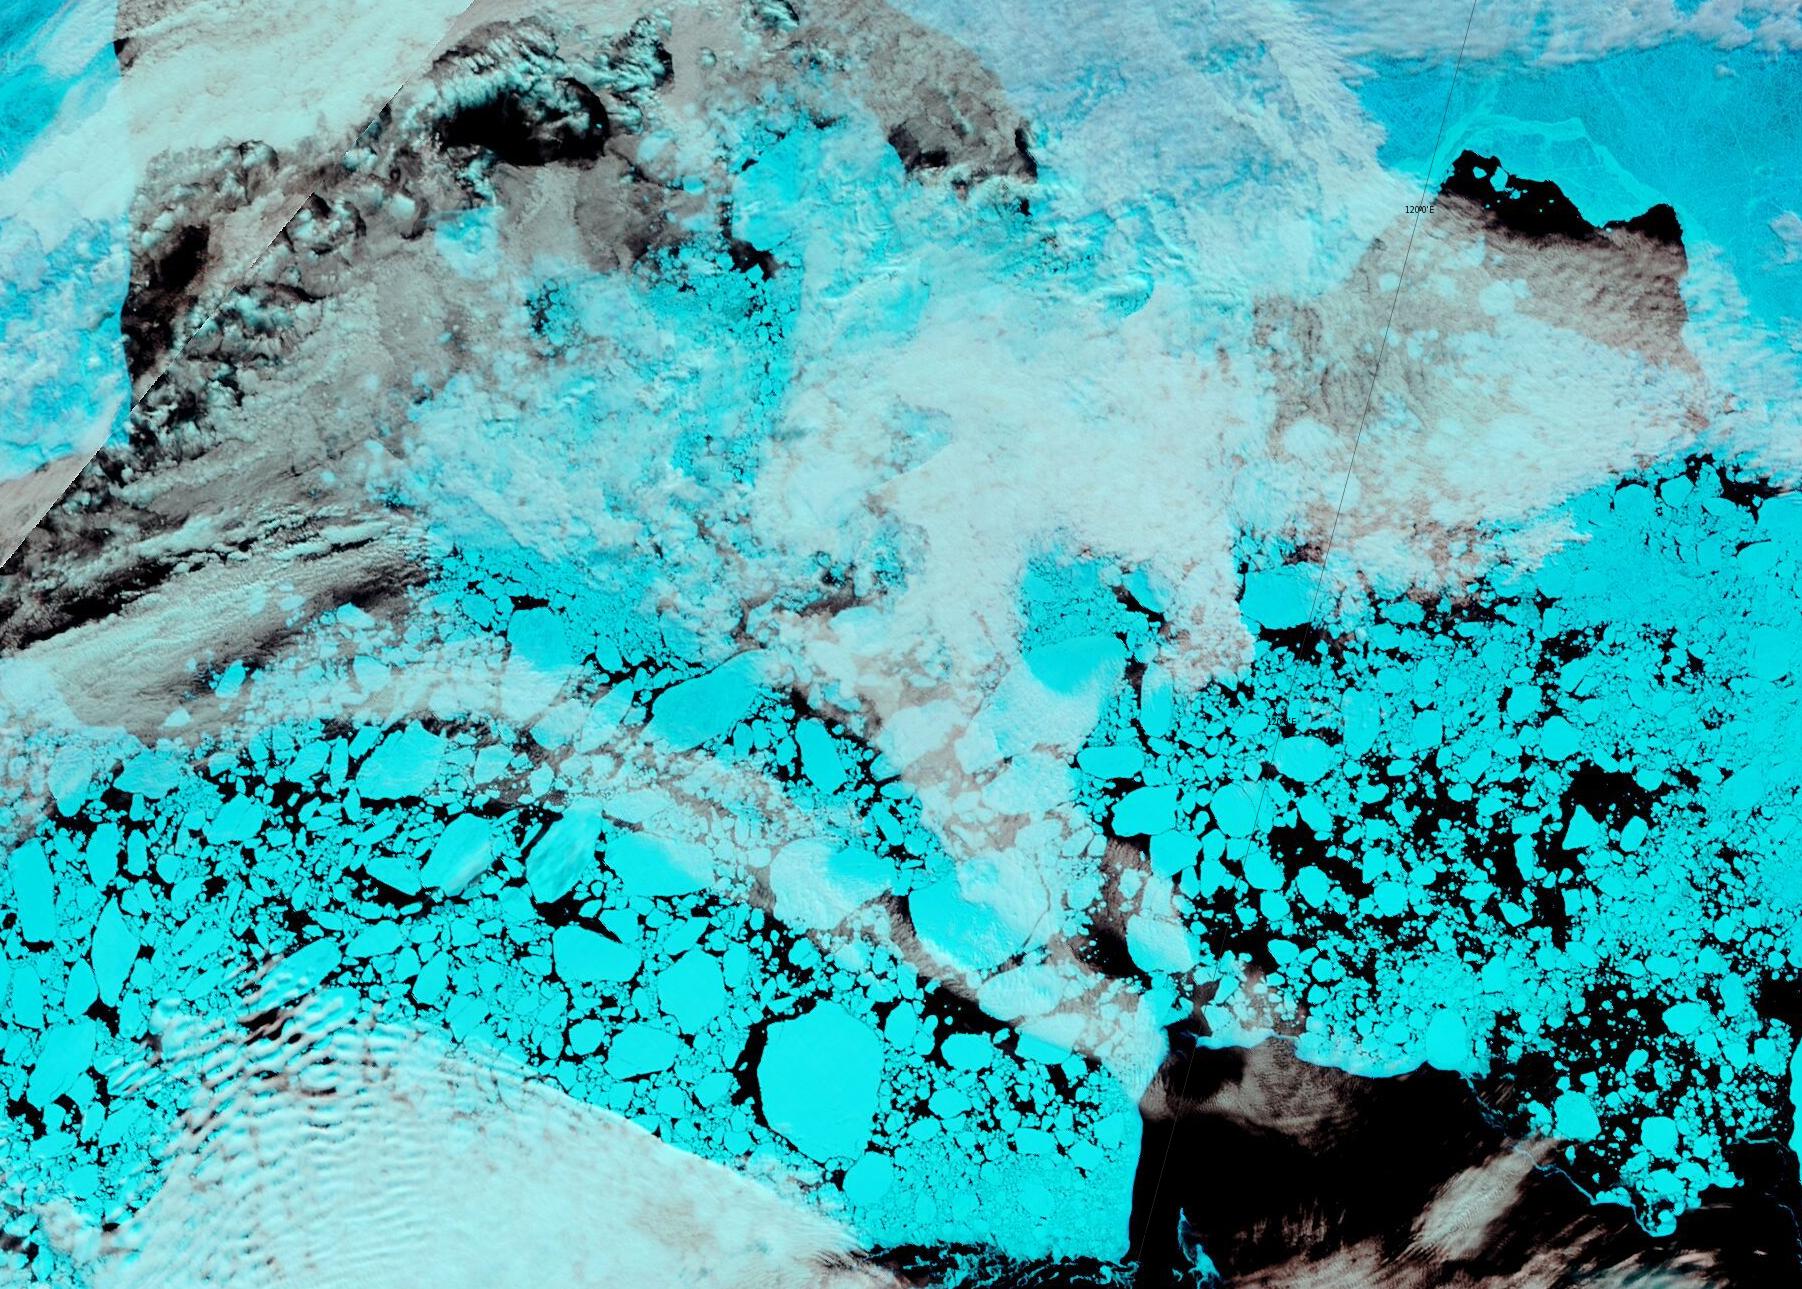
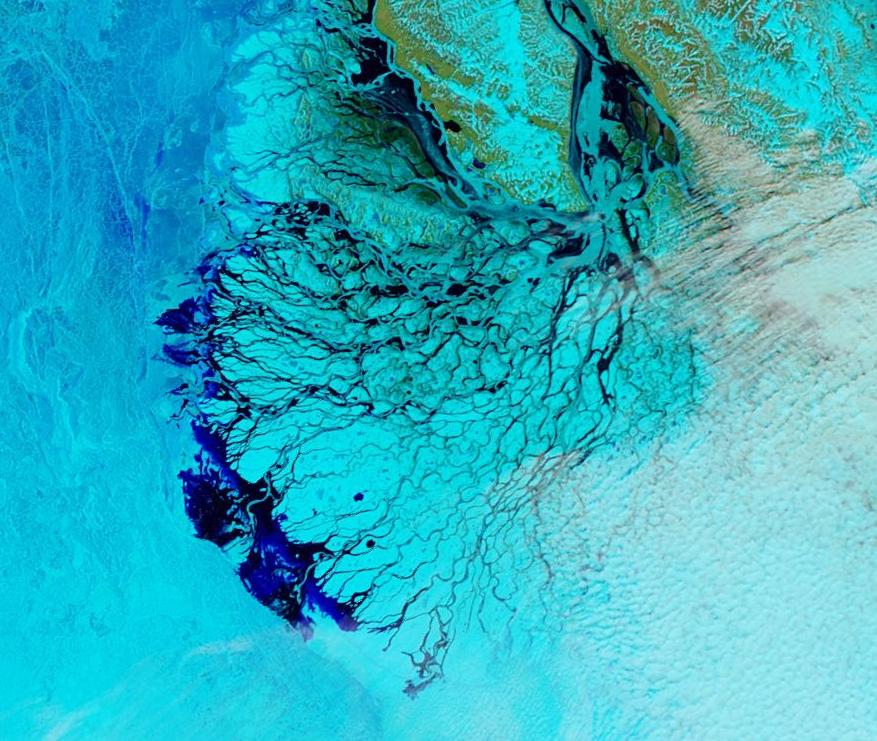
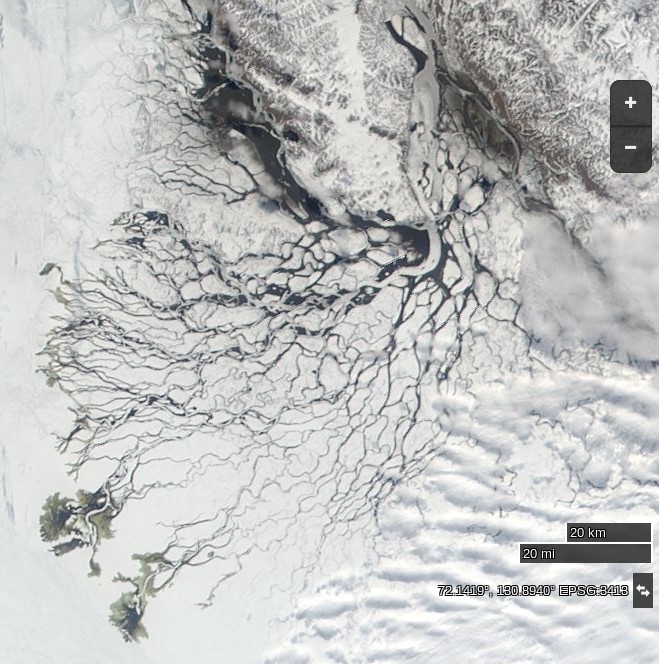
Large areas of the fast ice in the Laptev Sea are now showing evidence of surface melt:
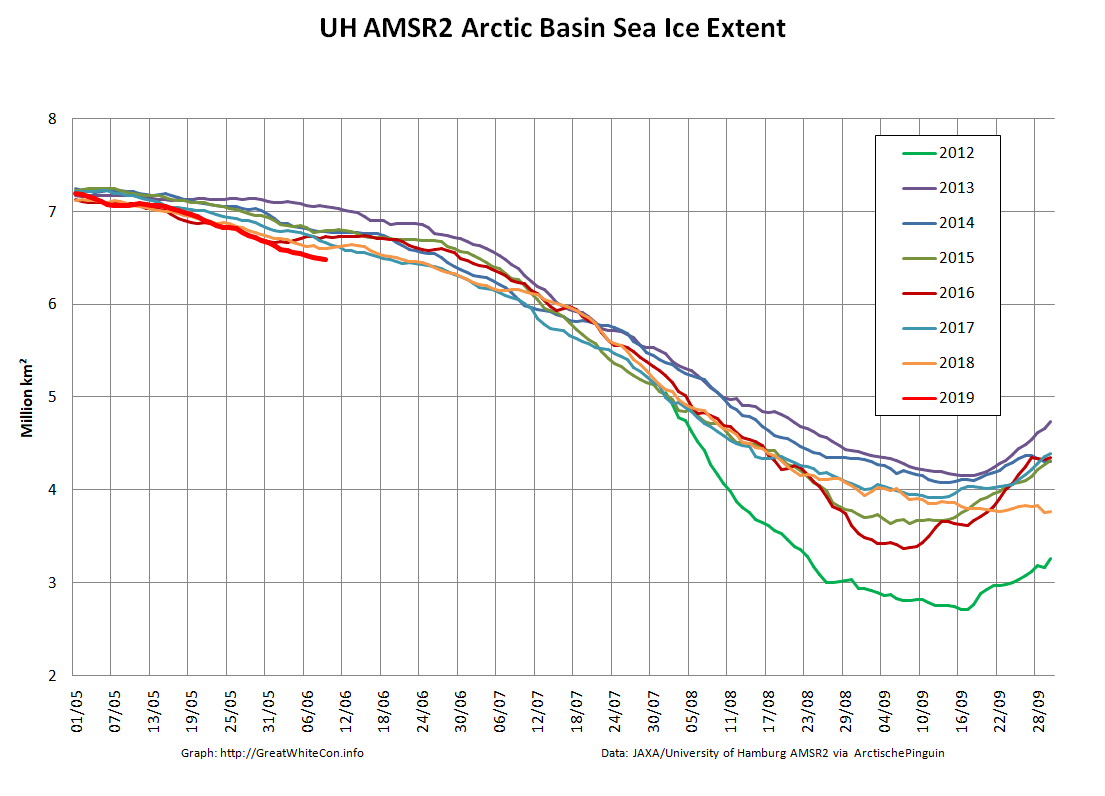
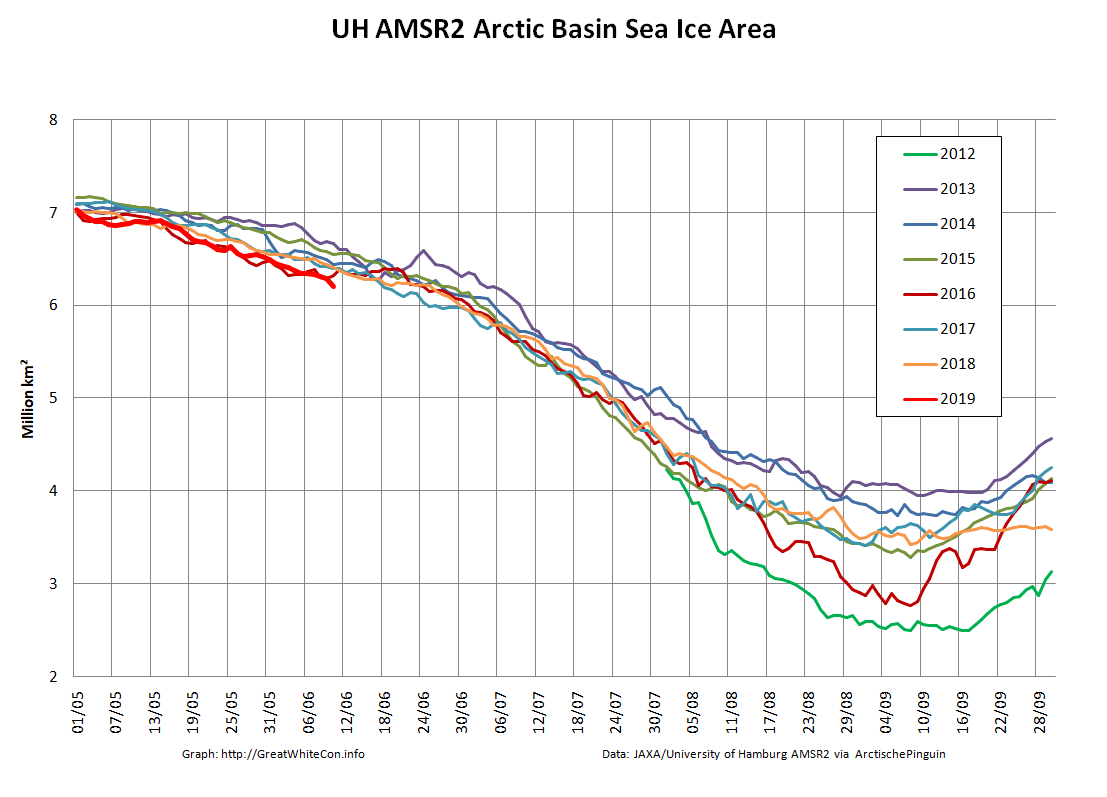
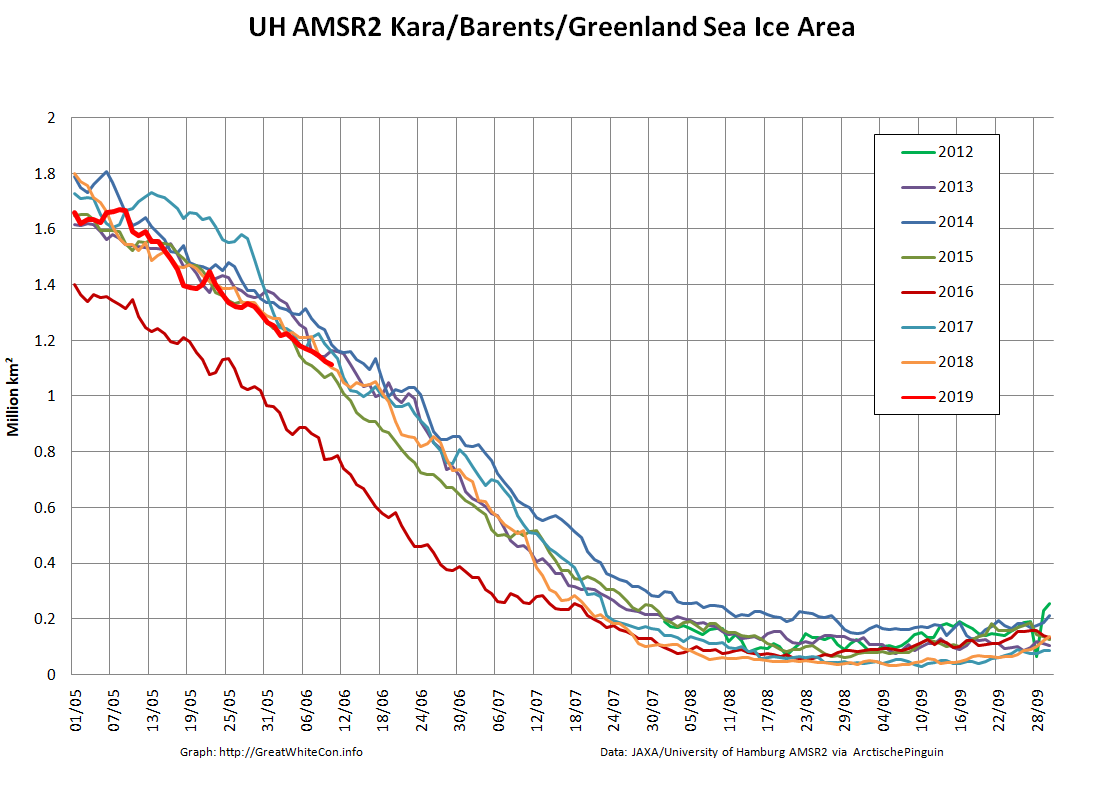
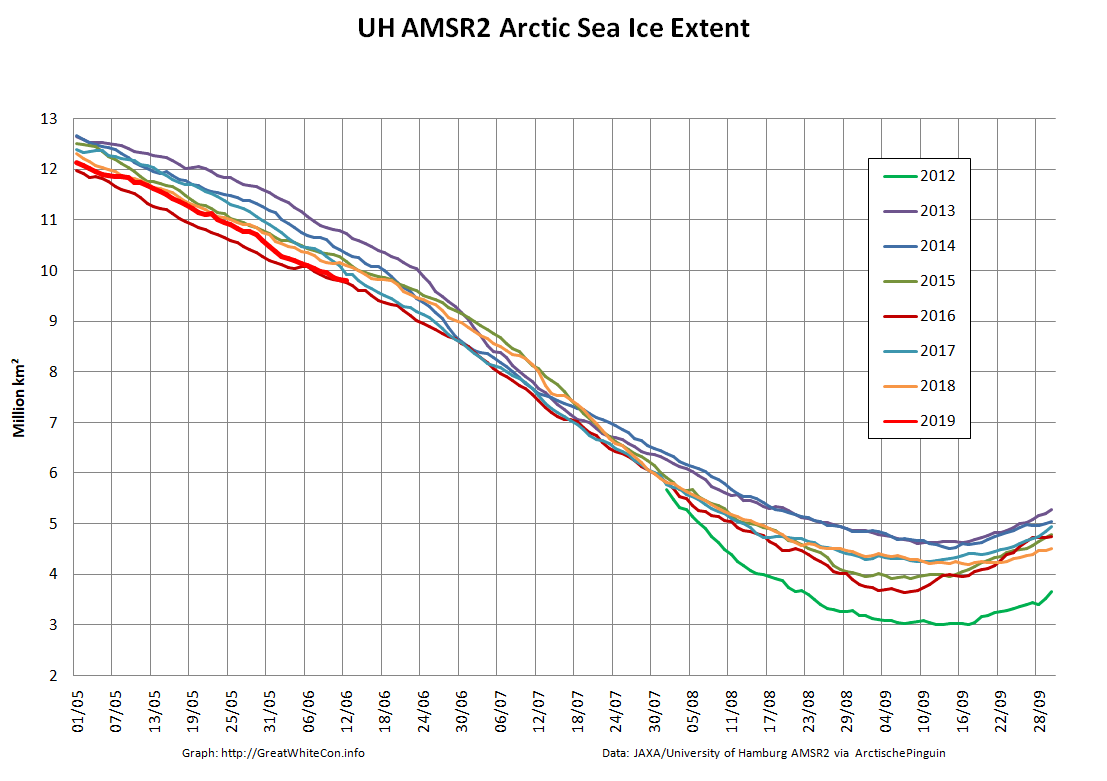
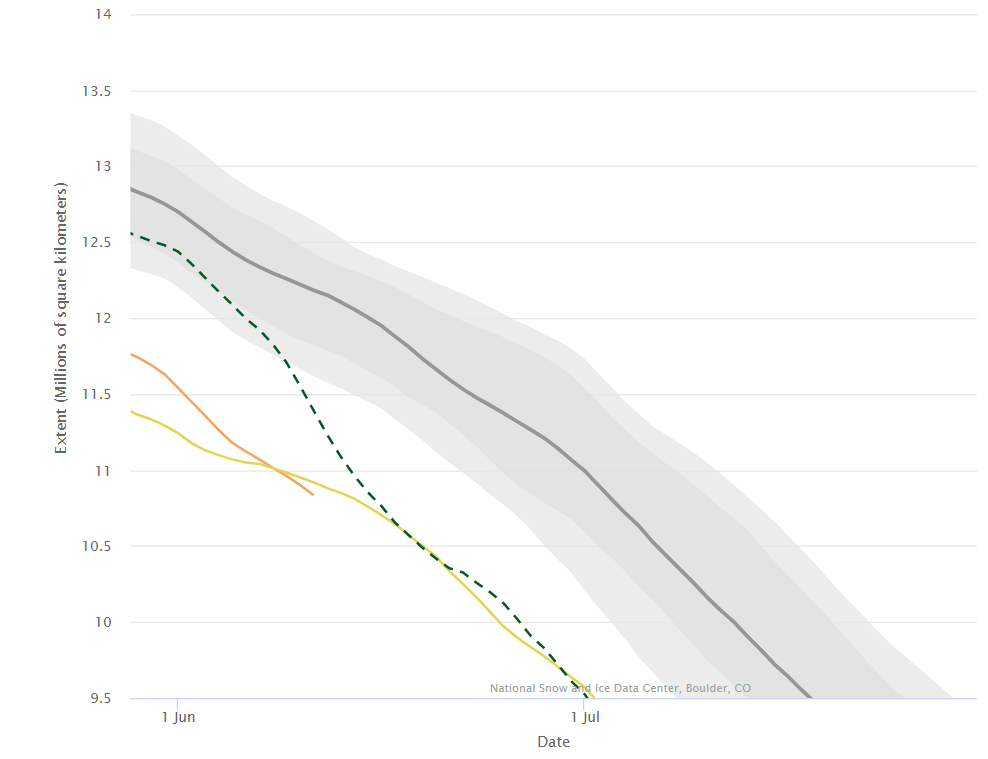
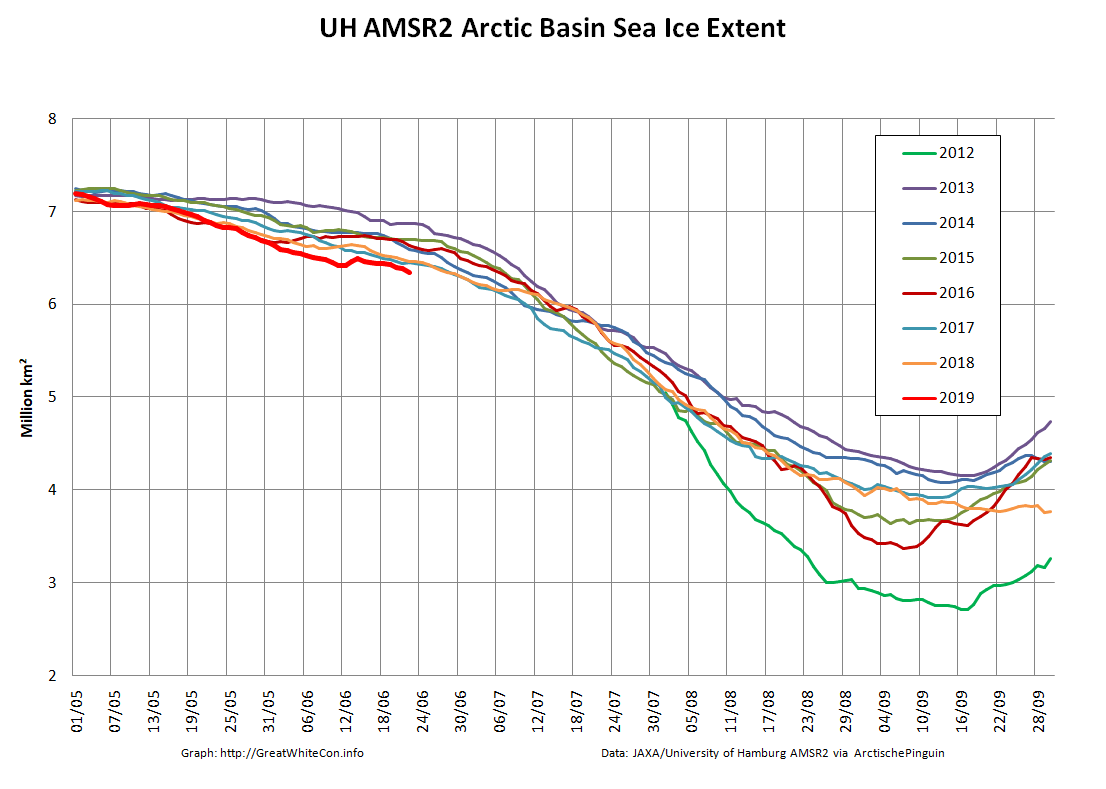
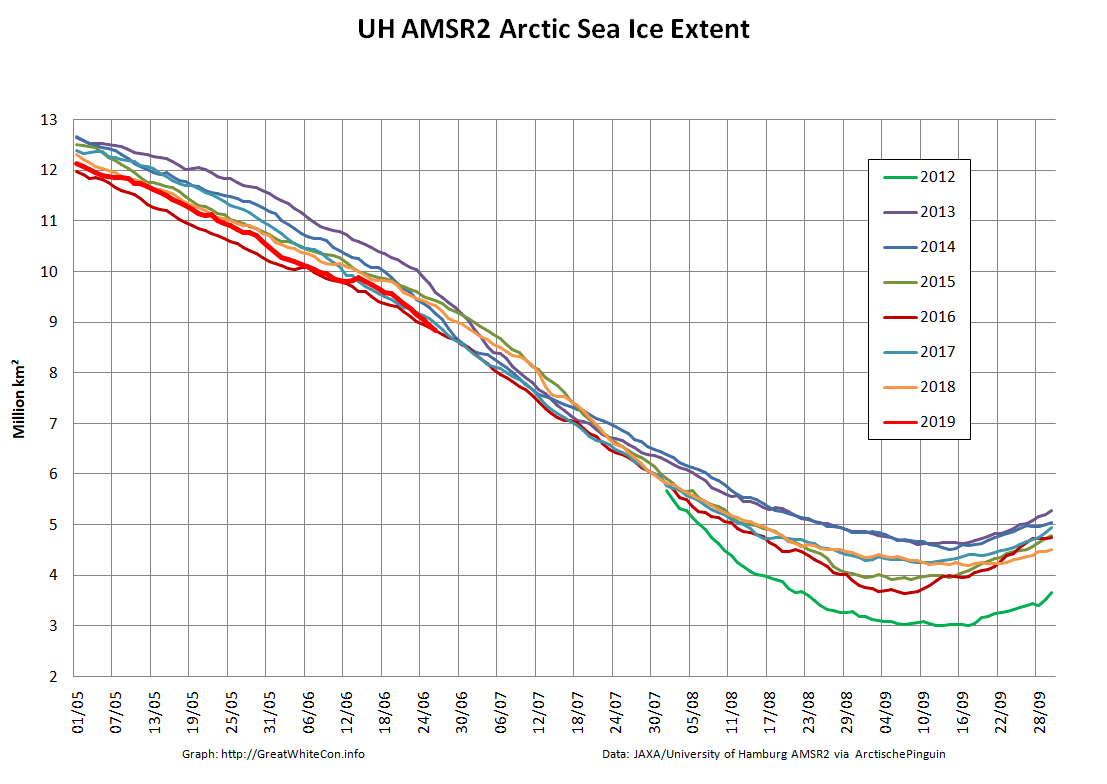
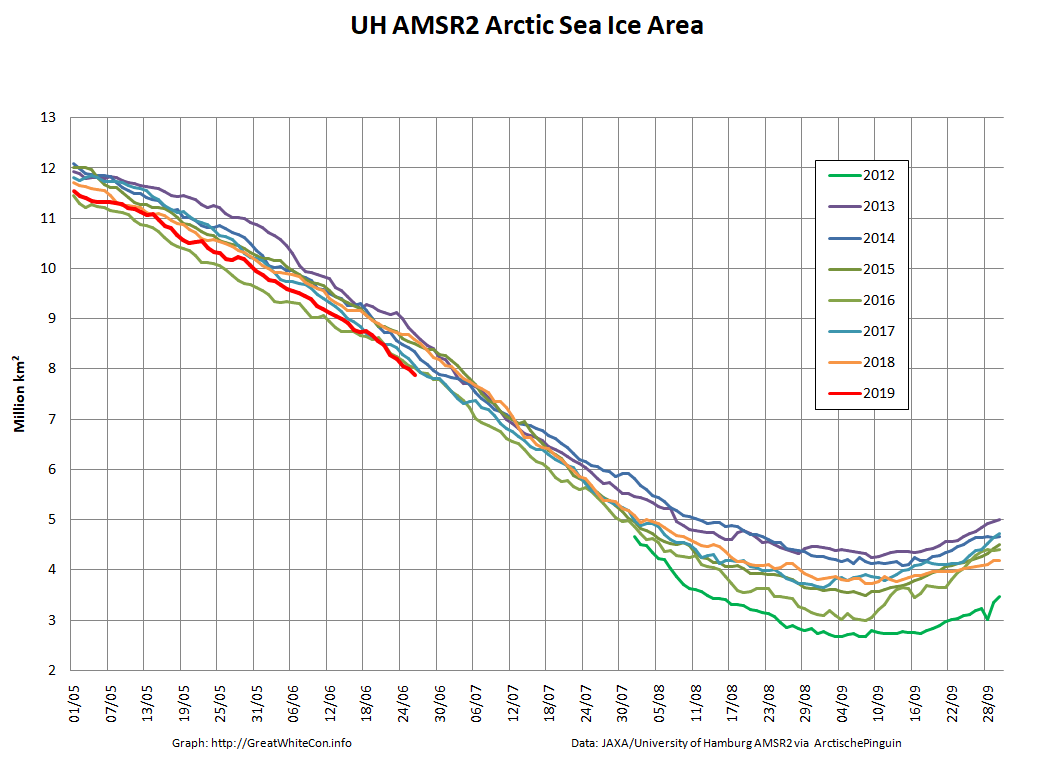
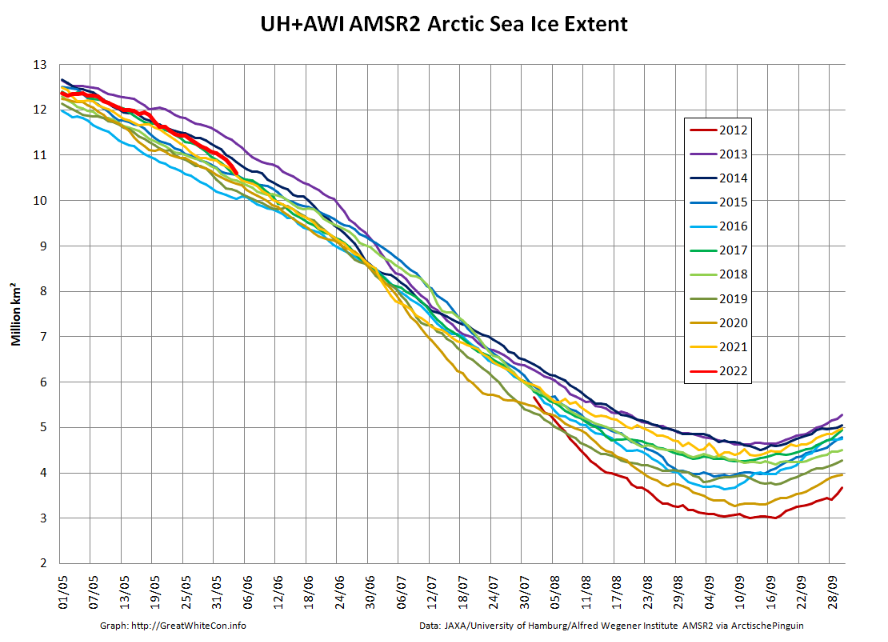
The JAXA ViSHOP web site is still down, so here are the latest “high resolution” AMSR2 numbers for June 4th:
Extent: 10.60 million square kilometers, Area: 9.77 million square kilometers
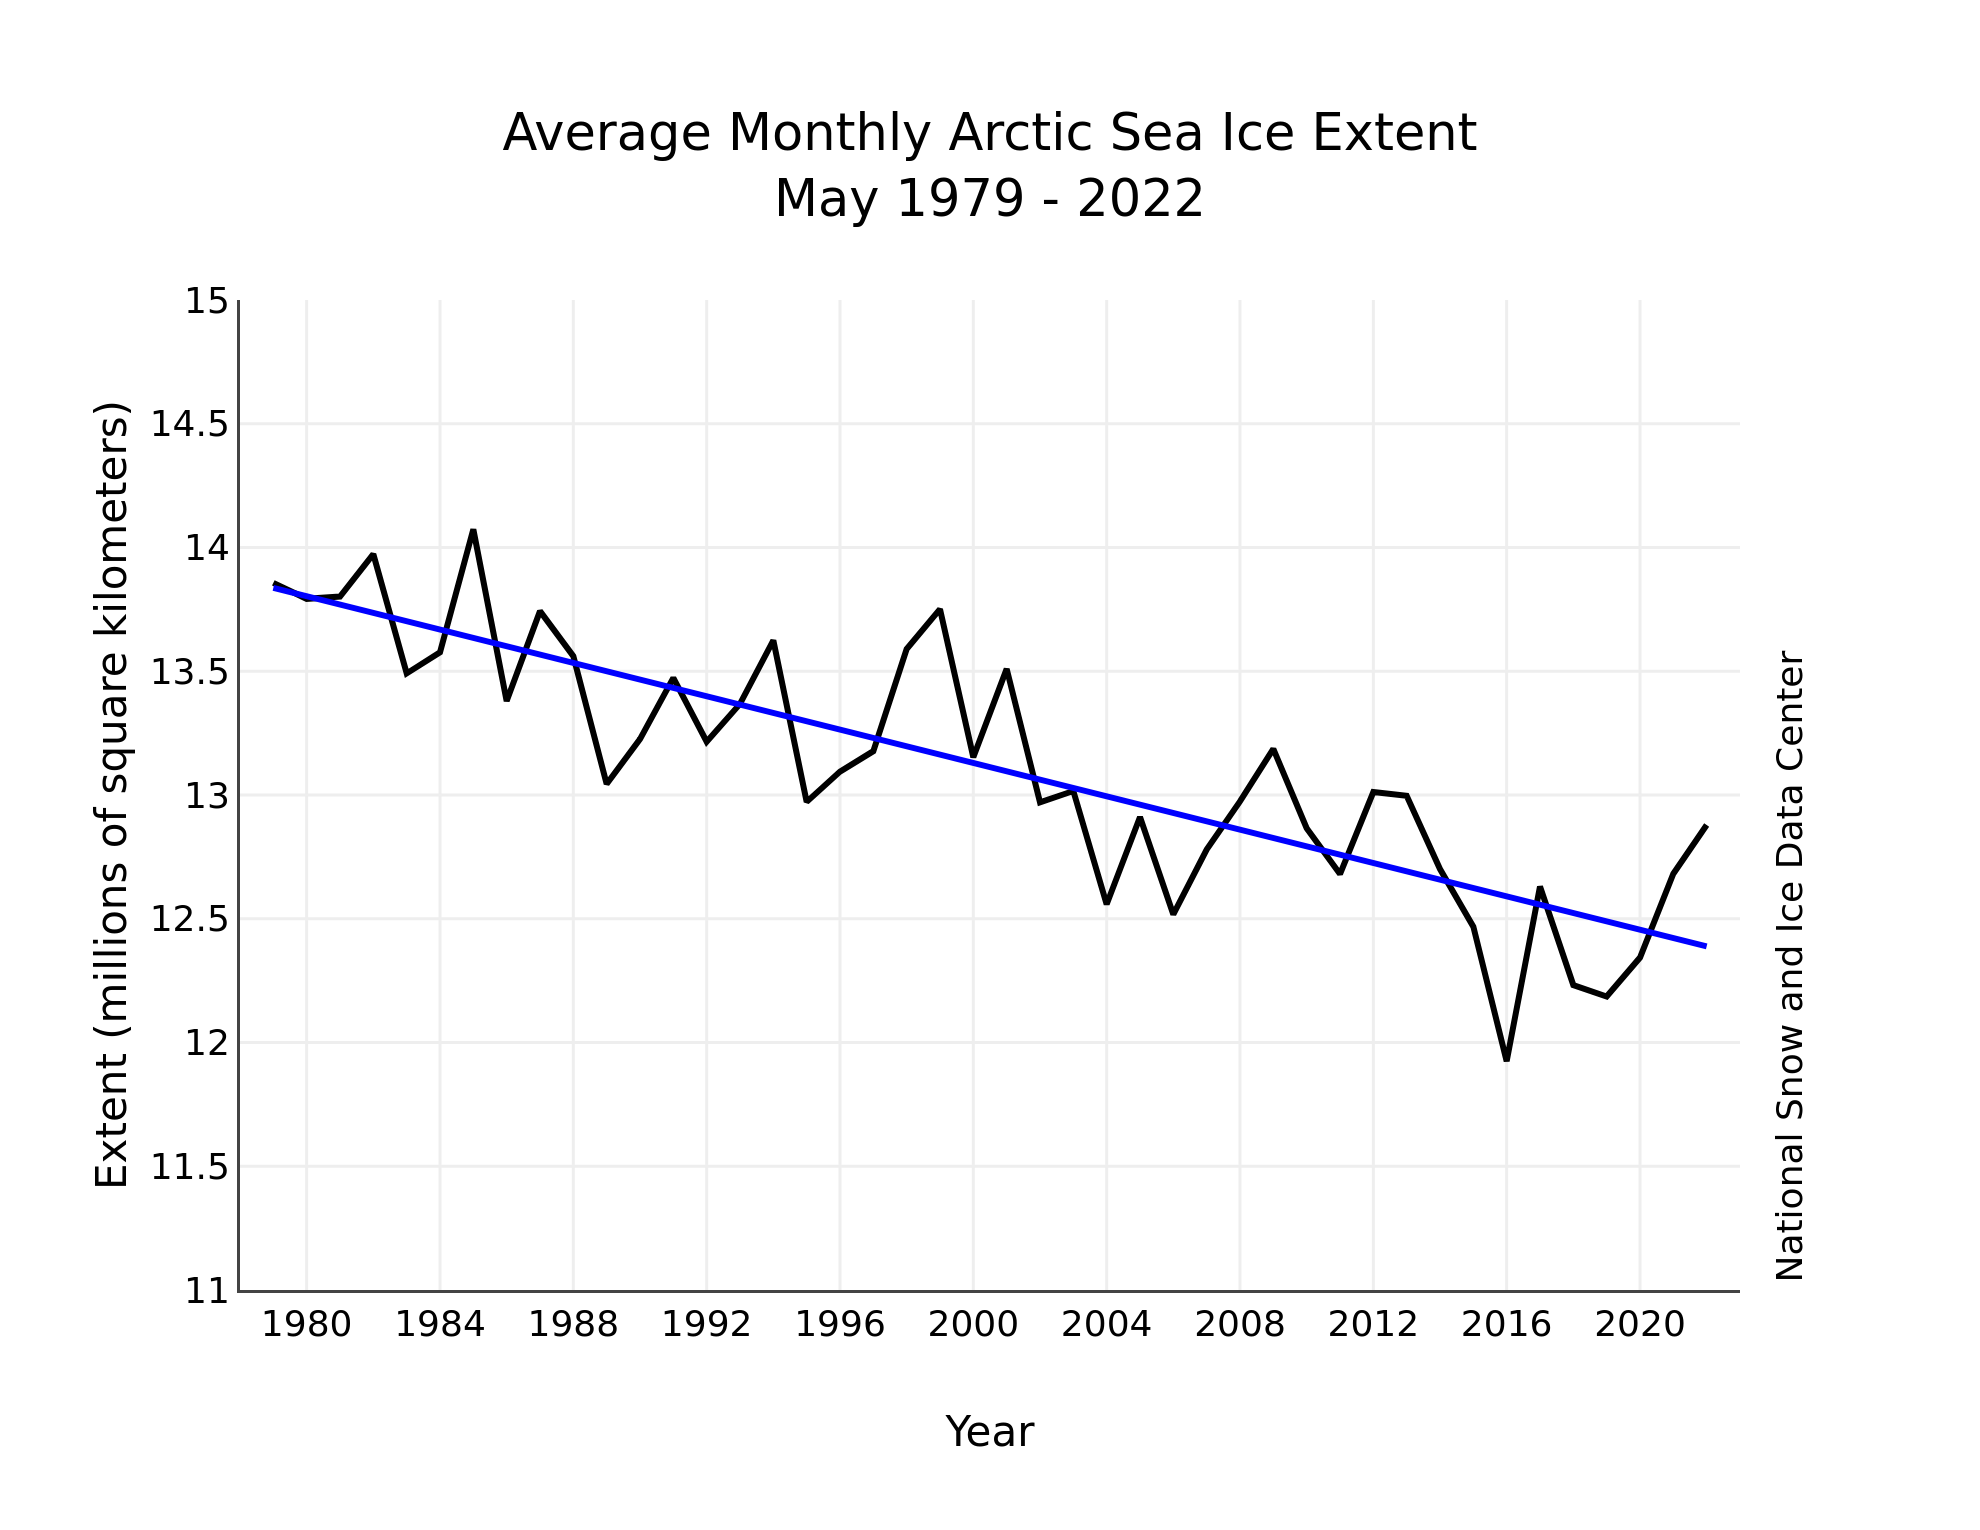
The June edition of the NSIDC’s Arctic Sea Ice News summarises May 2022 as follows:
Average Arctic sea ice extent for May 2022 was 12.88 million square kilometers (4.97 million square miles). This was 410,000 square kilometers (158,000 square miles) below the 1981 to 2010 average, yet it was the highest May extent since 2013.
As was the case for April, sea ice extent was slow to decline, losing only 1.28 million square kilometers (494,000 square miles) during the month.
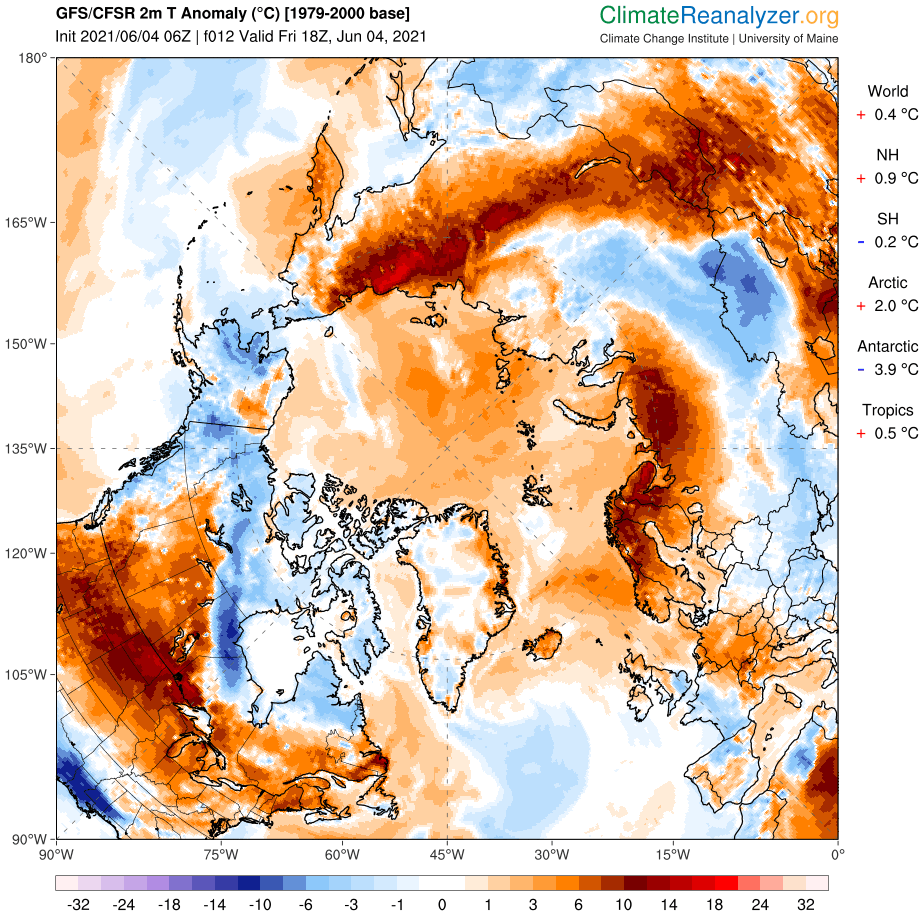
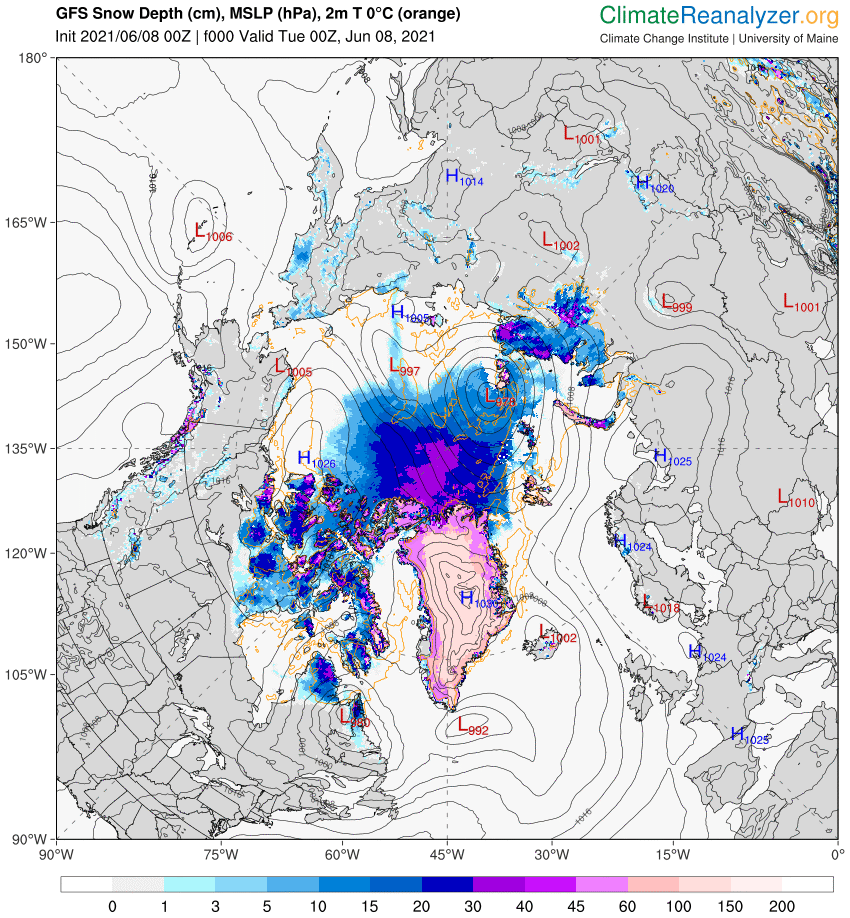
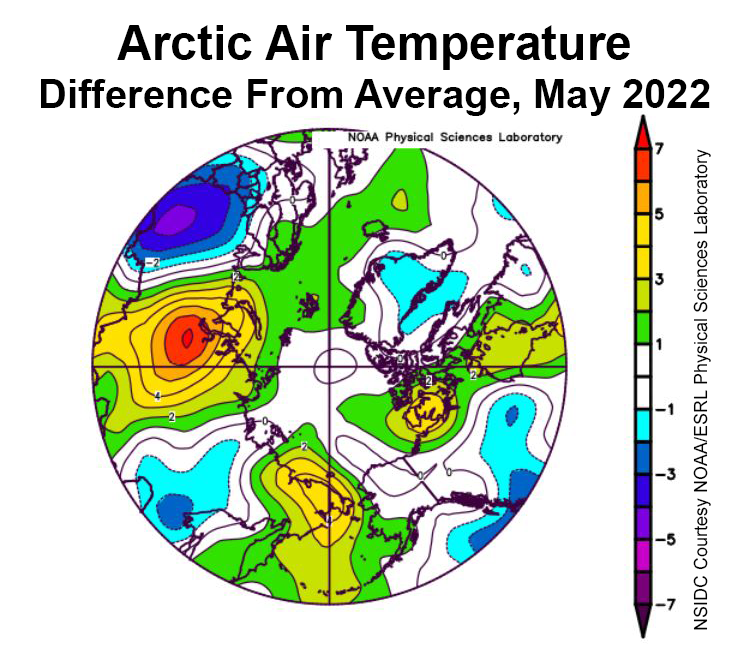
Within the Arctic Ocean, air temperatures at the 925 mb level (about 2,500 feet above the surface) were near average over most of the region in May, and 1 to 5 degrees Celsius (2 to 9 degrees Fahrenheit) above the 1981 to 2010 average along the coast of the Kara and East Siberian Seas, the East Greenland Sea, and the Canadian Archipelago:
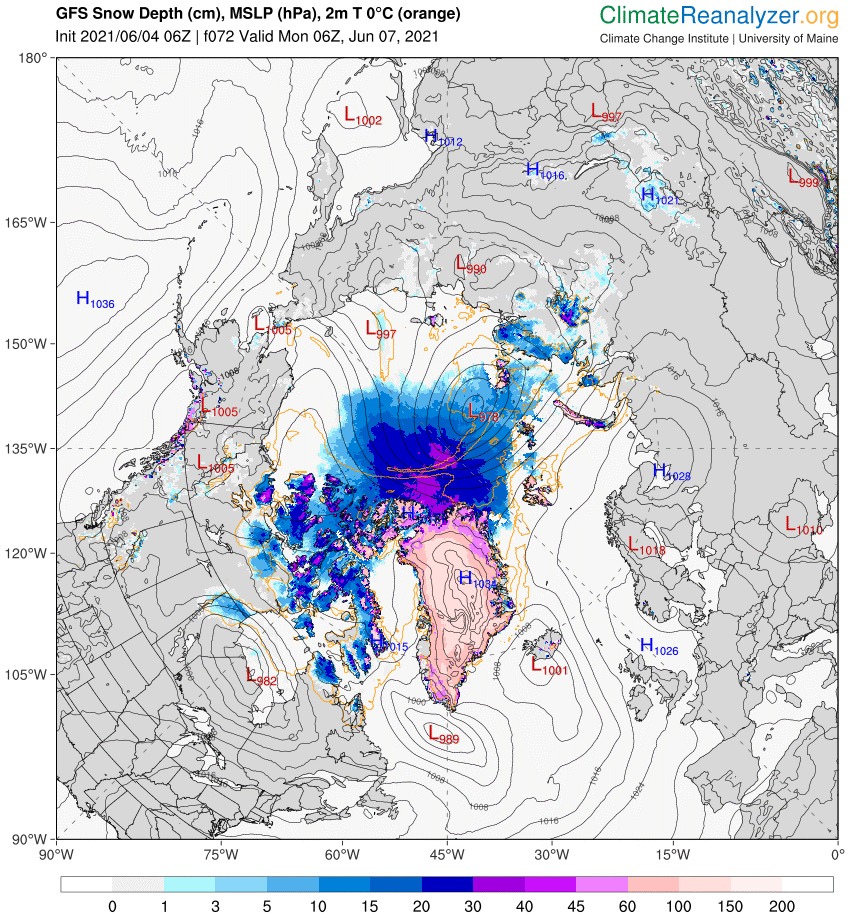
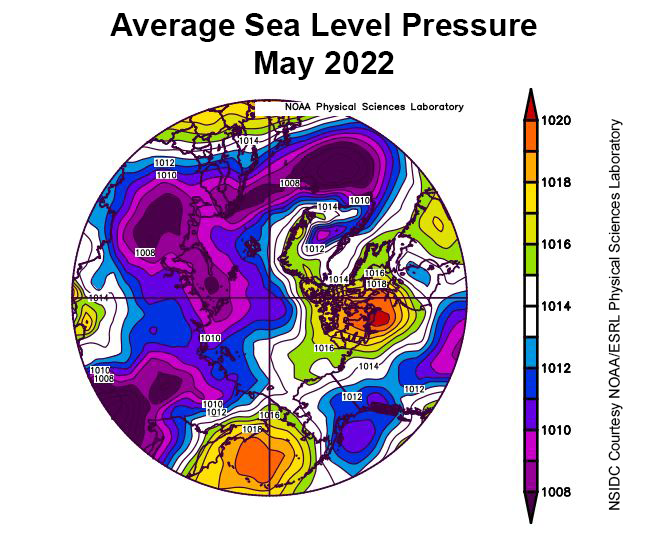
Areas where openings formed within the ice cover were dominated by off-shore ice motion, pushing ice poleward as well as toward Fram Strait. This offshore ice motion is largely driven by a pattern of low sea level pressure over Eurasia coupled with high pressure over the Pacific sector of the Arctic:
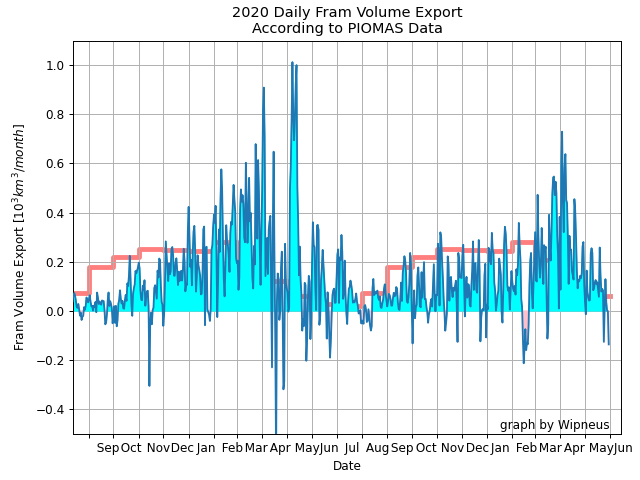
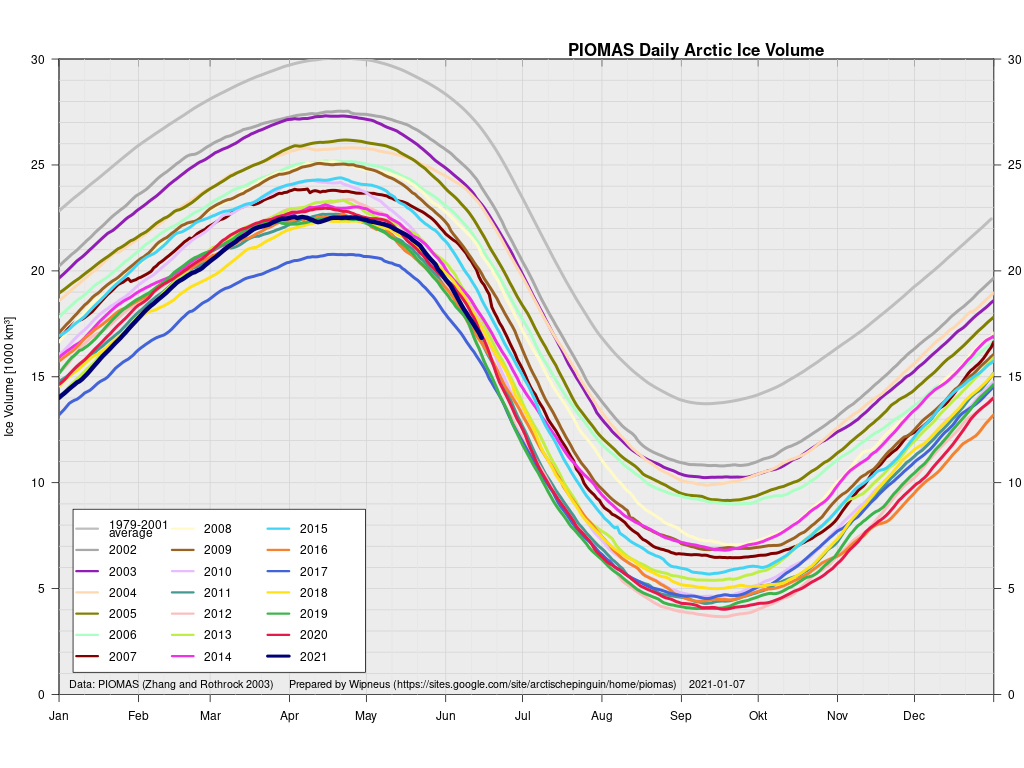
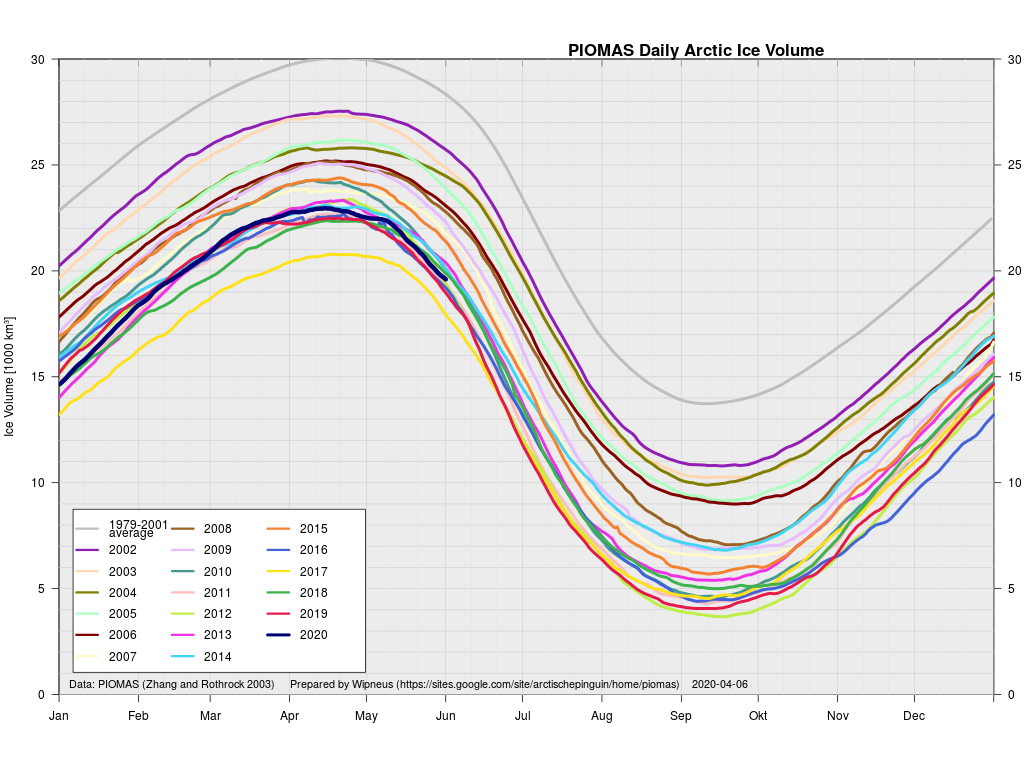
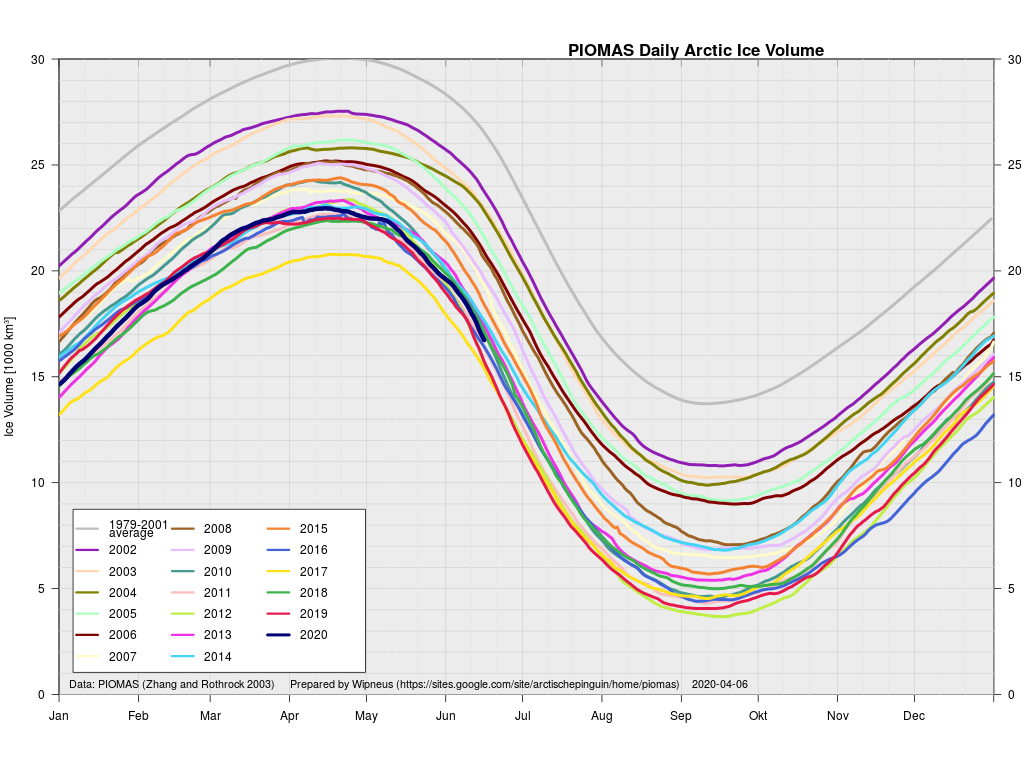
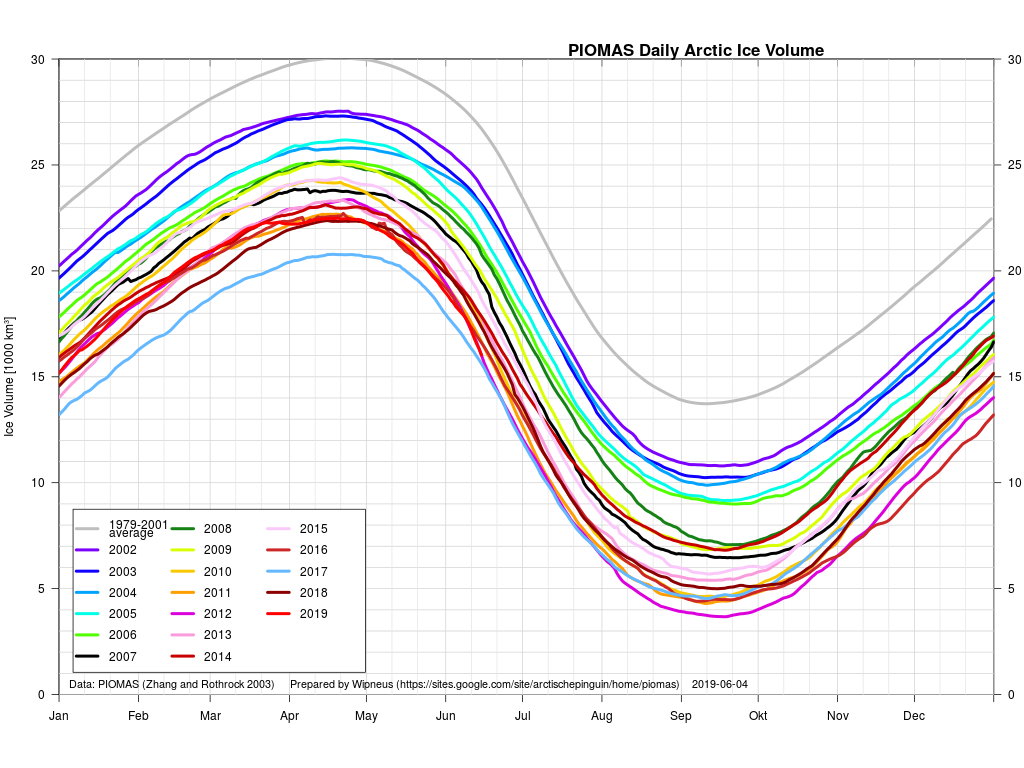
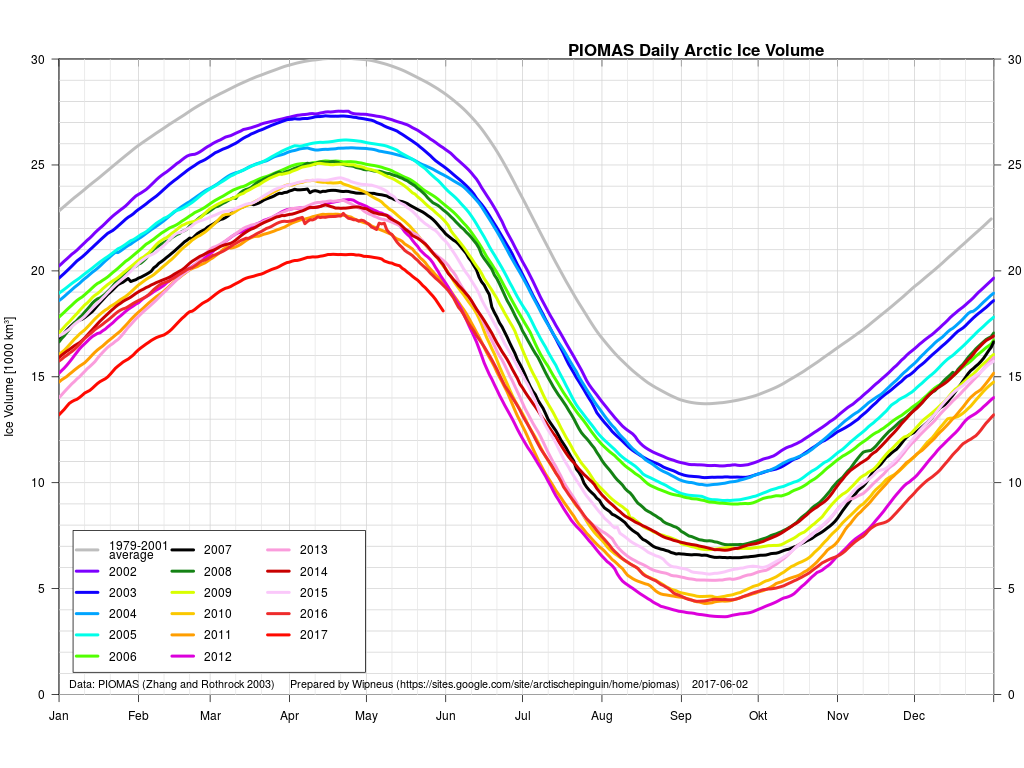
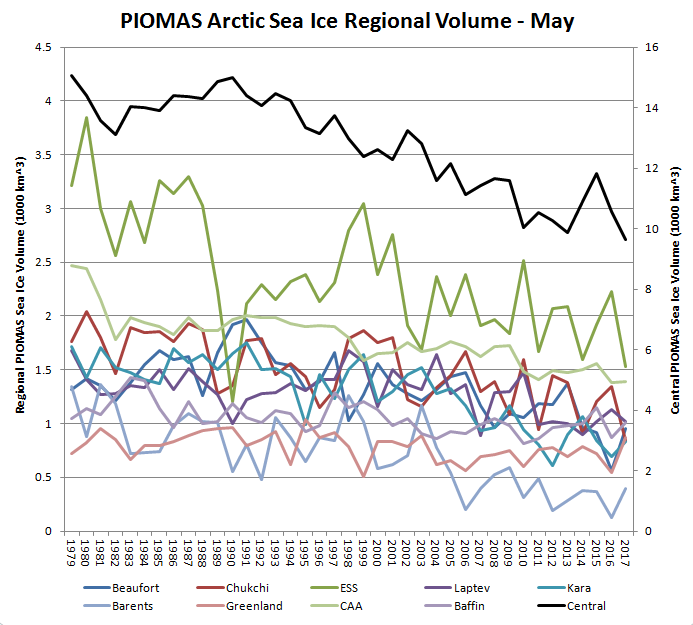
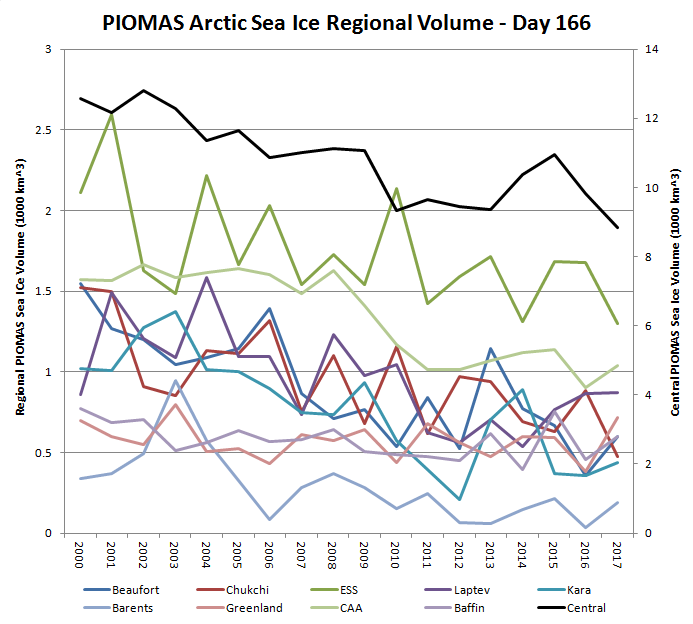
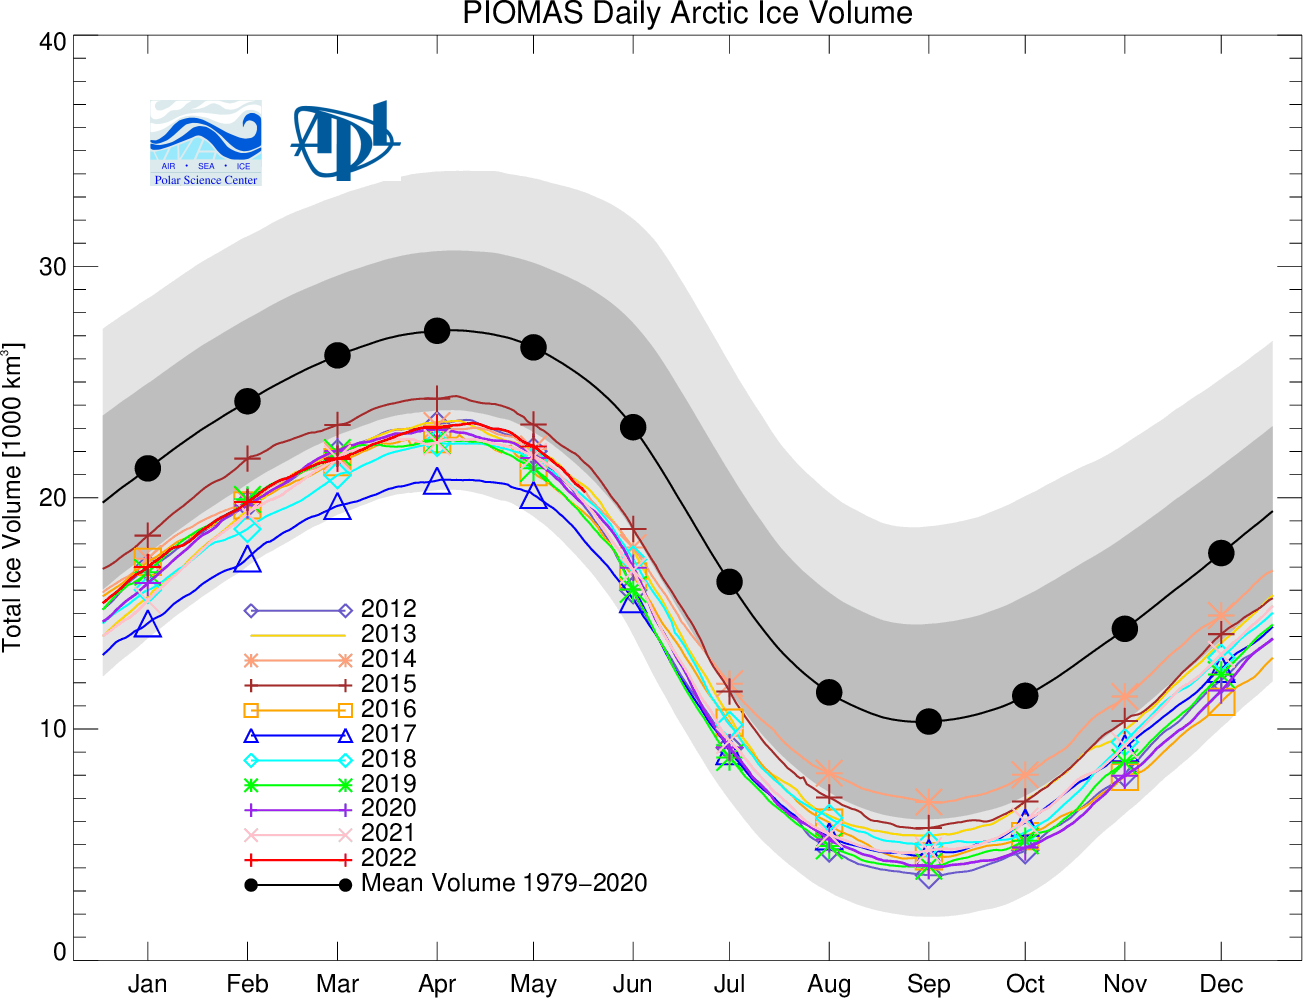
The Polar Science Center at the University of Washington has released the PIOMAS volume data for May 2022:
Average Arctic sea ice volume in May 2022 was 22,000 km3. This value is the 11th lowest on record for May, about 2,100 km3 above the record set in 2017. Monthly ice volume was 39% below the maximum in 1979 and 24% below the mean value for 1979-2021. Average May 2022 ice volume was 1.5 standard deviations above the 1979-2021 trend line.
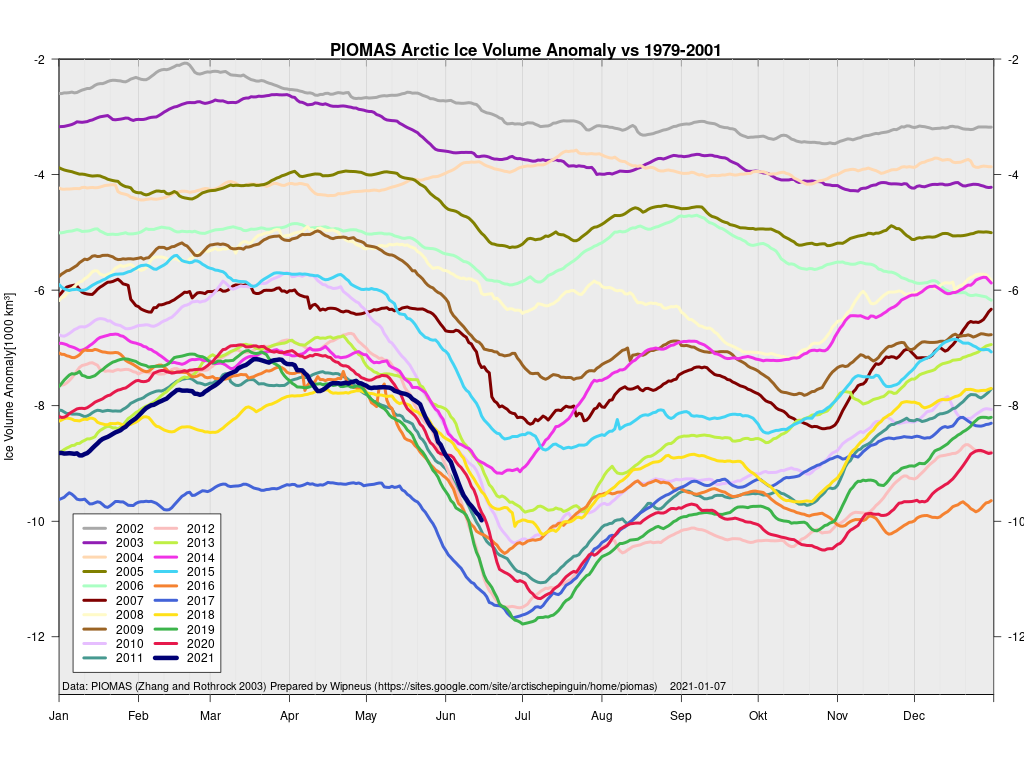
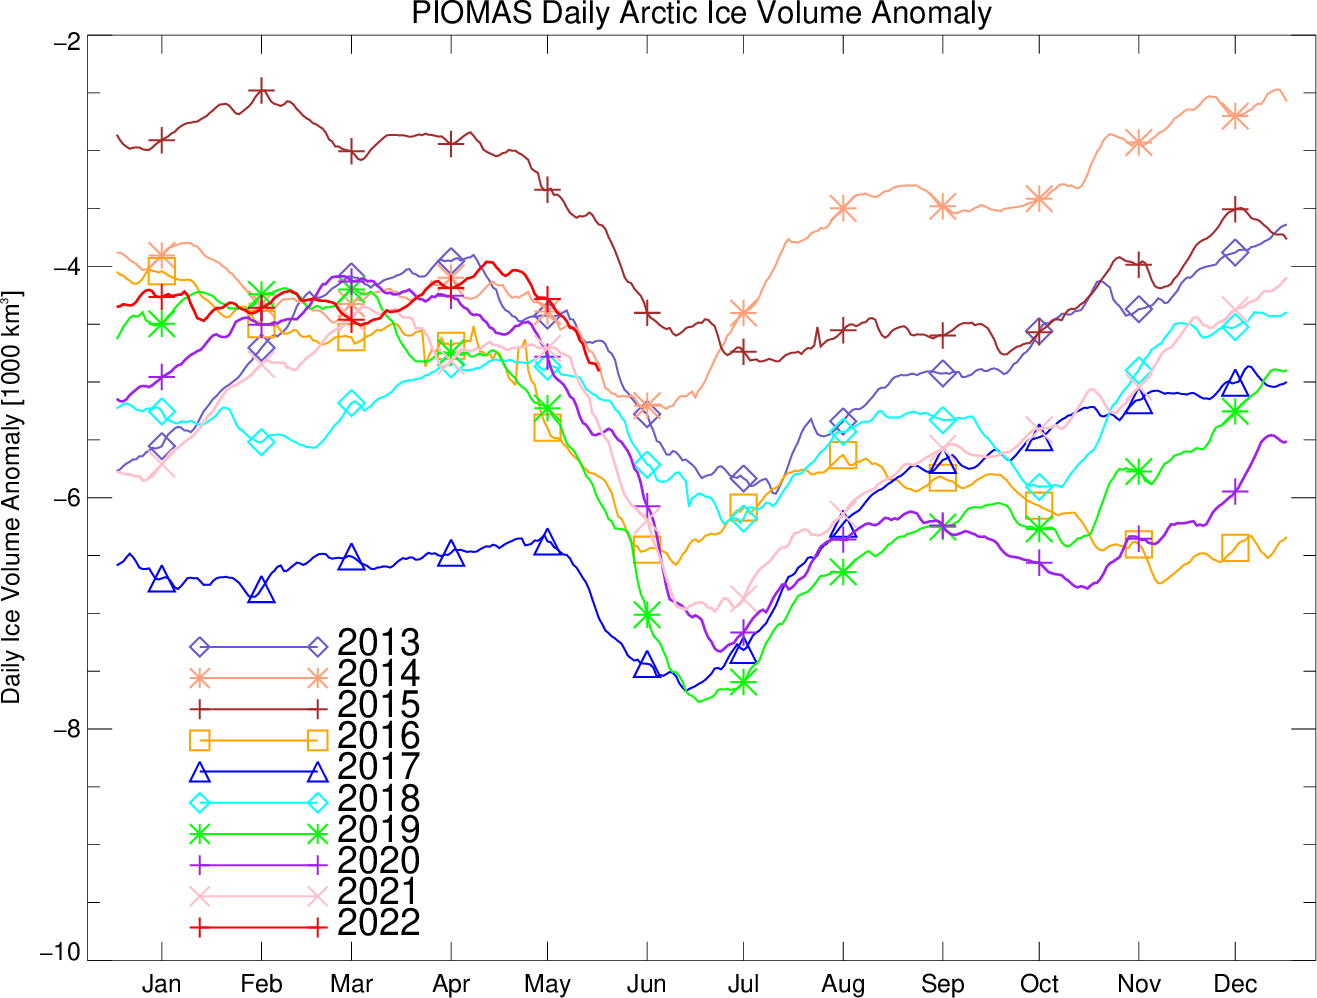
Ice growth anomalies for May 2022 continued to be at the upper end of the most recent decade (Fig 4) with a mean ice thickness (above 15 cm thickness) at the middle of recent values.
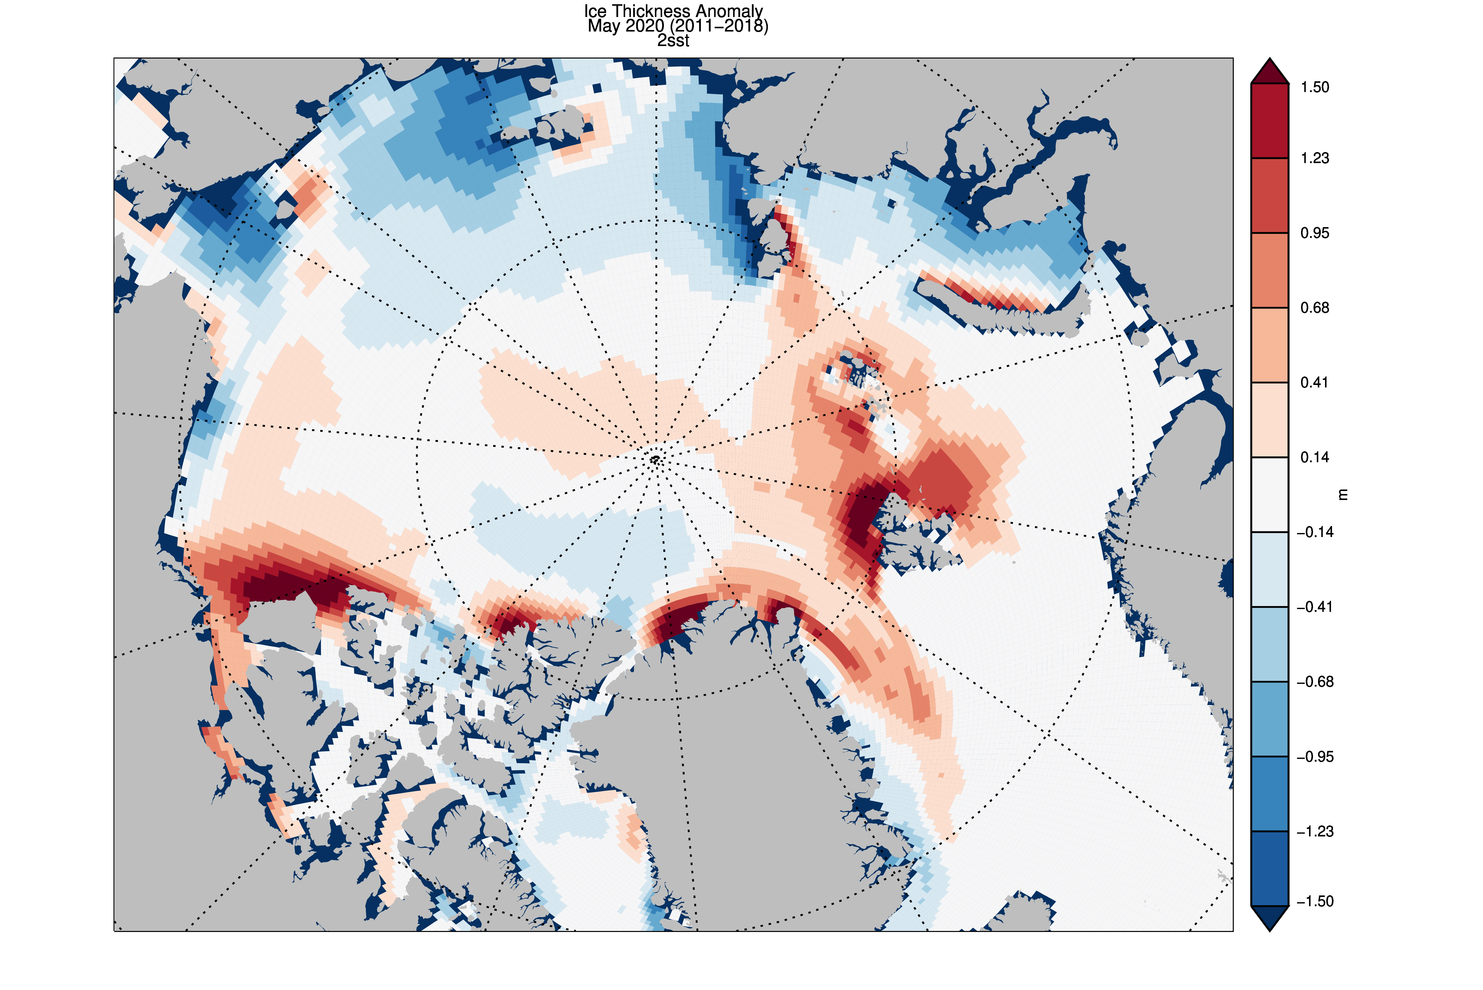
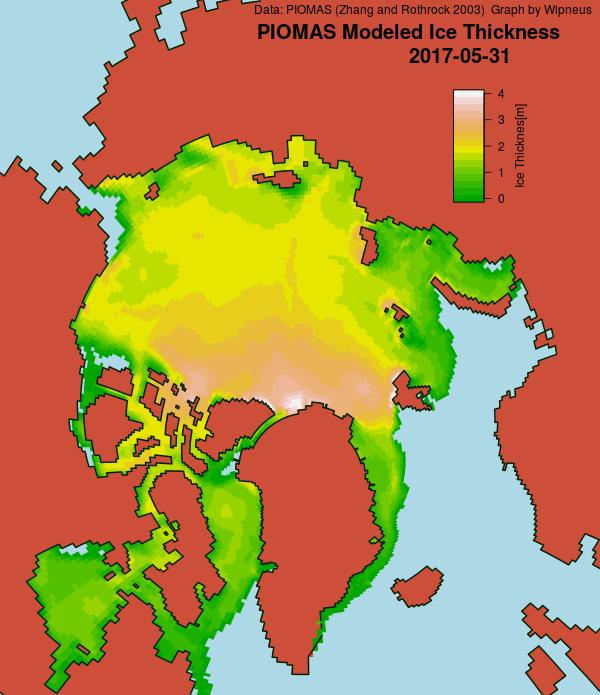
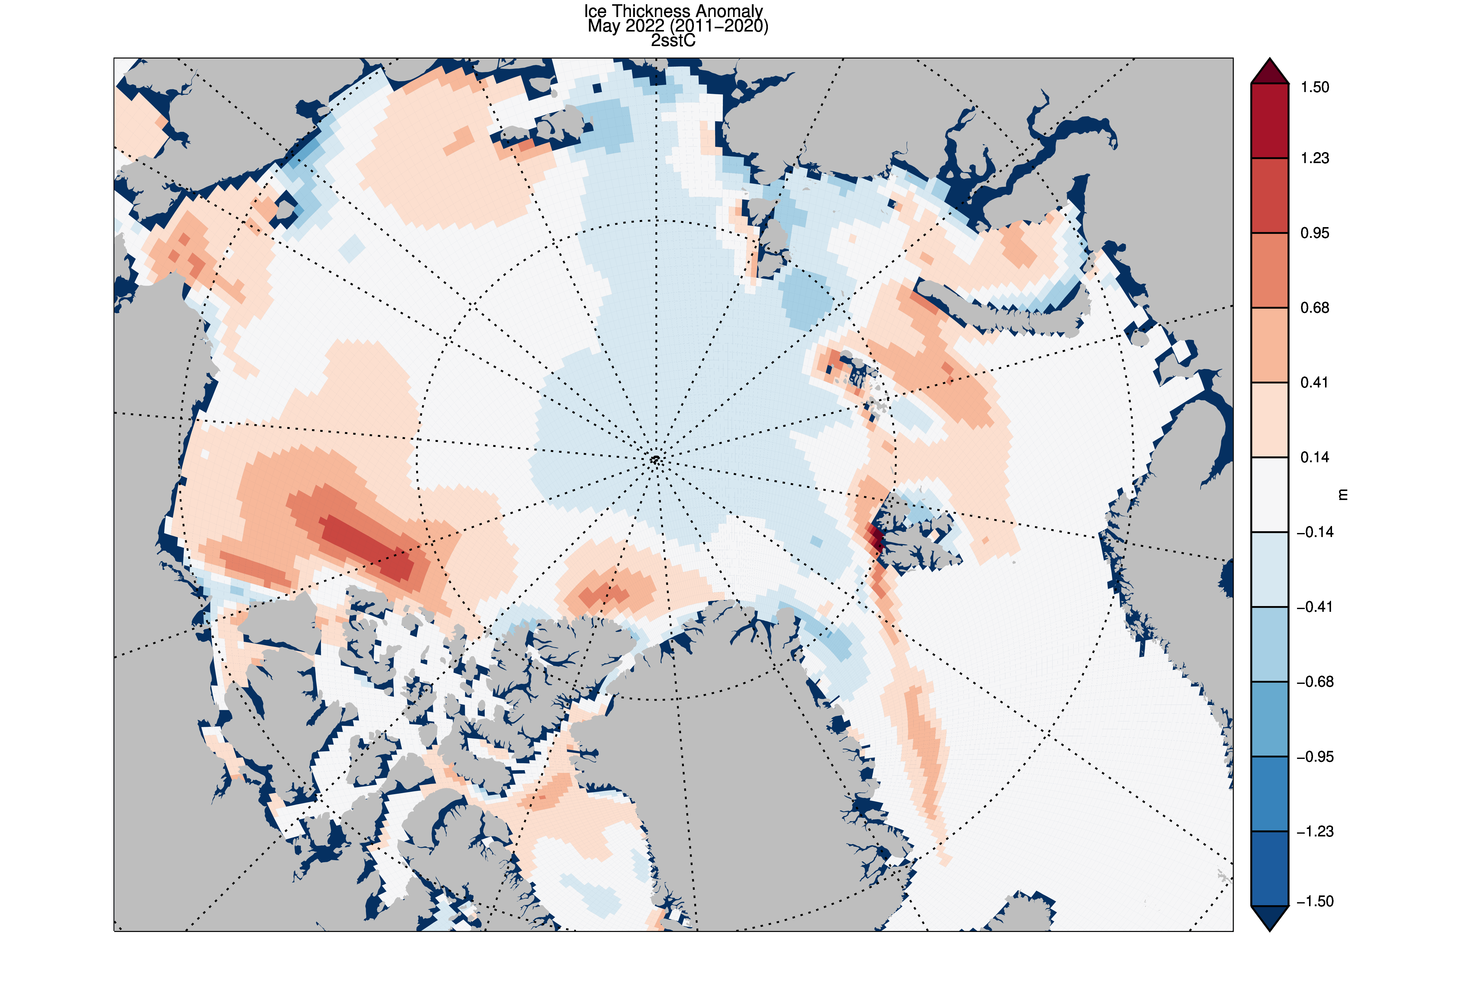
The ice thickness anomaly map for May 2022 relative to 2011-2020 continues the previous months pattern that divides the Arctic in two halves with positive anomalies in the “Western Arctic” , a strong positive anomaly in the Eastern Beaufort but negative anomalies in “Eastern Arctic”.
The development of a positive ice thickness anomaly in the Eastern Beaufort appears to be related to anomalous sea ice drift during February that transported ice along the Canadian Coast into the Beaufort. Positive anomalies in the Greenland and Barents Seas seem to be associated with higher than normal sea ice extent in those areas.
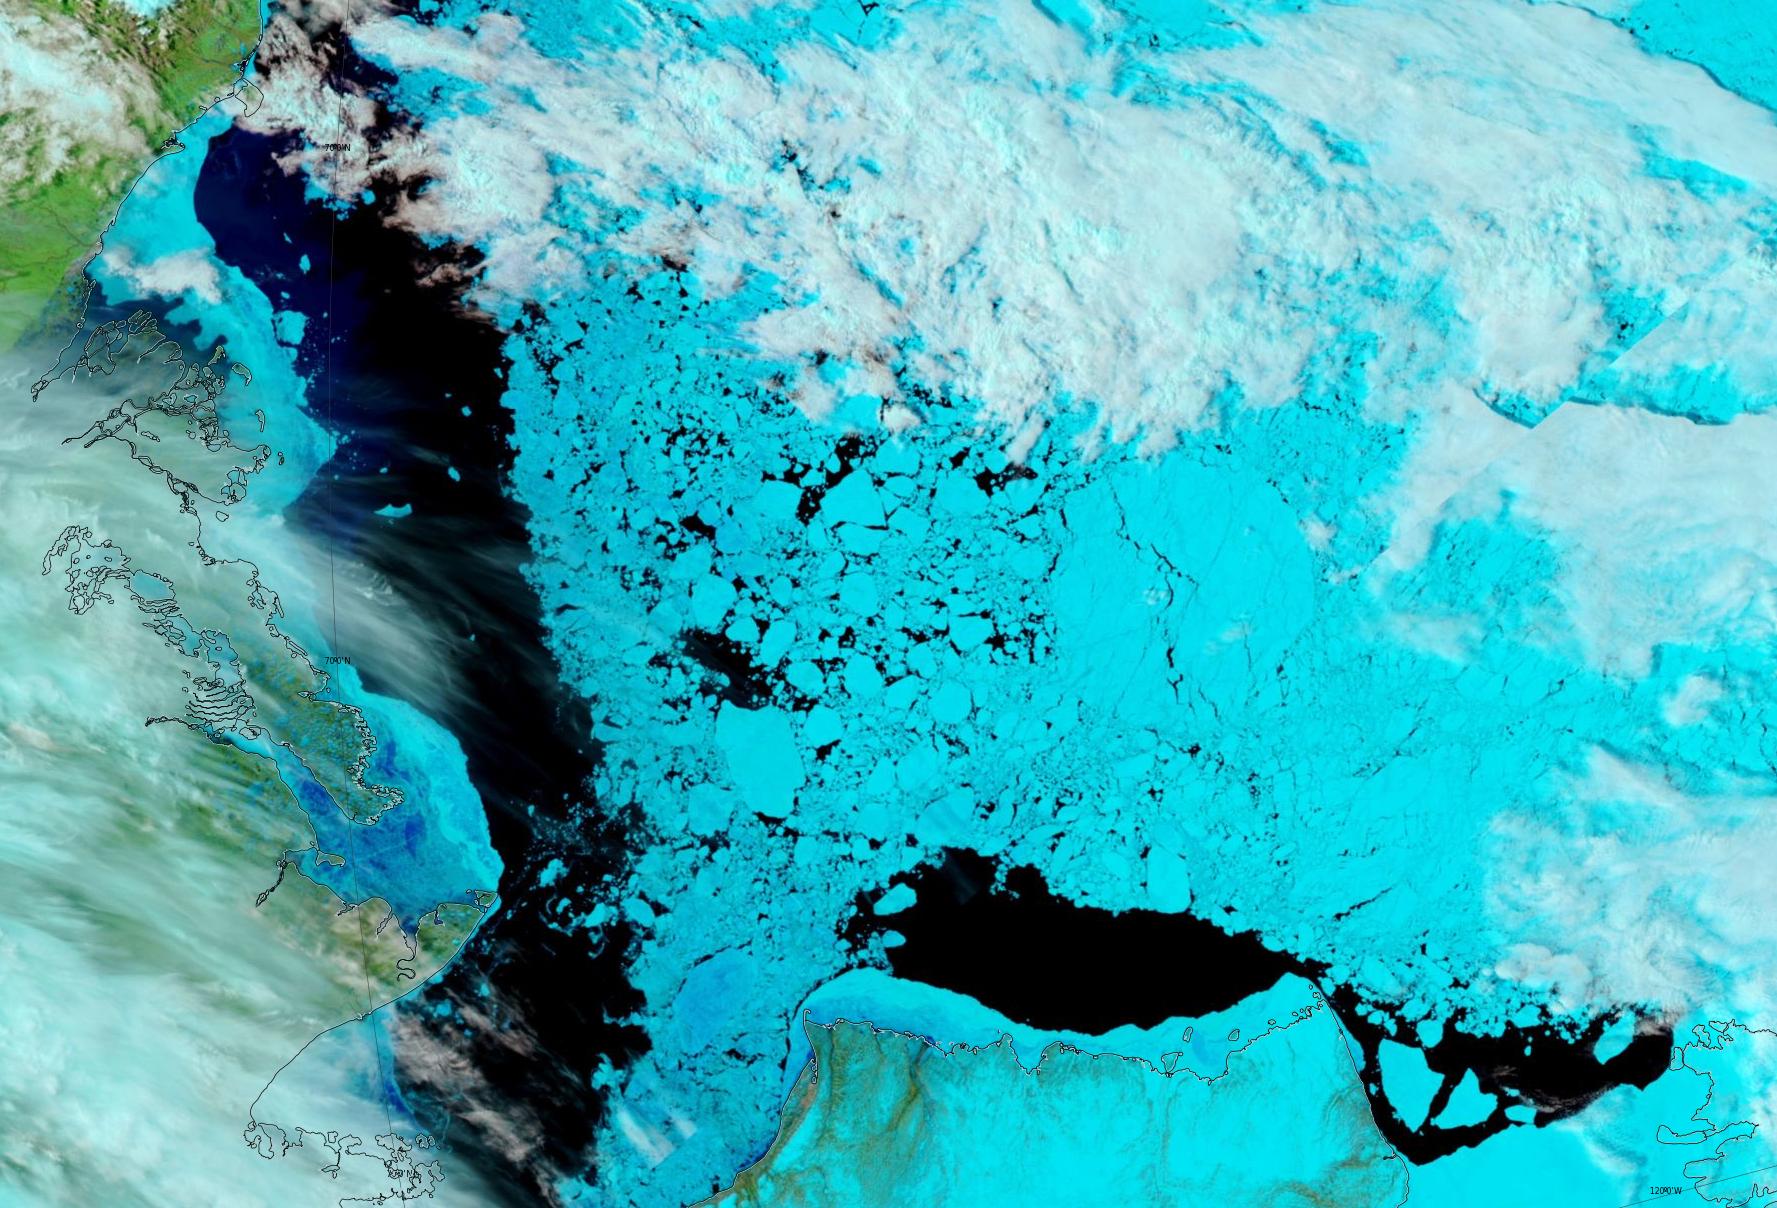
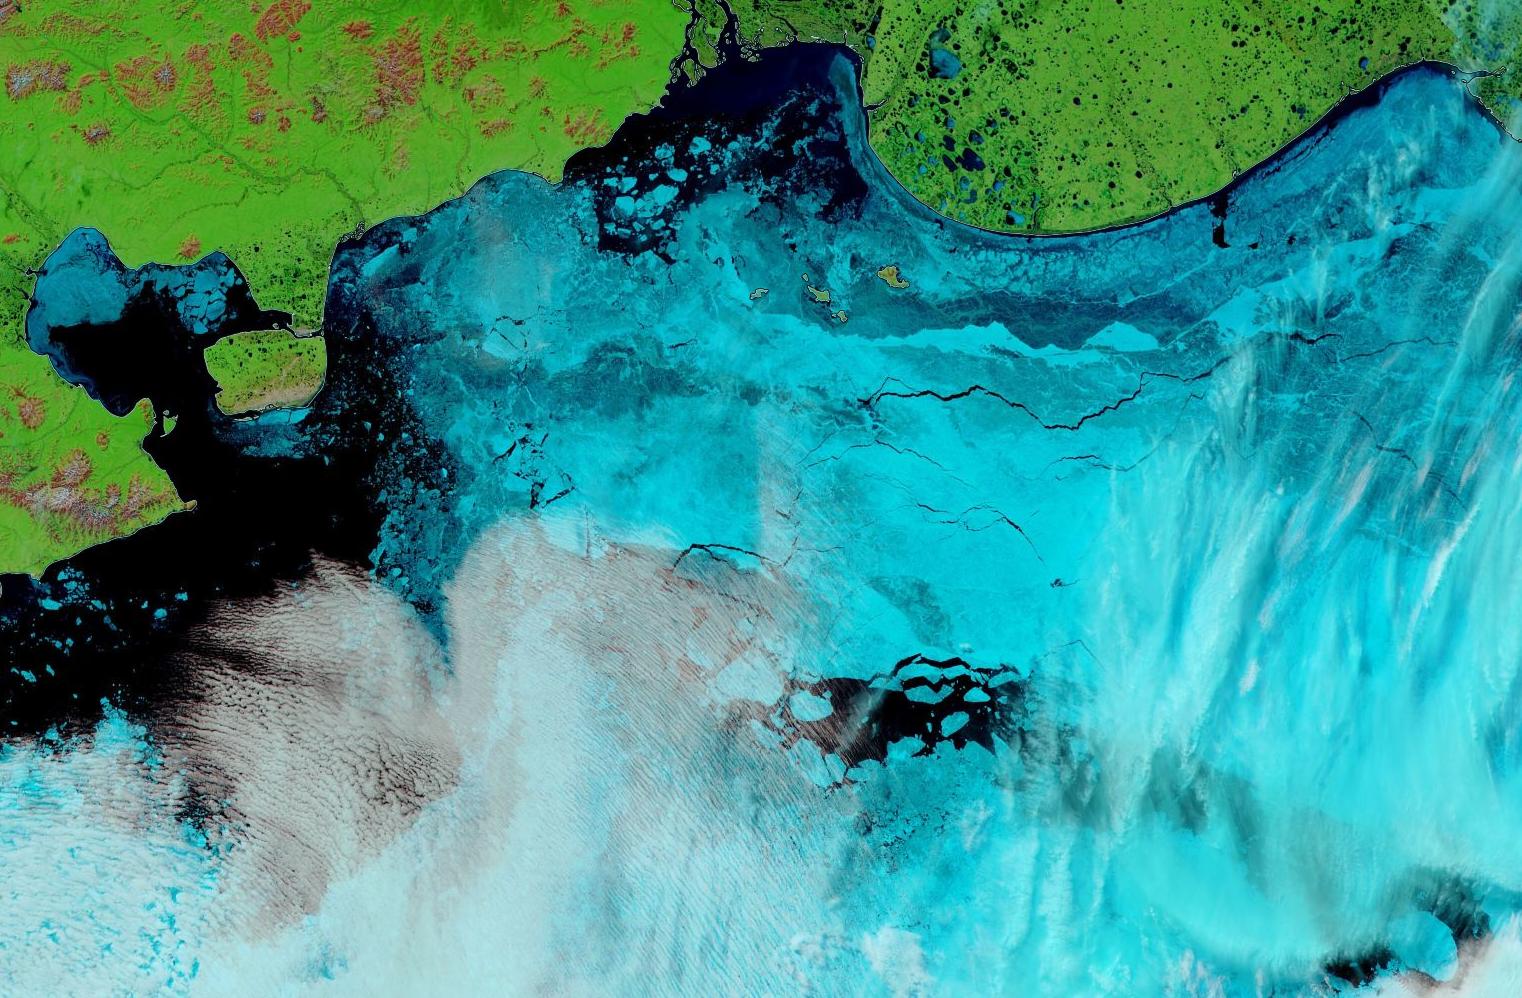
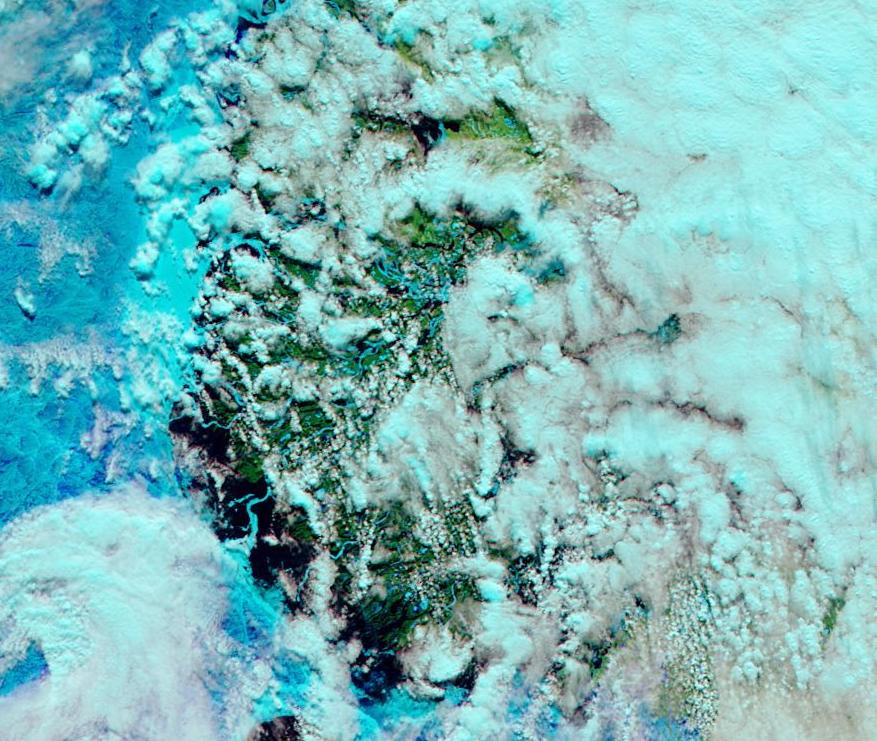
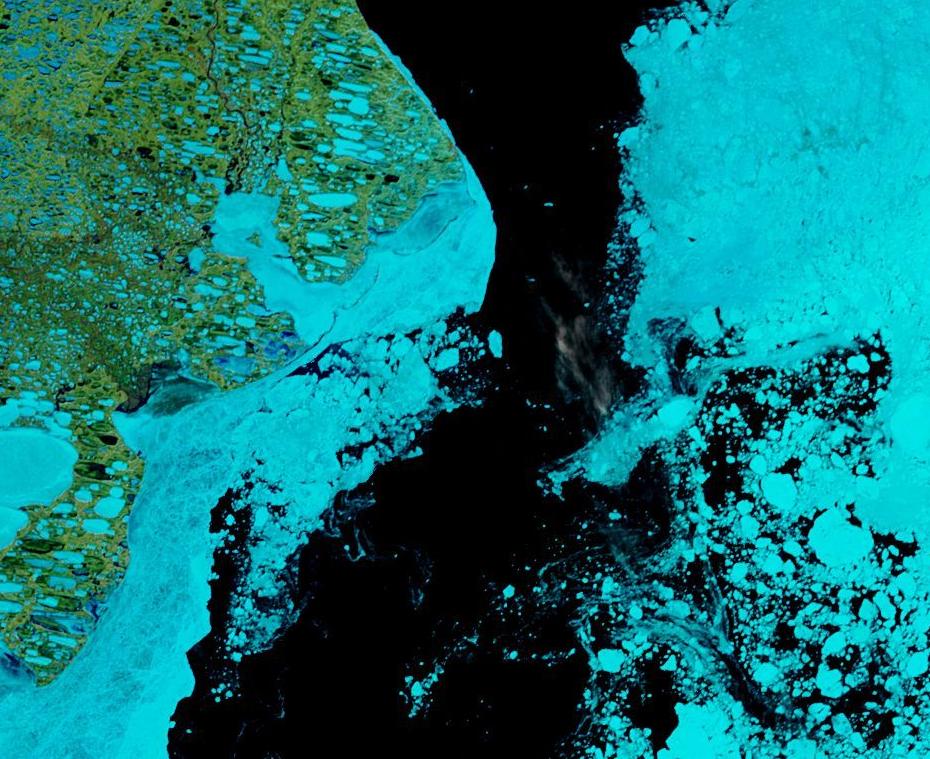
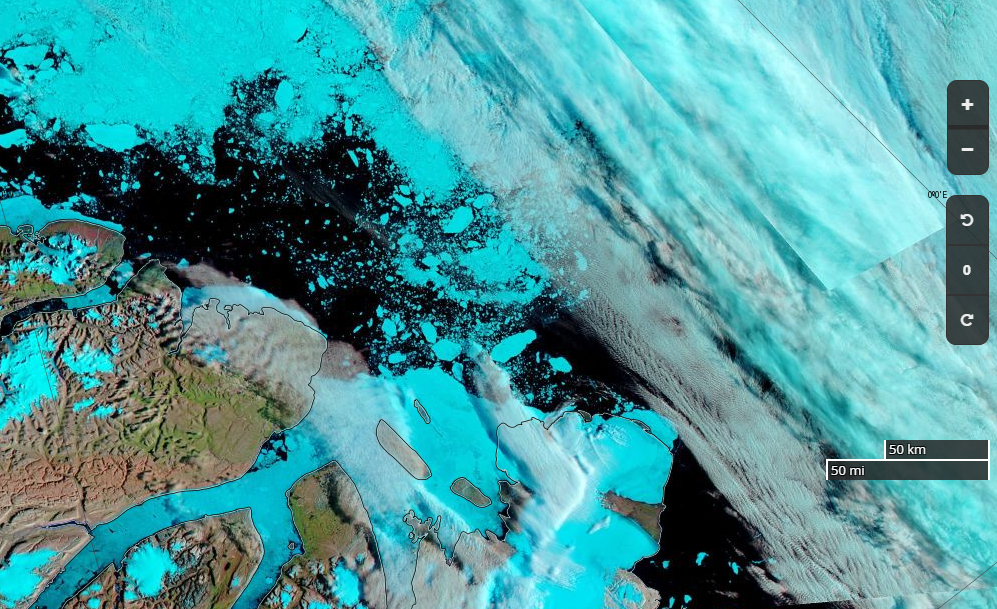
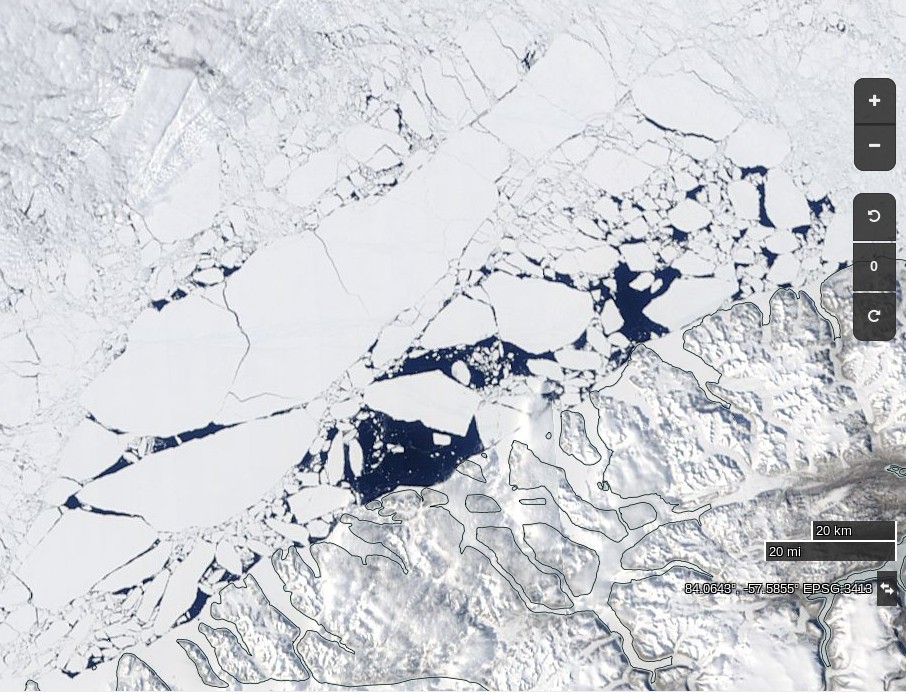
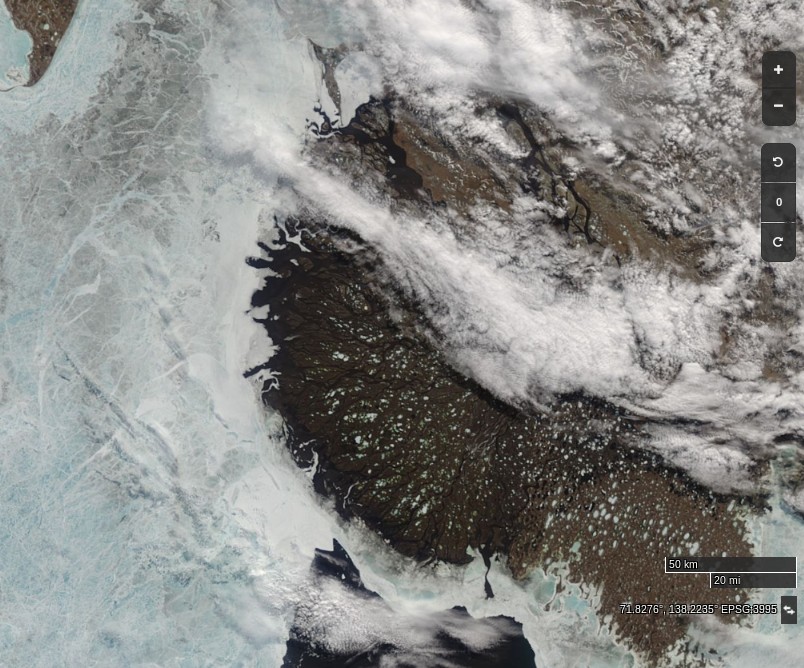
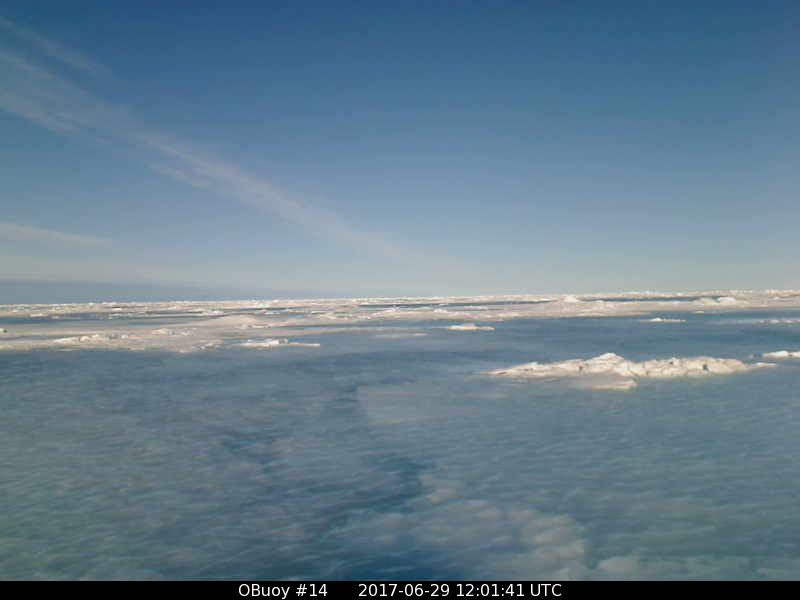
The Terra satellite has a nice clear view of the “Eastern Arctic” this morning, revealing widespread surface melt and continuing break up of the ice in the Laptev Sea:
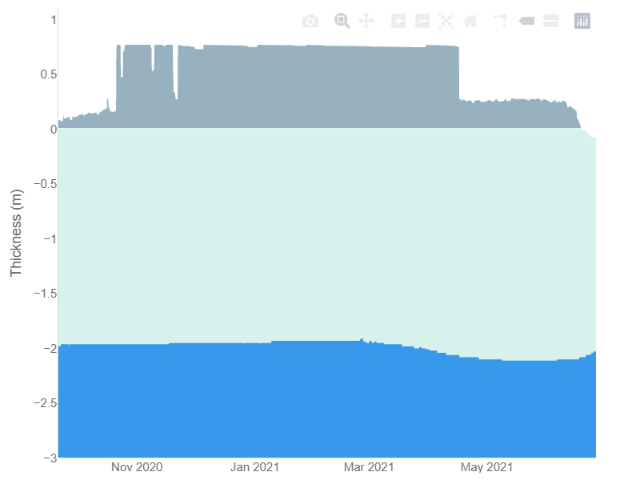
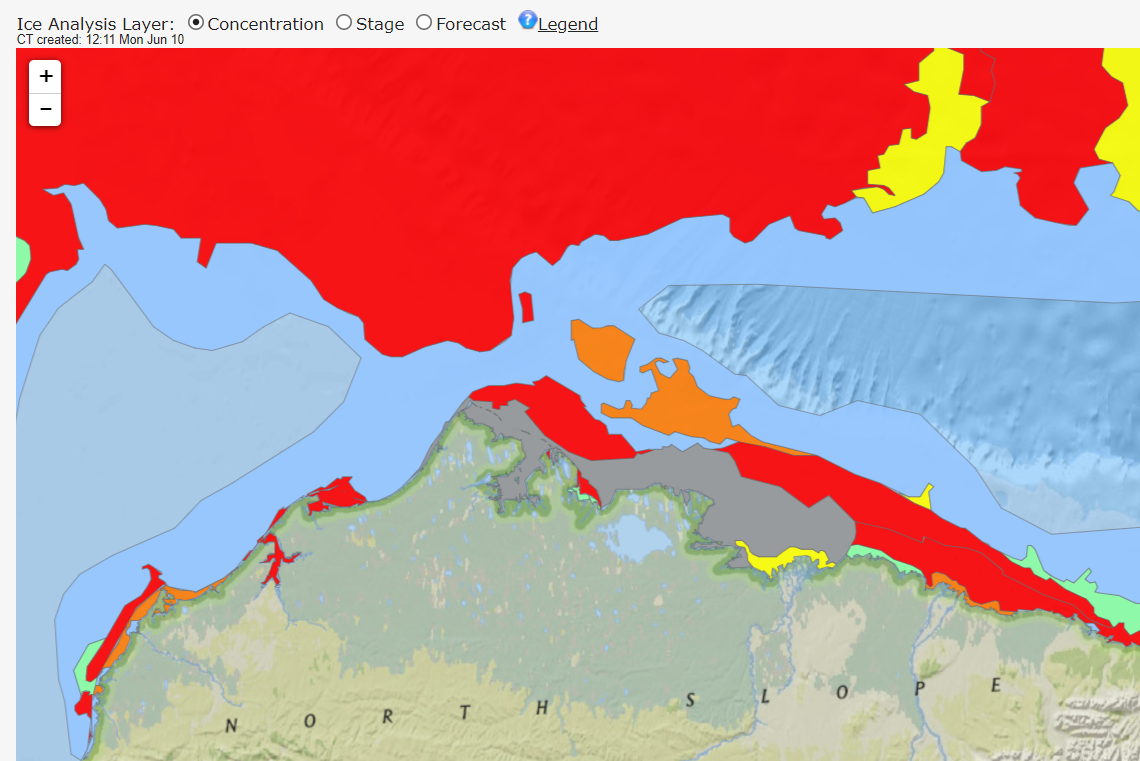
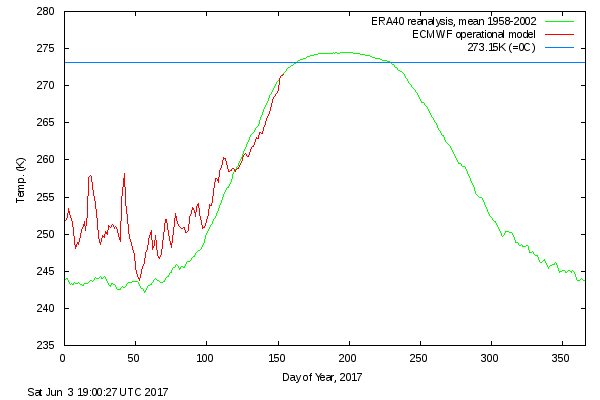
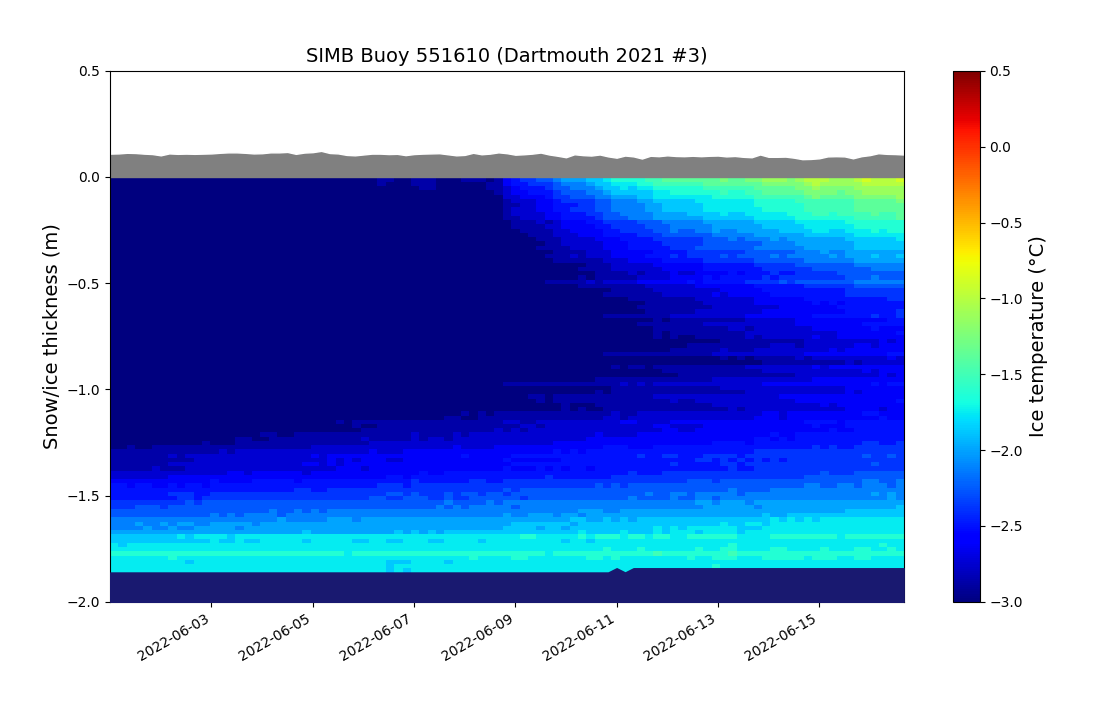
Bottom melt has begun on two ice mass balance buoys originally deployed in the Beaufort Sea last autumn.
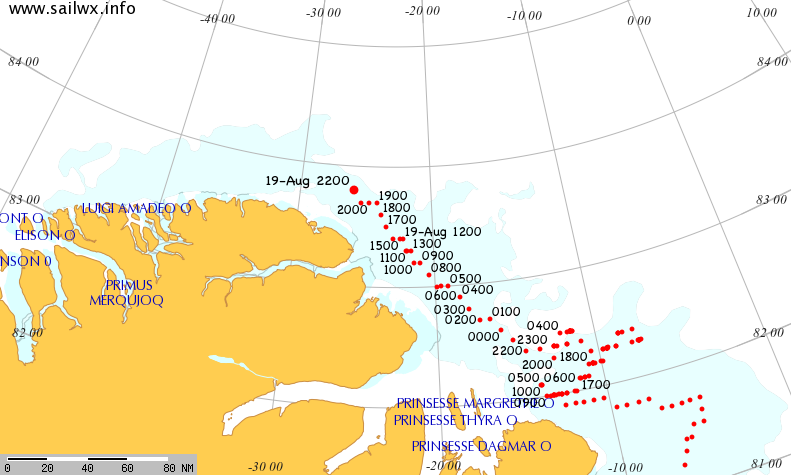
IMB buoy 551610 is currently located at 78.17 N, 132.8 W:

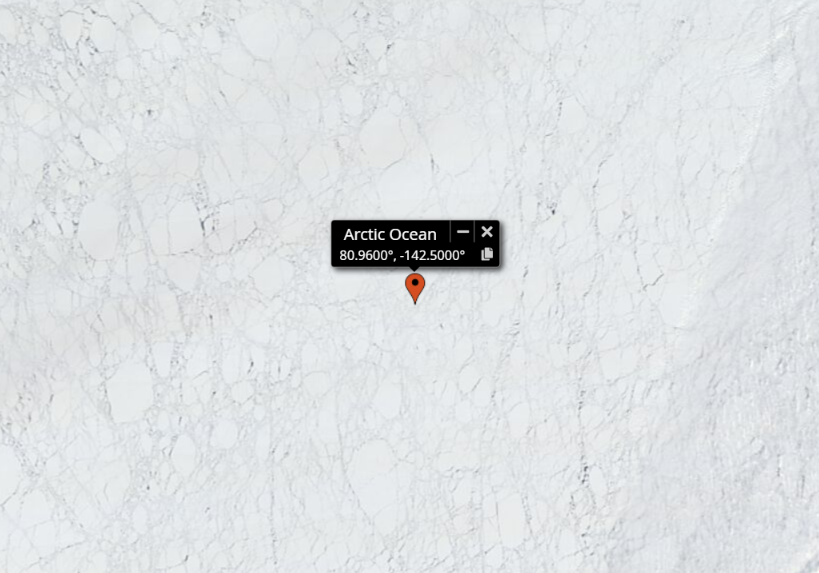
Buoy 569620 is located at 80.96 N, 142.5 W :

Around 35 cm of snow and 1.8 m of ice to go!
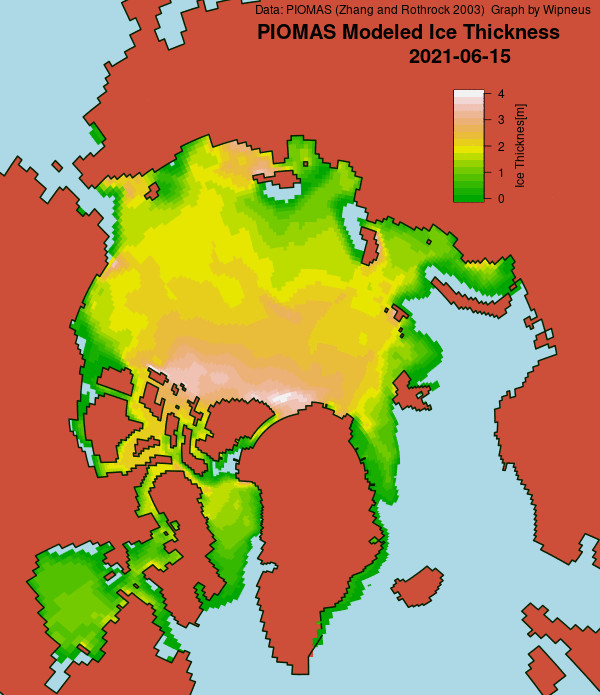
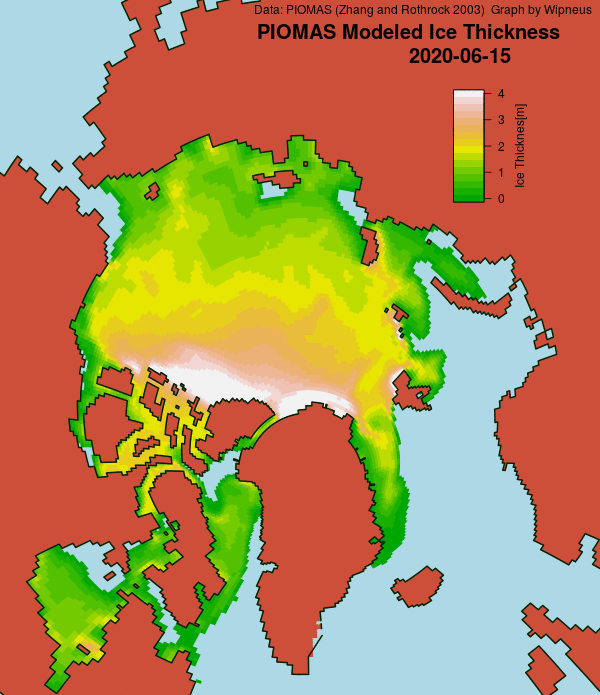
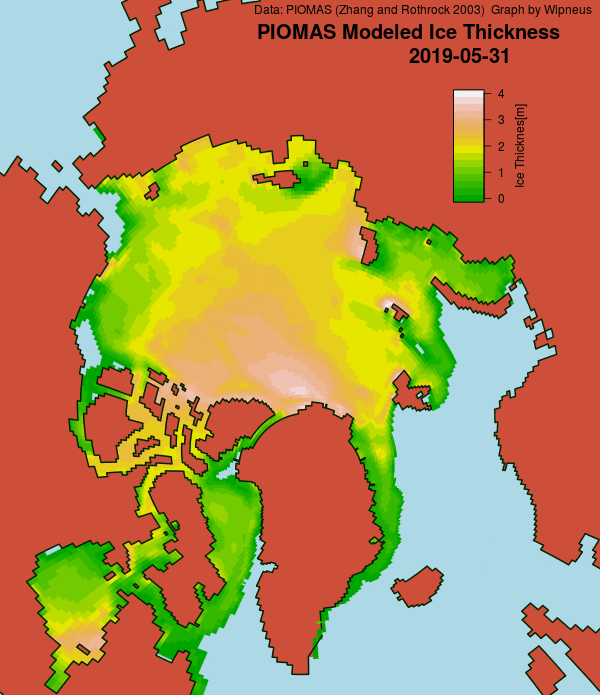
[Edit – June 21st]Here’s the mid June PIOMAS Arctic sea ice thickness map:
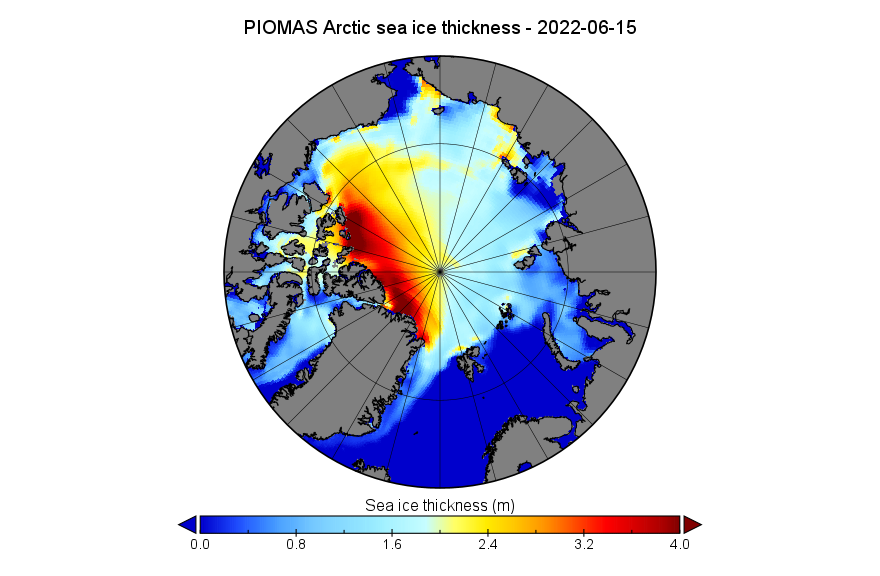
It shows hardly any ice thicker than 2 meters across the entire eastern half of the Arctic Ocean.
[Edit – June 25th]The snow cover has gone and ice surface melt has begun in the northern Beaufort Sea, where IMB buoy 551610 is currently located at 78.34 N, 130.76 W:
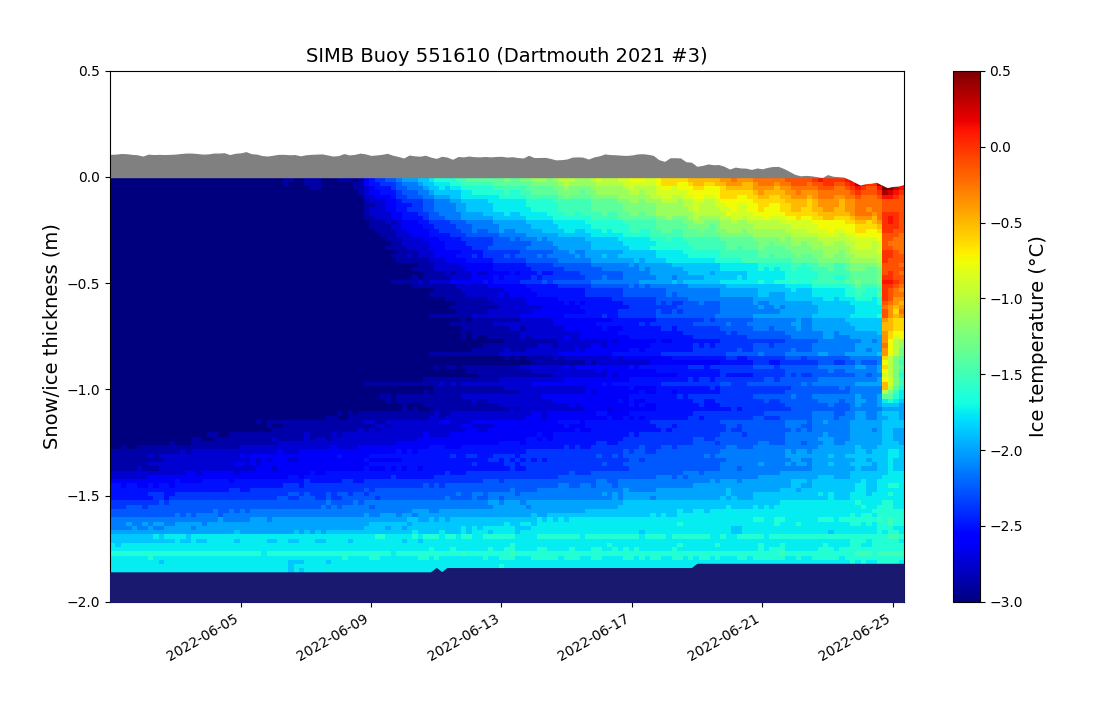
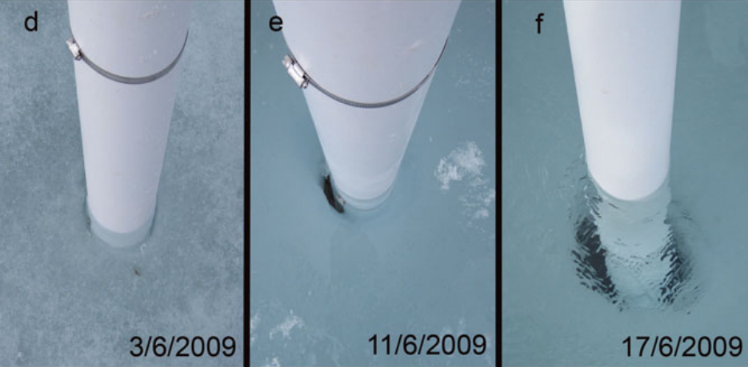
It also looks as though there has recently been preferential solar heating and hence melting around the body of the buoy, as shown in this illustration:
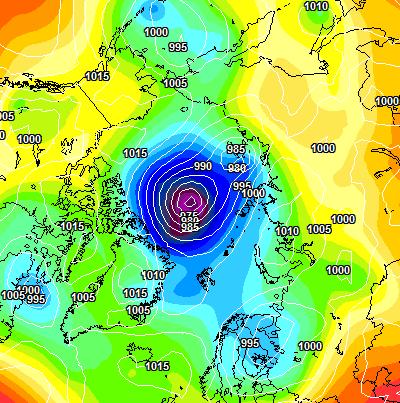
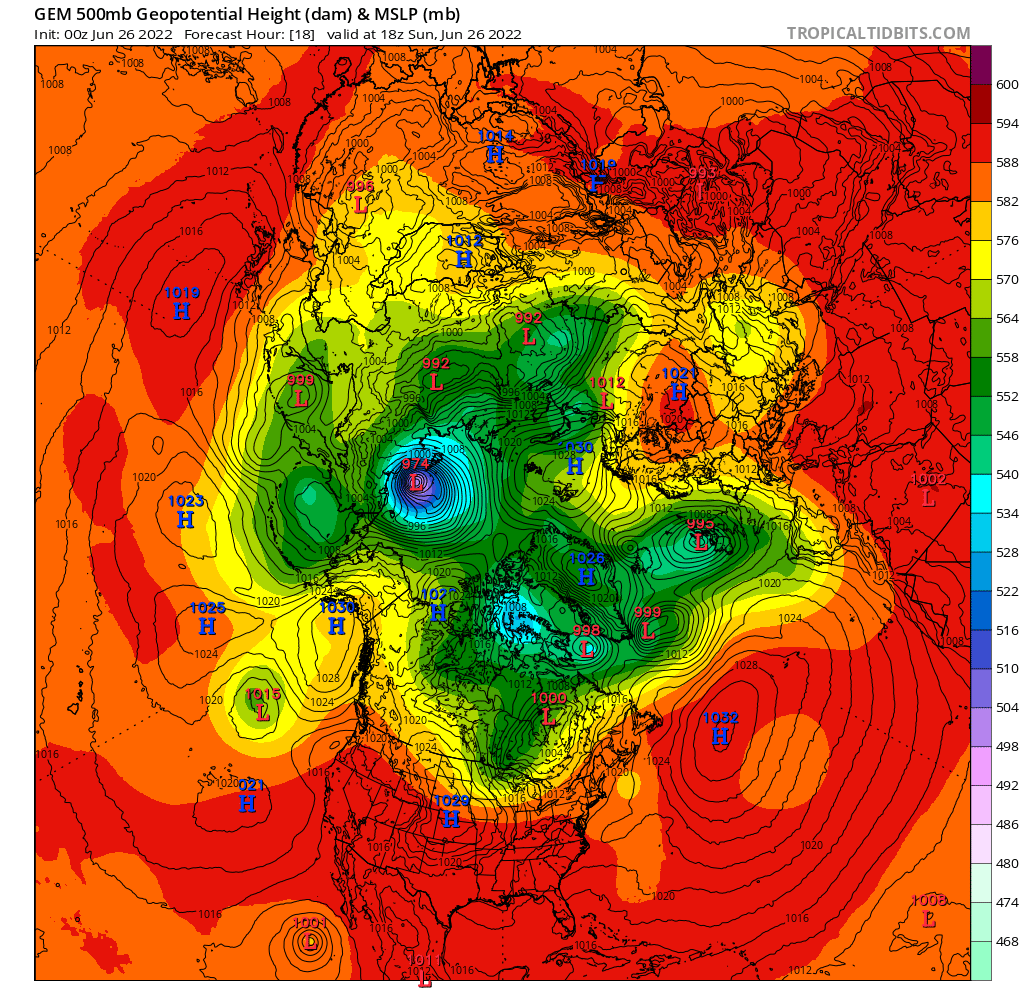
A low pressure area has formed over the East Siberian Sea. According to the Canadian Meteorological Centre‘s analysis the central mean surface level pressure had reached 982 hPa by midnight last night:
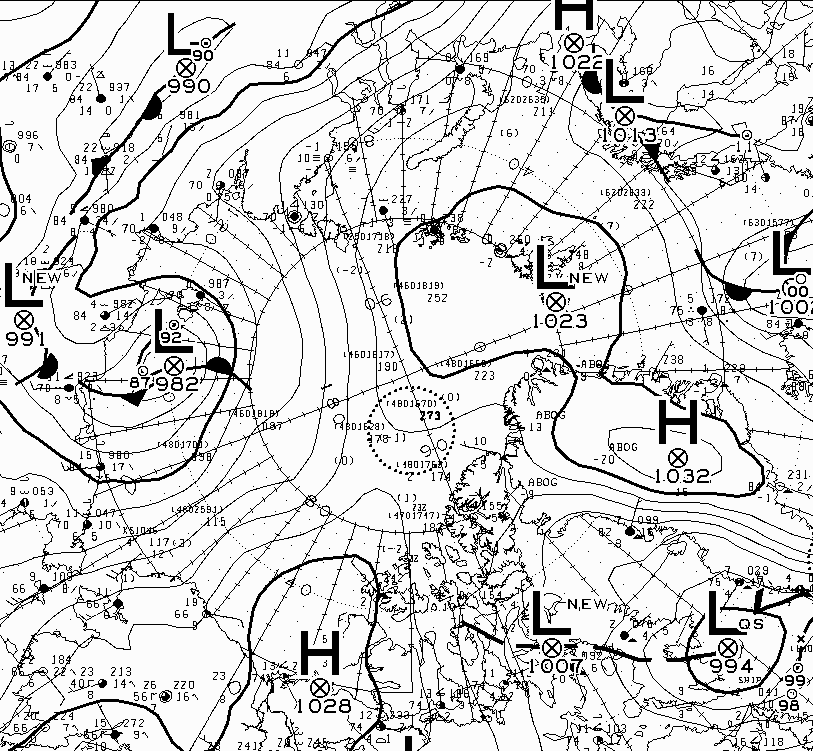
The CMC’s GEM forecast model suggests that it will bottom out at 974 hPa later this evening UTC and then persist for several days:
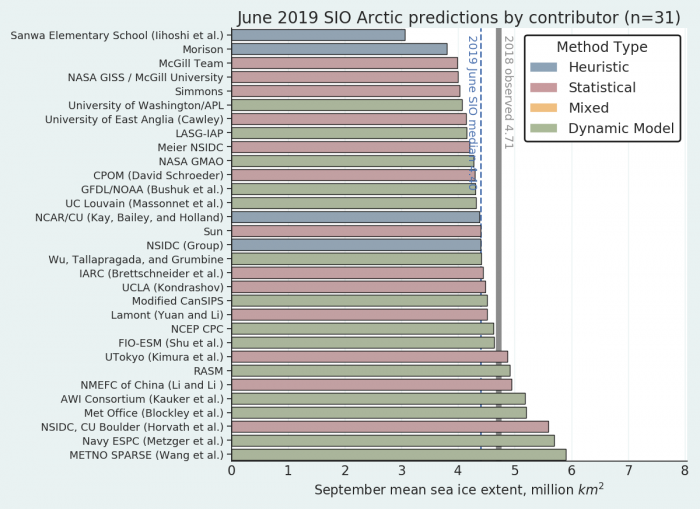
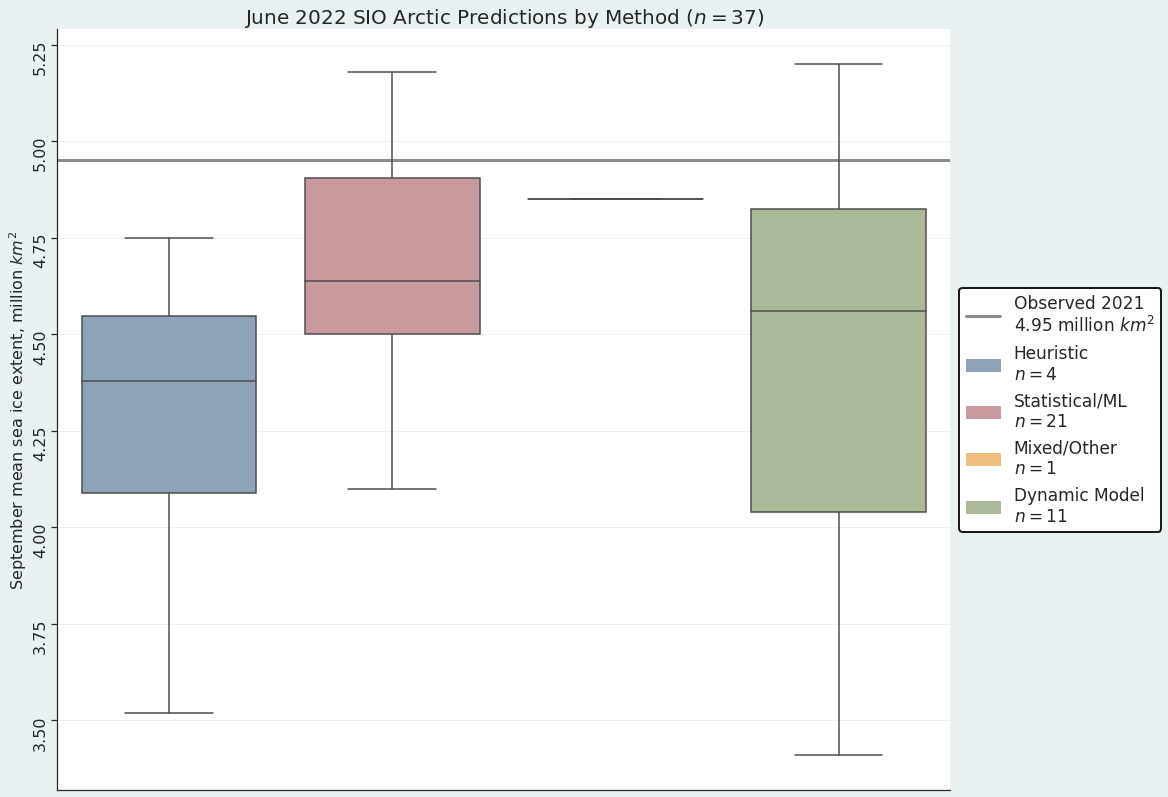
The June 2022 Sea Ice Outlook has now been published, a few days behind schedule. Neil provides a summary below, but here’s the traditional chart of predictions:

Here’s a bit more detail on the Pan-Arctic sea-ice forecast:
This year’s median forecasted value is 4.57 million square kilometers with quartiles of 4.34 and 4.90 million square kilometers. This is higher than the SIO forecasted value of September sea-ice extent for the past three years (2019–2021), but slightly below the median value of 4.60 million square cited in the 2018 SIO June report. The lowest forecast is 3.41 million square kilometers. Among the four methods that forecast September extent less than four million square kilometers, three are based on dynamical models. Two contributions forecast a record low extent (below 3.57 million square kilometers set in 2012). The highest forecast is 5.20 million square kilometers.
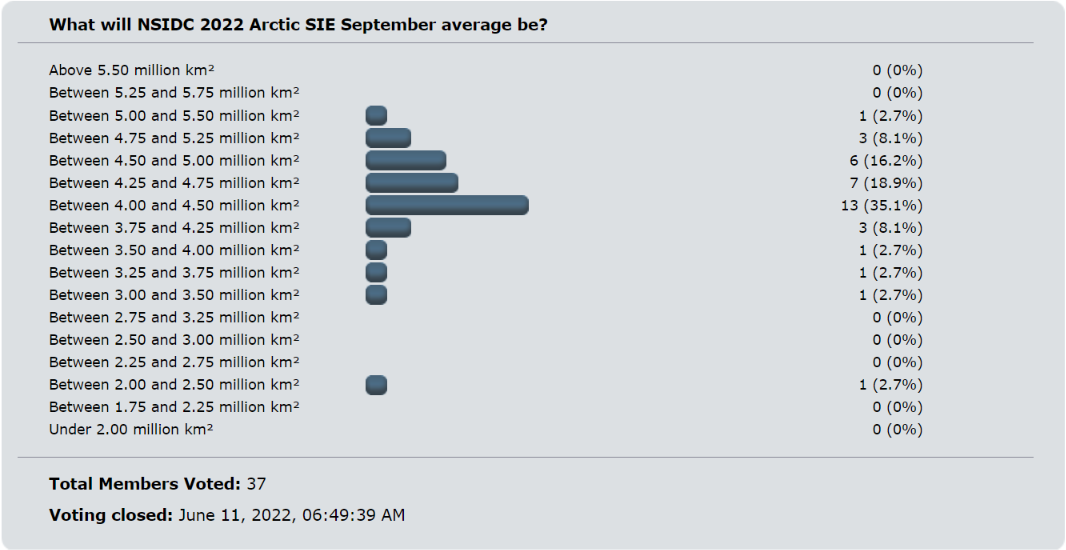
Purely coincidentally the Arctic Sea Ice Forum June poll for NSIDC average extent for September 2022 also had 37 entries. Here are the results:
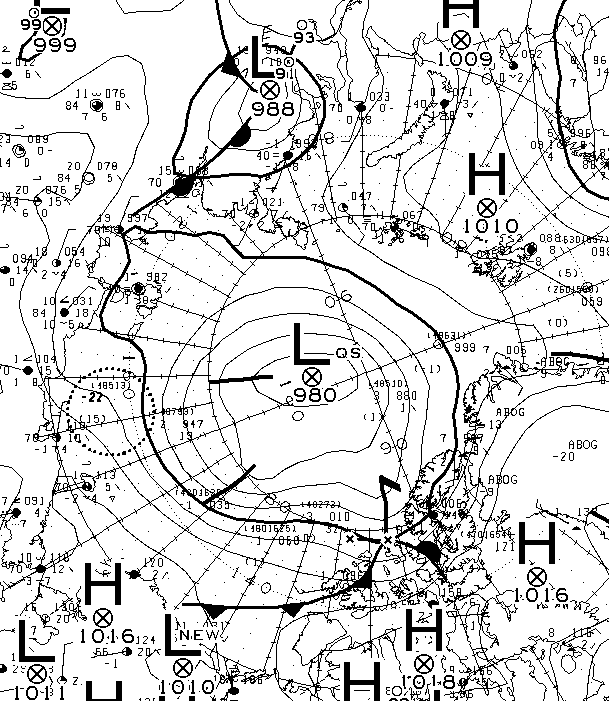
Meanwhile in the actual Arctic at the end of June 2022 the low over the East Siberian Sea has found its second wind and is deepening once more: