After a relatively rapid decline at the beginning of June Arctic sea extent is now very close to the 2010s average:
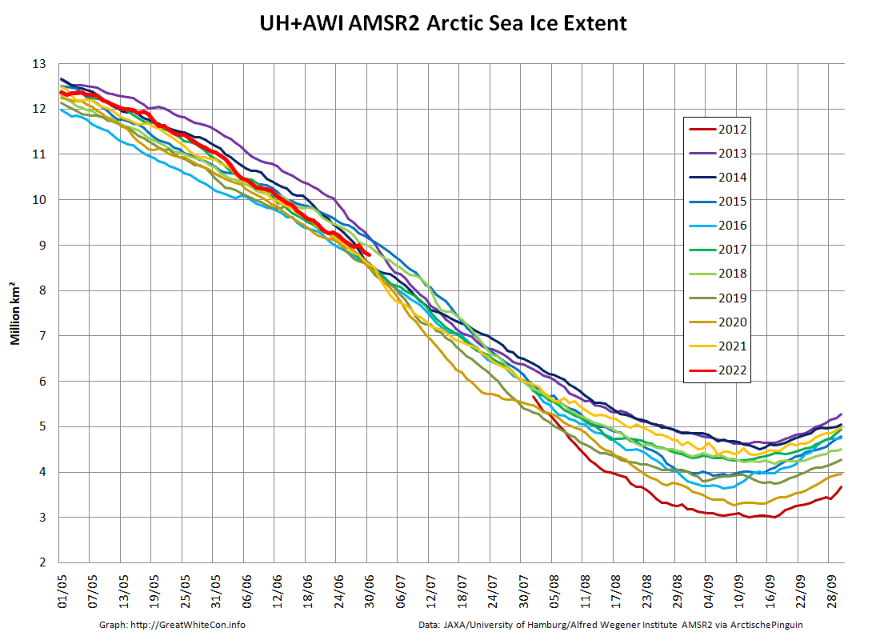
Both 2020 and 2021 began relatively rapid declines of their own at the beginning of July, so it will be interesting to see if 2022 follows suit.
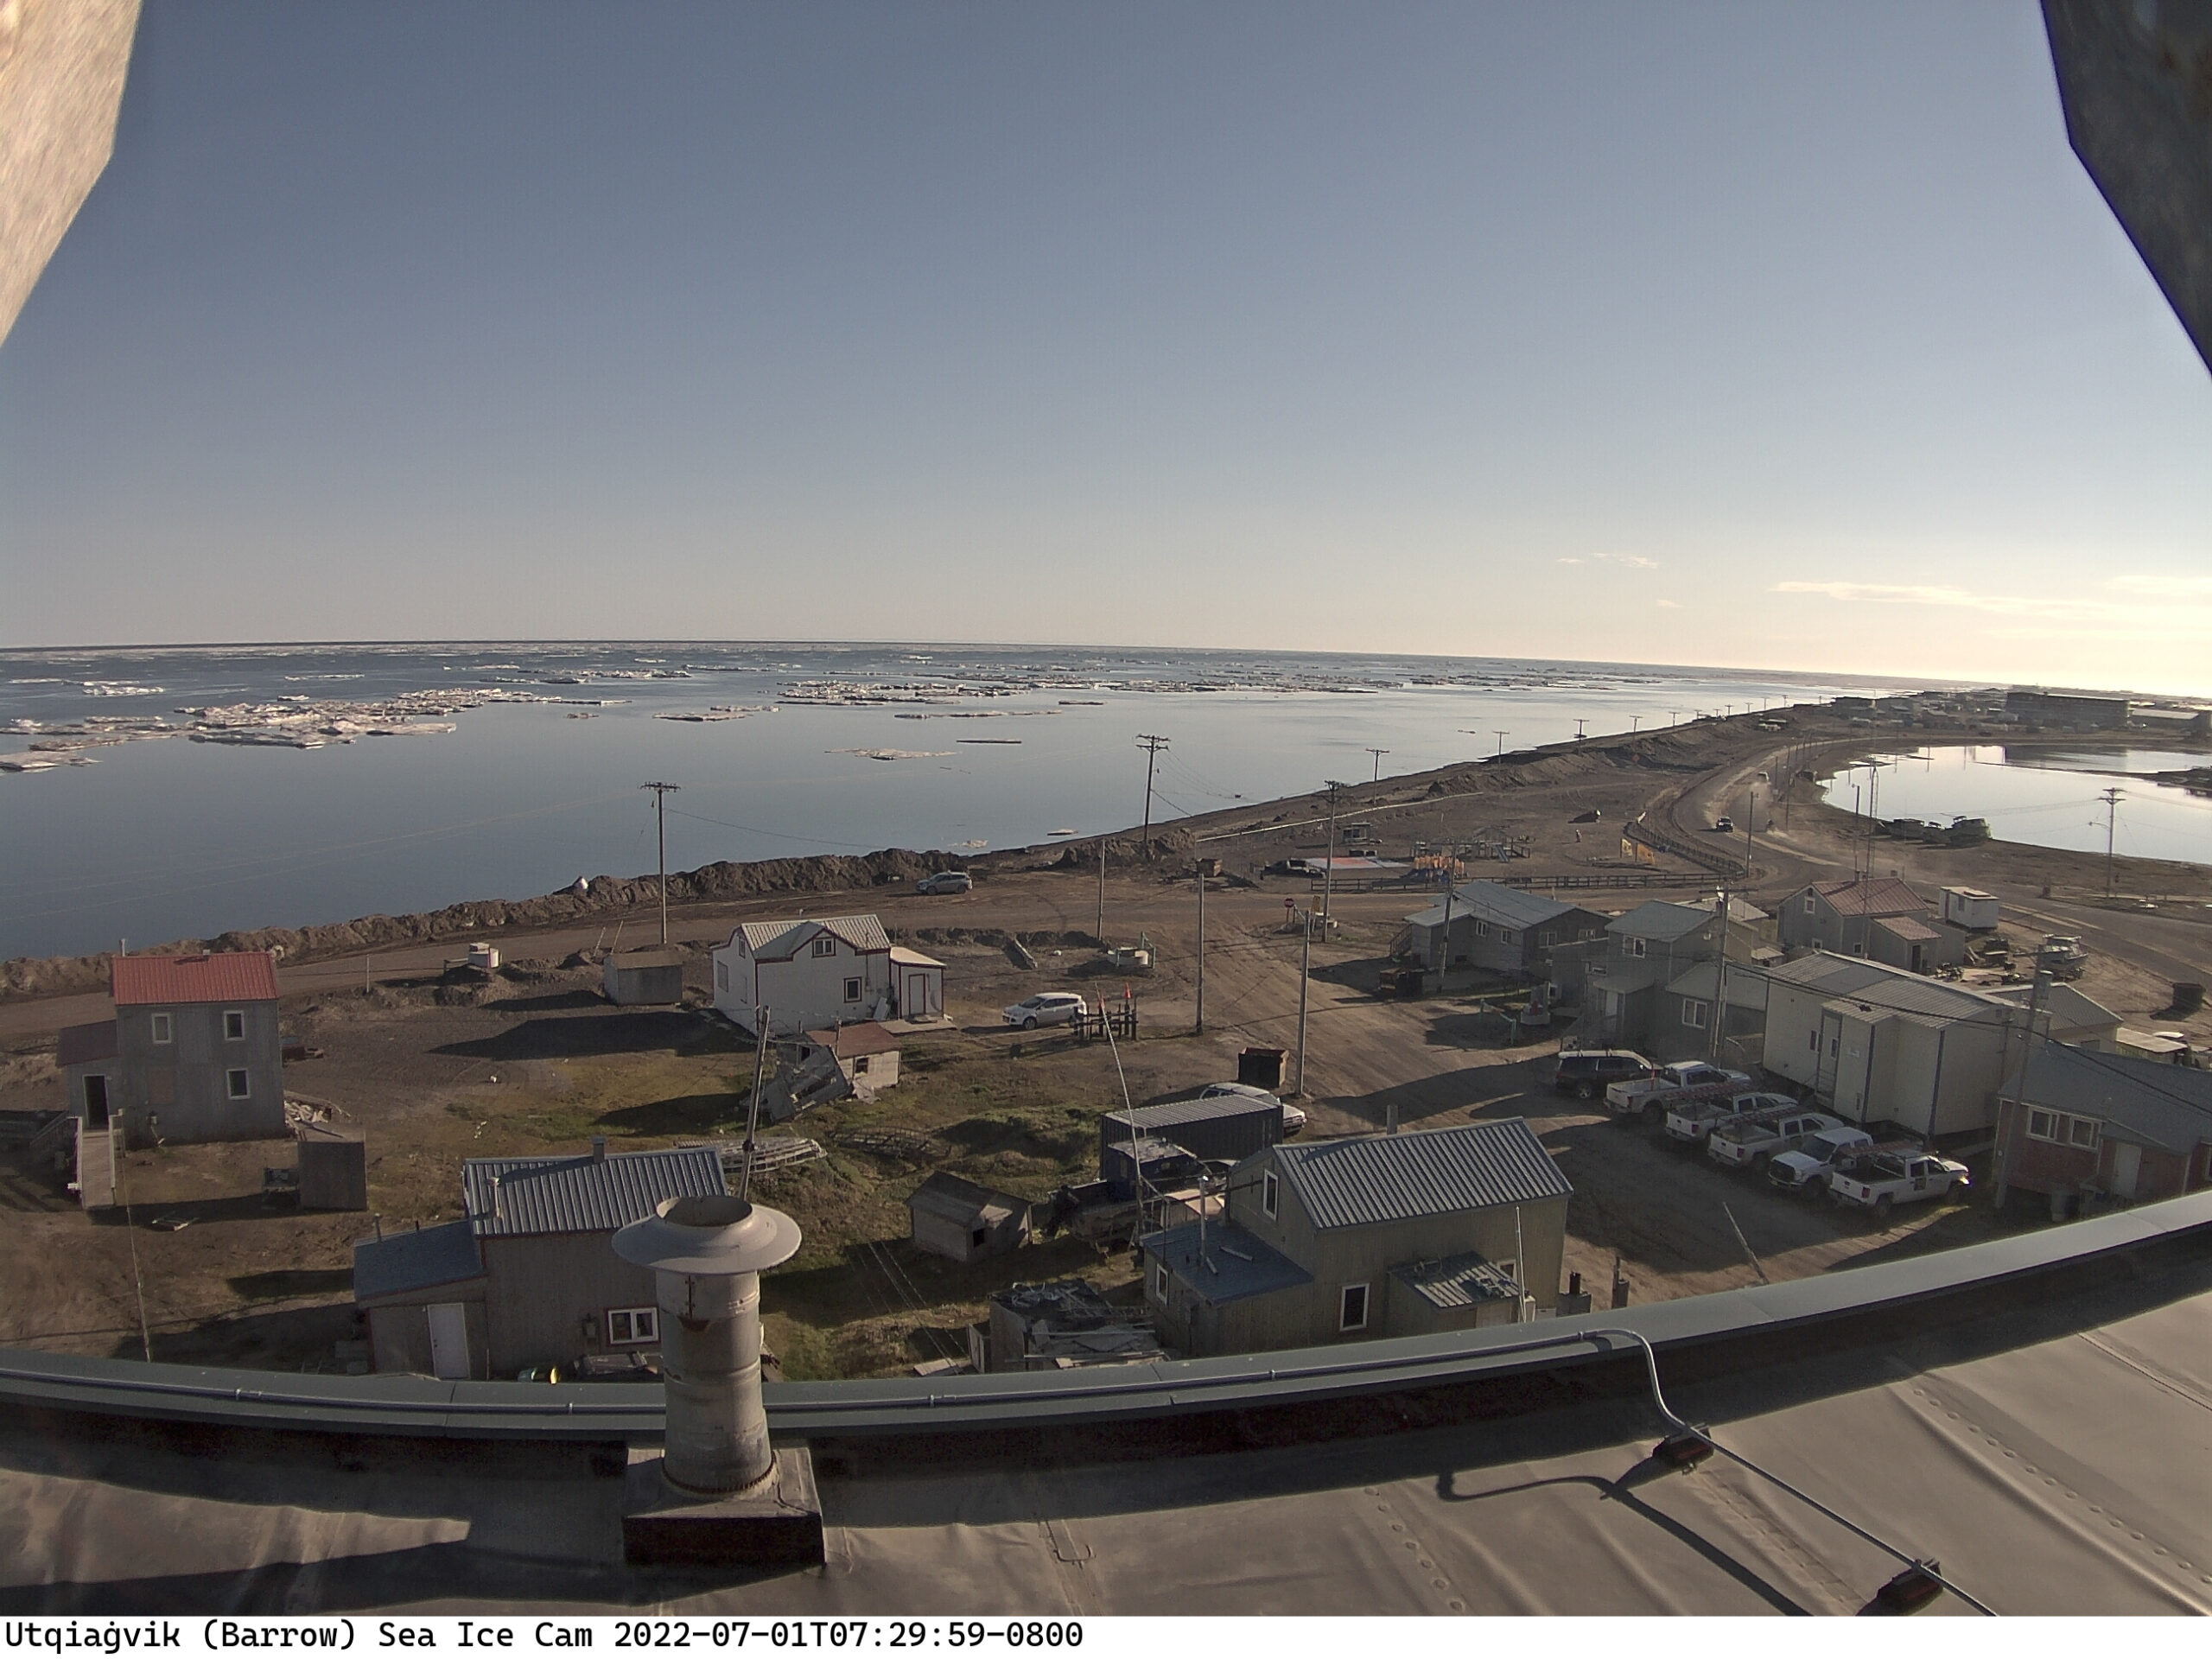
Most of the fast ice off Utqiaġvik has recently disappeared:
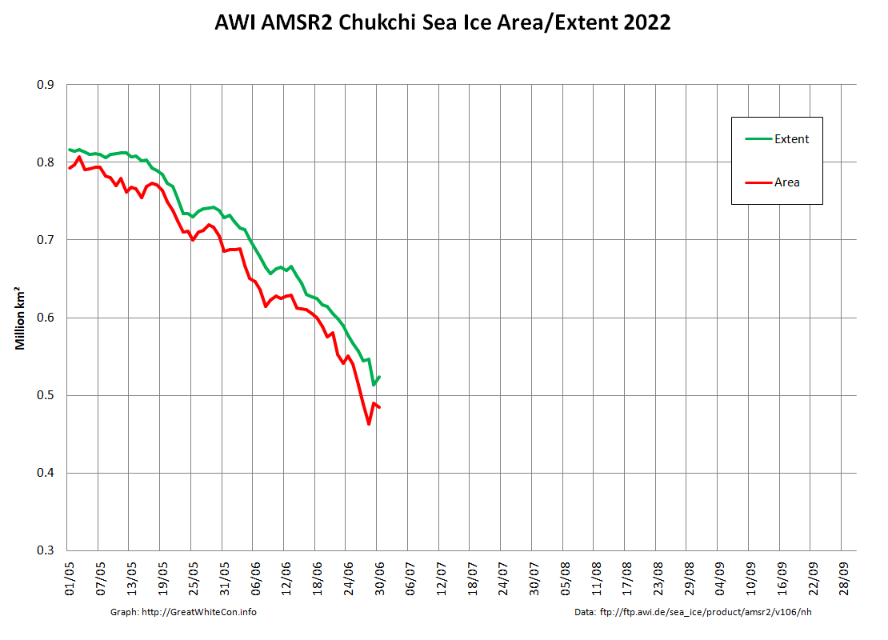
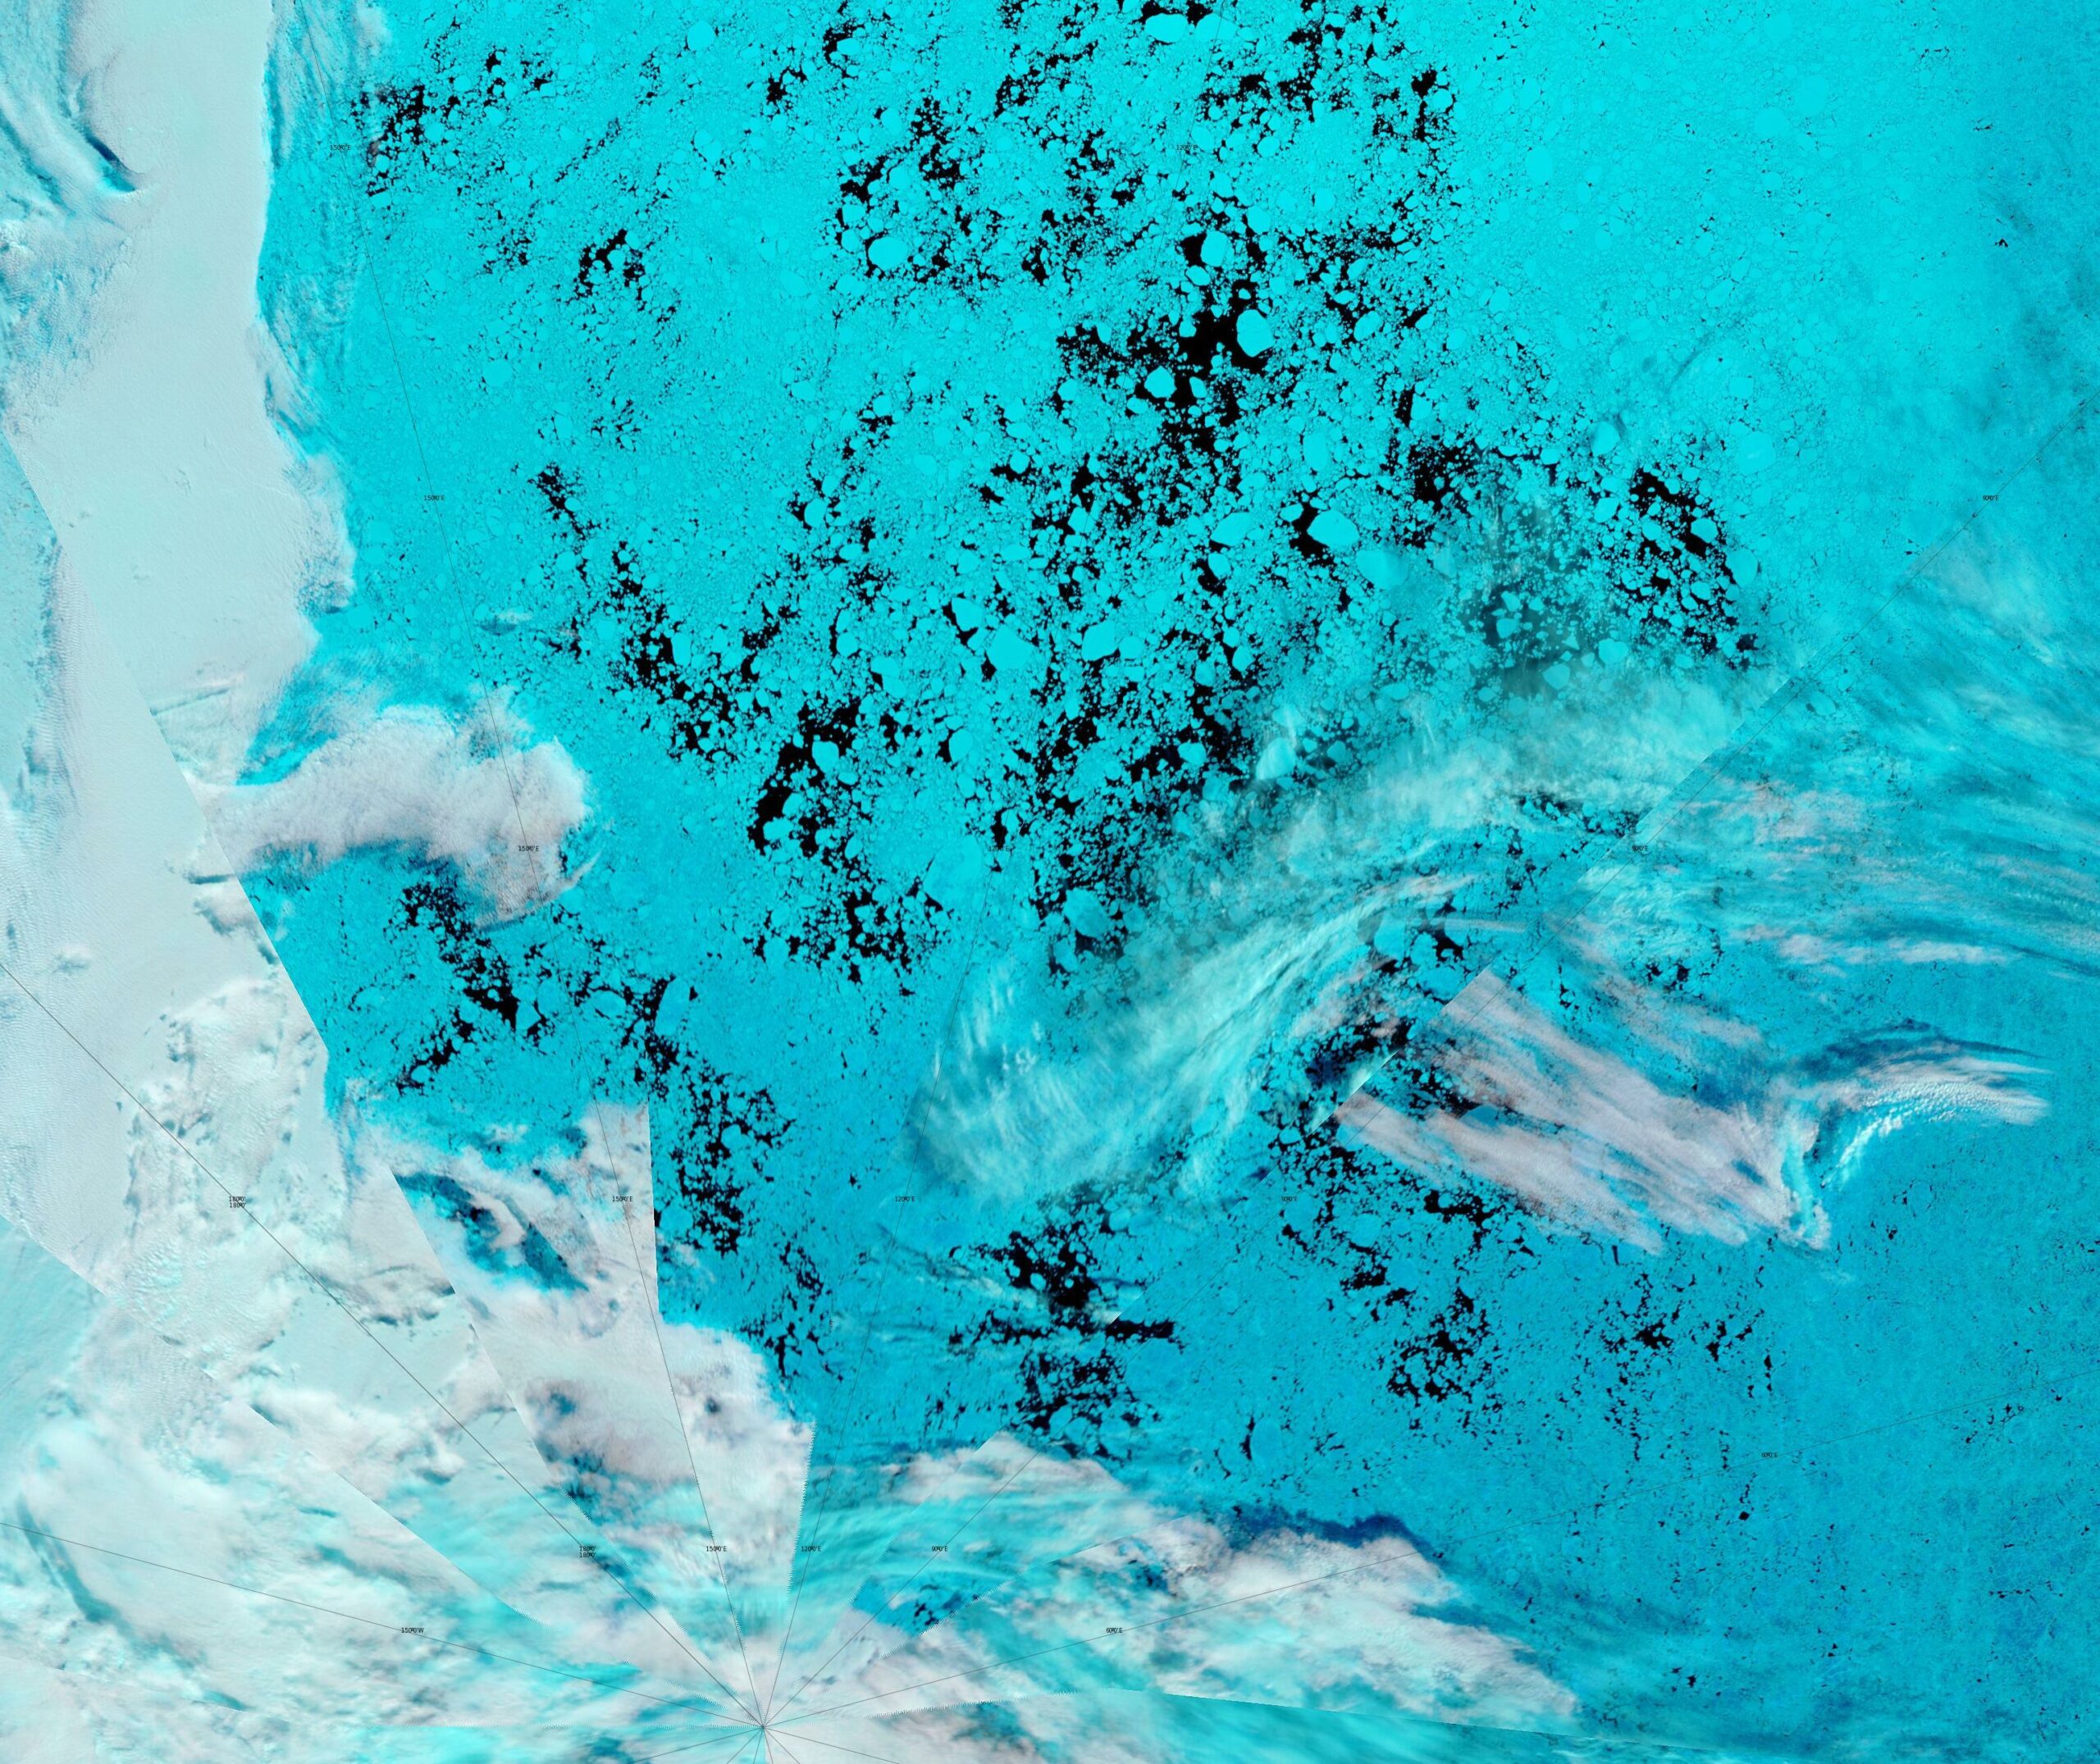
Meanwhile further out into the Chukchi Sea the sea ice looks to be in poor shape at the moment, with surface melting apparent across the entire region:
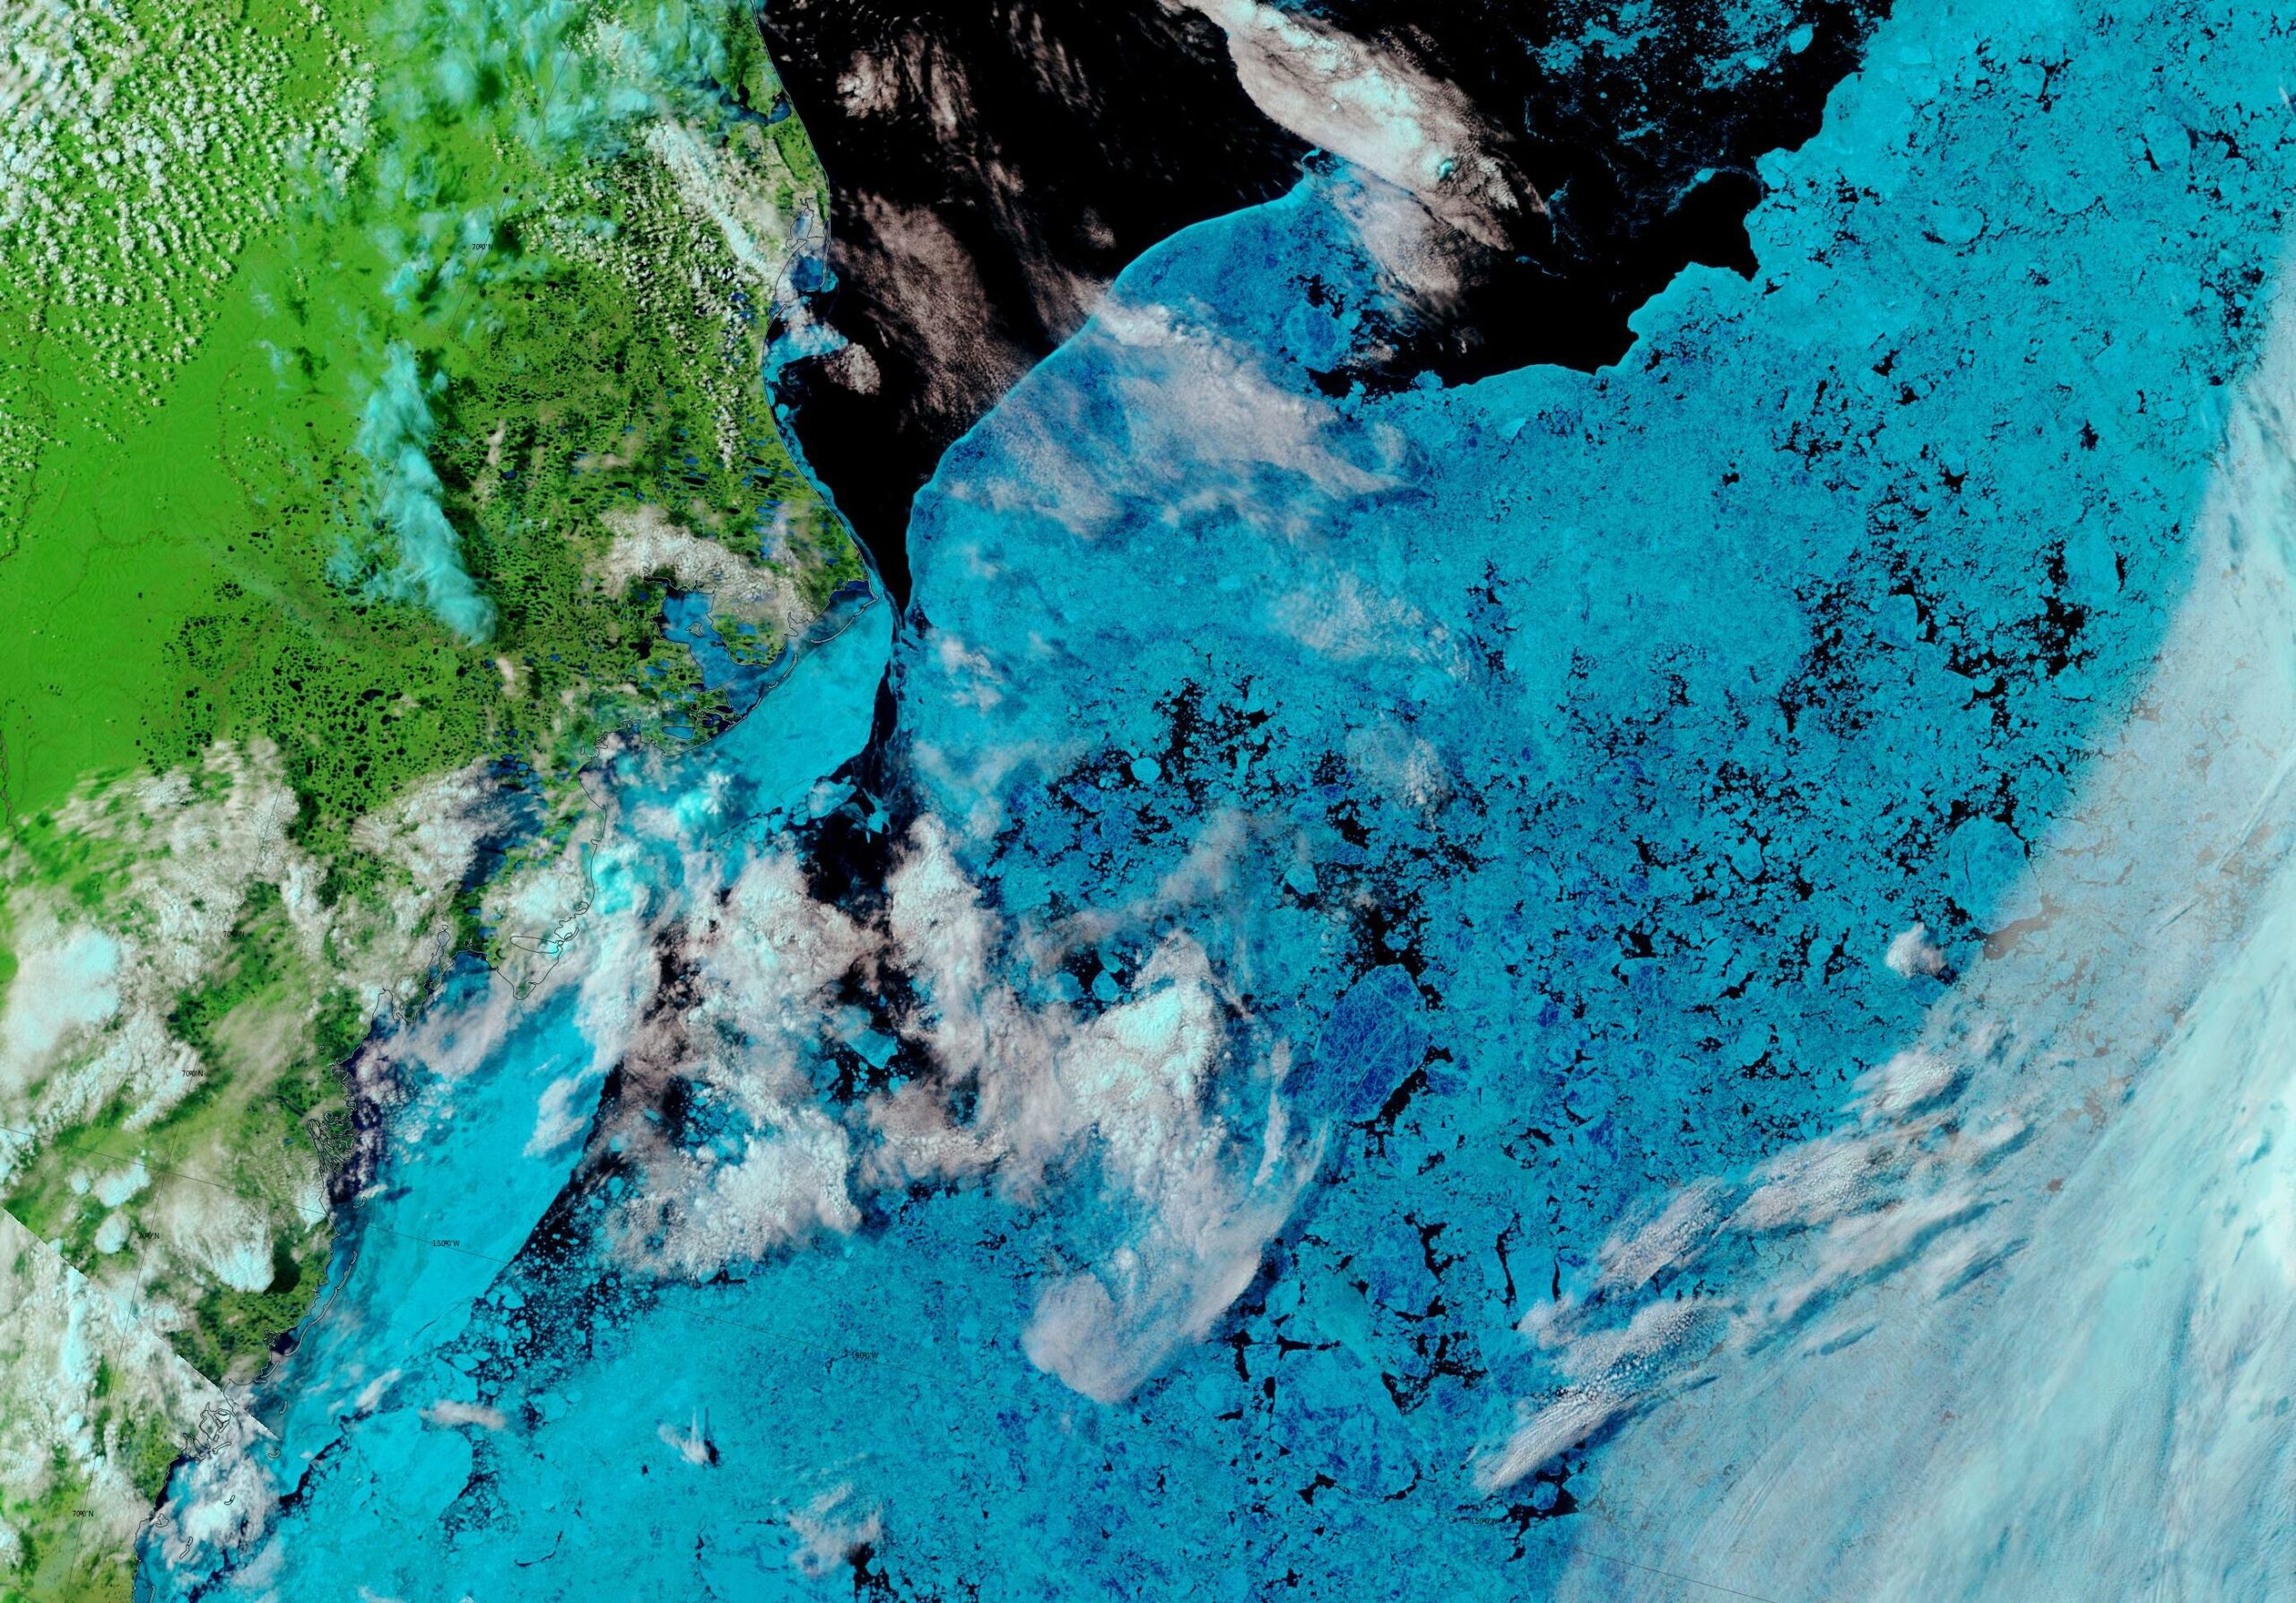
With only a few large floes still intact, further declines look likely:
The Beaufort Sea is similarly beset with surface melt at the moment, but has yet to follow the Chukchi’s lead in extent decline:

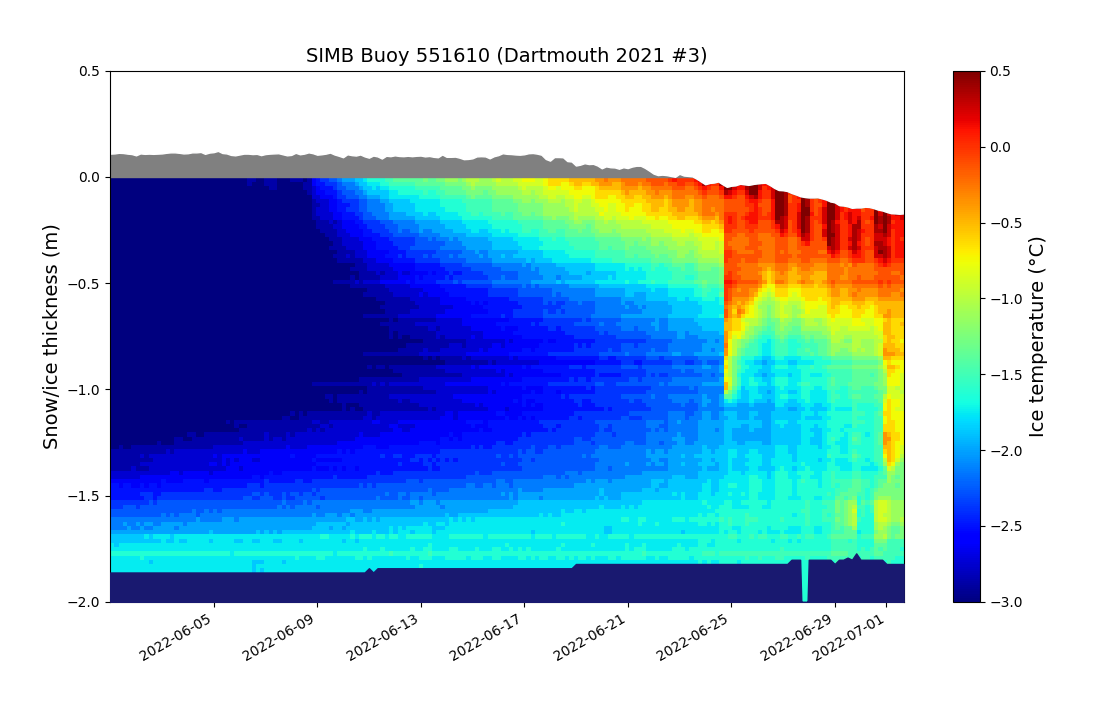
Both surface and bottom melt have begun in the northern Beaufort Sea. Here’s the temperature profile of ice mass balance buoy 551610, currently located at 78.4 N, 130.5 W:
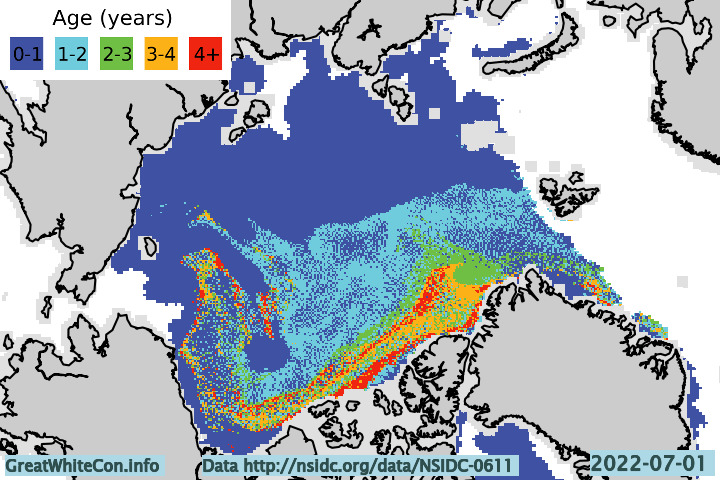
Finally, for the moment at least, here is the NSIDC’s Arctic sea ice age map for the beginning of June:
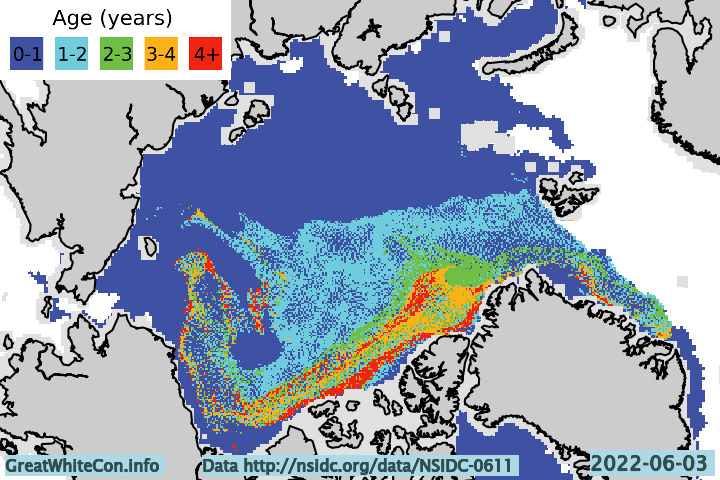
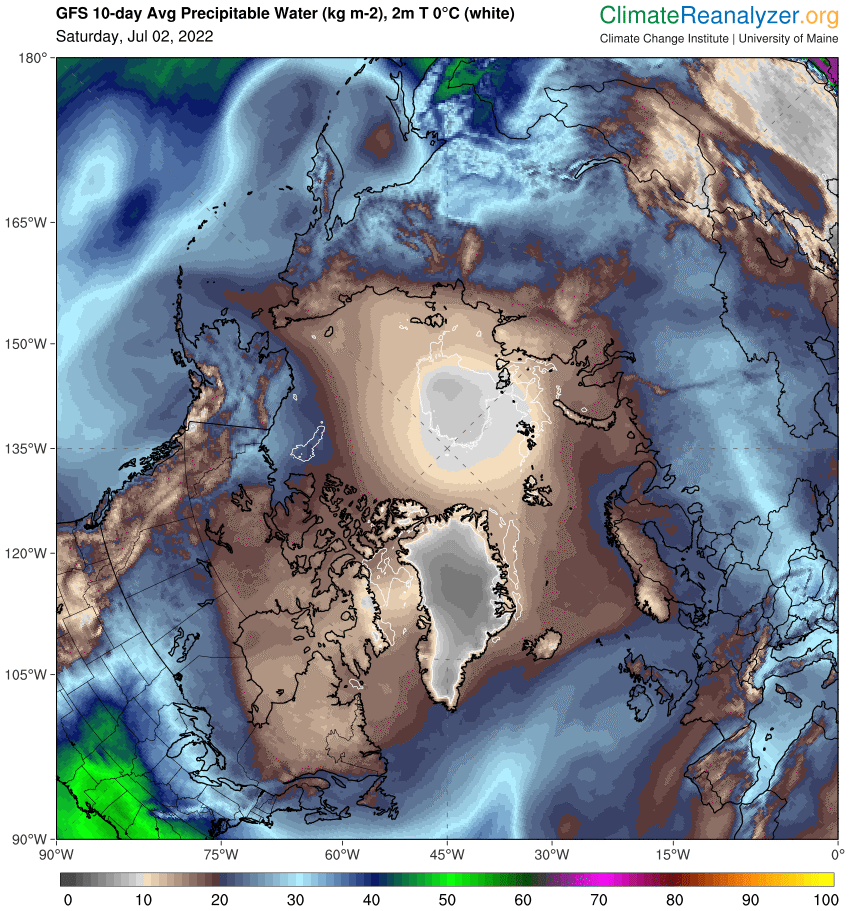
It shows a light sprinkling of older ice across the southern Beaufort Sea. How long will it survive, given the heat and moisture currently heading in its direction?

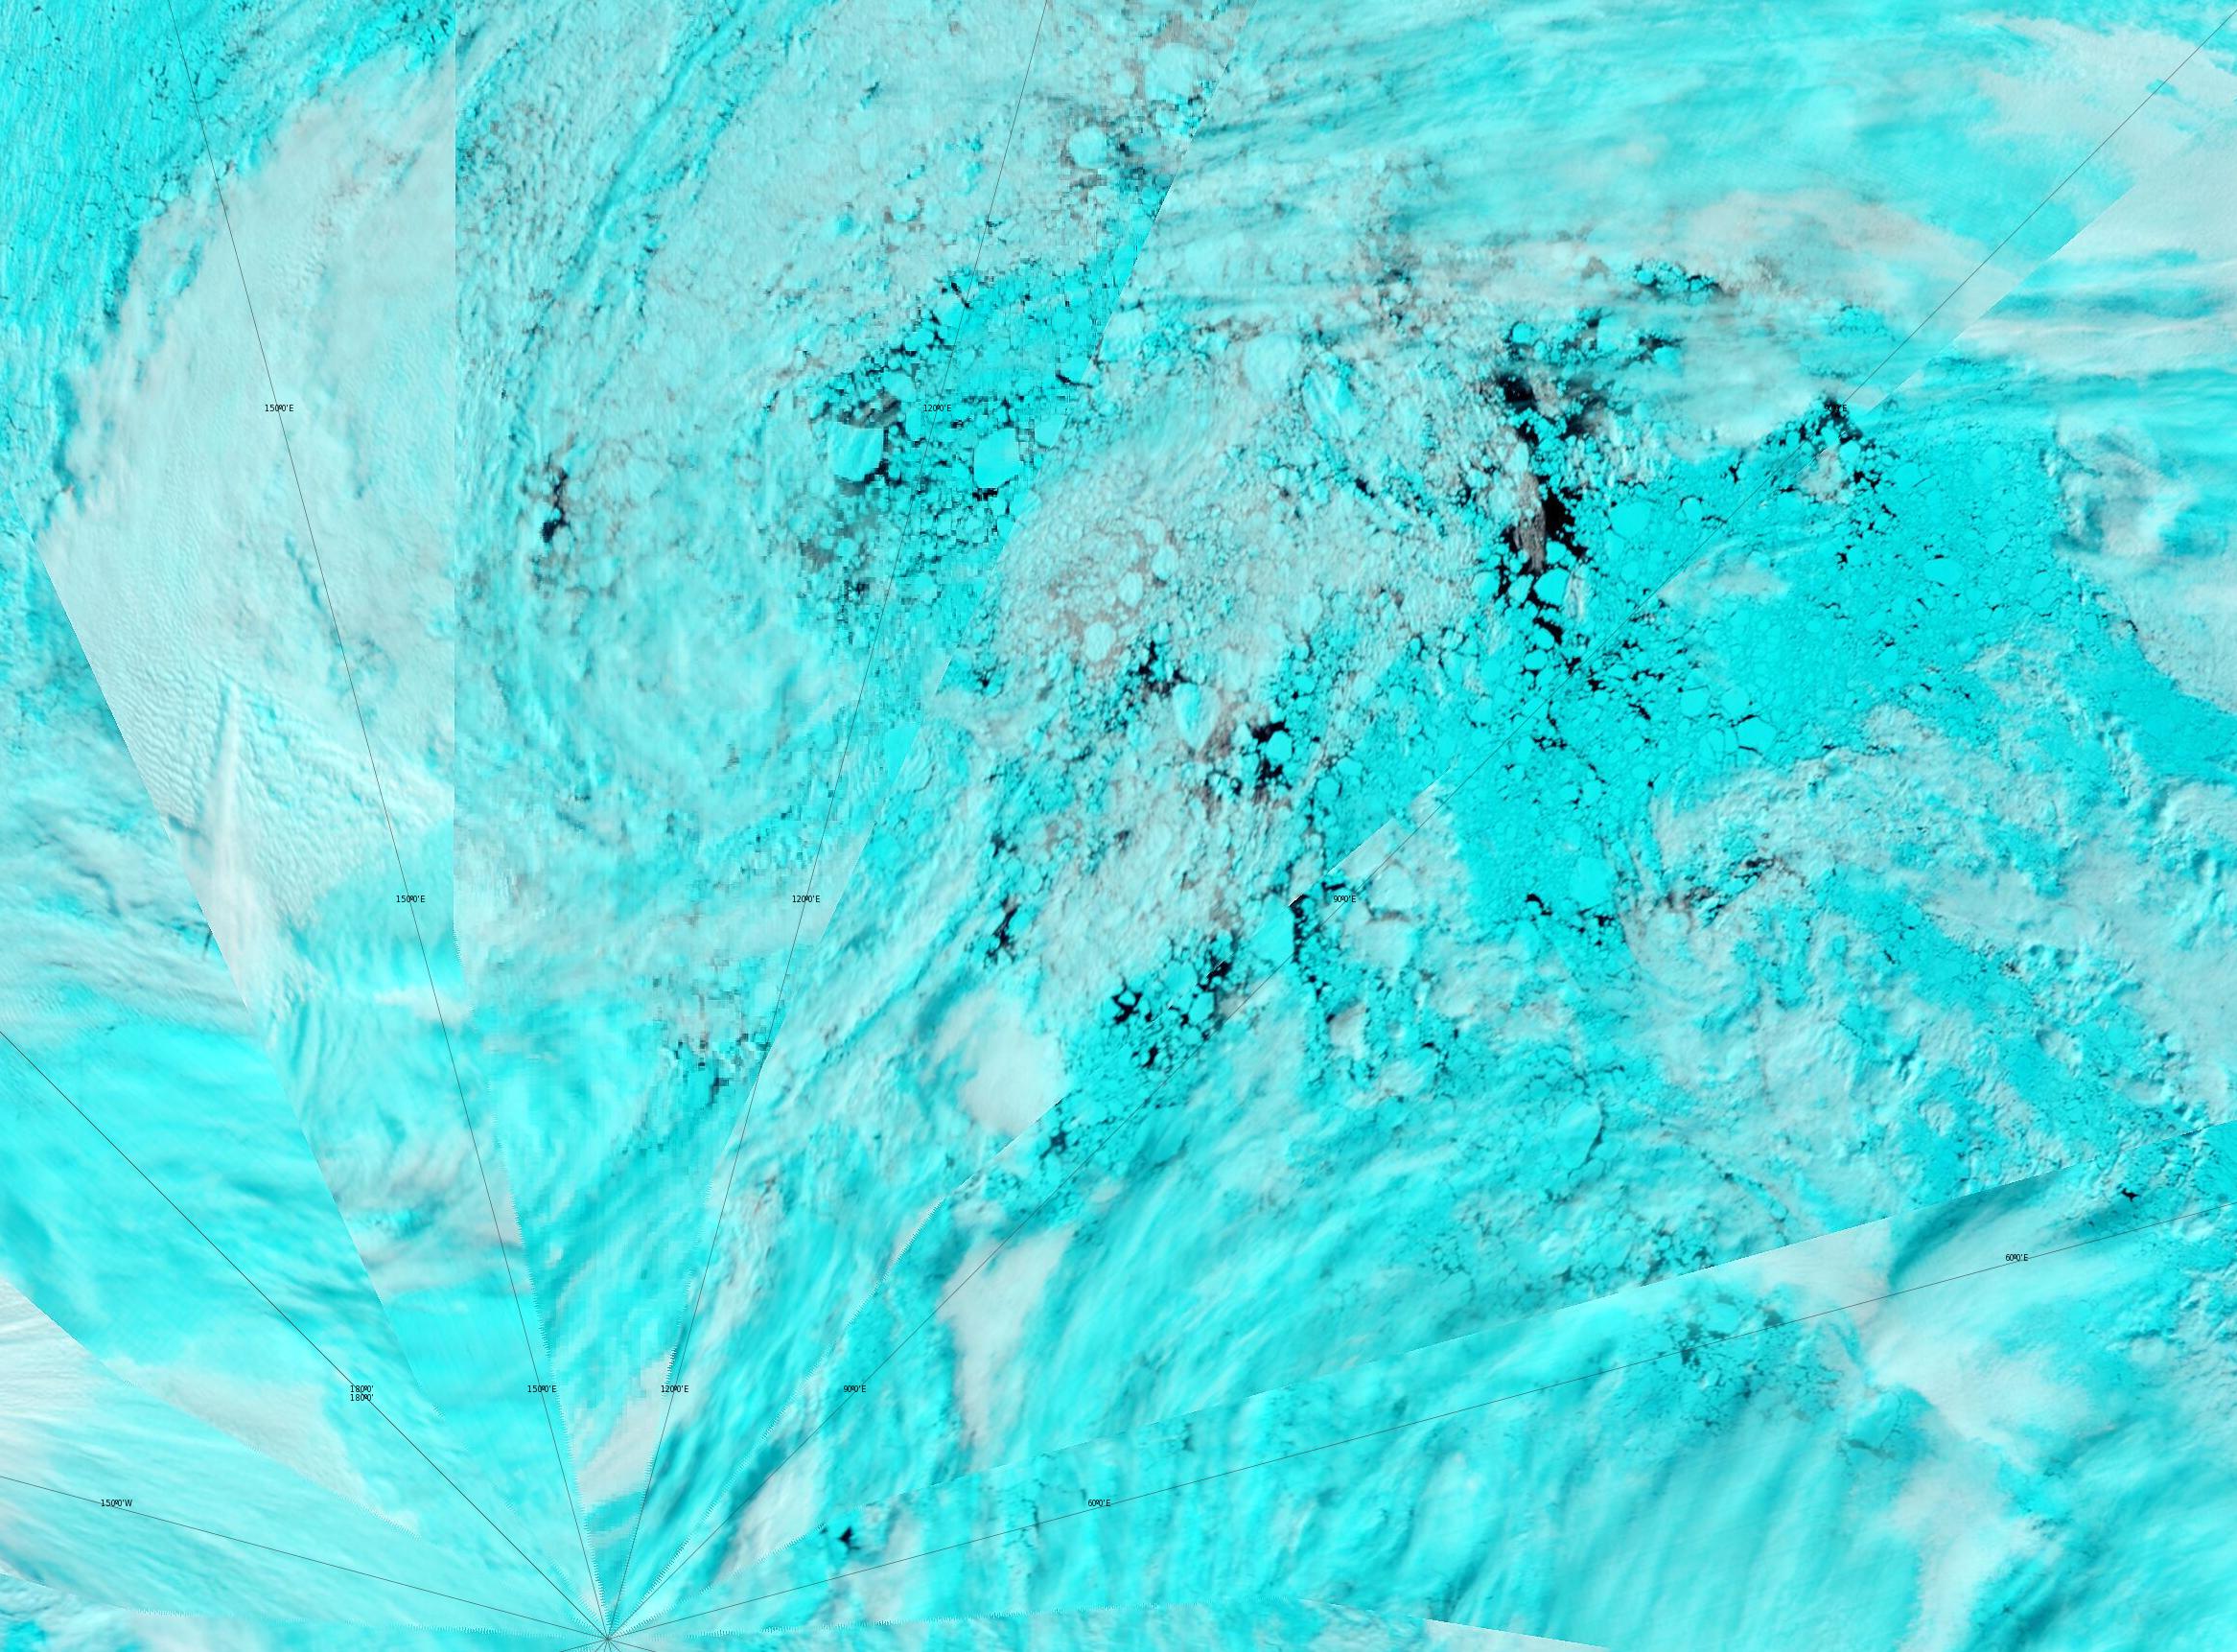
A glimpse of the fractured sea ice near the North Pole:
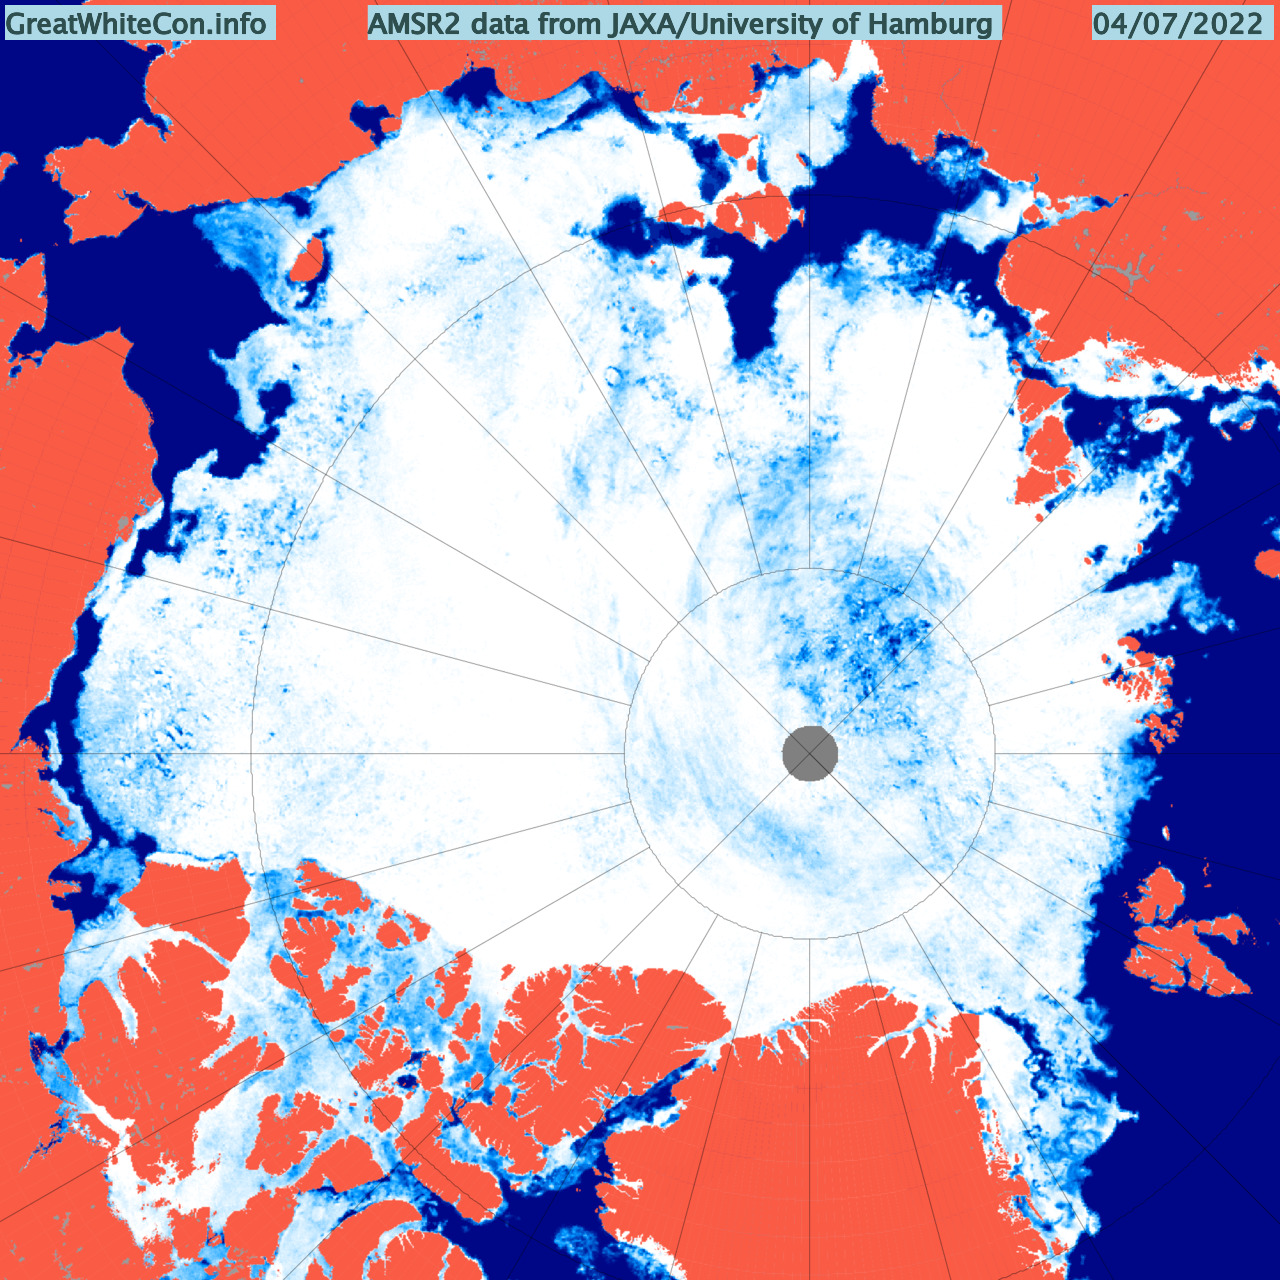
To help see through the clouds across the Arctic Ocean, here too is the current AMSR2 sea ice concentration map:
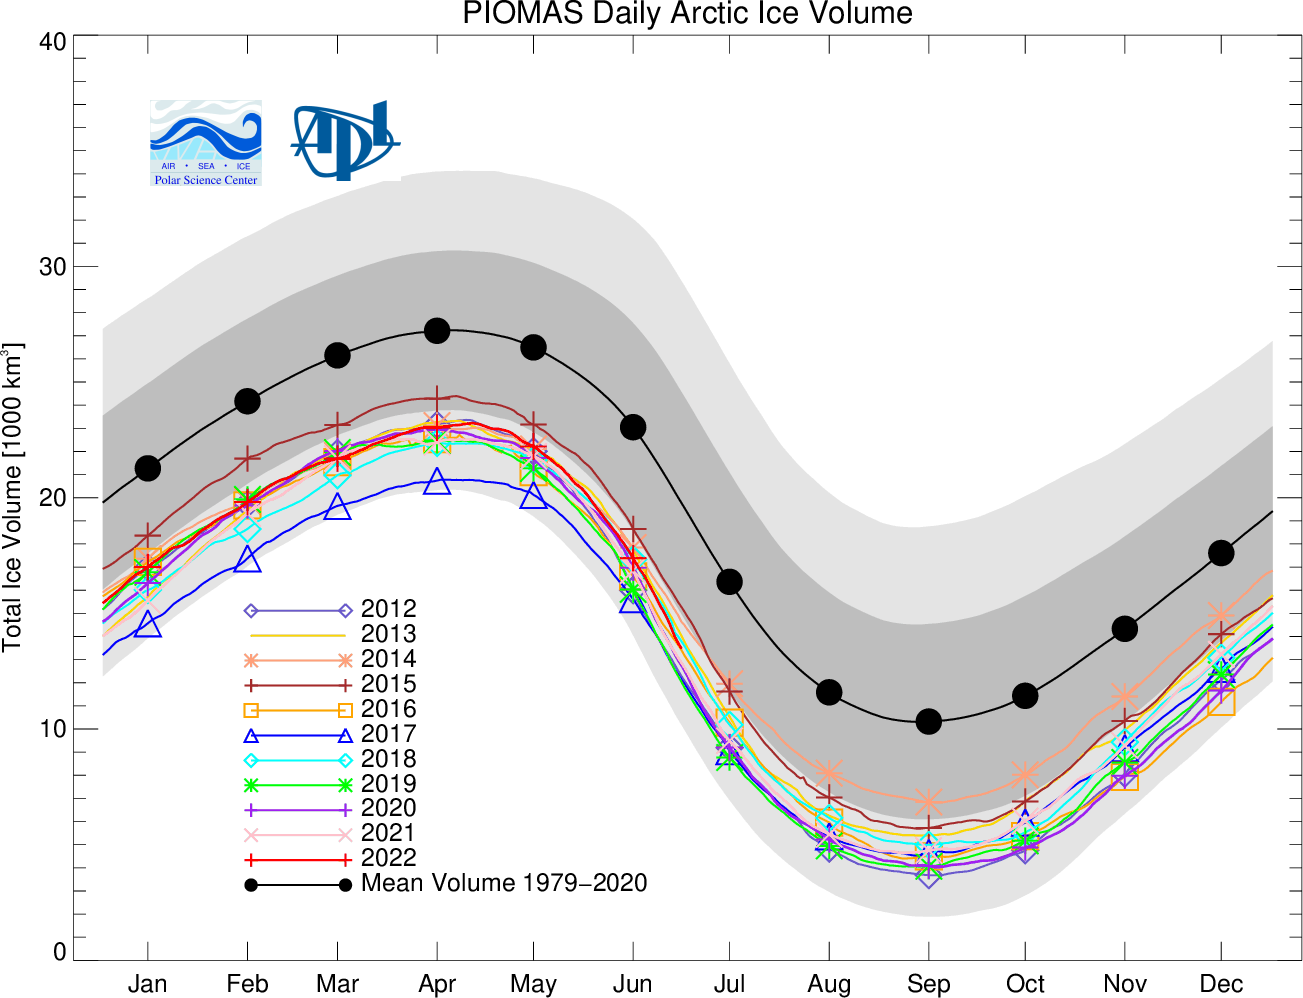
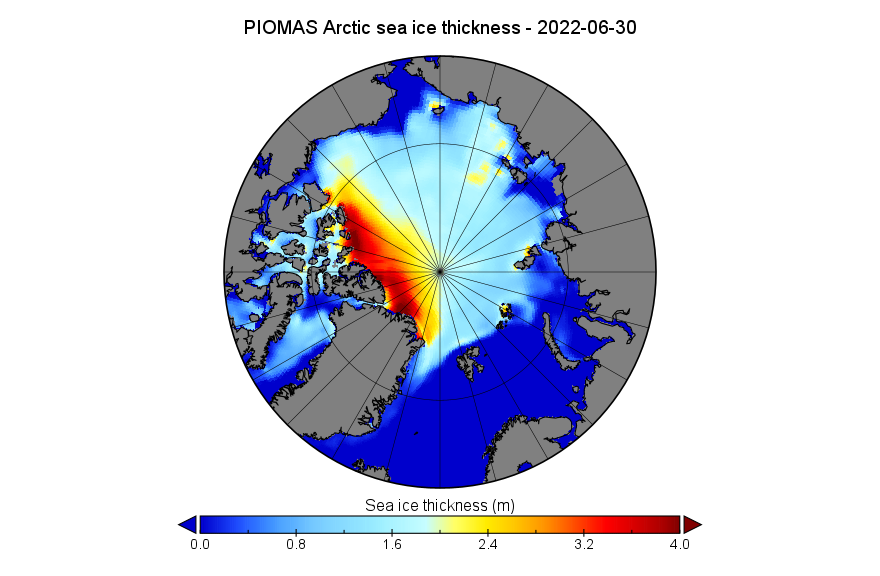
The PIOMAS volume data for June 2022 has been released:
Average Arctic sea ice volume in June 2022 was 17,000 km3. This value is the 9th lowest on record for June, about 1,700 km3 above the record set in 2017. Monthly ice volume was 48% below the maximum in 1979 and 22% below the mean value for 1979-2021.
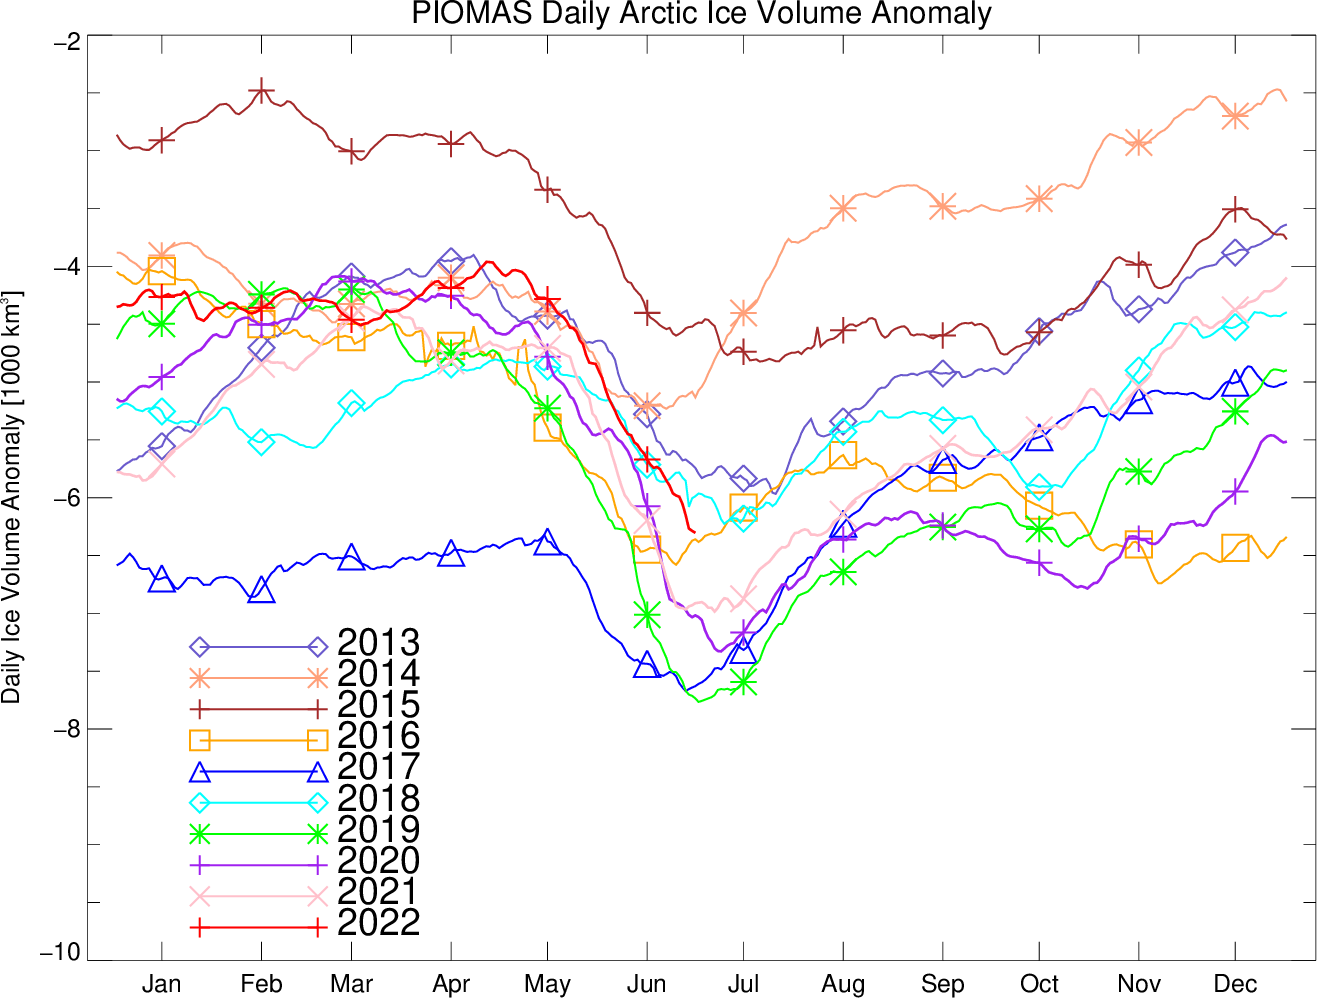
Ice growth anomalies for June 2022 dropped to the middle range of the most recent decade with a mean ice thickness (above 15 cm thickness) at the middle of recent values.
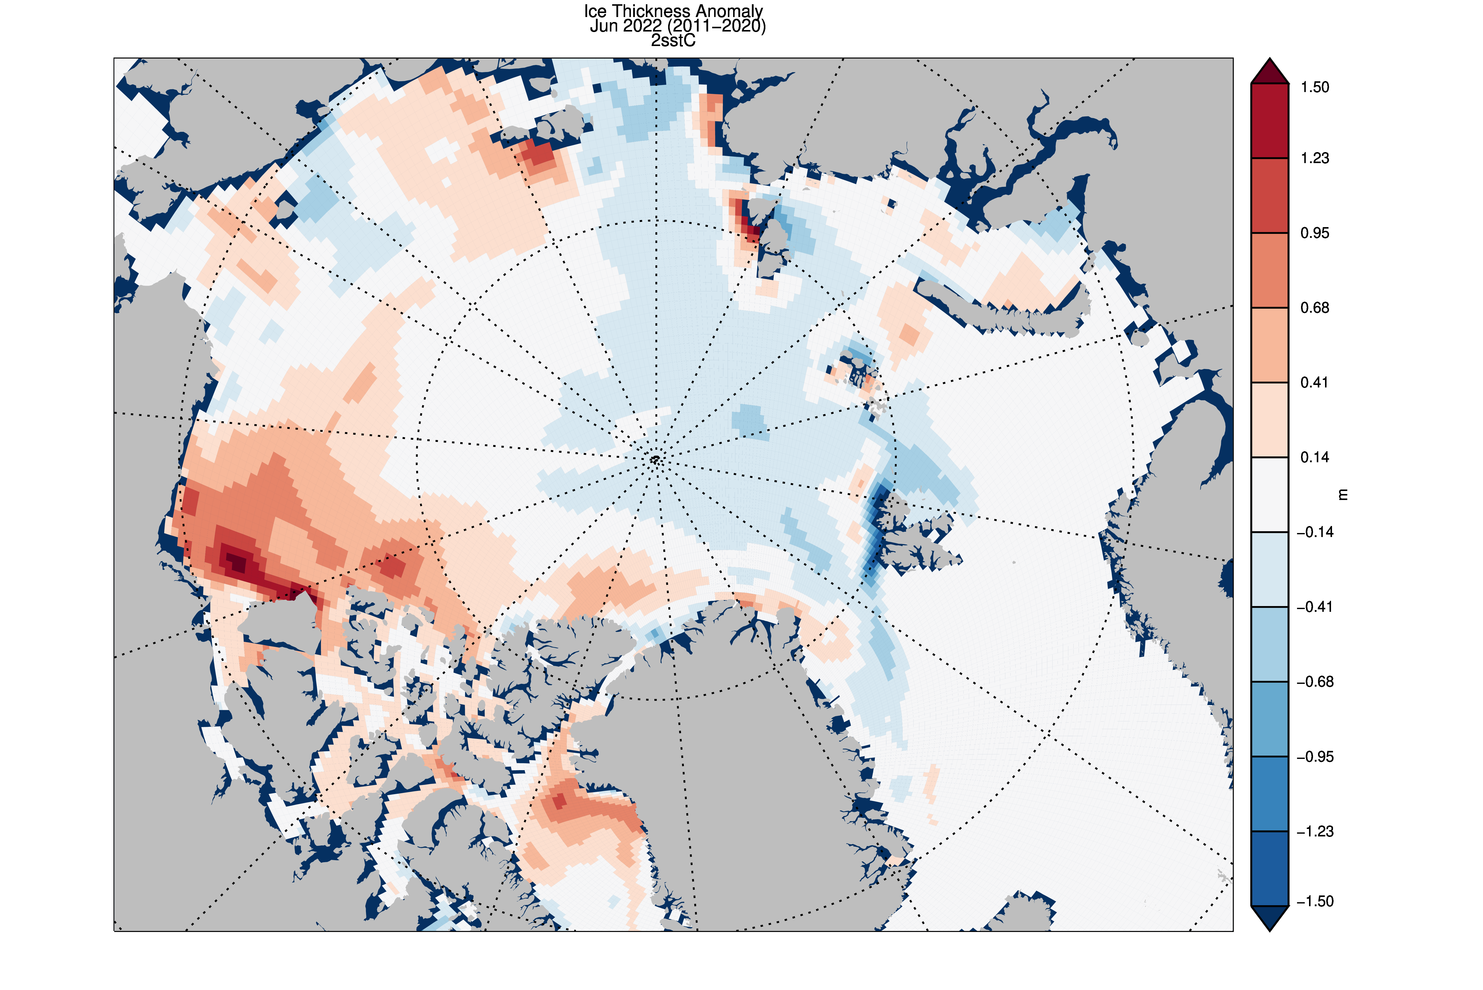
The ice thickness anomaly map for June 2022 relative to 2011-2020 continues the previous months pattern that divides the Arctic in two halves with positive anomalies in the “Western Arctic” , a strong positive anomaly in the Eastern Beaufort but negative anomalies in “Eastern Arctic”.
Here’s the PIOMAS modelled Arctic sea ice thickness map for June 30th:
The July edition of the NSIDC’s Arctic Sea Ice News summarises June 2022 as follows:
Average Arctic sea ice extent for June 2022 was 10.86 million square kilometers (4.19 million square miles), ranking tenth lowest in the satellite record. The 2022 June extent was 900,000 square kilometers (347,000 square miles) below the 1981 to 2010 average. Total ice loss for June was 2.50 million square kilometers (965,000 square miles)…

The Barents Sea is nearly ice free, with the ice edge far north of its usual location for this time of year. Hudson Bay is also losing ice unusually early. Extent in the Chukchi, East Siberian, and Kara Seas is slightly below average. The most notable feature along the Russian coast is the opening of a large polynya in the Laptev Sea near the New Siberian Islands. Baffin Bay has near average ice extent, and in early June the North Water Polynya opened. Some extensive low-ice-concentration regions are forming over the central Arctic Ocean, perhaps portending large polynyas in the later part of the summer…
June air temperatures over the Arctic as assessed at the 925 hPa level (approximately 2,500 feet above the surface) were close to the long-term average. Most of the high-latitude Arctic Ocean was within a degree of the 1981 to 2010 average temperature.

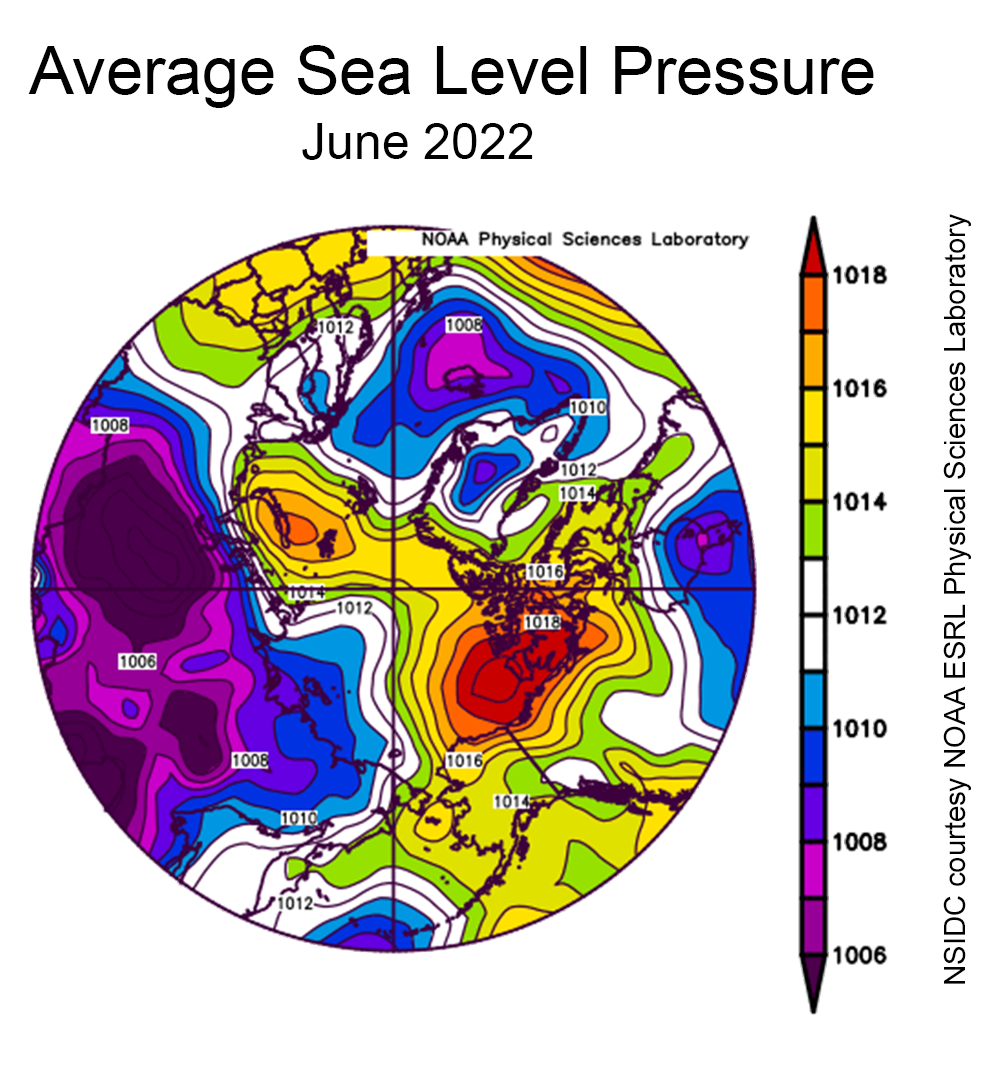
The June sea level pressure pattern was characterized by strong high pressure over the Beaufort Sea and a large low pressure area near Iceland. This pattern is consistent with the warmth over Scandinavia and relatively cool conditions over Baffin Bay. A broad area of low pressure also dominates northwestern Eurasia. The strong high pressure over the Beaufort Sea, and generally high pressures over much of the Arctic Ocean, is consistent with a prevalence of clear skies. Since June is the month of the solstice, with the highest sun elevation, the clear skies let more solar energy reach the ice surface, leading to strong surface melting…
The article also includes discussion of a new paper on air temperature over the Barents Sea:
As a result of the more open ocean conditions, the trend in air temperature in the region is extreme: up to ten times the global trend in warming. This was highlighted in a recent study by Isaksen and others. Sea ice acts as a lid in autumn and winter, separating the fairly warm open ocean, which is just above freezing, from the cold Arctic air. Removing the ice results in a large transfer of heat from the ocean to the atmosphere, and therefore atmospheric warming.
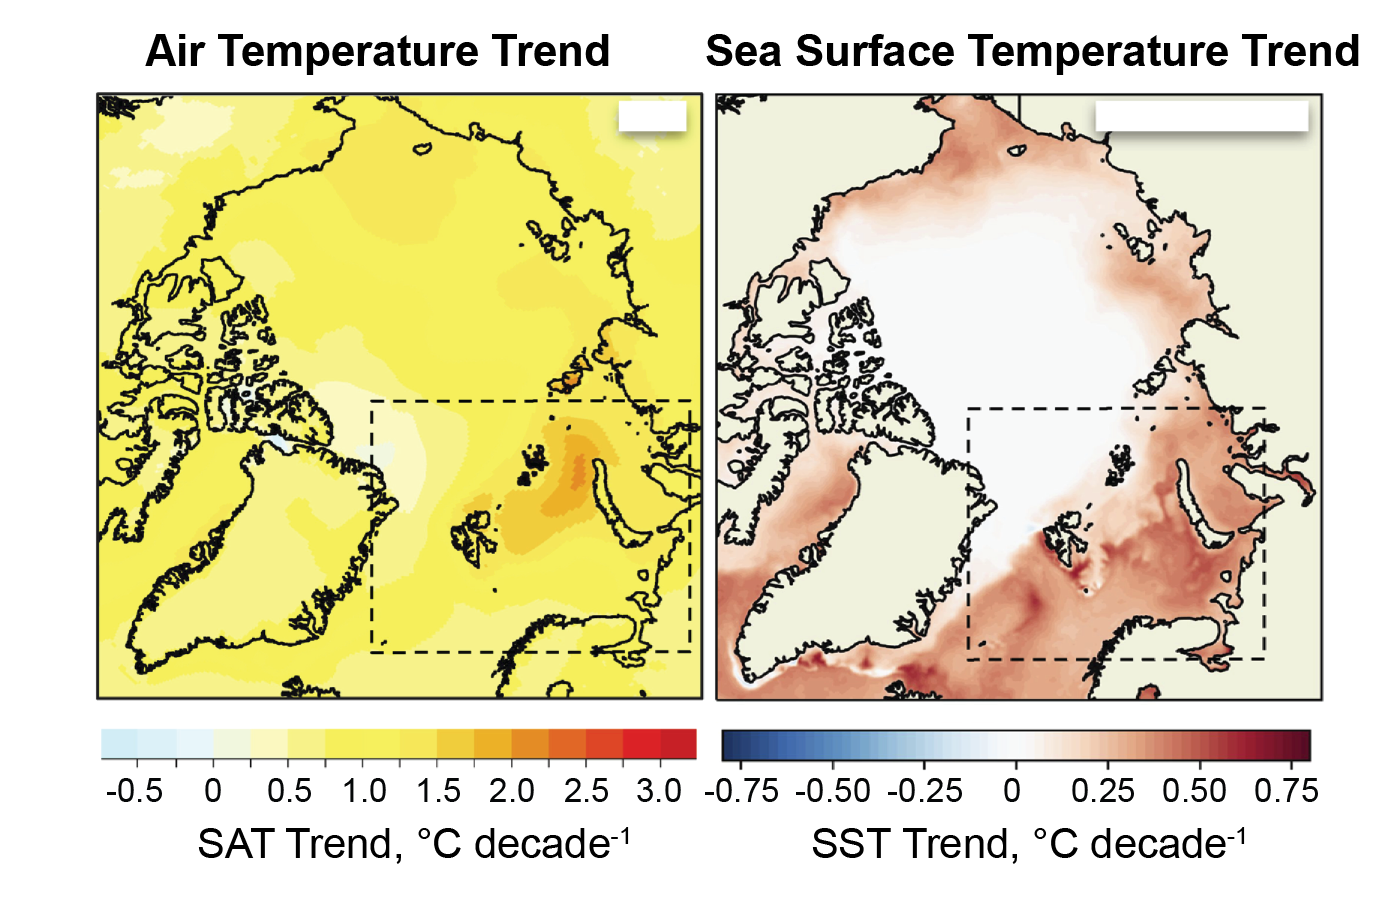
The deeper issue is why the sea ice in the northern Barents Sea is declining, and it may be related to the “Atlantification” of the Arctic Ocean. Warm and salty Atlantic water enters the Arctic Ocean through the Barents Sea and eastern Fram Strait, and dives beneath the cold, relatively fresh and less dense surface layer of the Arctic Ocean. Previous research has shown that the fresh surface layer is thinning as a result of less summer sea ice, allowing heat from the Atlantic water to reach the surface, preventing winter sea ice from forming in the Barents Sea region. In short, some parts of the Barents Sea have started to resemble the Atlantic.
As Isaksen et al. put it:
The decline in the Barents sea ice cover, increased ocean temperature and salinity are closely related to the higher temperatures in the Atlantic Water and increased ocean heat transport entering the region from the west. In addition, the increase in salinity is larger towards the upper layers, leading to a weakened ocean stratification and hereby an increased upward heat flux. These oceanographic processes strongly contribute to the amplified warming in the region and enable larger heat flux interaction between the ocean and the air. If the rise in ocean temperature and salinity continues, the originally cold and stratified Arctic shelf region may be transformed into an Atlantic-dominated climate regime with a warmer and more well-mixed water column strongly preventing sea ice formation.
The NSIDC also speculates about the effects of the current La Niña pattern in the equatorial Pacific Ocean on Arctic sea ice:
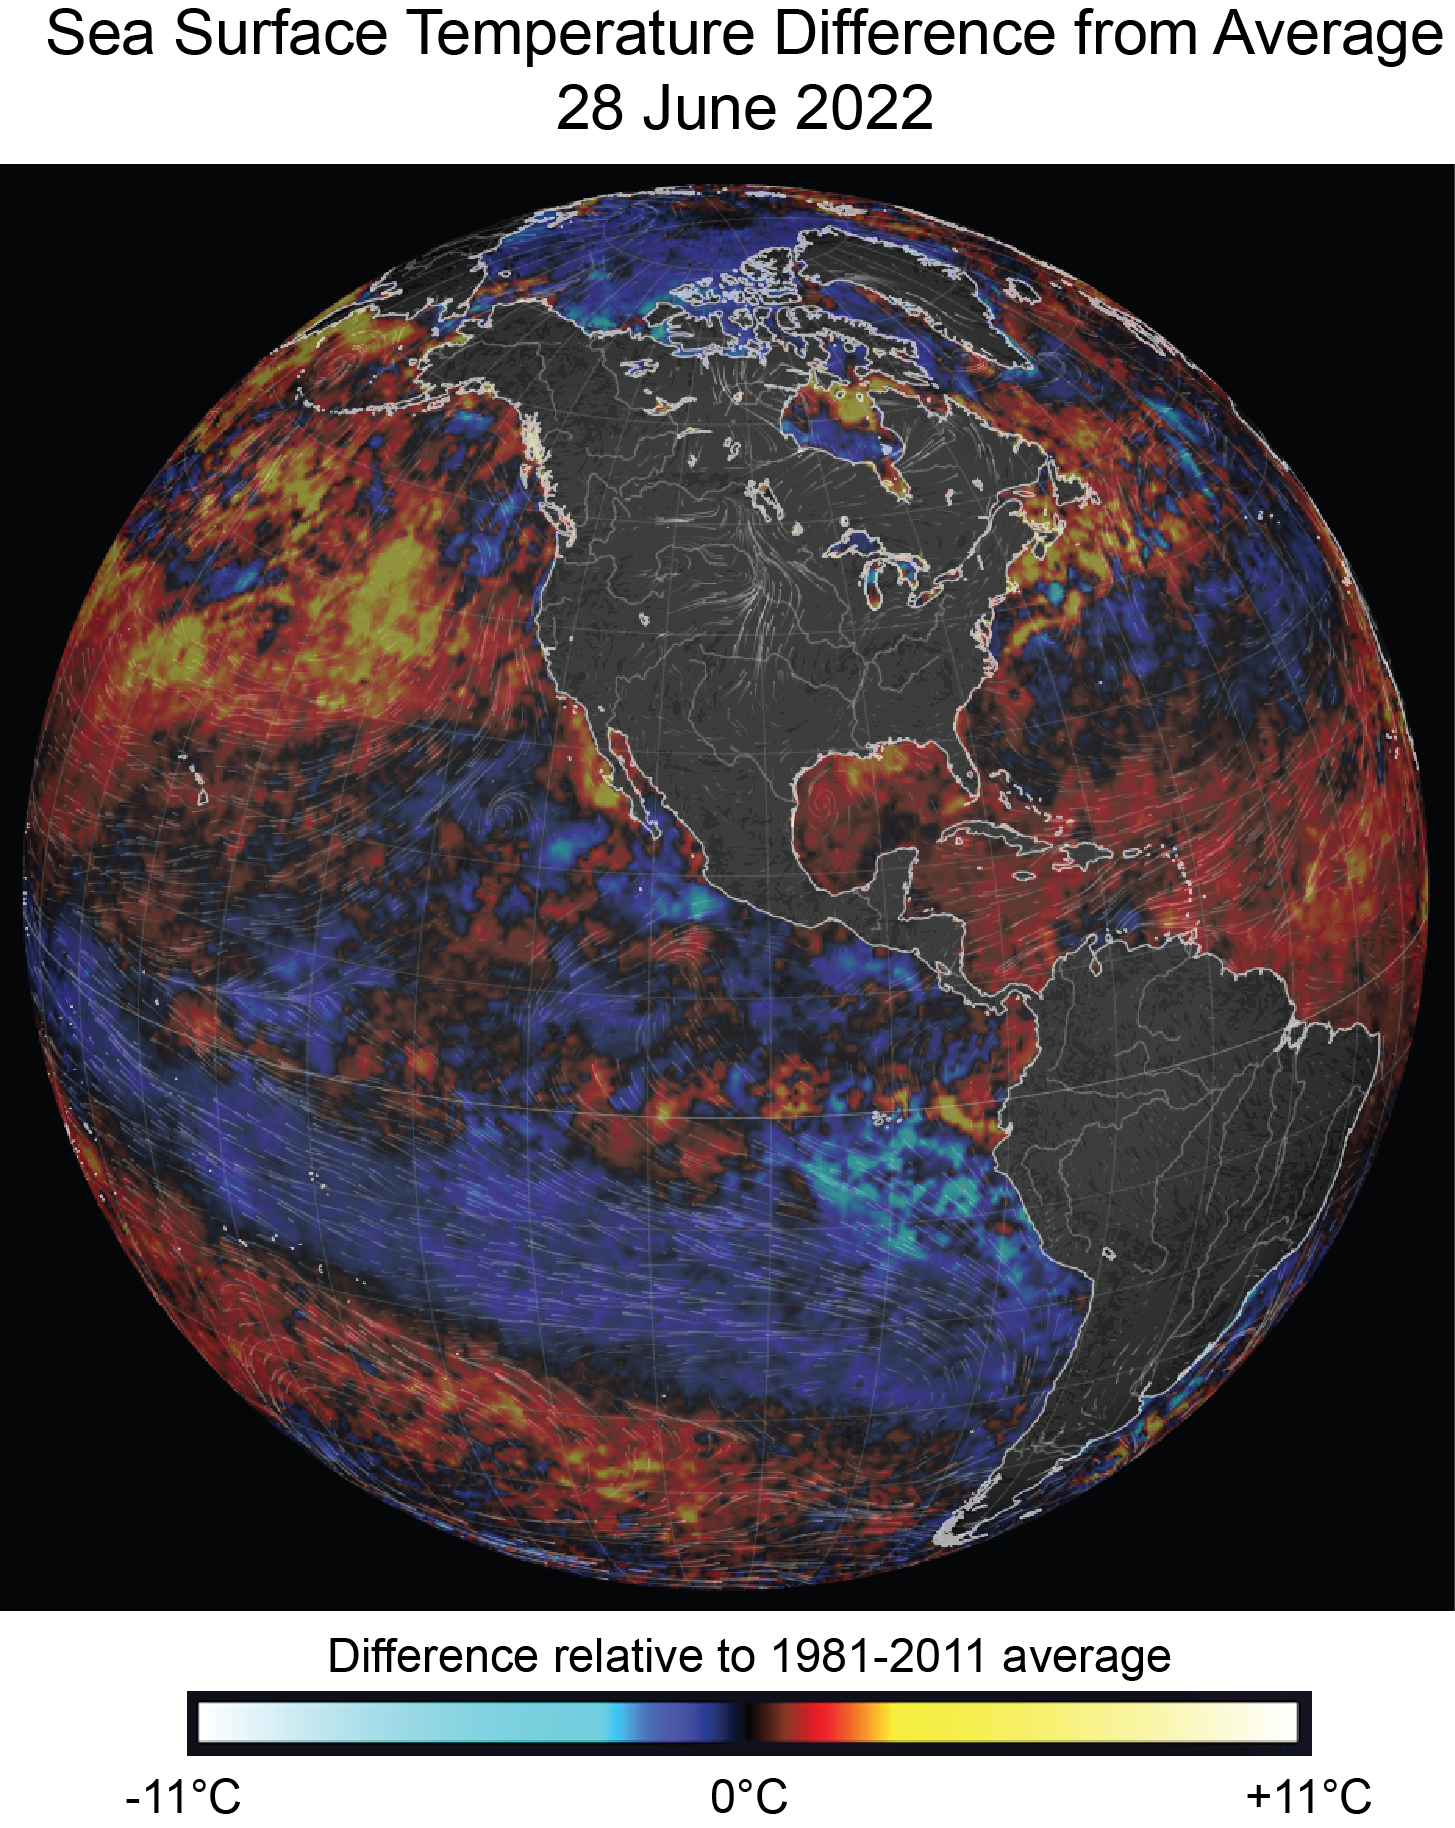
[Edit – July 12th]Beginning around July 2020, a moderate La Niña pattern developed, characterized by a large pool of relatively cool water in the eastern tropical Pacific. This event has persisted with a brief hiatus in the summer of 2021. It is forecast to last through the end of the year, with some variations, generally weakening as the year progresses. Along with the La Niña pattern, a pool of unusually warm water has formed in the northern Pacific…
However, the air pressure pattern in June is unlike past La Niña events that led to rapid ice loss like in the 2012 summer, which set a satellite-era record low September sea ice minimum.
The NSIDC’s weekly sea ice age map is now available up to July 1st:
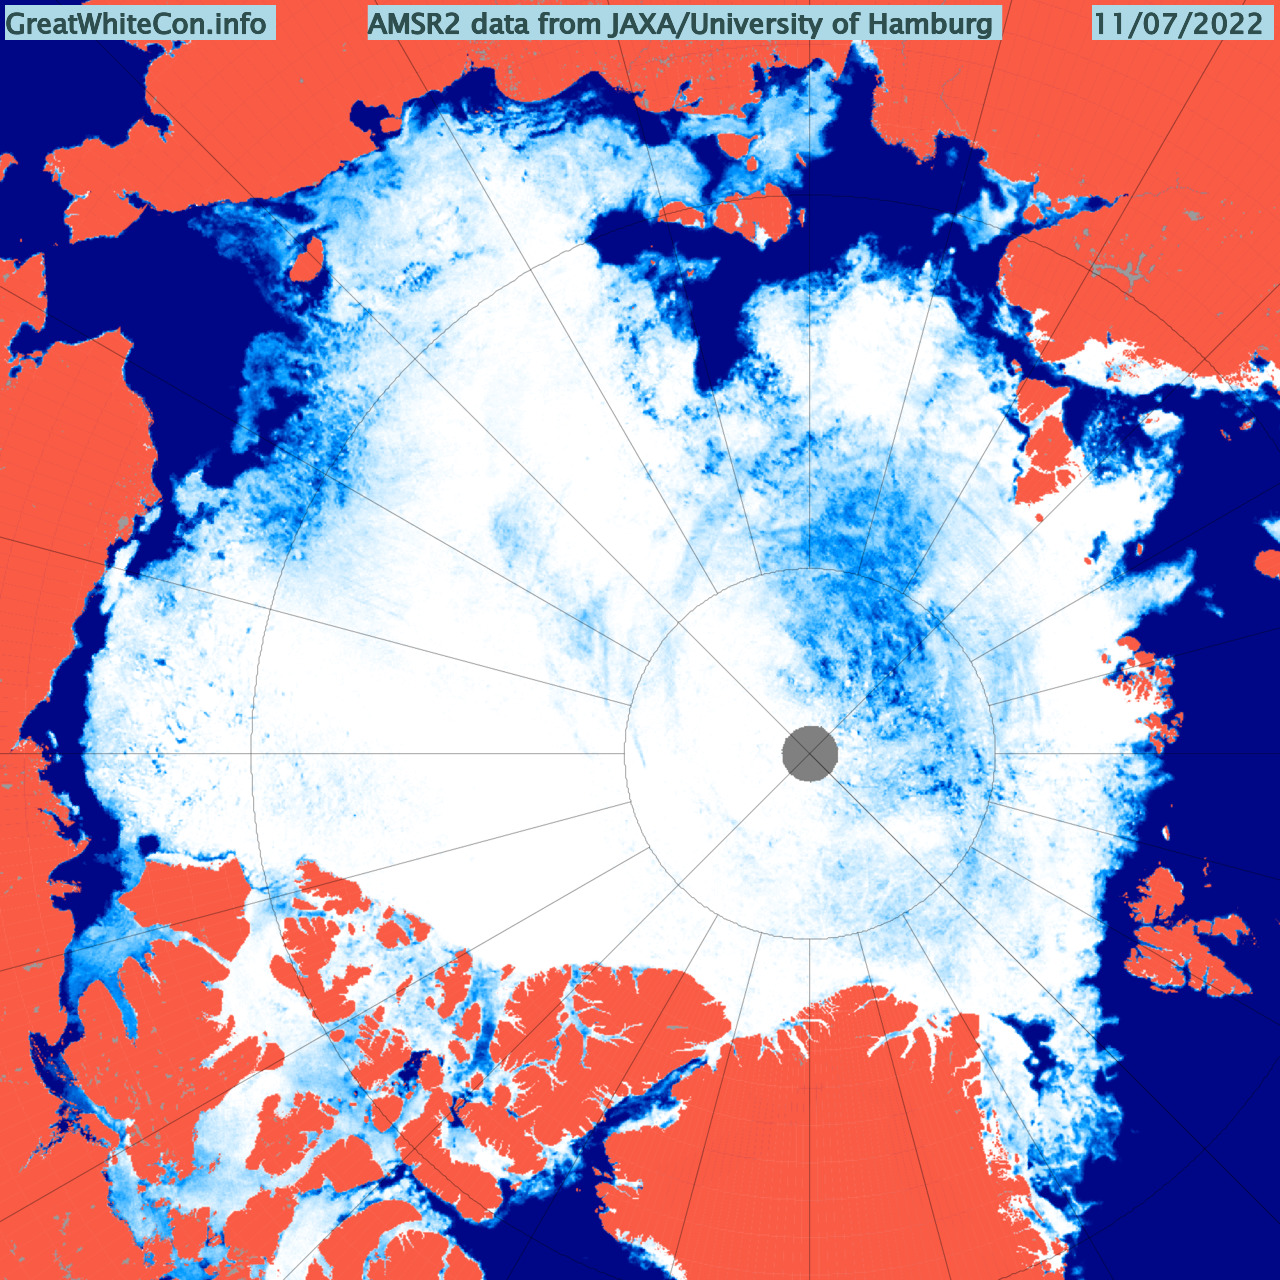
Here too is the latest AMSR2 sea ice concentration map, showing a large area of reduced concentration ice stretching from the Laptev Sea to the North Pole:
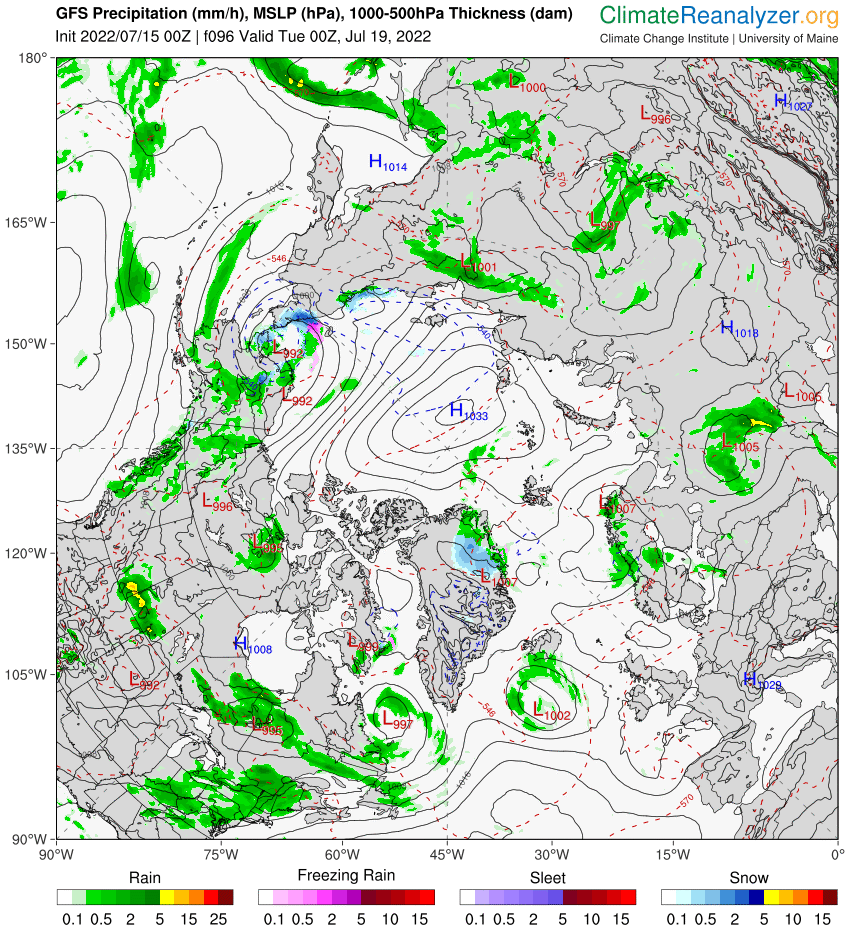
After low pressure domination for several weeks it now looks as though high pressure may be about to take over in the central Arctic. Here’s the GFS forecast for Tuesday 19th:
The Polar Science Center have released their mid July data. Here’s the PIOMAS modelled Arctic sea ice thickness map for July 15th:
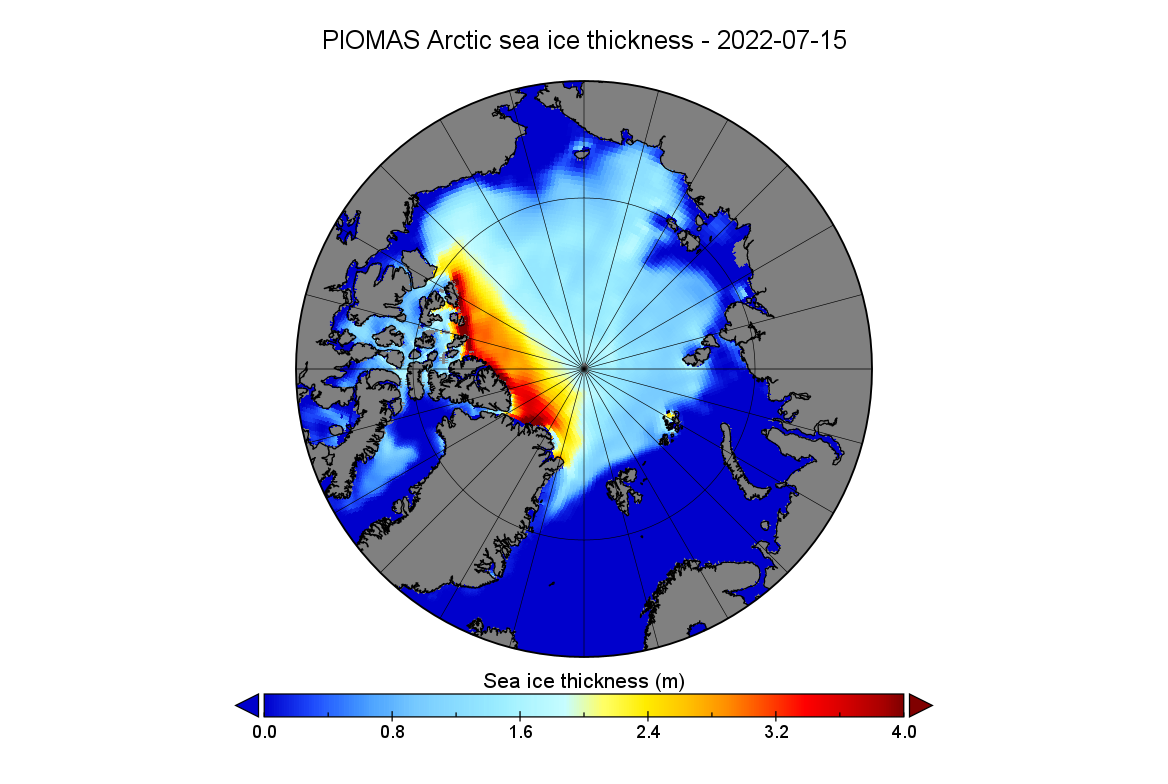
According to Steven on the Arctic Sea Ice Forum:
PIOMAS volume for 15 July 2022 was 10.41k km3, which is 10th lowest for the date.
With high pressure in place here too is a fairly clear view of the “Laptev Bite” this morning:

The view from on high has cleared almost to the North Pole:
The rate of extent decline has increased over recent days. Is 2022 more likely to follow the path of 2012, 2013 or 2016 to this year’s minimum?
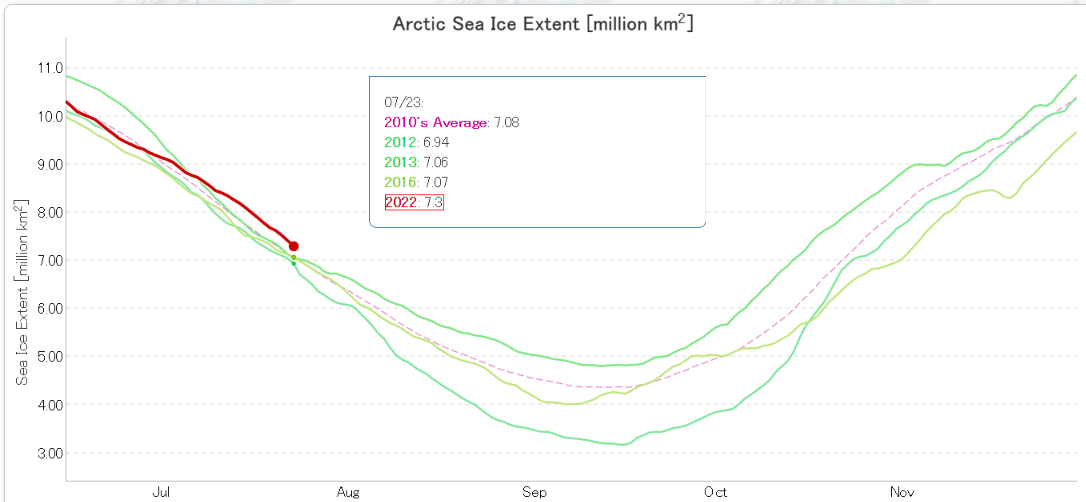
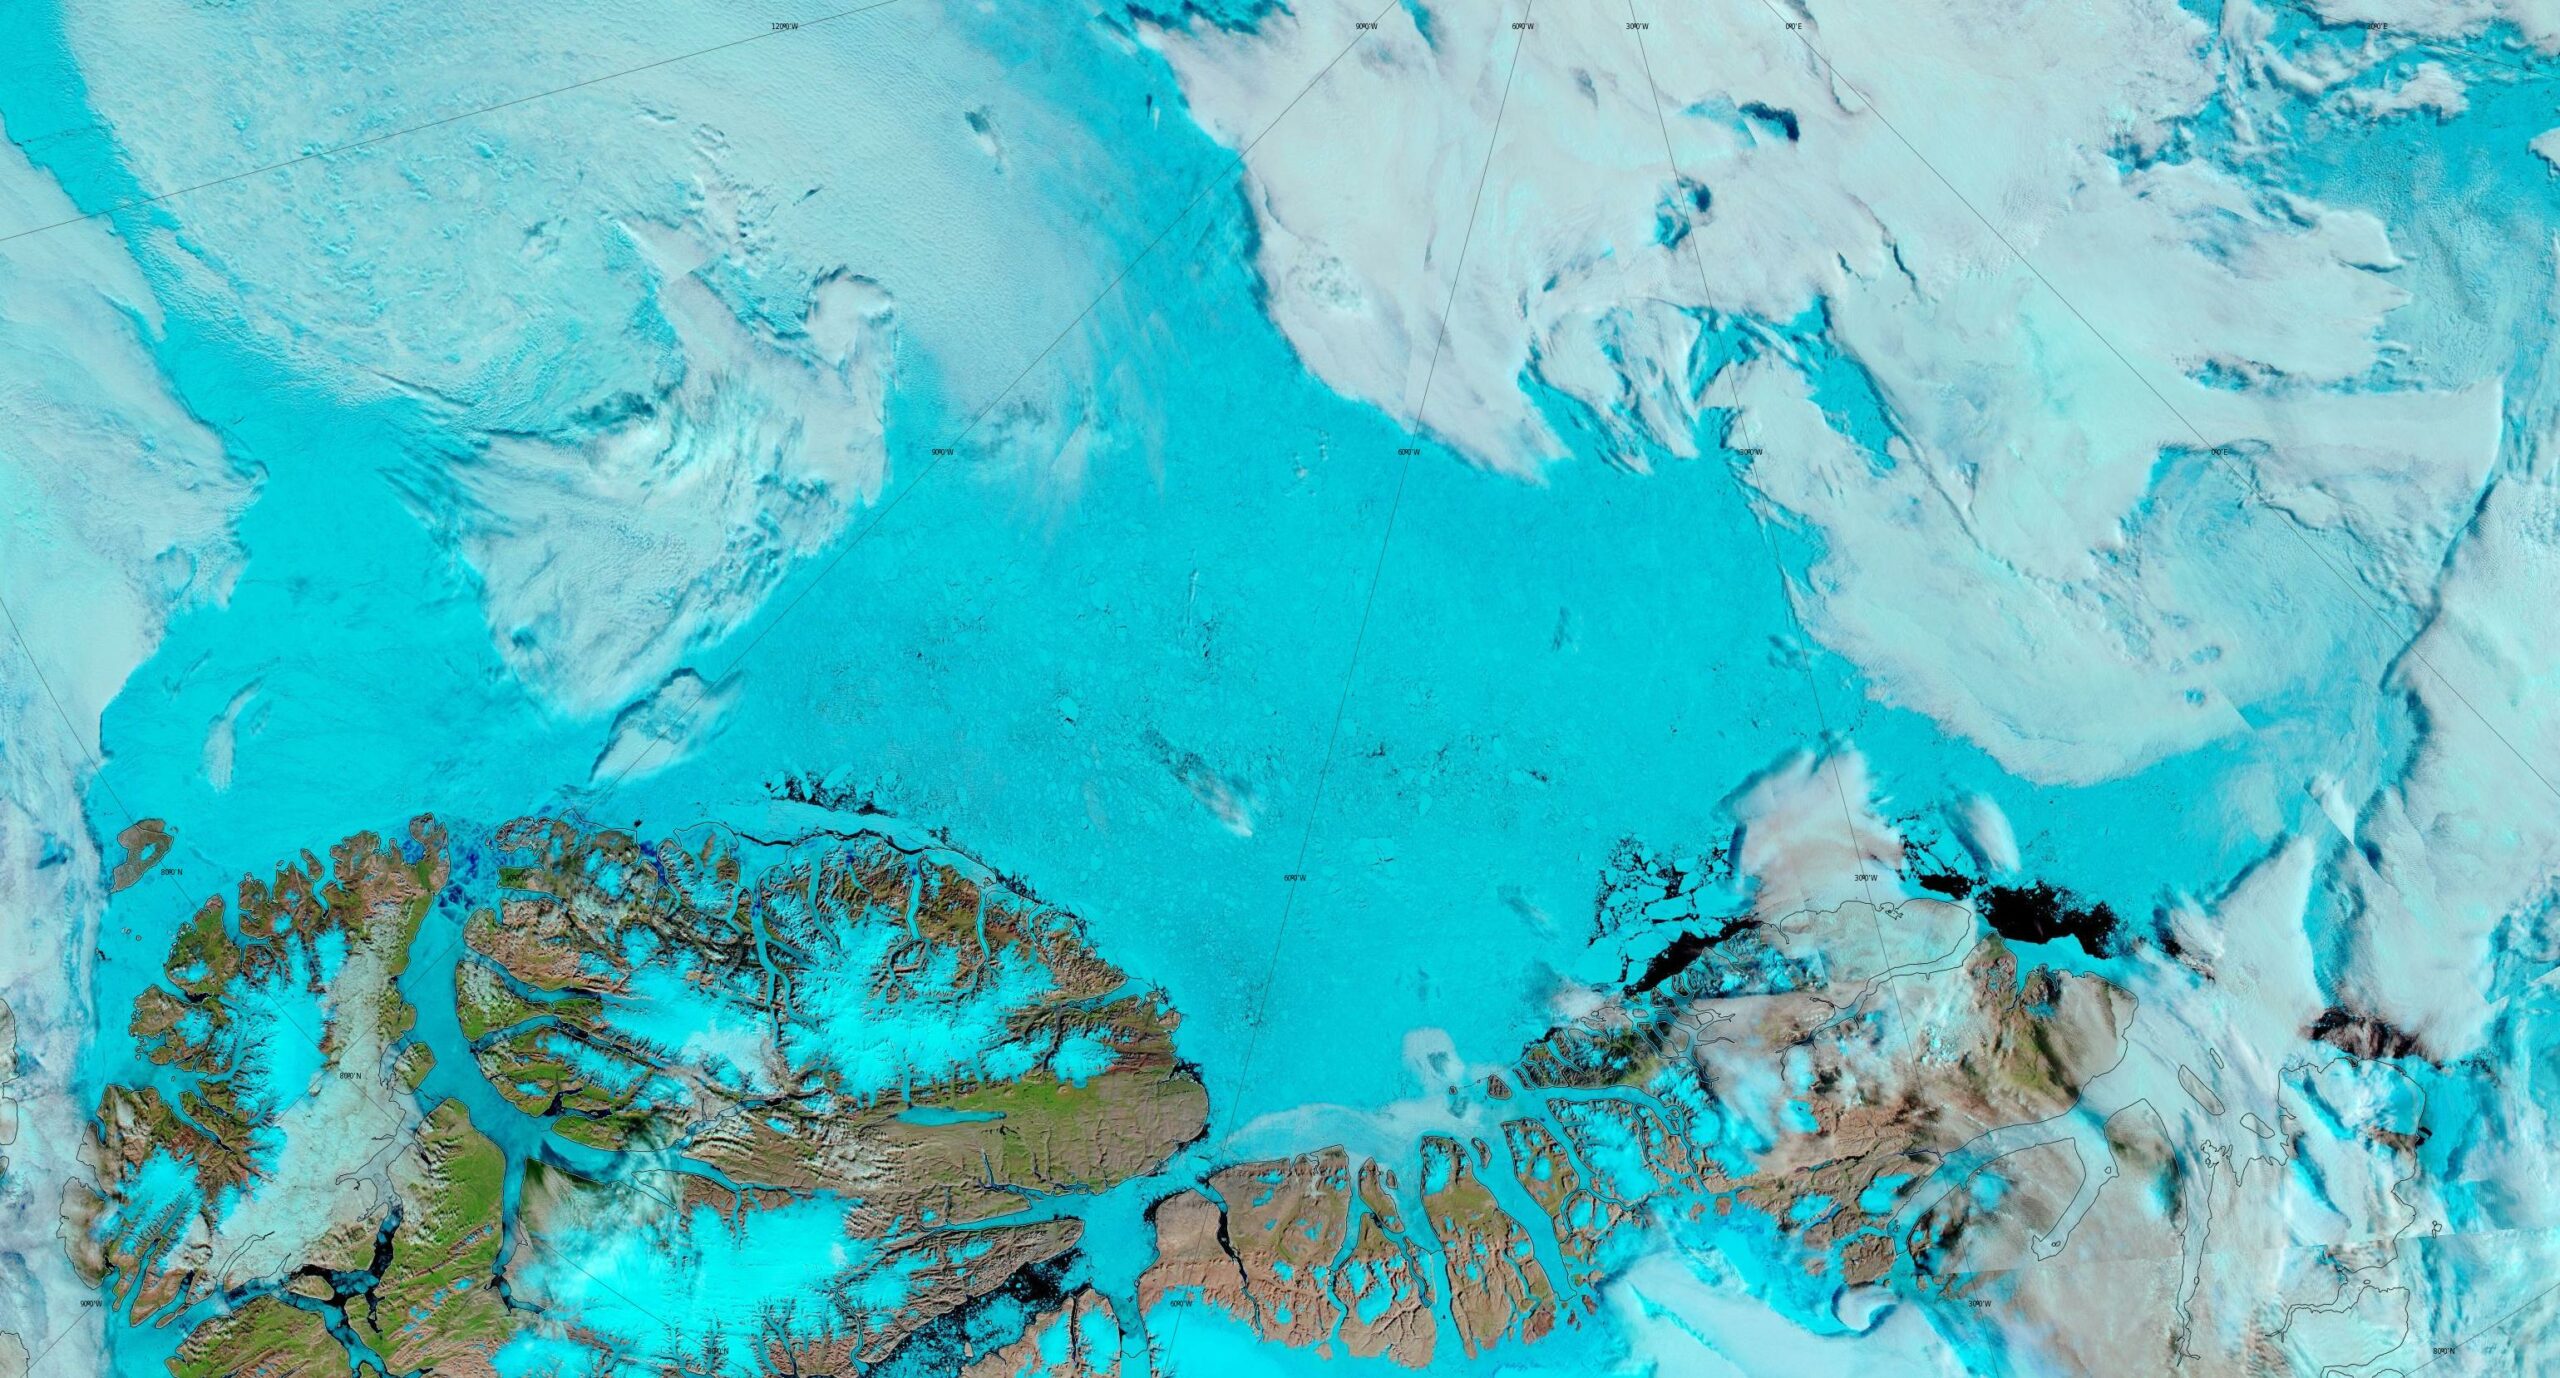
For comparison purposes here are “pseudo colour” satellite images of the North Pole on July 21st 2013:
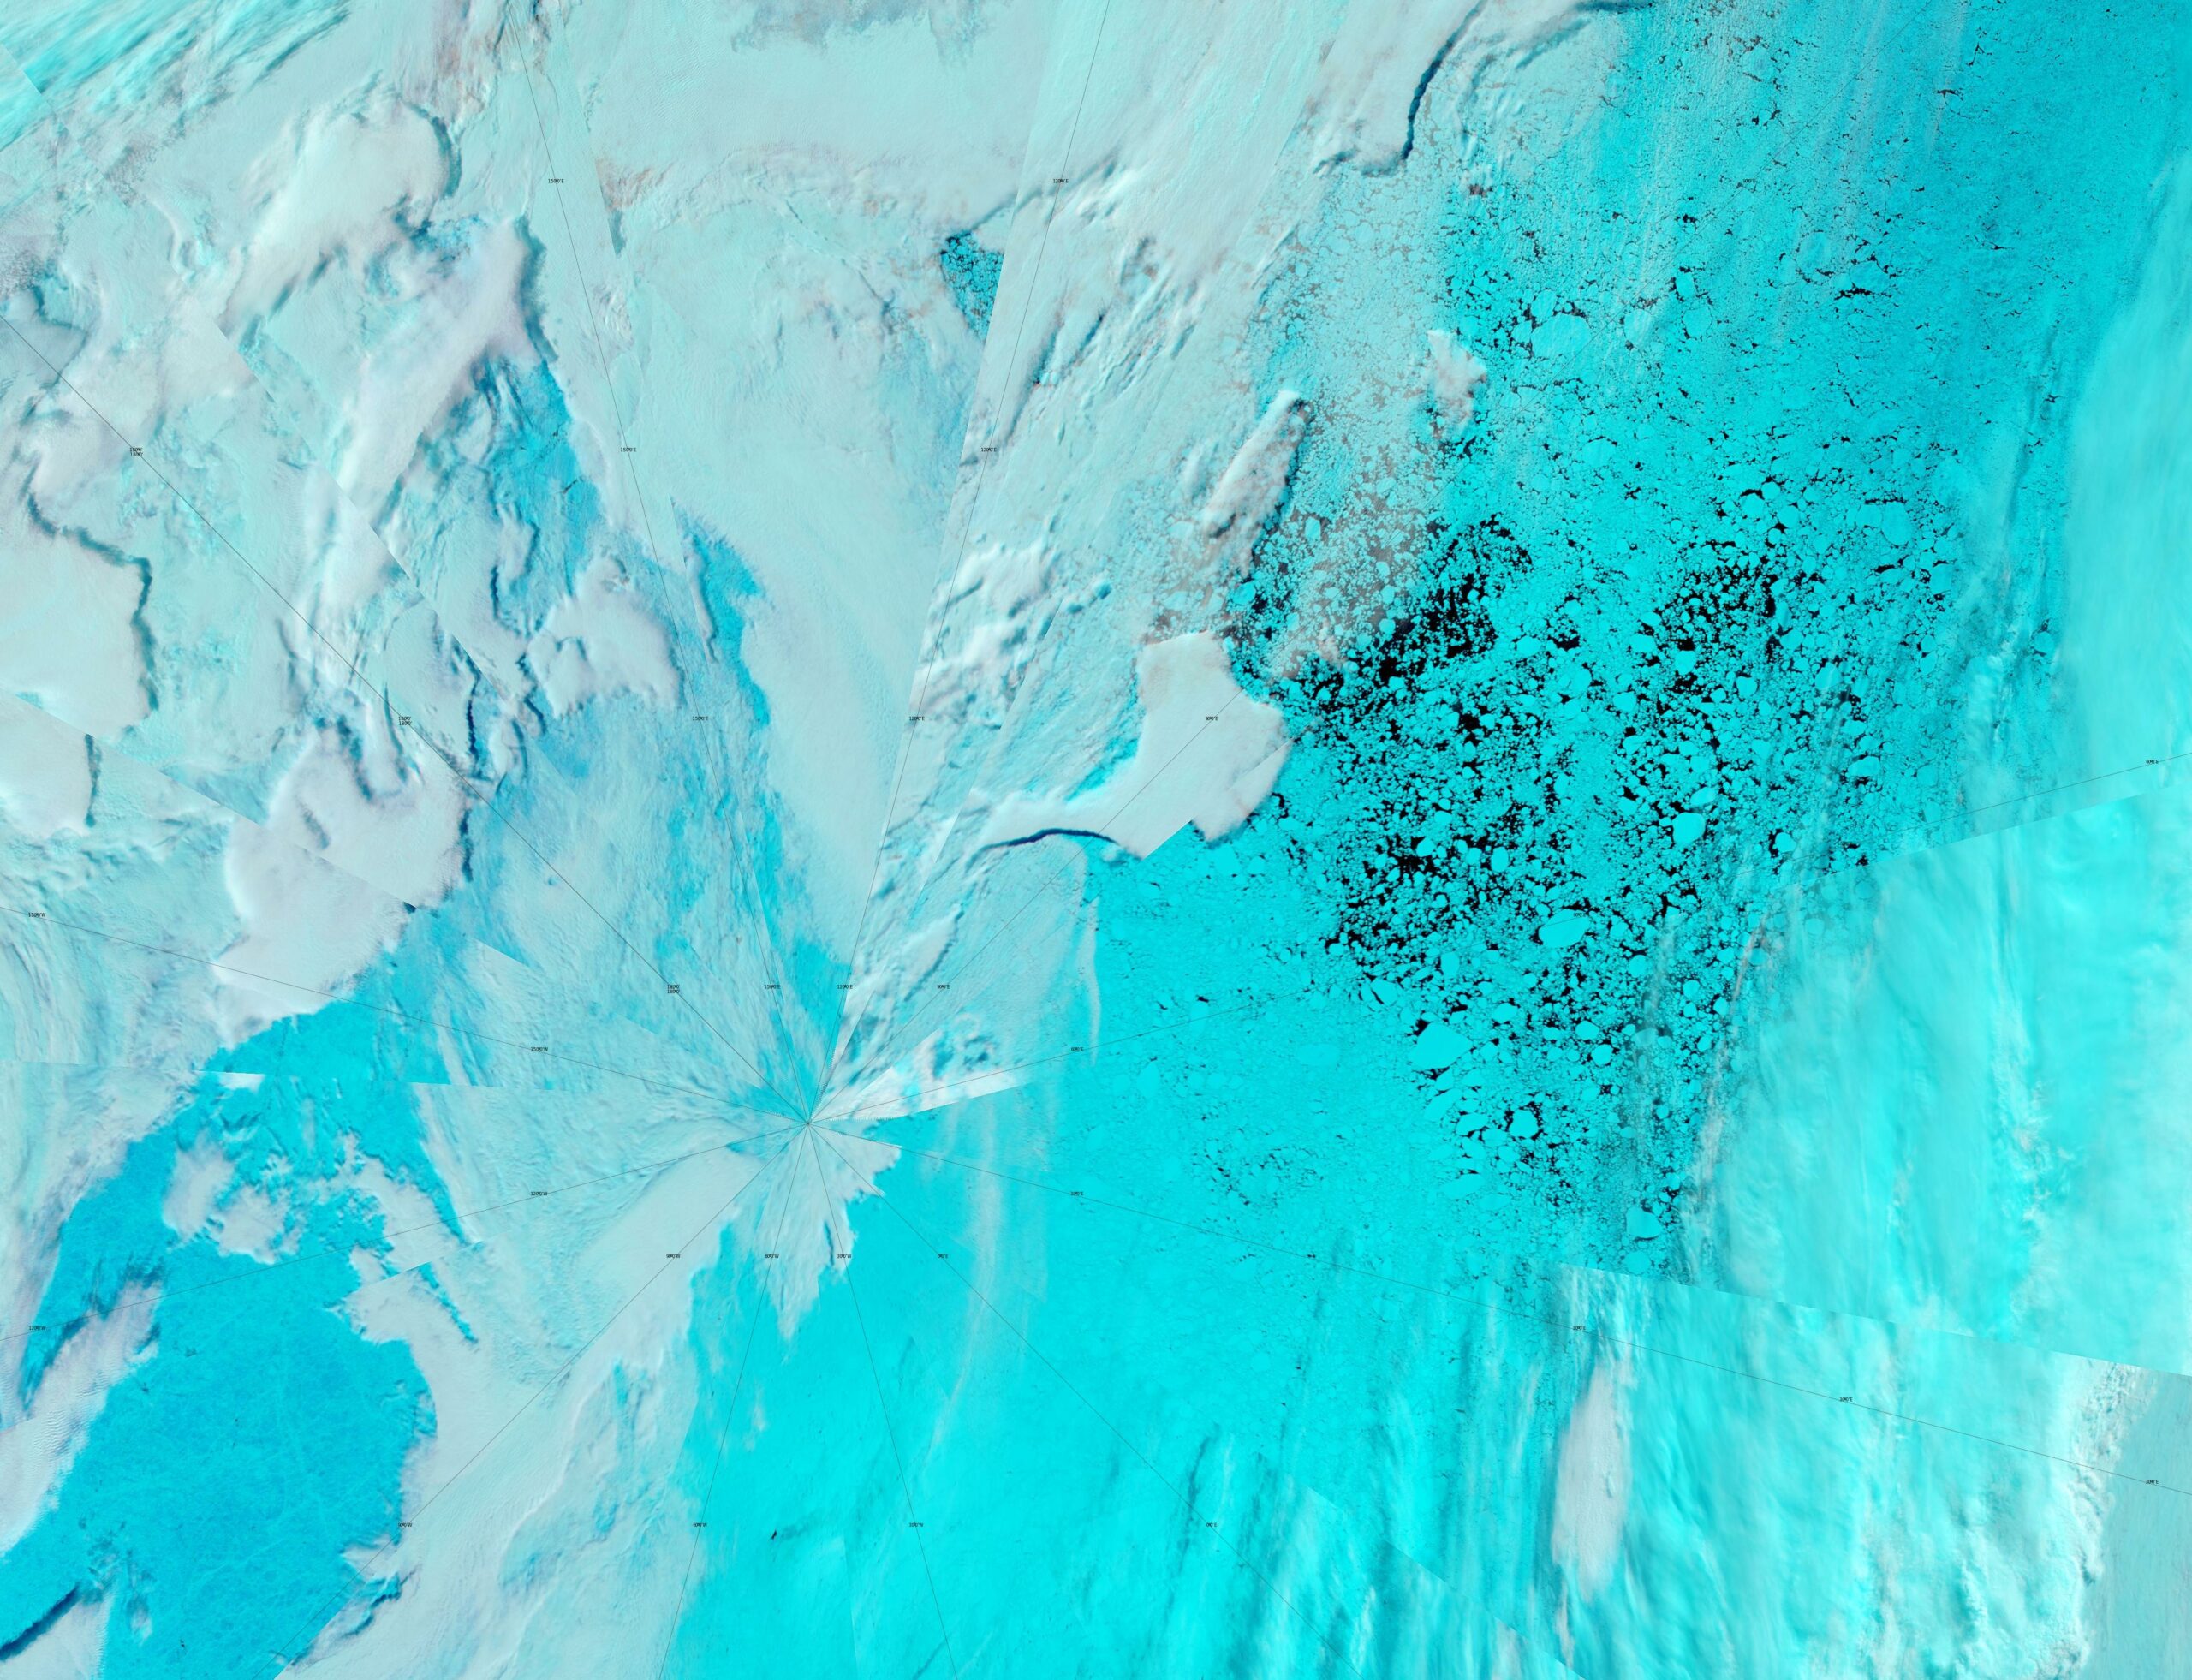
and the same date in 2016:
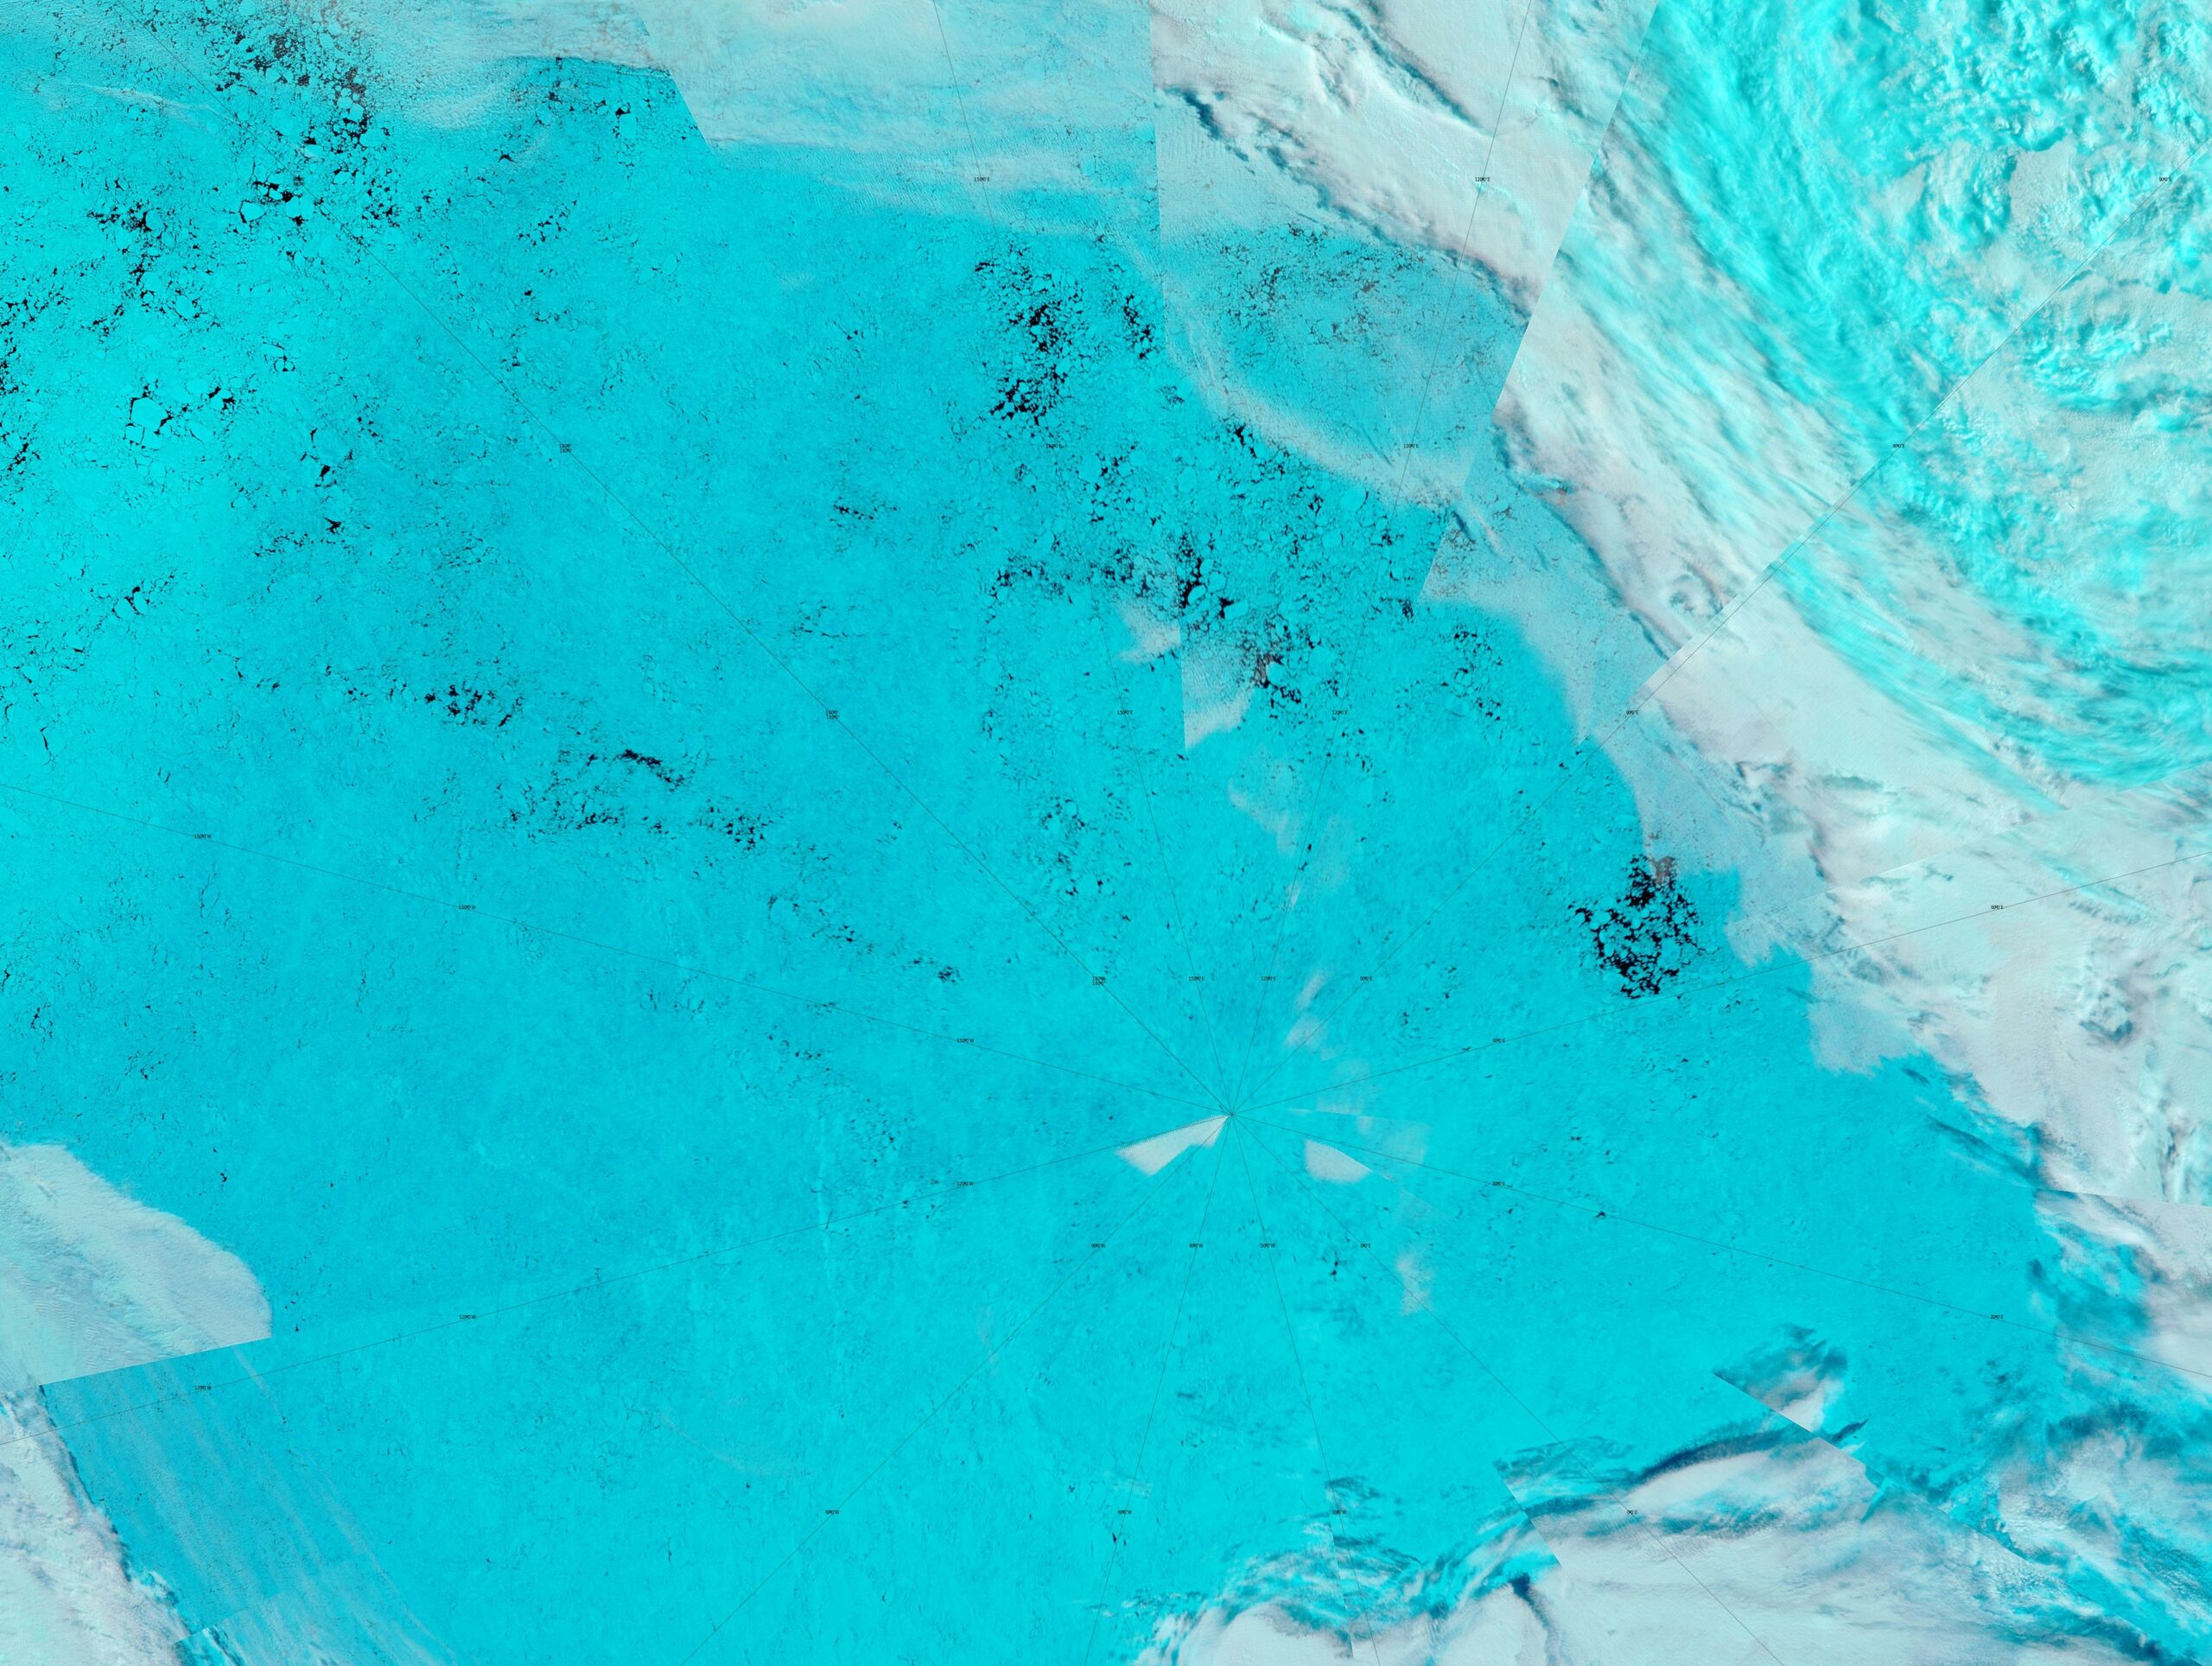
Click the images for a much closer look.
[Edit – July 25th]A fairly clear view of the Lincoln Sea from on high today. Click the image for a much closer look:
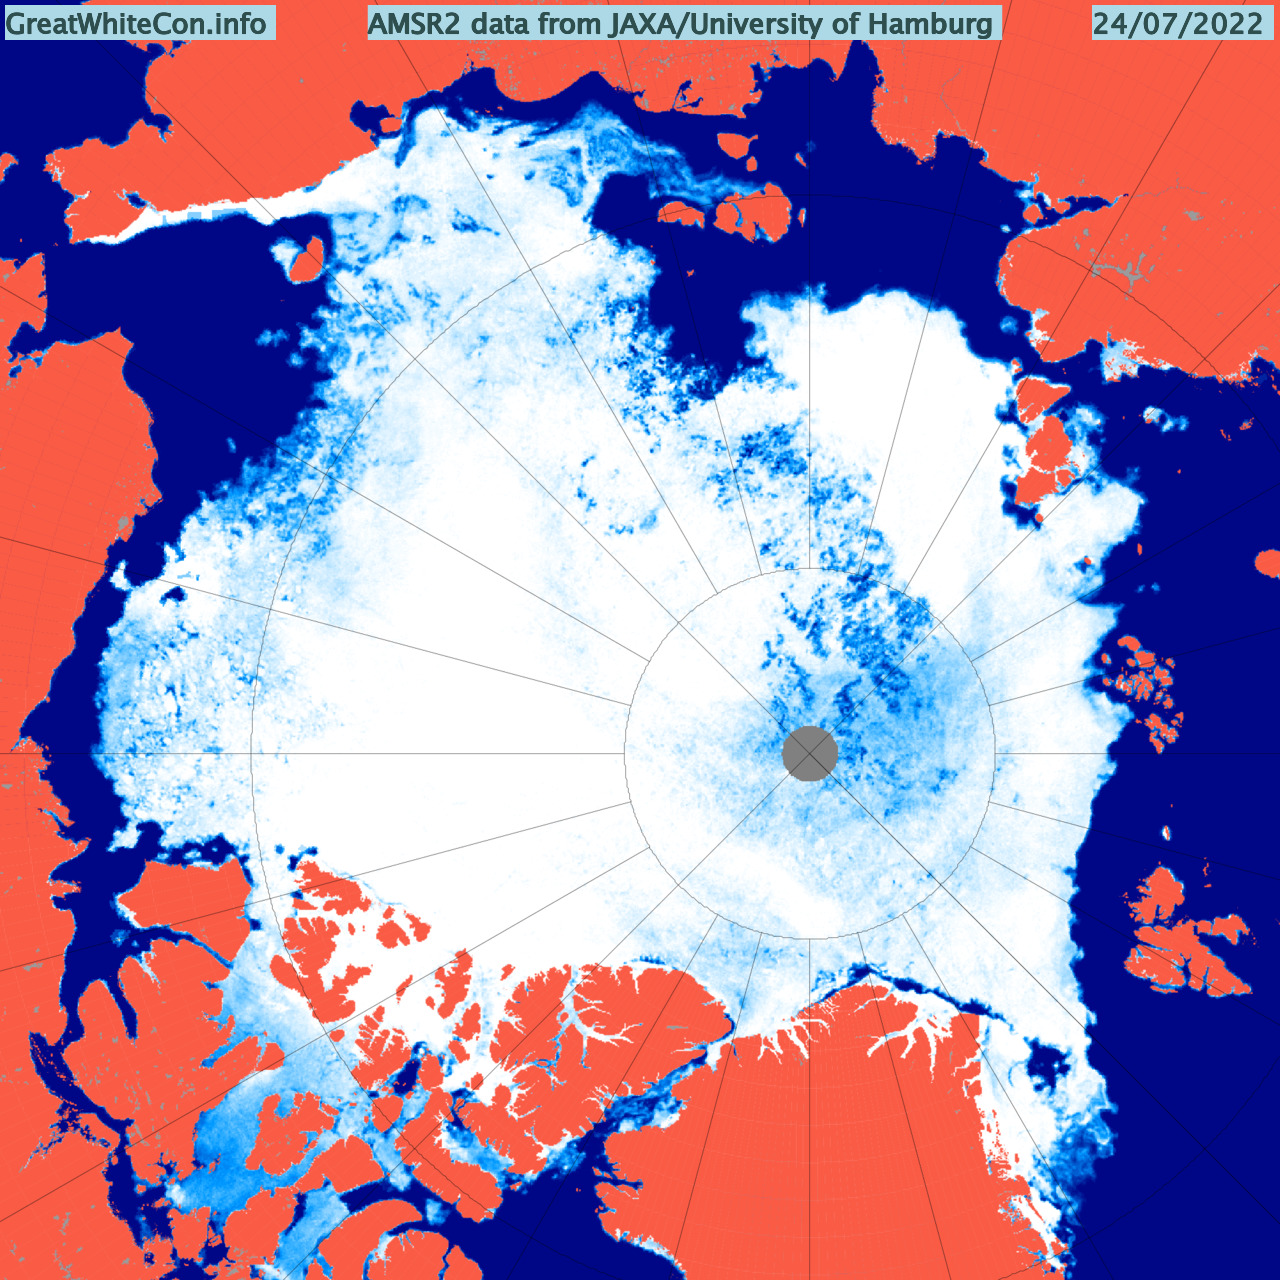
Since the North Pole is hiding below the clouds today here too is AMSR2’s view of the fragmented sea ice between Kap Morris Jesup, the Pole and the Laptev Sea, amongst other things:
The July 2022 Sea Ice Outlook has now been published by the Sea Ice Prediction Network:
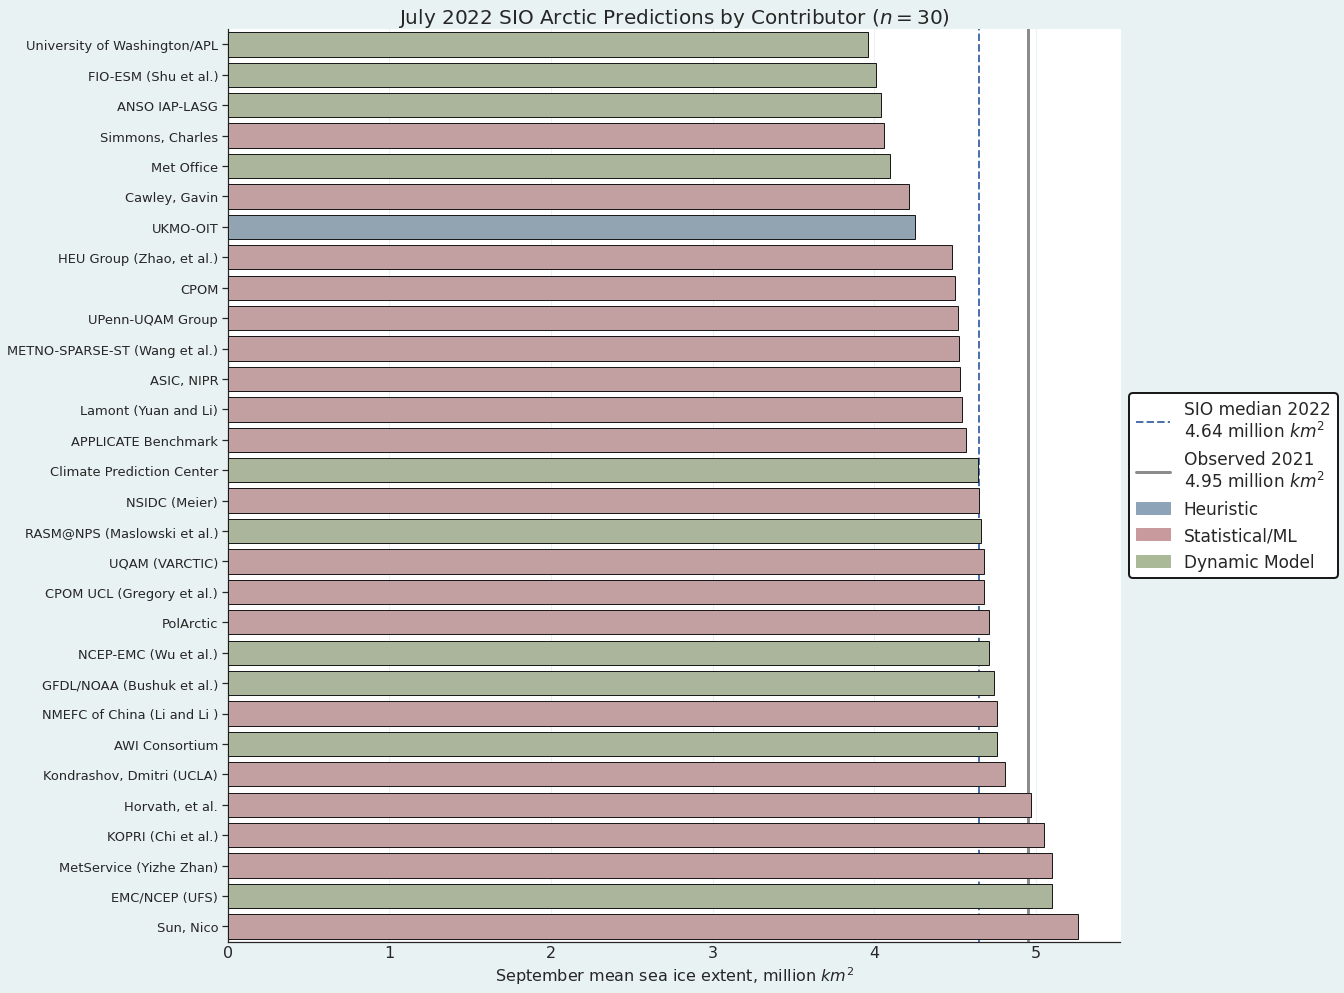
For the Arctic, the median July Outlook for September 2022 median pan-Arctic sea-ice extent is 4.64 million square kilometers, slightly higher than the median cited in the June report of 4.57 million square kilometers. Predictions based on the 19 statistical models have a median of 4.65 million square kilometers, while those from the ten dynamical models have a median of 4.65 million square kilometers. The one prediction from the heuristic approach is 4.25 million square kilometers. Overall, predicted values are similar to those reported in the June 2022 outlook. None of the predictions are for a new record low extent.
Watch this space!
Month sea ice extent for June ended just above 2010’s average.
We await to see what happens in July
Jan.31st. 16th.lowest. +333,064 sq.km. above 2010’s average.
Feb.28th. 11th.lowest +116,764 sq.km. above 2010’s average
Mar.31st. 10th.lowest -127,470 sq.km. below 2010’s average
Apr. 30th.14th.lowest +16,886 sq.km. above 2010’s average
May. 31st. 15th lowest +395,097 sq.km. above 2010’s average
Jun. 30th. 10th.lowest +35,744 sq.km above 2010’s average
Jul. 1st 10th lowest +82,677 sq.km. above 2010’s average
The Chukchi Sea sparkling off Point Barrow:
According to the Canadian Meteorological Center the latest iteration of the long lasting Arctic summer cyclone has bottomed out with a MSLP of 972 hPa at 6:00 UTC this morning:
A picture of Le Commandant Charcot at the North Pole via the Ponant Cruises Twitter feed:
It seems that Le Commandant Charcot was carrying some buoys on behalf of the AWI which have been deployed at the North Pole. Currently the only data available is for a single buoy designed to measure snow depth.
However the deployment report mentions that buoy 2022S116 is part of a:
Month sea ice extent for June ended only just above 2010’s average.
What has caused the slowdown in ice melt rate in July?
Jan.31st. 16th.lowest. +333,064 sq.km. above 2010’s average.
Feb.28th. 11th.lowest +116,764 sq.km. above 2010’s average
Mar.31st. 10th.lowest -127,470 sq.km. below 2010’s average
Apr. 30th.14th.lowest +16,886 sq.km. above 2010’s average
May. 31st. 15th lowest +395,097 sq.km. above 2010’s average
Jun. 30th. 10th.lowest +35,744 sq.km above 2010’s average
Jul. 15th. 12th lowest +344,617 sq.km. above 2010’s average
Several weeks of continuing low pressure over the Arctic Ocean has a lot to do with it:
Currently forecast to change to high pressure in the near future.
As predicted high pressure has now set up over the Central Arctic, with a low pressure area currently producing some rain and snow over the Chukchi Sea:
It’ll be interesting to see what happens to the broken up ice north of the Laptev!
A peek through the fog and clouds this morning:
Jim, do the facts that 2012, 2016 and 2020 being four years apart each mean anything? Take the extra point that 2007 was 5 years before 2012 then surely we have some sort of statistical basis for some type of conclusion, don’t we?
When does the word resonance come into play? (I’m not being facetious, just genuinely interested in when the word “resonance” rears it’s scientific cape.. what is required to use such a spell-bounding word correctly?)
https://forum.arctic-sea-ice.net/index.php?action=dlattach;topic=3721.0;attach=345582;image
I’m just going from my internet wave-sojourning knowledge about Plutinos and the host of other mean-motion resonant TransNeptunianObjects (TNO’s for short)… obviously #8^{o><
The though did occur to me, but of course 2019 had a very strong melt, almost matching 2012 for volume!
Of course the Arctic sea ice does seem to follow a pattern of, say, a couple of bad years, followed by a couple of “recovery years” I think..
Maybe we only need a bit of bad luck, say a third or fourth bad year in a row to finish it off!!!
Tom, Re the ‘good years, bad years’ alternation on Arctic sea ice:
There is speculation in some circles that a melt year exposes more surface water that allows more heat to radiate into space (given the sharp contrast between air temps and water temps). This heat loss, which can be huge, then sets up a subsequent time when cold ocean temps aid in new ice growth. That would represent an opposing set of feedbacks that, along with other variables, could cause a lot of variability. I’m not aware of papers on this kind of cycle (Jim may know if there are any) but there have been plenty of them on how open water accelerates melt and the ‘Arctic Death Spiral’. It’s just that there hasn’t been much downward spiral in the last 10 years, so maybe the notion of open water heat loss in winter (vs. heat gain in summer) may have some merit.
However a fly in that particular ointment may be the fact that 2020 (highlighted and 2nd lowest) followed hard on the heels of 2019 (3rd lowest)?
2010-2012 had a very strong melt, 2010 lost as much volume as 2012 I believe. Of course 13-14 the ice recovered until mid 2015. 2016 was a very bad year.
2017 dodged the proverbial cannon ball and 2018.
Of course then 2019-20 were very warm in the Arctic.
A lot of cloudy weather helped the ice in 2021, though the volume finished lower than its extent would imply.
Maybe there’s some kind of feedback factor at play, though I wouldn’t like to depend on it going on forever!
Some pictures of 50 Let Pobedy at the North Pole on July 12th:
The Russian nuclear powered icebreaker is heading for the Pole again at this very moment.
Month end sea ice extent for July looks like it will be above 2010’s average.
Since August last year it has only been below the 2010’s average once at the end of March!
Jan.31st. 16th.lowest. +333,064 sq.km. above 2010’s average.
Feb.28th. 11th.lowest +116,764 sq.km. above 2010’s average
Mar.31st. 10th.lowest -127,470 sq.km. below 2010’s average
Apr. 30th.14th.lowest +16,886 sq.km. above 2010’s average
May. 31st. 15th lowest +395,097 sq.km. above 2010’s average
Jun. 30th. 10th.lowest +35,744 sq.km above 2010’s average
Jul. 23rd. 11th lowest +222,533 sq.km. above 2010’s average
Meanwhile, the latest July report is out for Sea Ice Prediction Network.
The median July Outlook for September 2022 median pan-Arctic sea-ice extent is 4.64 million square kilometers,
[Moved to the appropriate thread – Mod]
I know that Neil. See above!
It would be helpful if in future you could post your comments under the most appropriate post rather than simply the most recent.
Month end sea ice extent for July looks like it will be above 2010’s average.
Since August last year it has only been below the 2010’s average once at the end of March!
Jan.31st. 16th.lowest. +333,064 sq.km. above 2010’s average.
Feb.28th. 11th.lowest +116,764 sq.km. above 2010’s average
Mar.31st. 10th.lowest -127,470 sq.km. below 2010’s average
Apr. 30th.14th.lowest +16,886 sq.km. above 2010’s average
May. 31st. 15th lowest +395,097 sq.km. above 2010’s average
Jun. 30th. 10th.lowest +35,744 sq.km above 2010’s average
Jul. 30th. 11th lowest +228,905 sq.km. above 2010’s average
[Moved to the appropriate thread – Mod]
I wouldn’t like to try predicting when we’ll see a Blue Ocean Event, a lot depends how much heat is pulled into the Arctic by local wind patterns, where and when a storm might strike. It could take a few decades from now, it could happen by 2029!
2016 could have come very close if the refreeze had started a week late rather than a week earlier than average. Possibly 2020 if that heat wave in Siberia had hit, say the north of Canada where the ice was thick, rather than the Laptev where it was already thin.
4.64million km seems about right giving the relatively slow melt this year, of course 228 k above average still only amounts to two days melt in mid July!
[This one could fit in either place, but I’ve moved it to the thread that now mentions 4.64! – Mod]
The lingering ice in the ESS will be suffering a blast of heat over the next few days:
That might speed things up a bit?