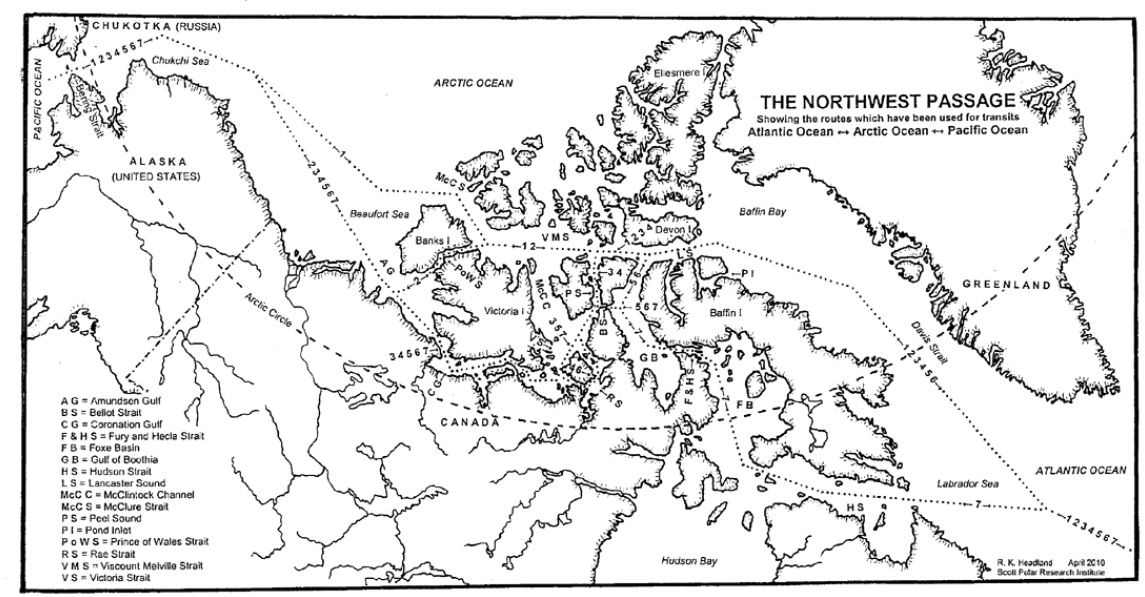
For those of you unfamiliar with the names of the assorted islands and channels of the Canadian Arctic Archipelago here is a map that hopefully helps:
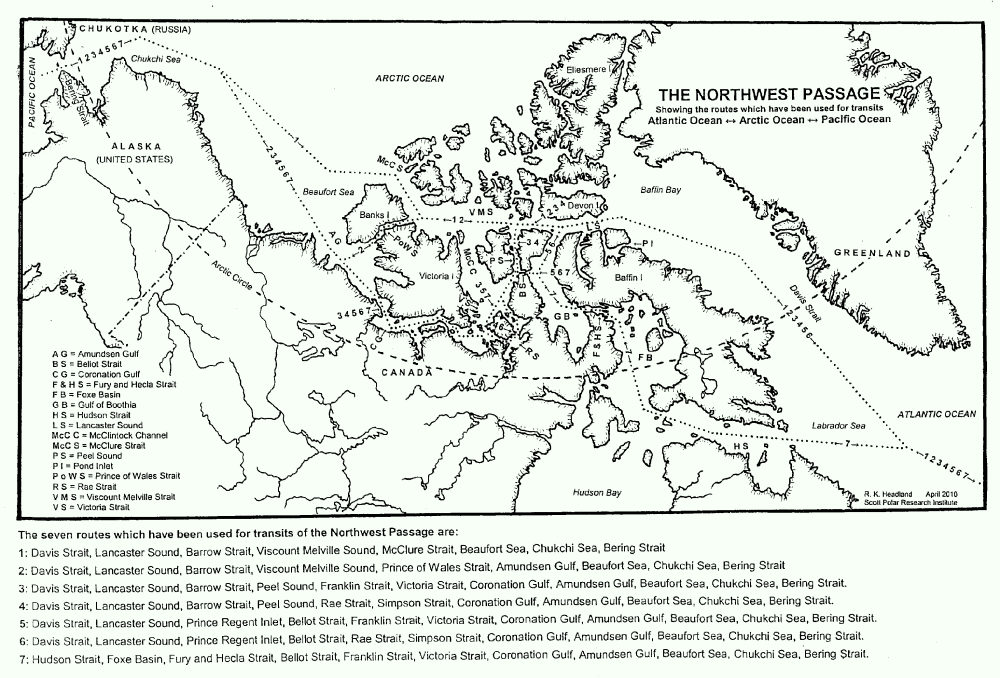
Plus another map detailing the routes through the Canadian Arctic Archipelago that have previously been successfully navigated by vessels large and small:
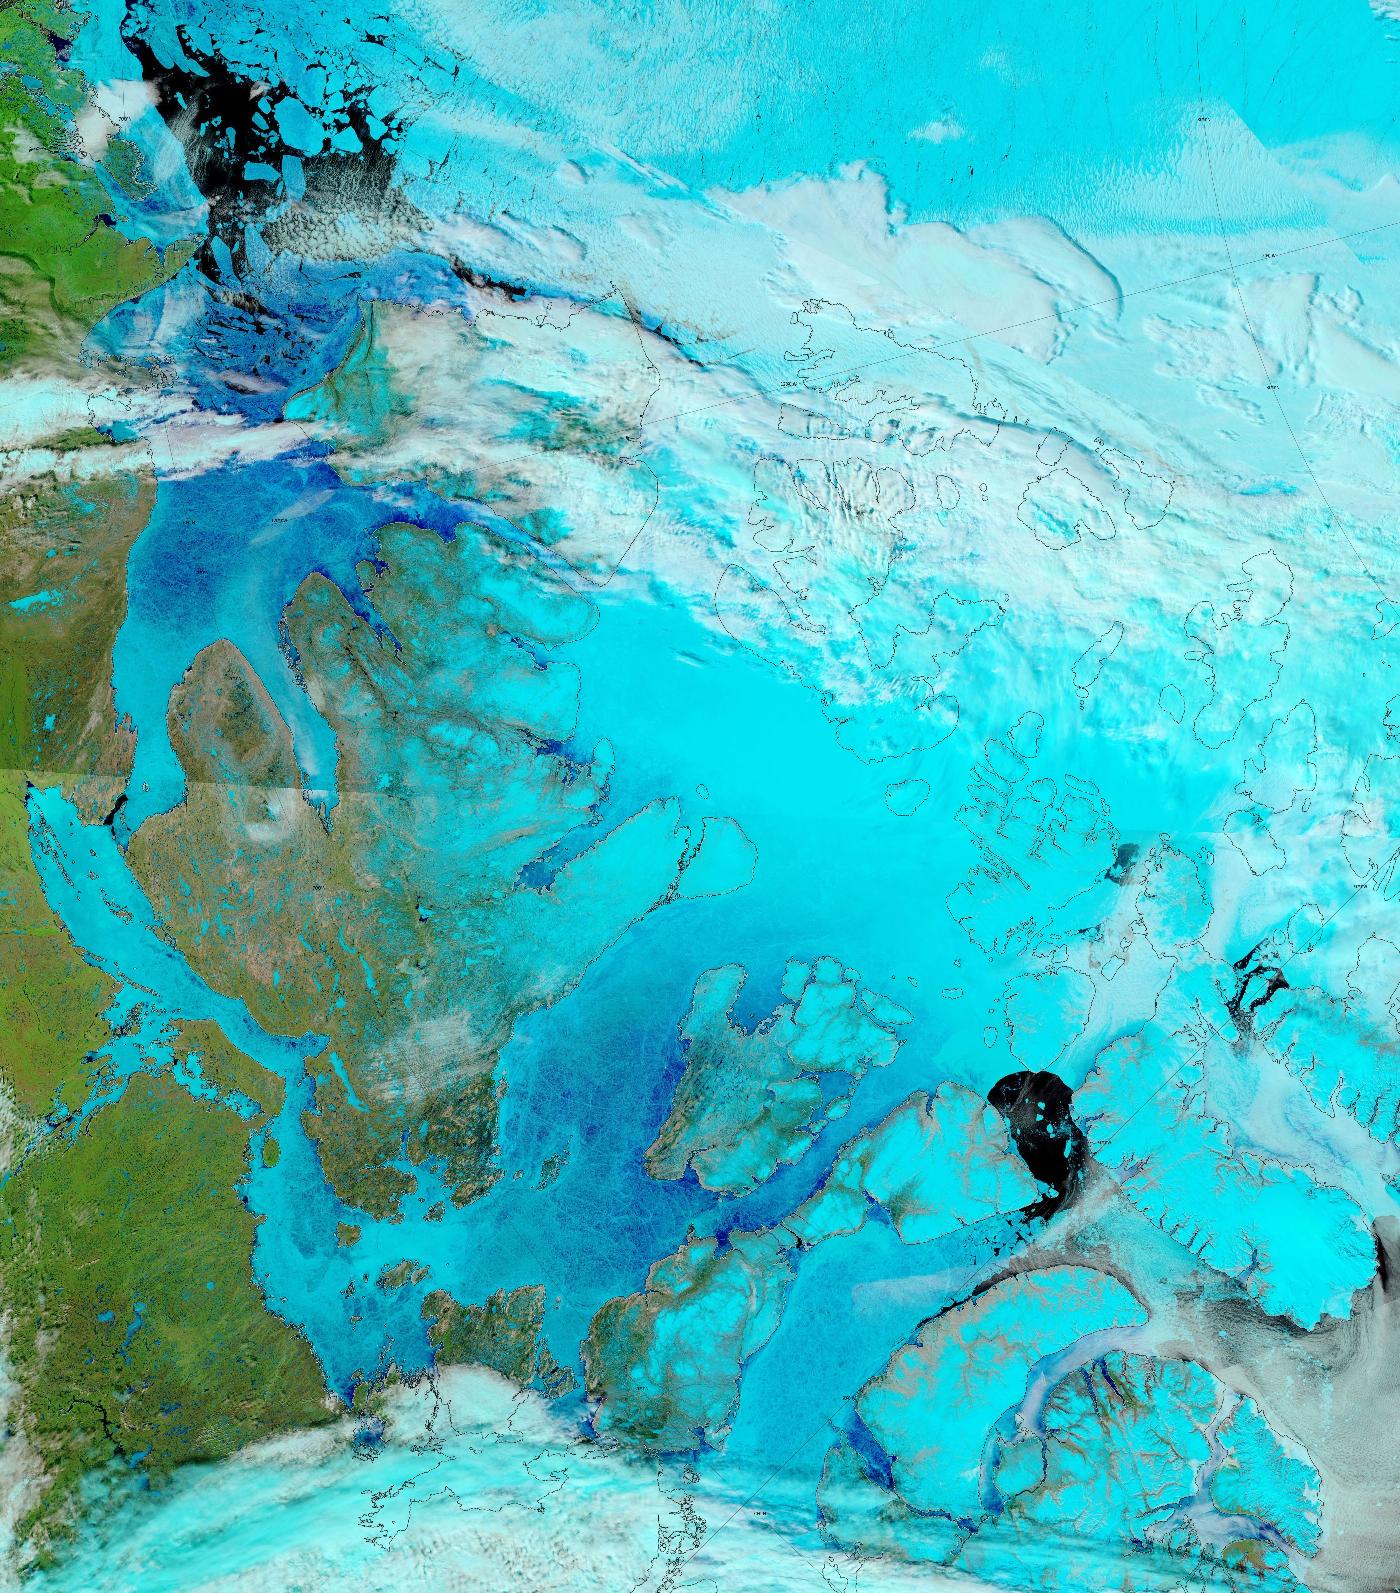
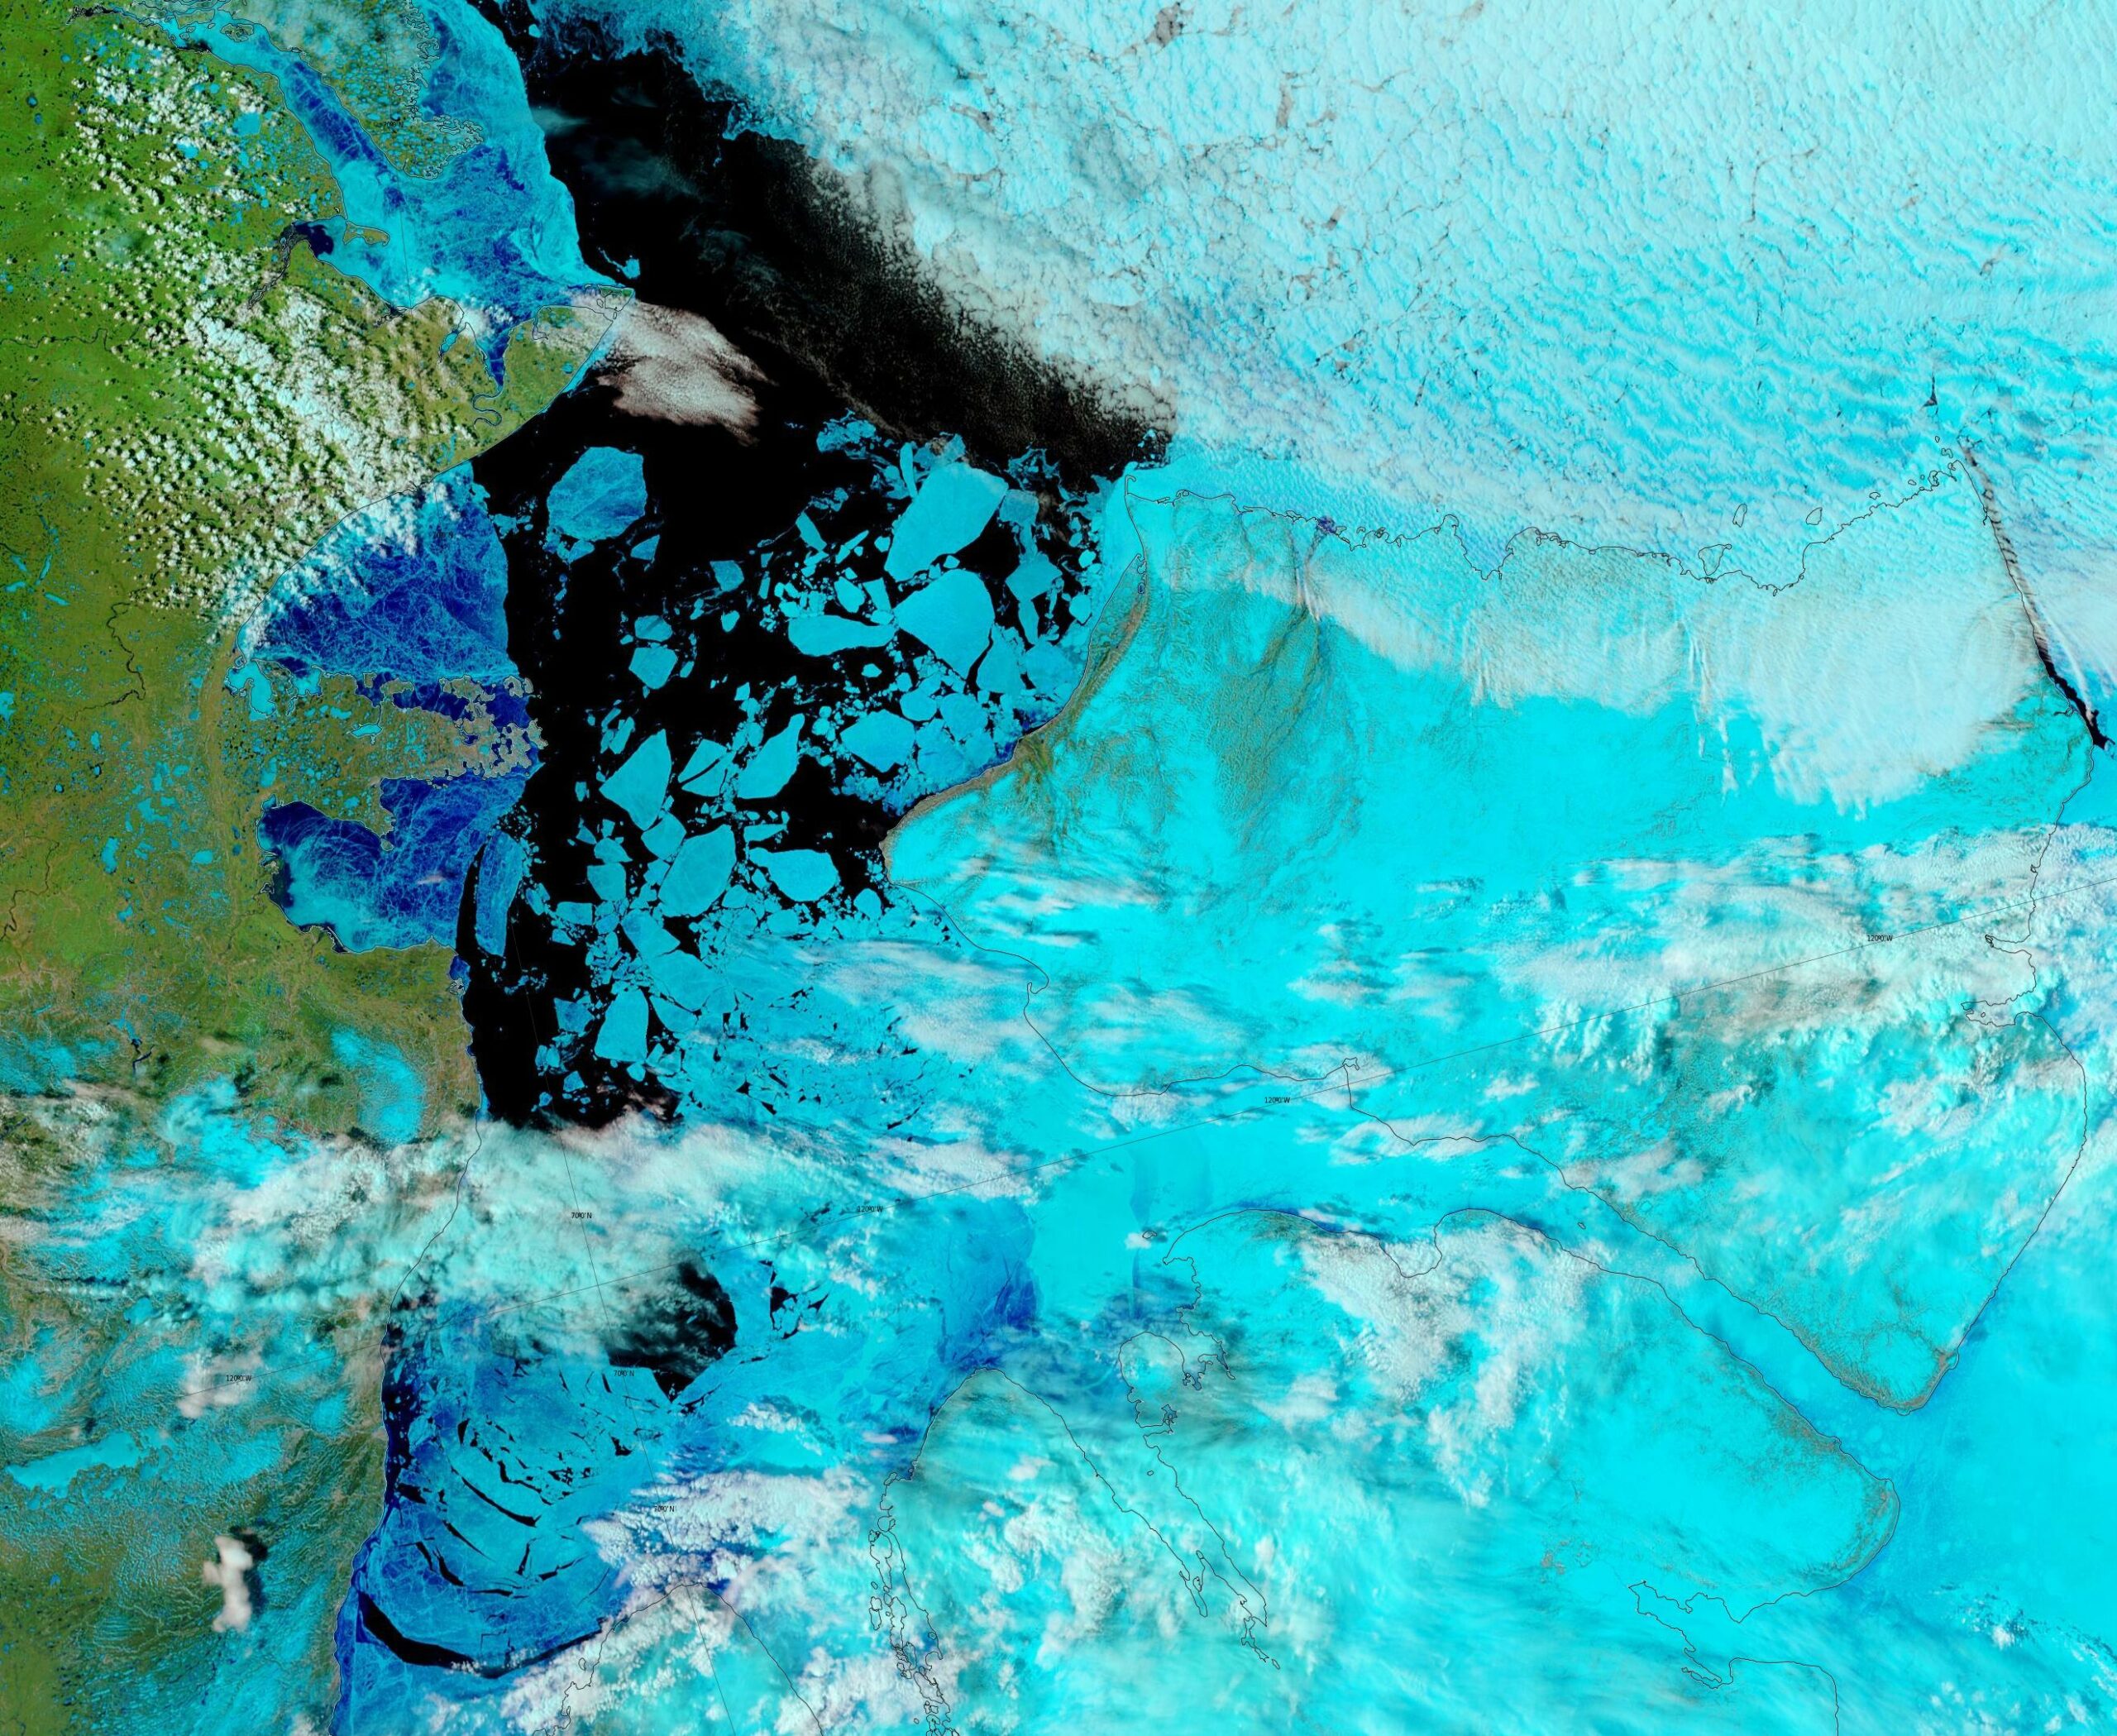
The sea ice in Lancaster Sound and the Amundsen Gulf is breaking up, and melt ponds are now visible on the fast ice across much of the southern route through the Canadian Arctic Archipelago:
“False colour” image of the Canadian Arctic Archipelago on June 17th from the MODIS instrument on the Terra satellite
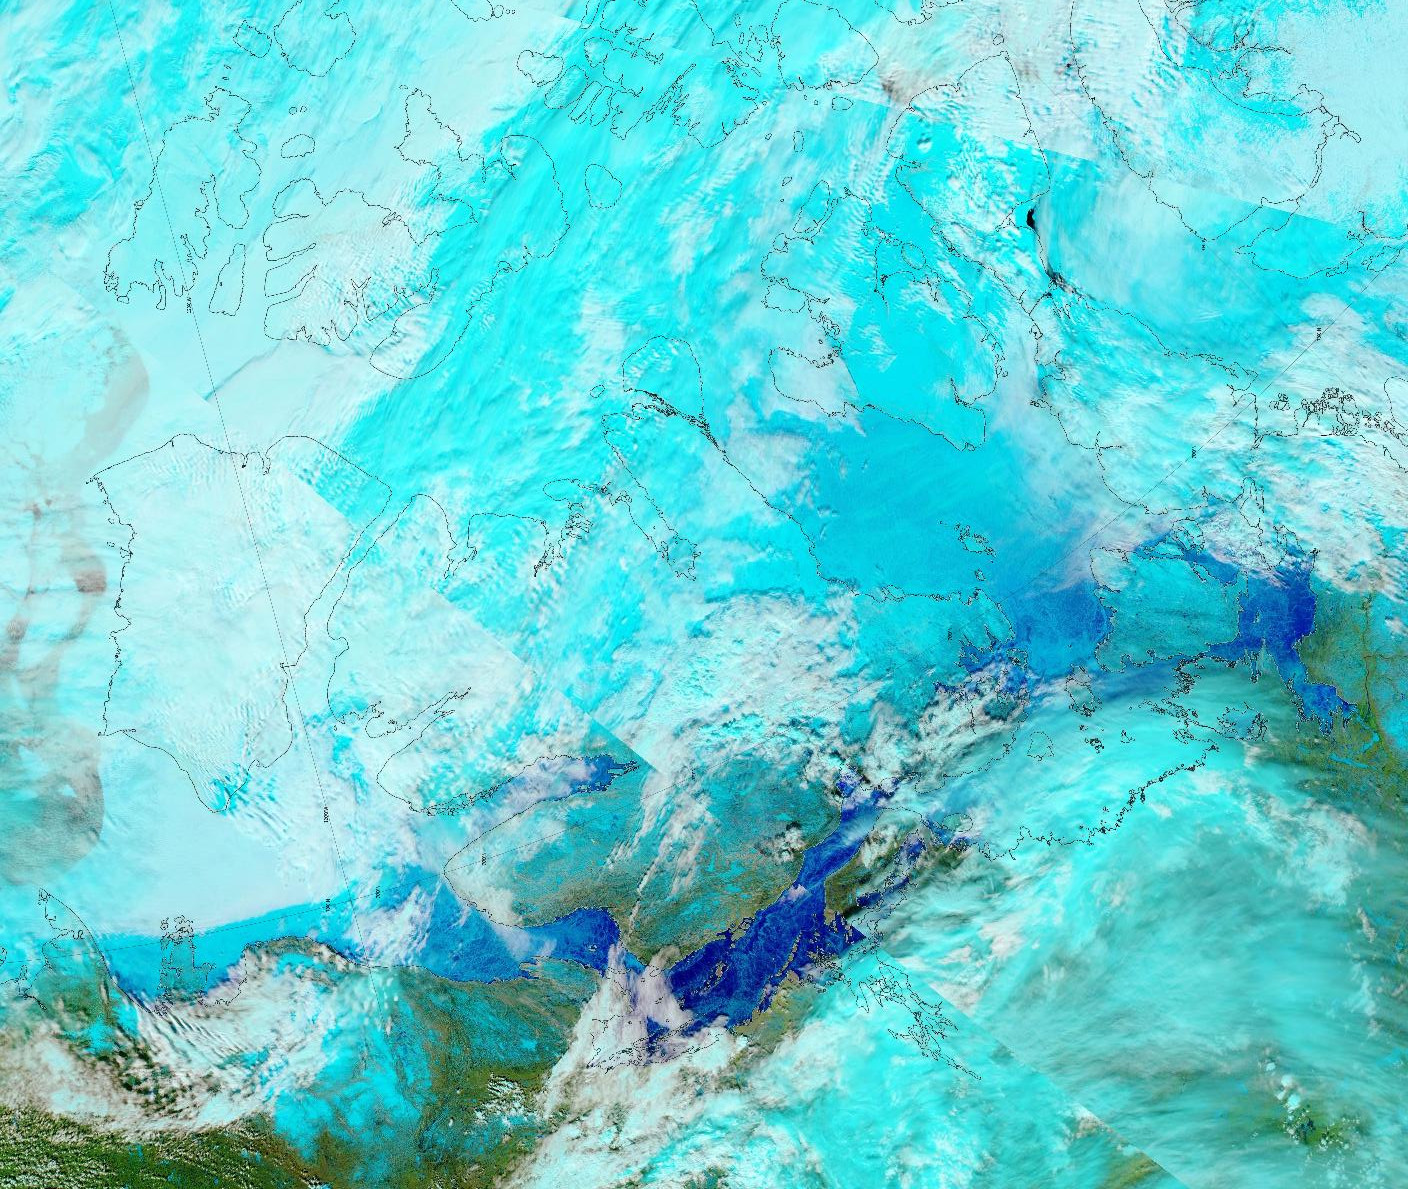
The melt ponds previously visible in the Coronation Gulf now appear to have drained:
“False colour” image of the Canadian Arctic Archipelago on June 3rd from the MODIS instrument on the Aqua satellite
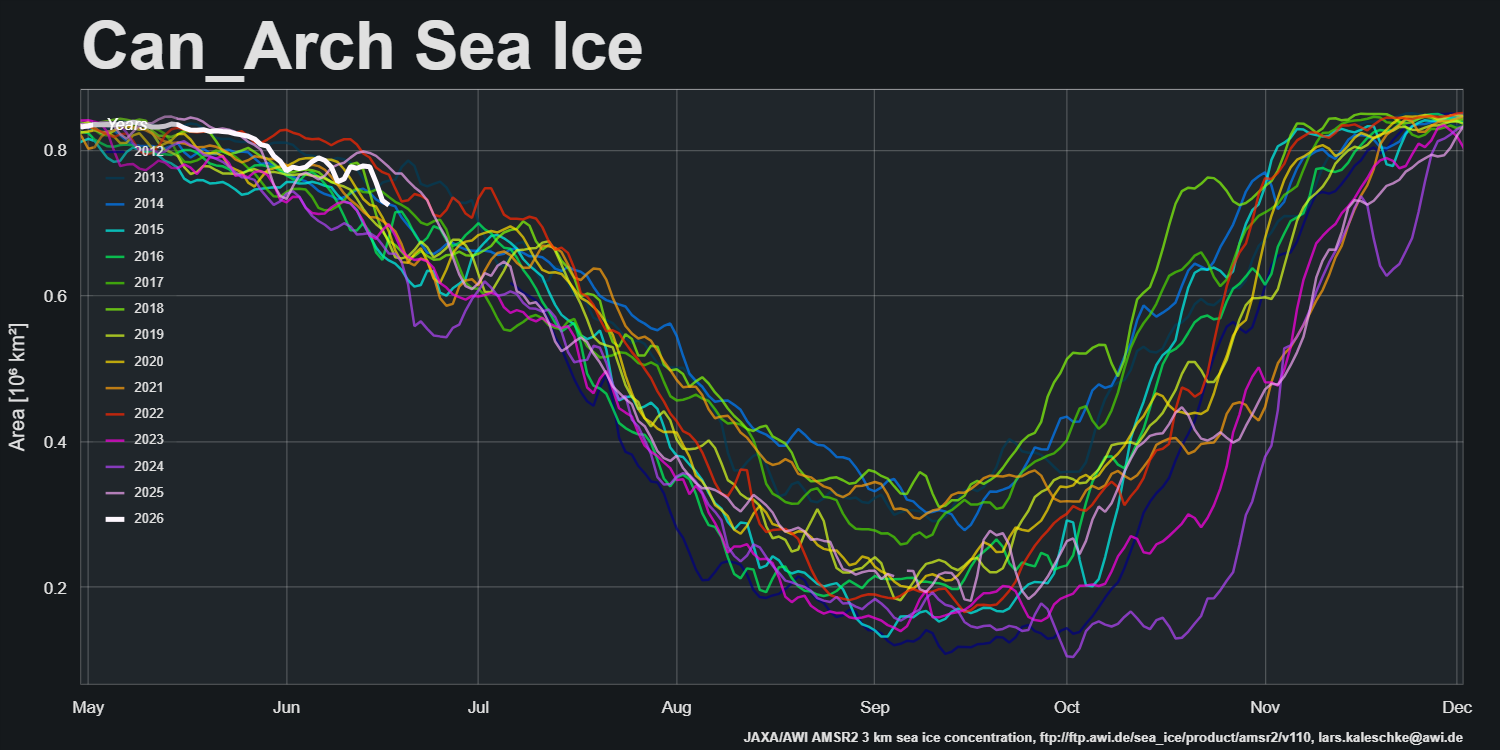
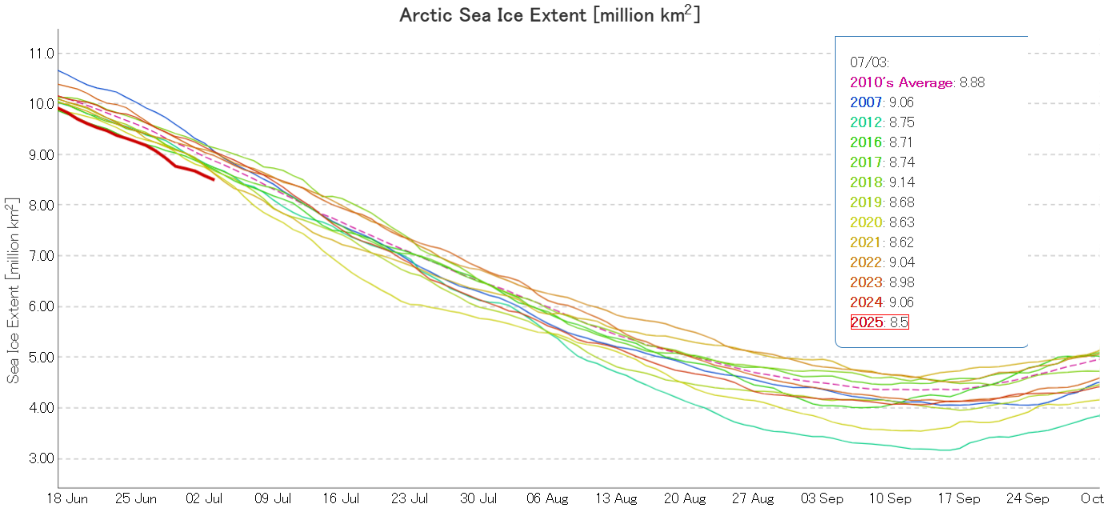
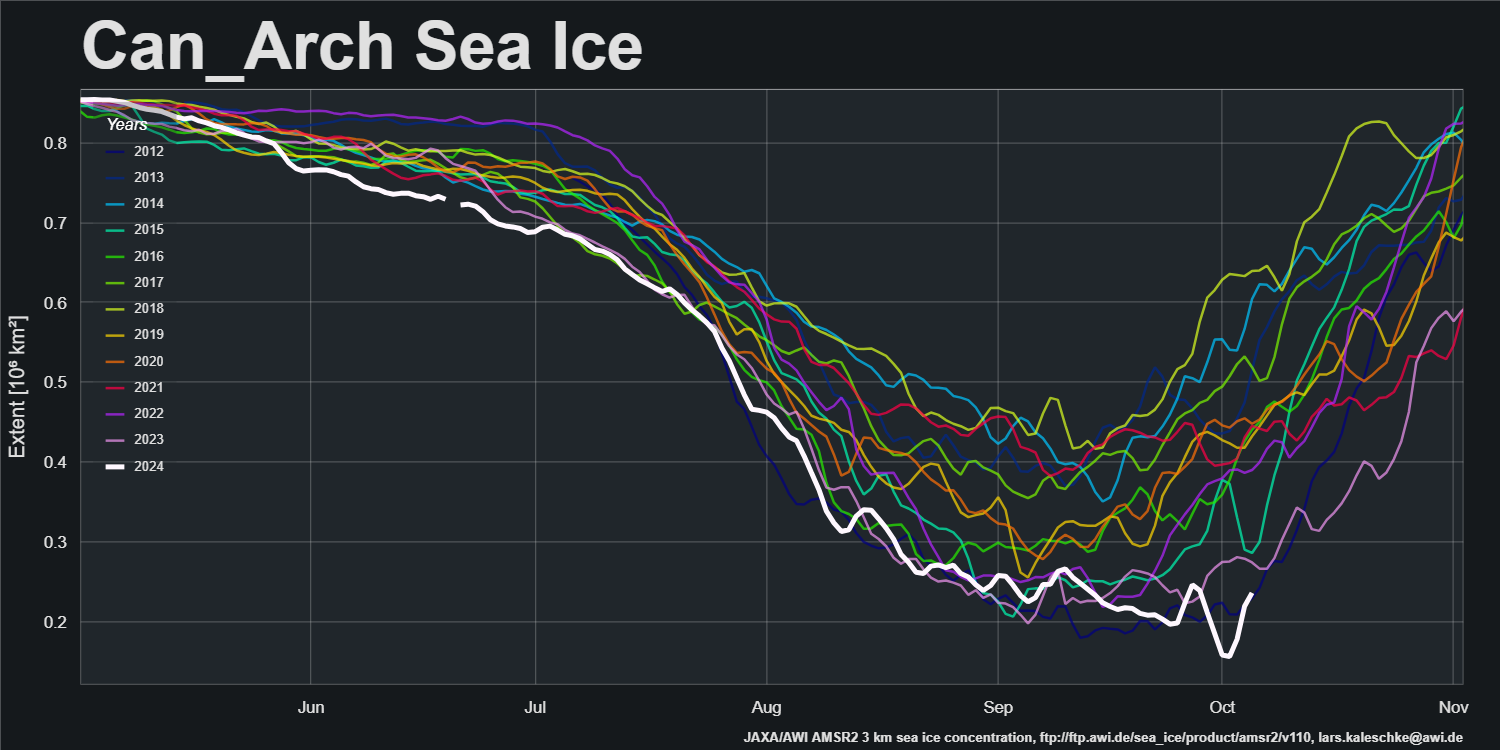
Looking at 2 dimensional data to begin with, CAA sea ice area is currently in the middle of the AMSR2 era pack:
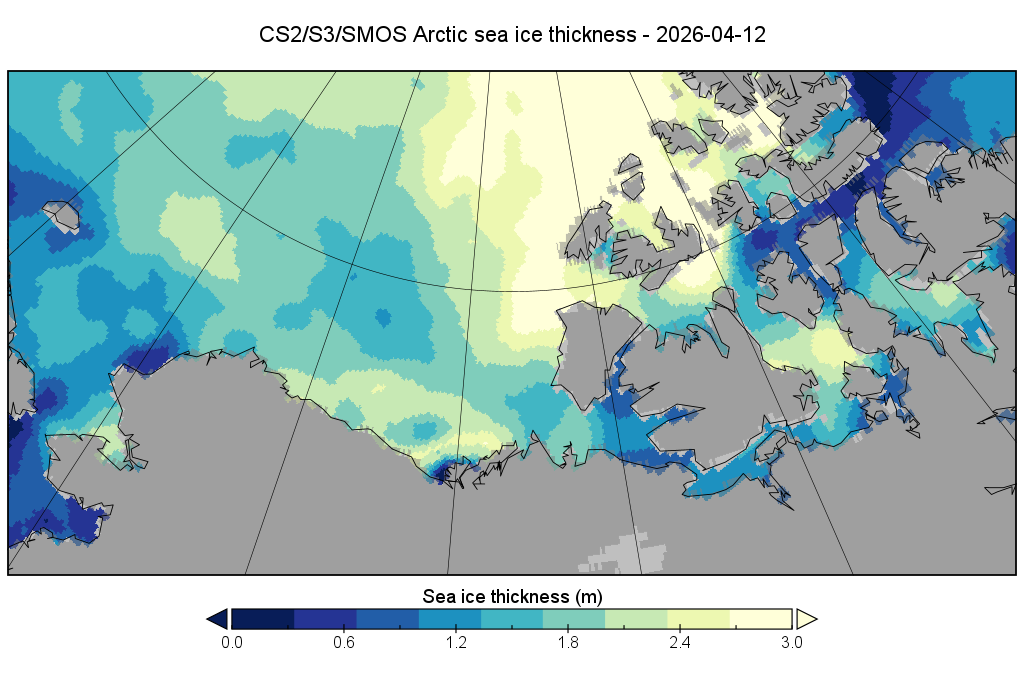
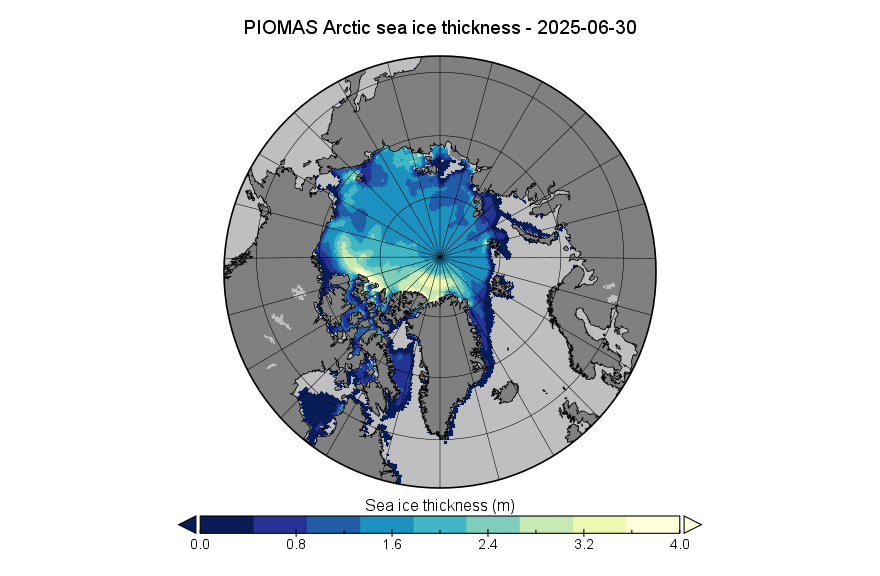
To get a better feel for what might happen during the coming summer season here too is the state of play in the third dimension, courtesy of the Alfred Wegener Institute’s last combined thickness data of the winter from the Cryosat-2, Sentinel 3 and SMOS satellites:
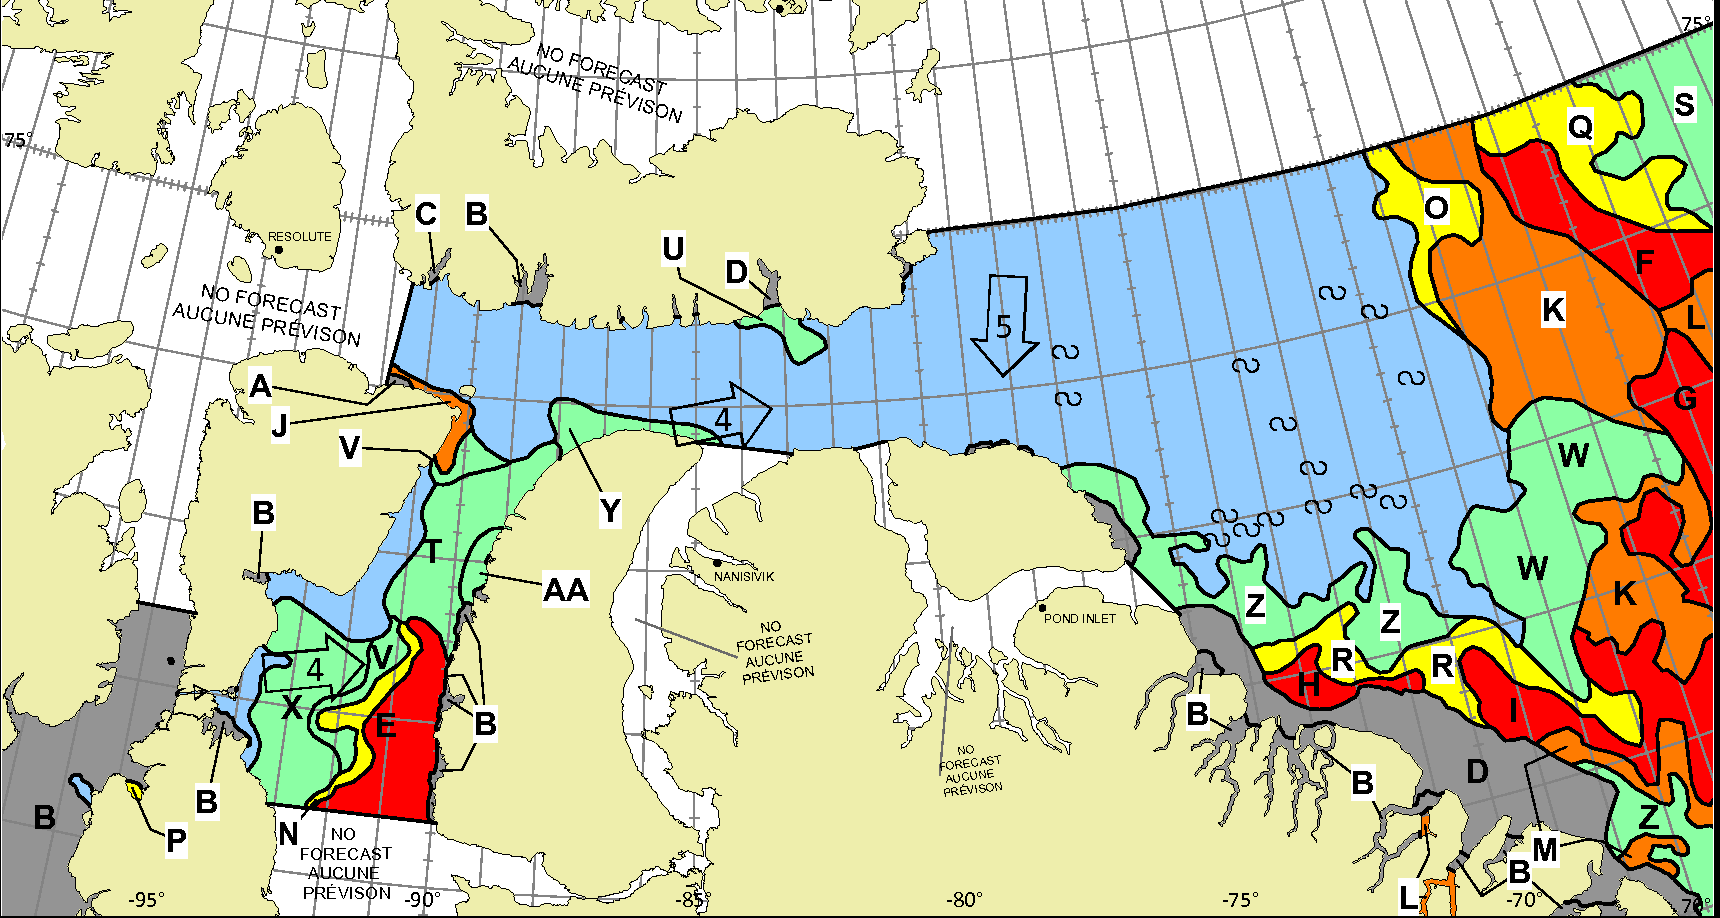
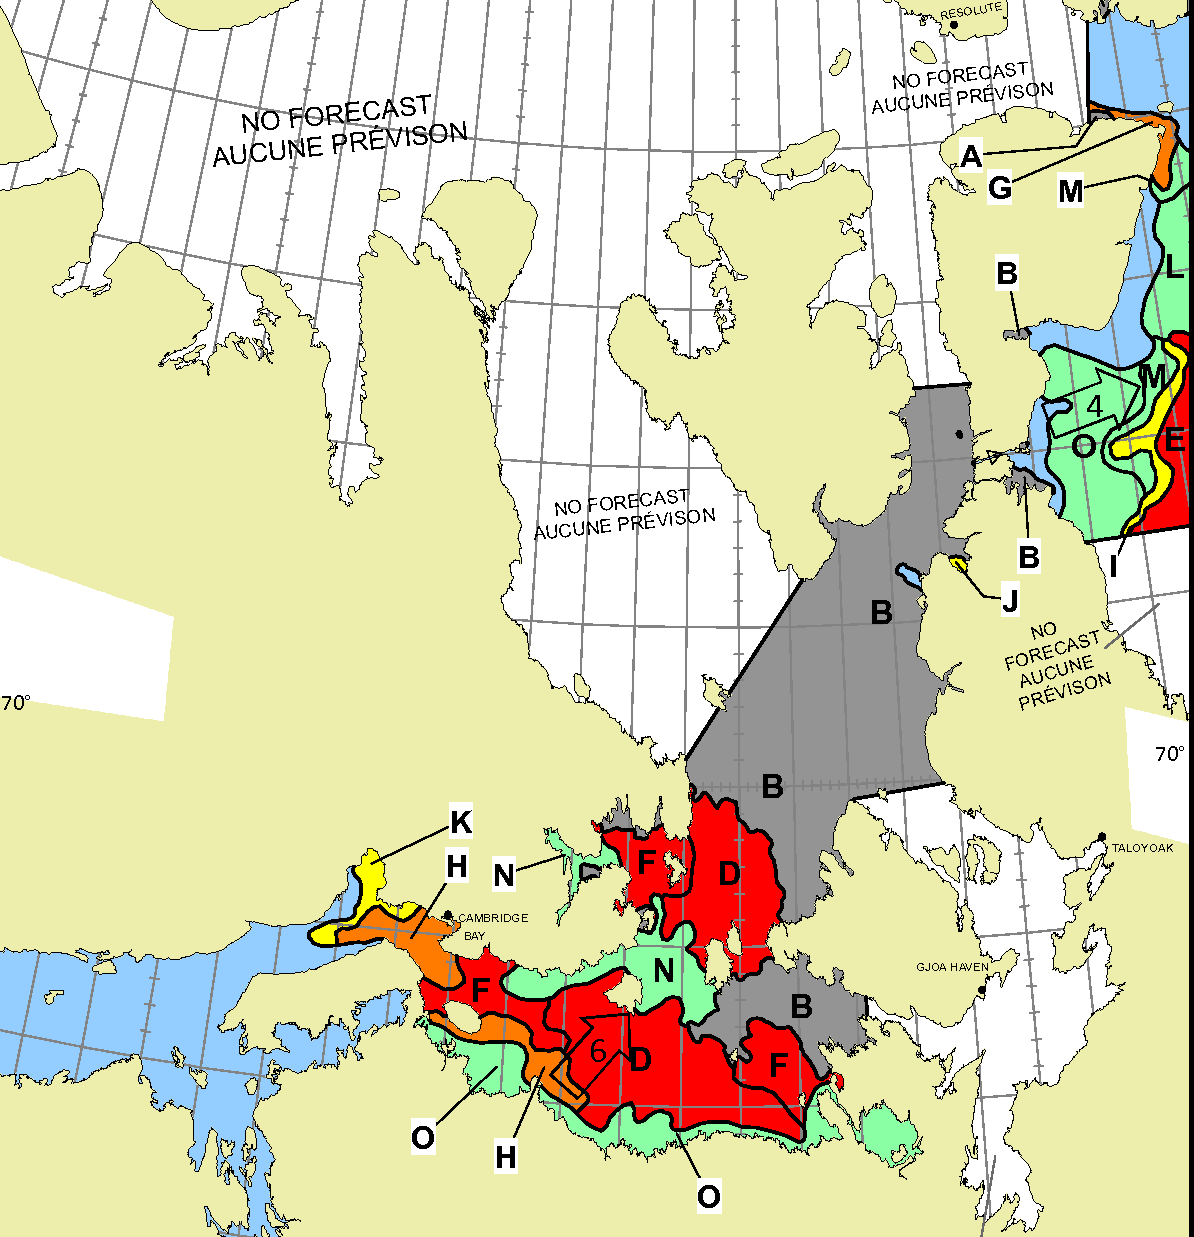
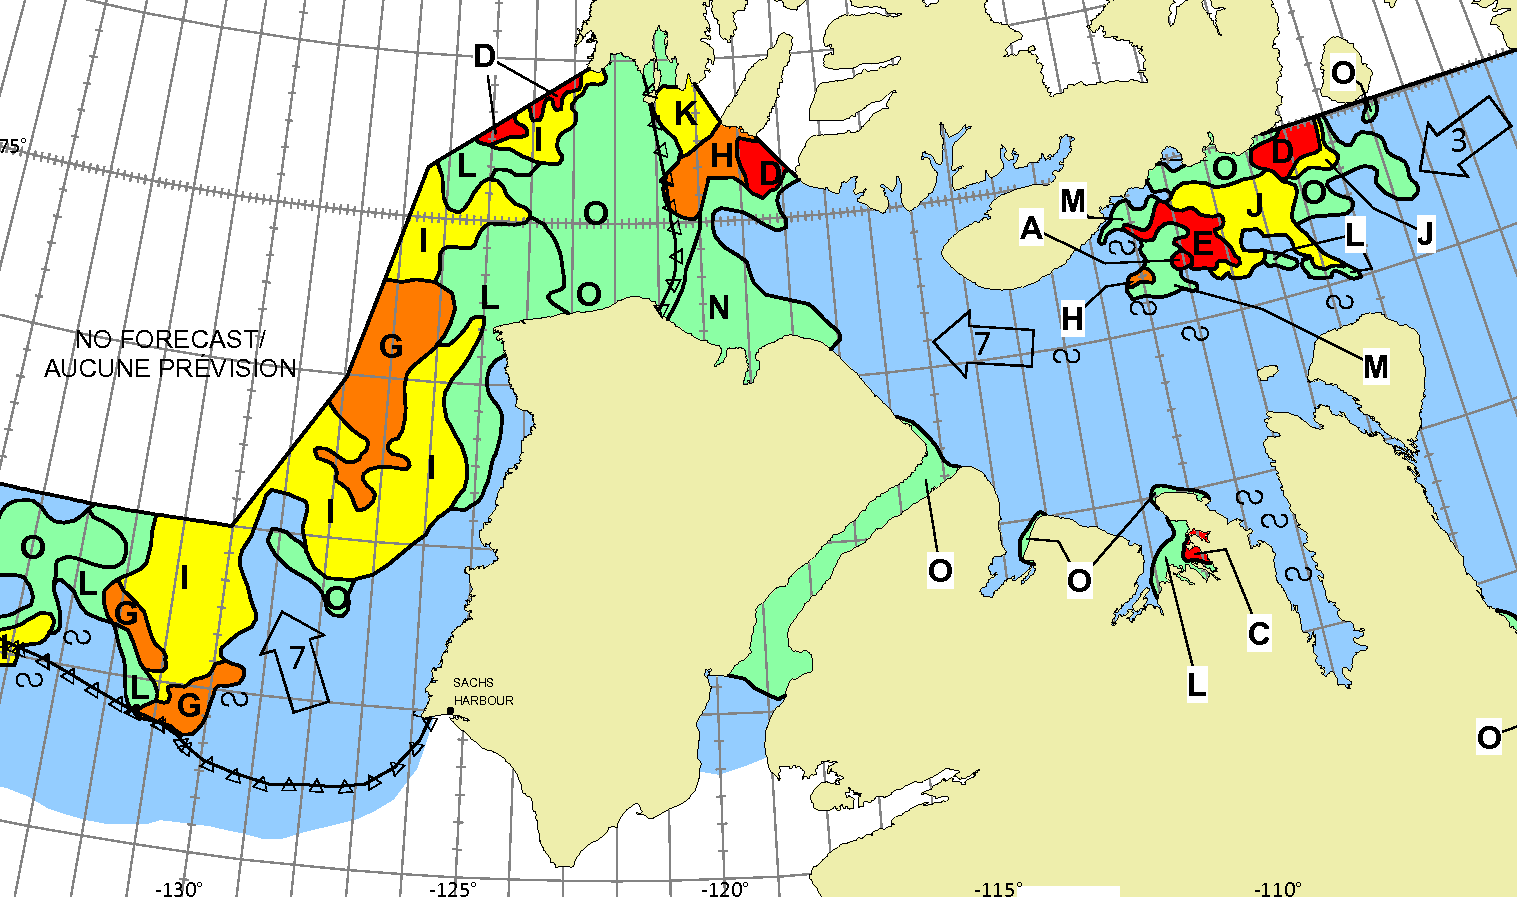
Let’s also take a look at the Canadian Ice Service‘s sea ice “stage of development” charts. Here’s the most recent one for the “Western Arctic”, from June 15th:
There is no old ice anywhere on the southern route, so the stage seems set for the Northwest Passage to open relatively early this summer, with a final “choke point” in the Larsen Sound/Franklin Strait region.
Note that there is a potential fly in the NWP ointment, a recurrence of last year’s winds that blew old ice in the Beaufort Sea close to shore in the Amundsen Gulf during the first half of August!
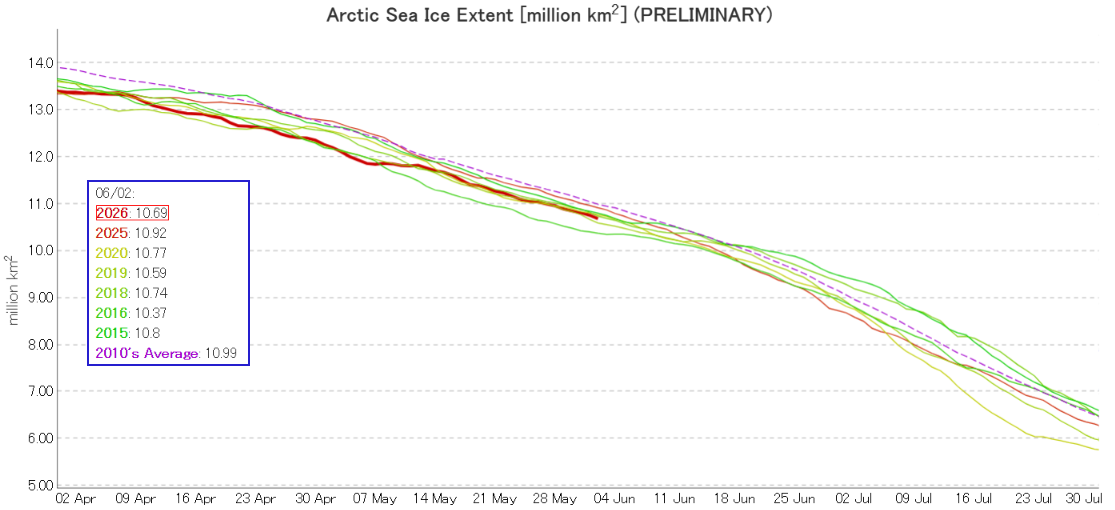
The JAXA/ViSHOP web site is currently undergoing maintenance, but here is how their 2 day average extent graph looked for June 2nd:
Extent was 3rd lowest in the JAXA record, behind 2016 and 2019.
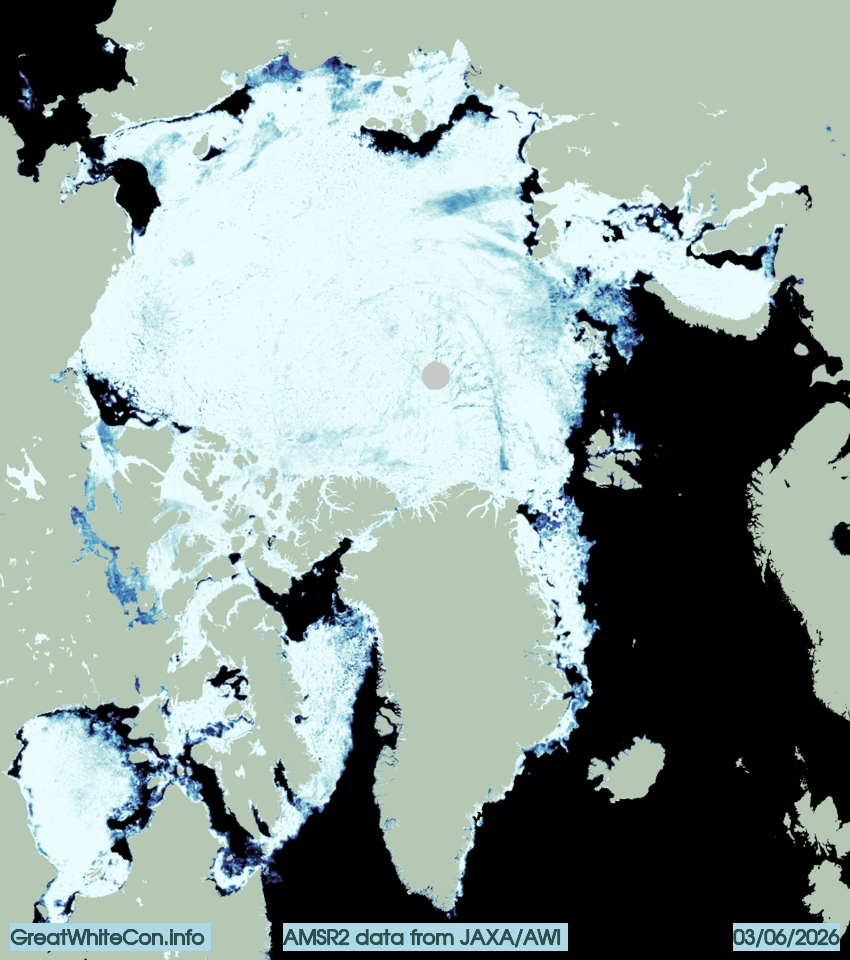
The Alfred Wegener Institute’s sea ice concentration data shows that the Bering Sea is now largely free of sea ice, and the areas of open water in the Beaufort, Chukchi, East Siberian and Laptev Seas continue to expand:
The sea ice concentration map also shows open water in much of Lancaster Sound. Also apparent is the widespread presence of melt ponds along the southern part of the Canadian Arctic Archipelago. Here’s a closer, albeit somewhat cloudy, look:
“False colour” image of the Canadian Arctic Archipelago on June 3rd from the MODIS instrument on the Aqua satellite
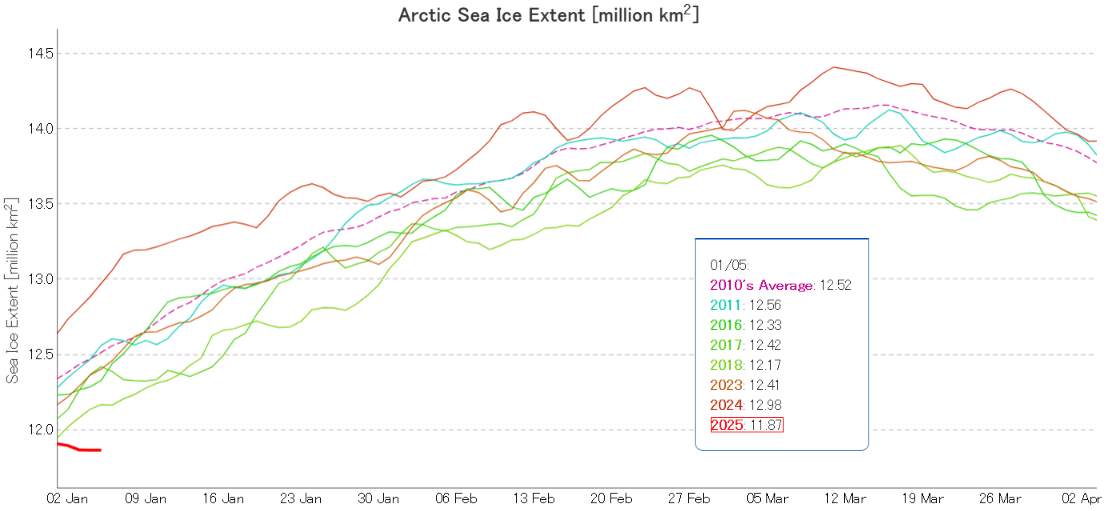
The New Year began with JAXA/ViSHOP extent lowest for the date in the satellite era, just below 2018 . Since then extent has reduced, and there is now a large gap:
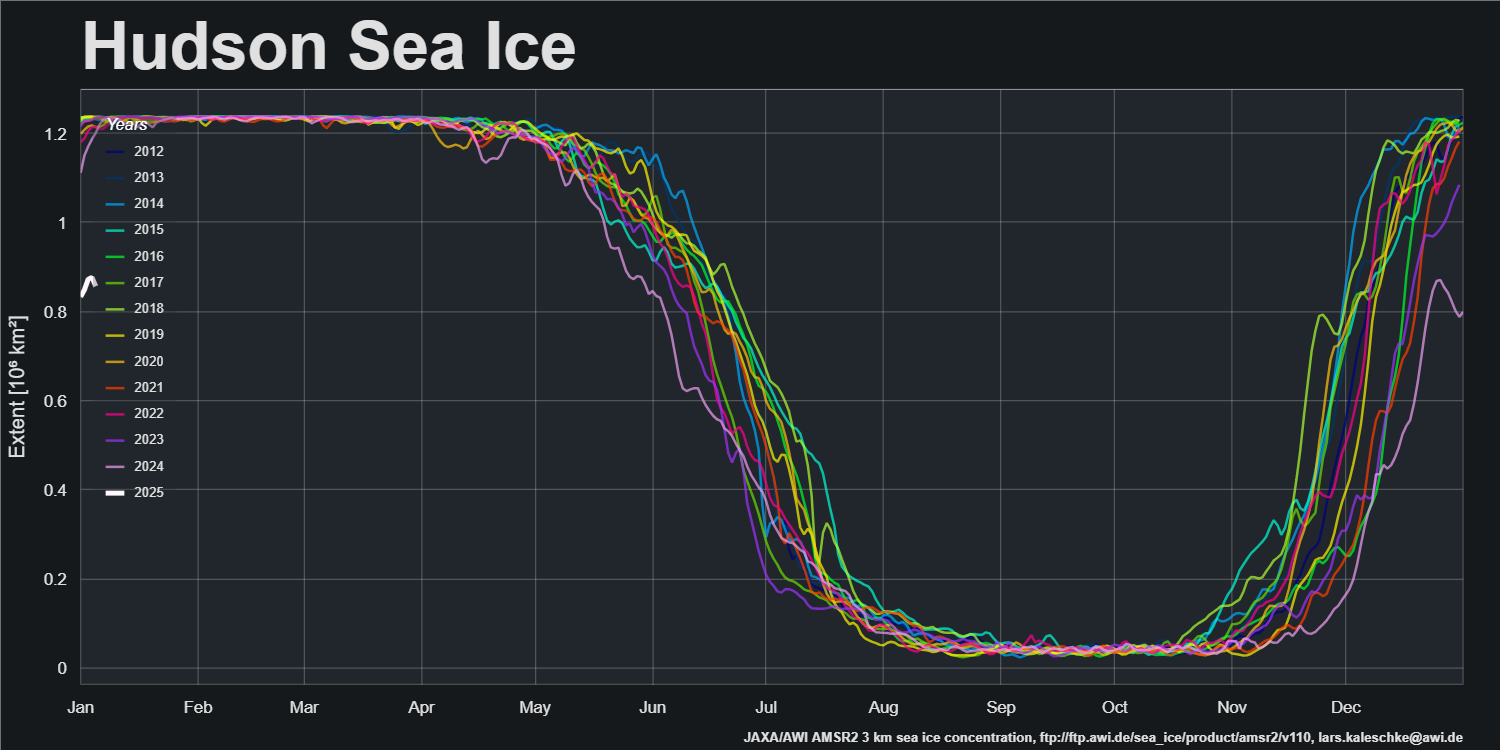
The primary reason for this is the remaining open water in Hudson Bay:
In previous years Hudson Bay has been covered by sea ice by this time of year, but in 2025 a large area remains unfrozen in early January!
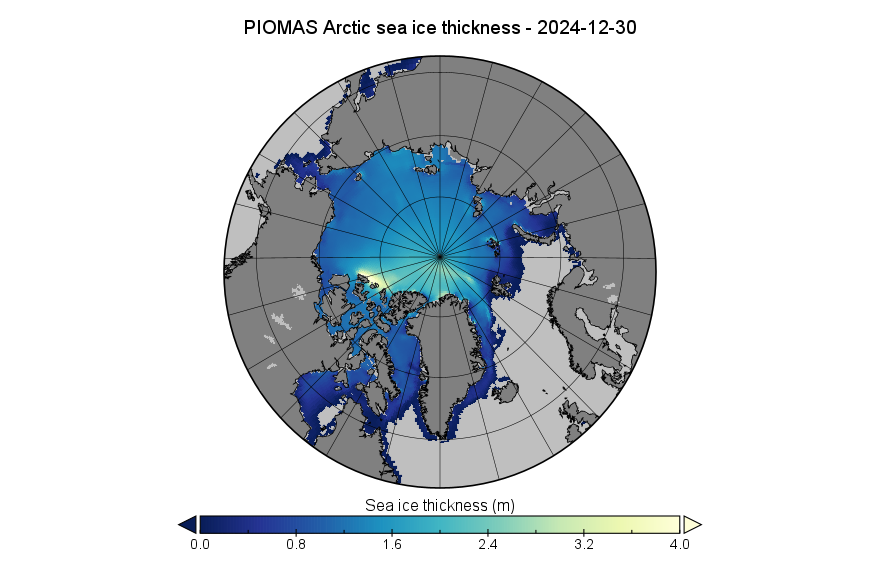
Due to the way PIOMAS handles the leap years the last gridded thickness data of 2024 is dated December 30th:
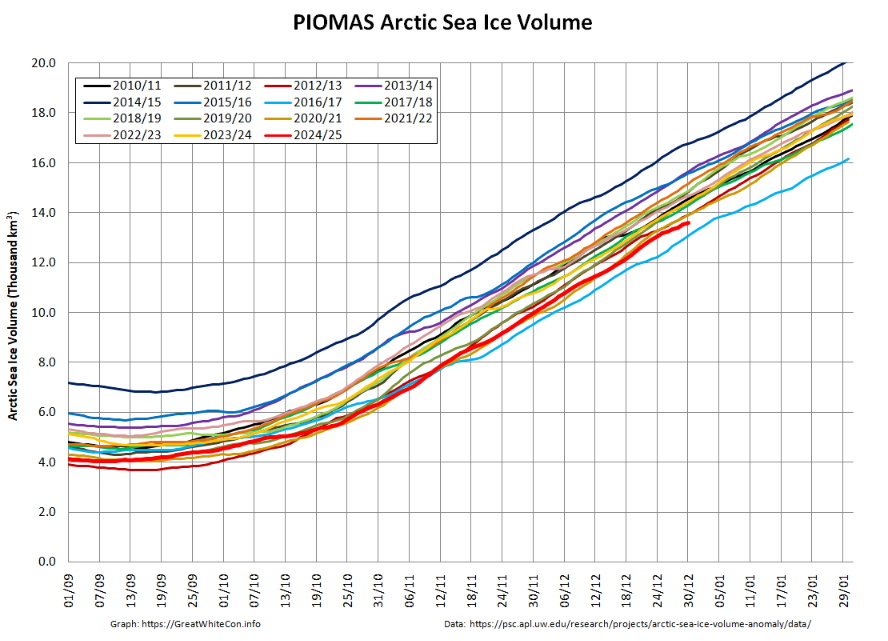
By December 30th Arctic sea ice volume had increased to 13.61 thousand km³, 2nd lowest for the date in the PIOMAS record:
The JAXA extent graph is currently not updating, so let’s begin this month with the latest AMSR2 sea ice concentration map from the Alfred Wegener Institute. Click the image to see a ~10 Mb animation of the last four weeks:
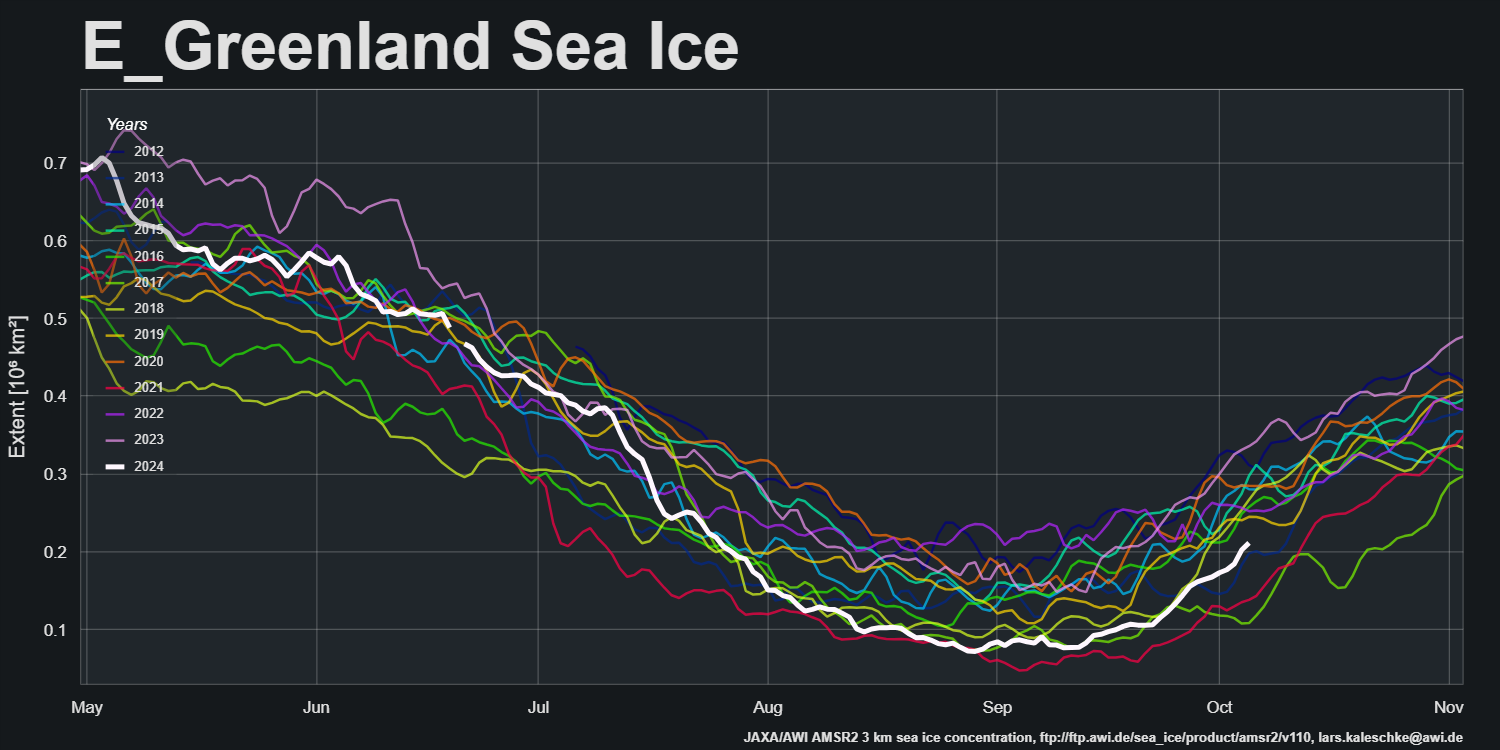
Note in particular the restart of export into the East Greenland Sea via the Fram Strait:
and the movement of ice within the Canadian Arctic Archipelago:
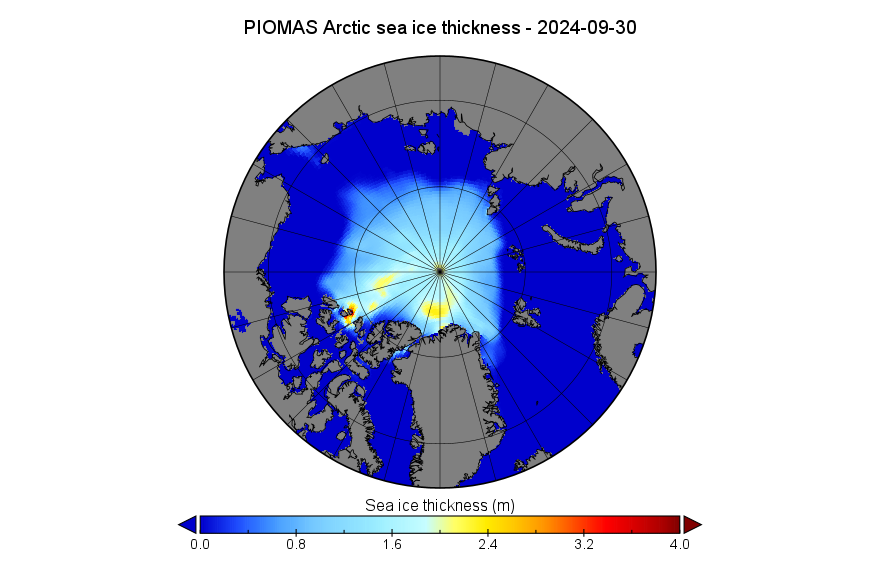
The PIOMAS gridded thickness data for September 2024 has been released:
Some “pleasure craft” are currently heading up the west coast of Greenland en route to the Bering Strait via Lancaster Sound and one of the assorted routes through the Canadian Arctic Archipelago. For those of you unfamiliar with the geography of the Northwest Passage, here are couple of hopefully helpful maps:
Whilst there is still ice blocking the route across Baffin Bay from Greenland, the Canadian Ice Service has already started daily coverage of the heart of the southern route through the Northwest Passage. There’s plenty of open water in Lancaster Sound and low concentration sea ice in Prince Regent Inlet:
Further south there is also open water in the Coronation Gulf, but the fast ice between Peel Sound and King William Island has not yet started breaking up:
This slightly cloudy satellite image of the Canadian Arctic Archipelago also shows that the exit of the northern route via McClure Strait into the Beaufort Sea is already navigable:
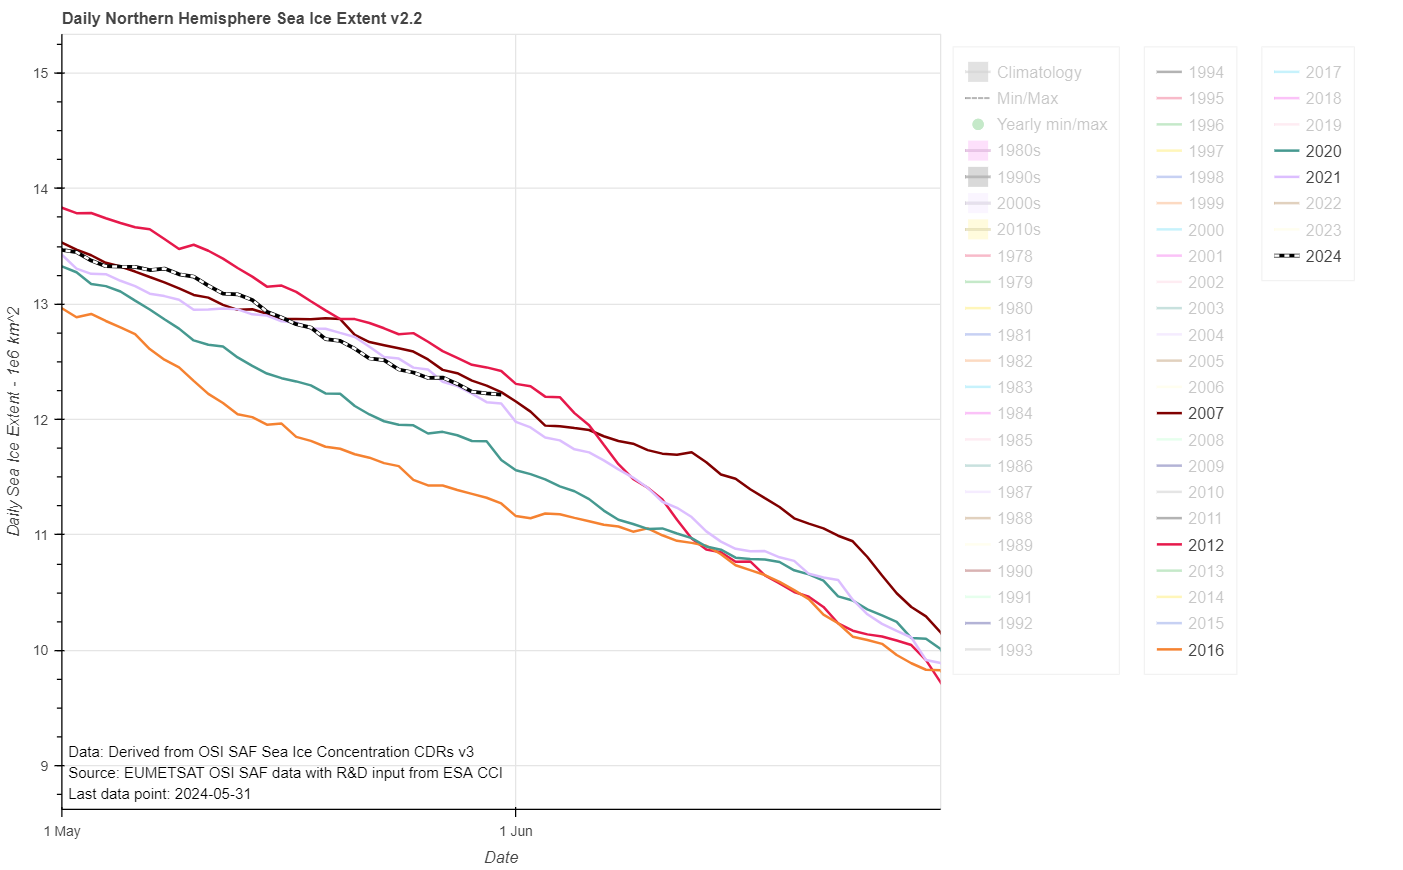
The JAXA/ViSHOP web site is currently down, so here is the current OSI SAF extent graph for the end of May:
2012’s “June cliff” is almost upon us, and if 2024’s current trajectory continues extent will cross above 2012 for the first time since February in a week or so.
A change is perhaps even better than a rest? Let’s start February with a reminder that following close behind another recent Arctic cyclone, Storm Ingunn caused red weather warnings for high winds and avalanches in Norway two days ago:
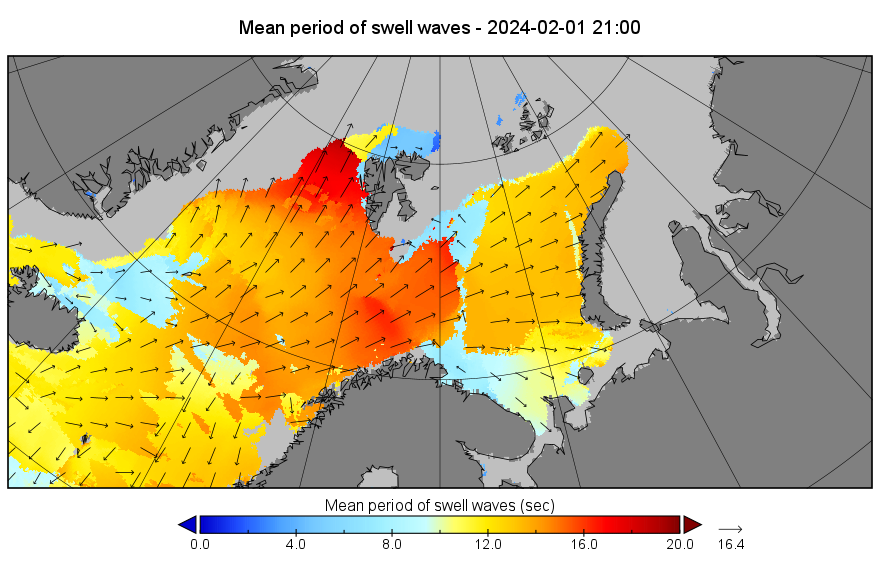
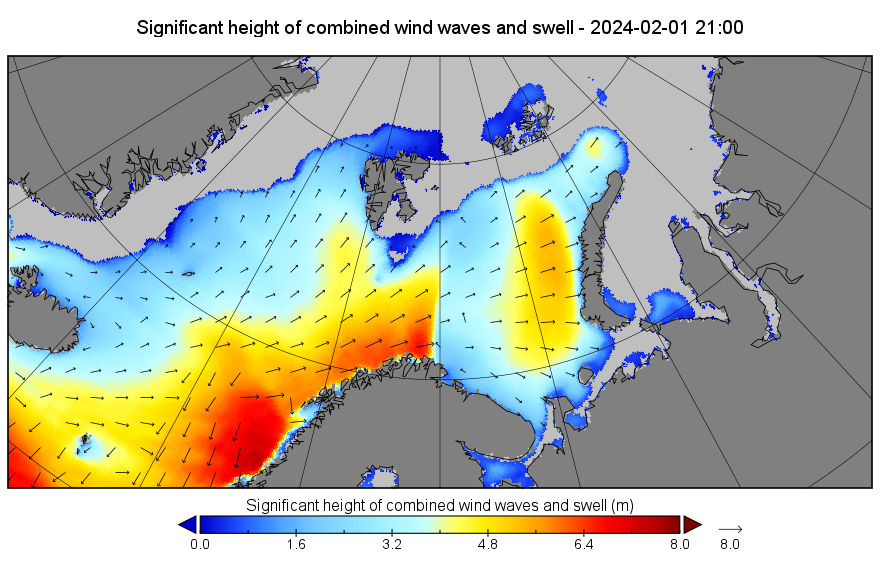
By yesterday evening another long period, storm driven swell was arriving at the sea ice edge in the Fram Strait, and to a lesser extent in the Barents Sea:
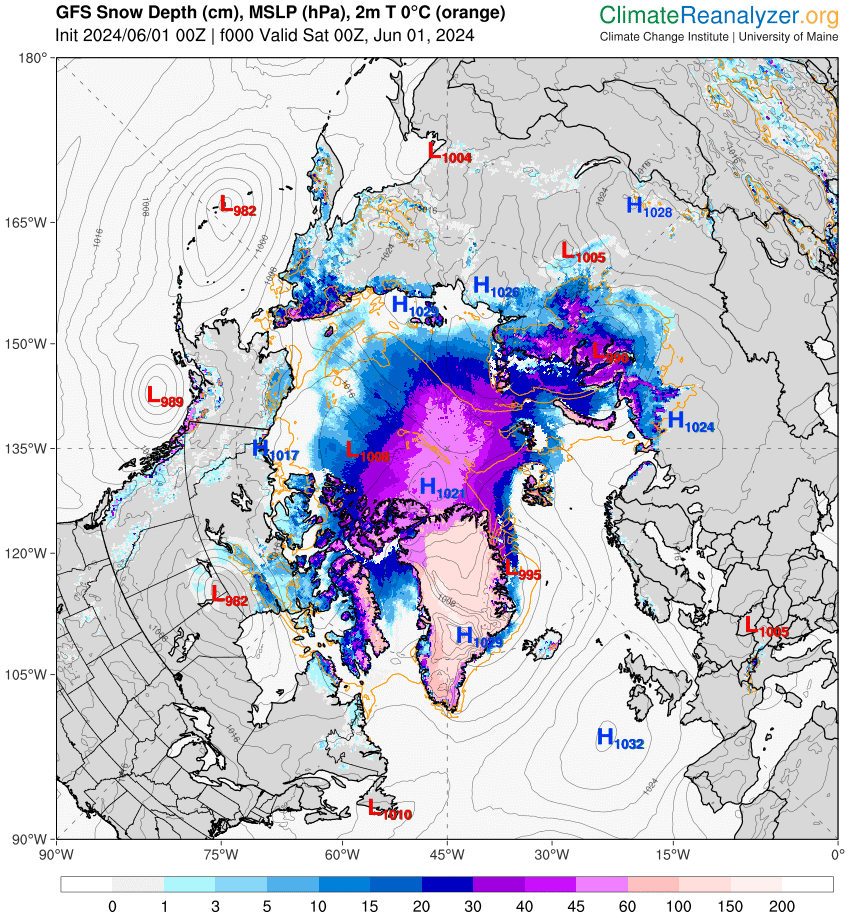
By this morning Ingunn had merged with the remnants of the prior cyclone, as revealed in Climate Reanalyzer’s visualisation of the latest GFS model run::
The 2023 Arctic Report Card has been published by the US National Oceanic and Atmospheric Administration (NOAA). All sorts of things are discussed in the report, but sticking to Snow White’s speciality of sea ice here’s an extract:
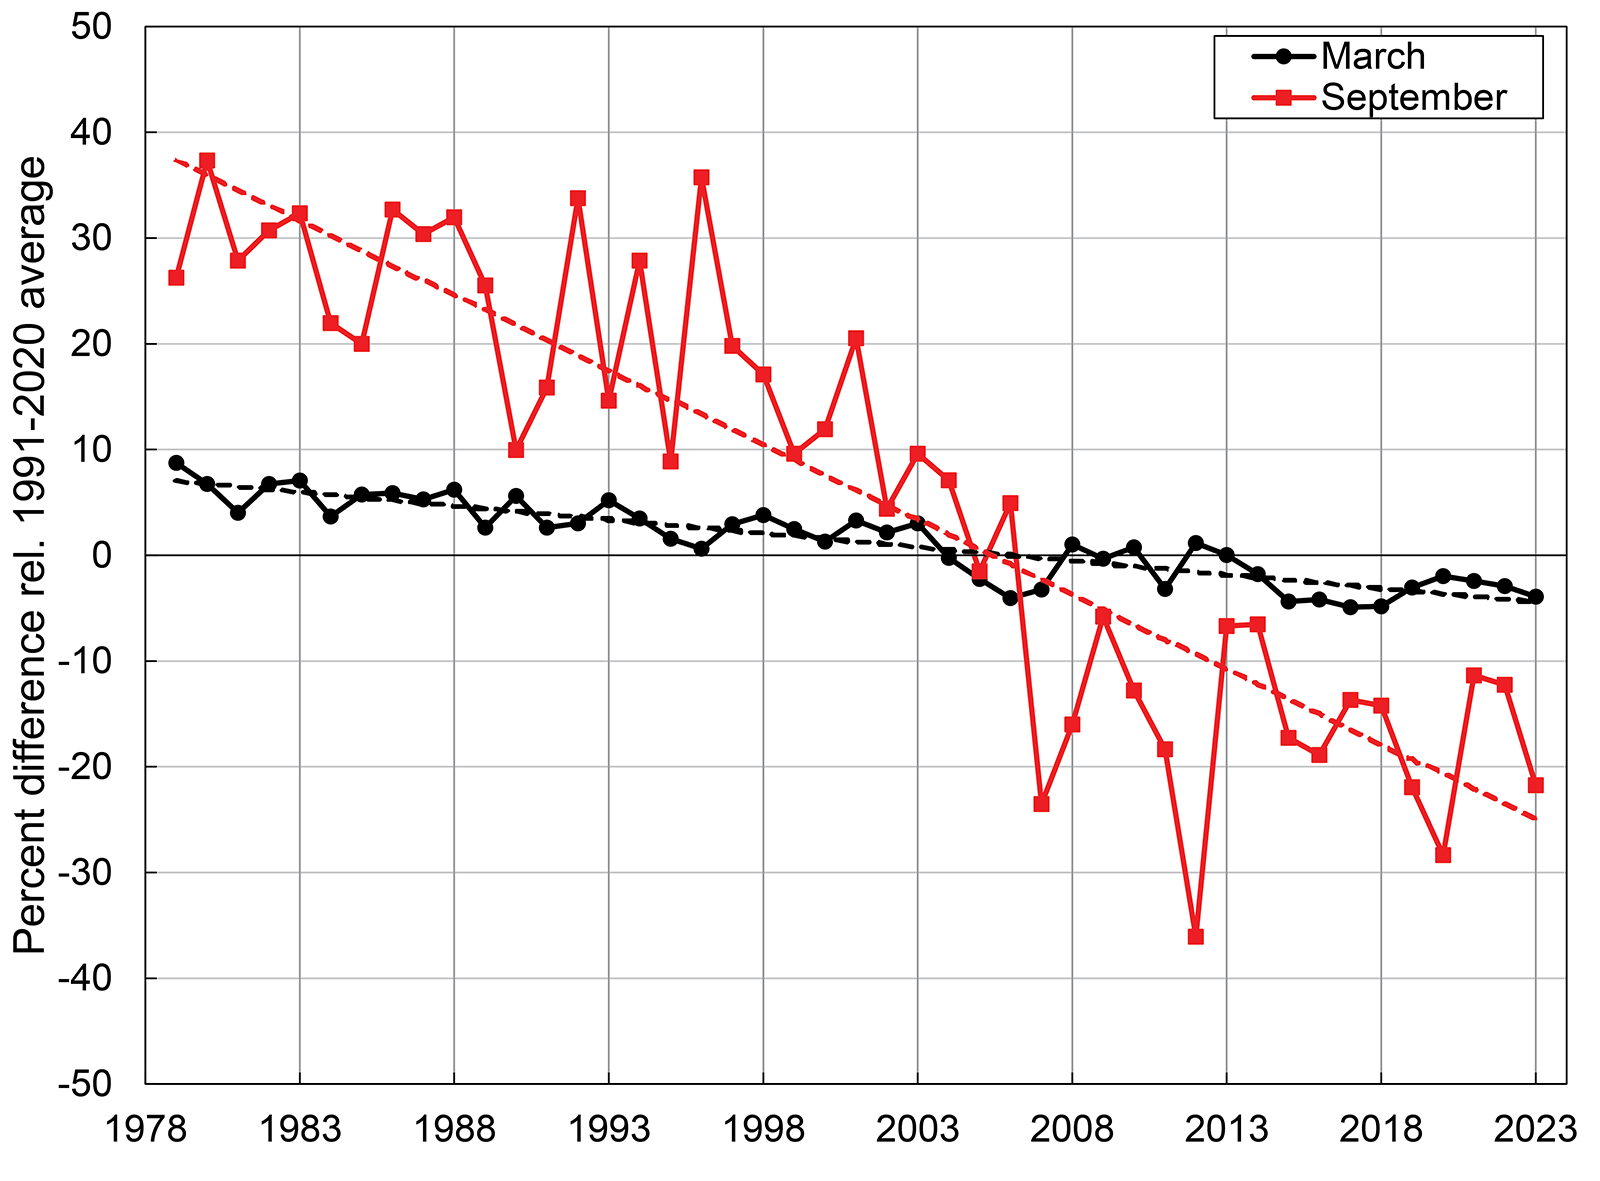
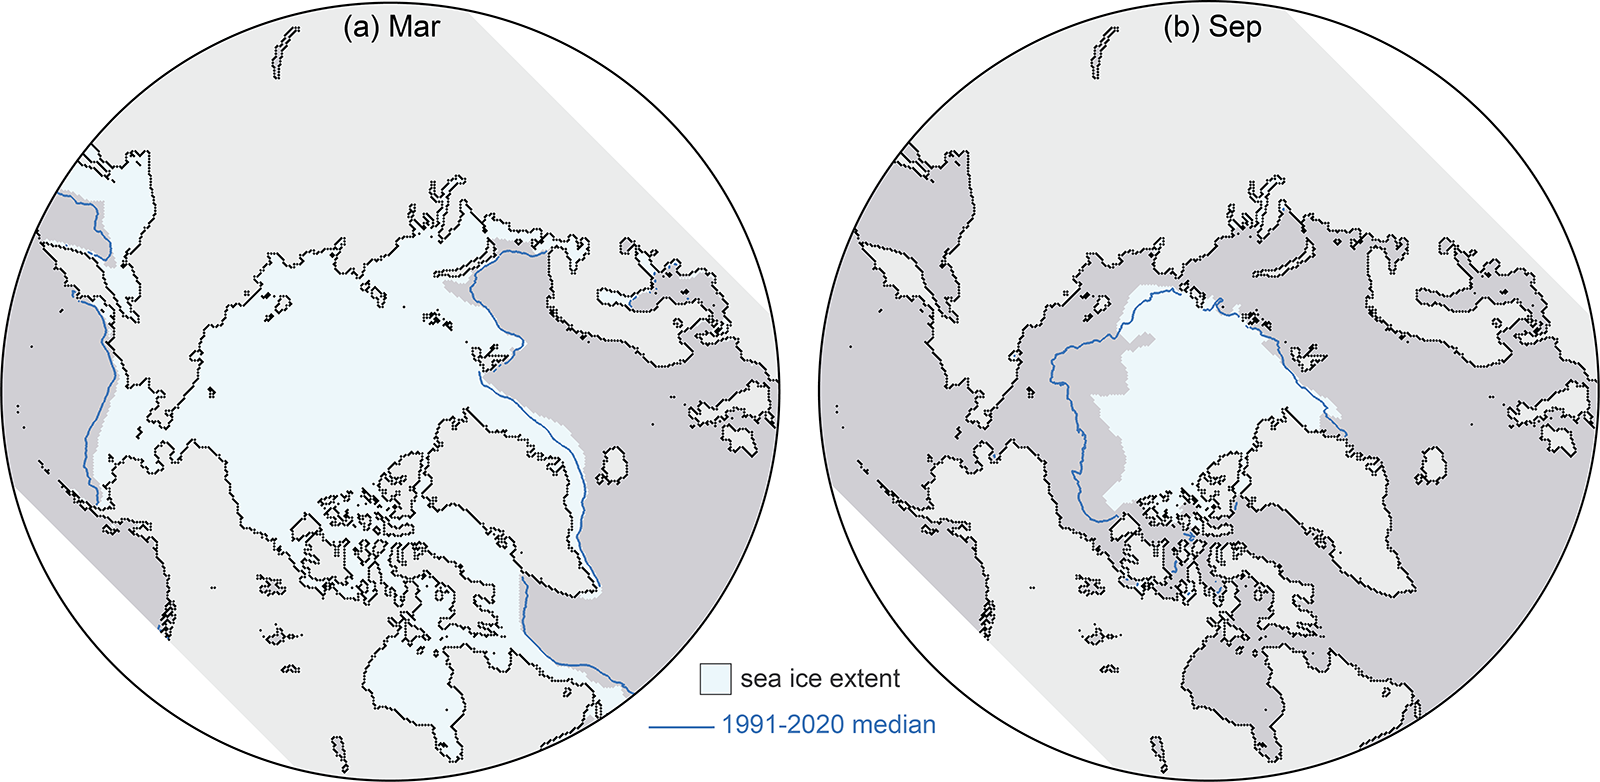
This satellite record tracks long-term trends, variability, and seasonal changes from the annual extent maximum in late February or March and the annual extent minimum in September. Extents in recent years are ~50% lower than values in the 1980s. In 2023, March and September extents were lower than other recent years, and though not a new record low, they continue the long-term downward trends:
March 2023 was marked by low sea ice extent around most of the perimeter of the sea ice edge, with the exception of the East Greenland Sea where extent was near normal. At the beginning of the melt season, ice retreat was initially fairly slow through April. In May and June, retreat increased to a near-average rate, and then accelerated further through July and August. By mid-July, the ice had retreated from much of the Alaskan and eastern Siberian coast and Hudson Bay had nearly melted out completely. In August, sea ice retreat was particularly pronounced on the Pacific side, opening up vast areas of the Beaufort, Chukchi, and East Siberian Seas. Summer extent remained closer to average on the Atlantic side, in the Laptev, Kara, and Barents Seas
The Northern Sea Route, along the northern Russian coast, was relatively slow to open as sea ice extended to the coast in the eastern Kara Sea and the East Siberian Sea, but by late August, open water was found along the coast through the entire route. The Northwest Passage through the Canadian Archipelago became relatively clear of ice, though ice continued to largely block the western end of the northern route through M’Clure Strait through the melt season. Nonetheless, summer 2023 extent in the Passage was among the lowest observed in the satellite record, based on Canadian Ice Service ice charts.
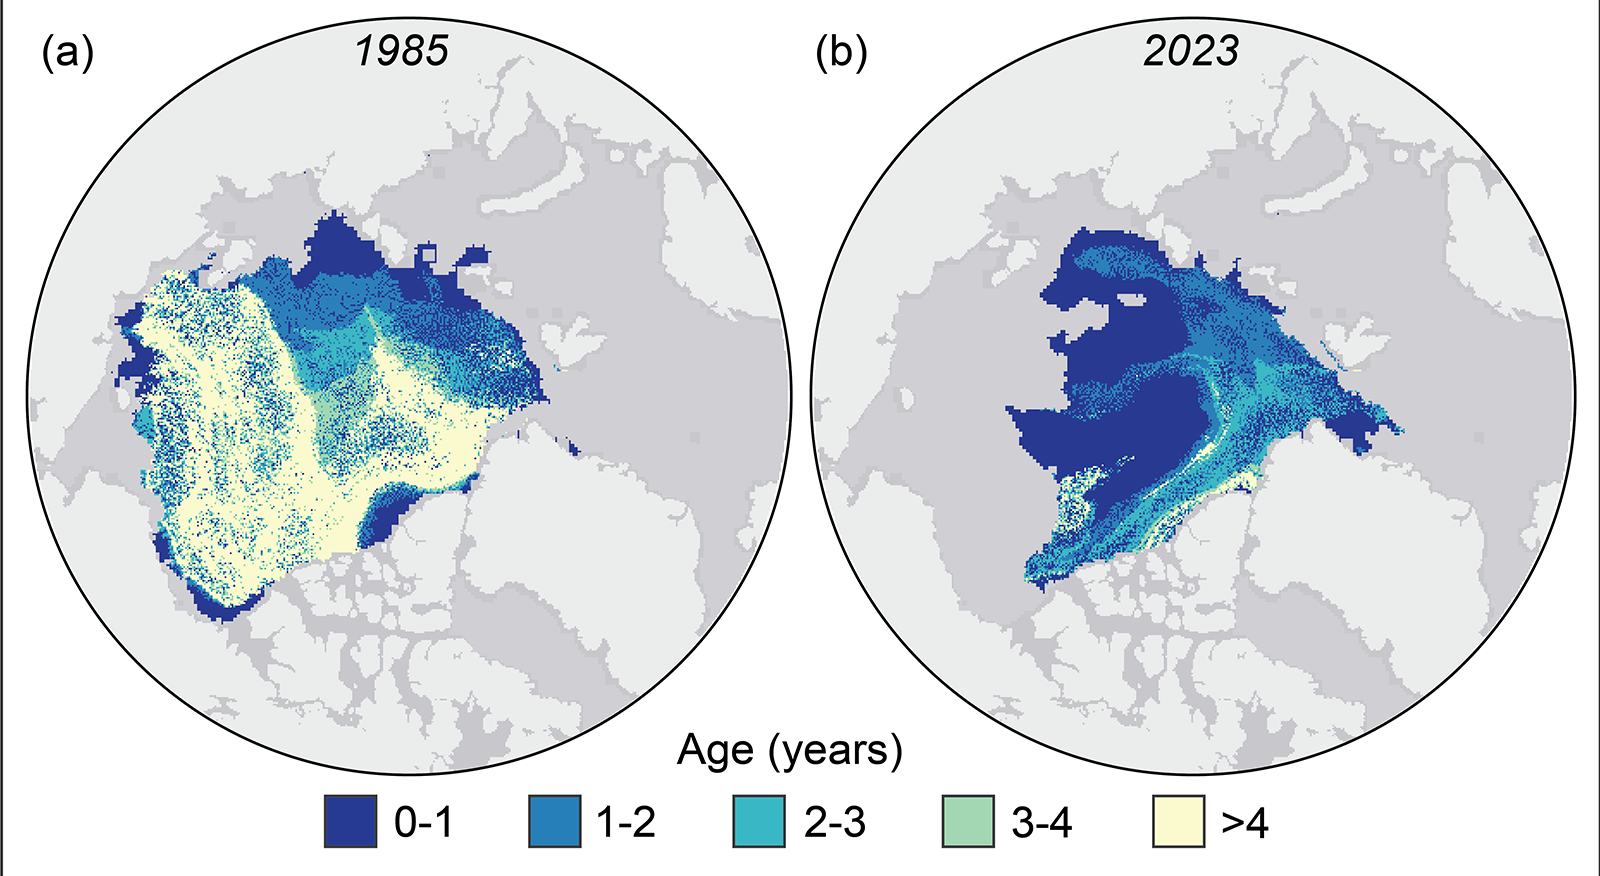
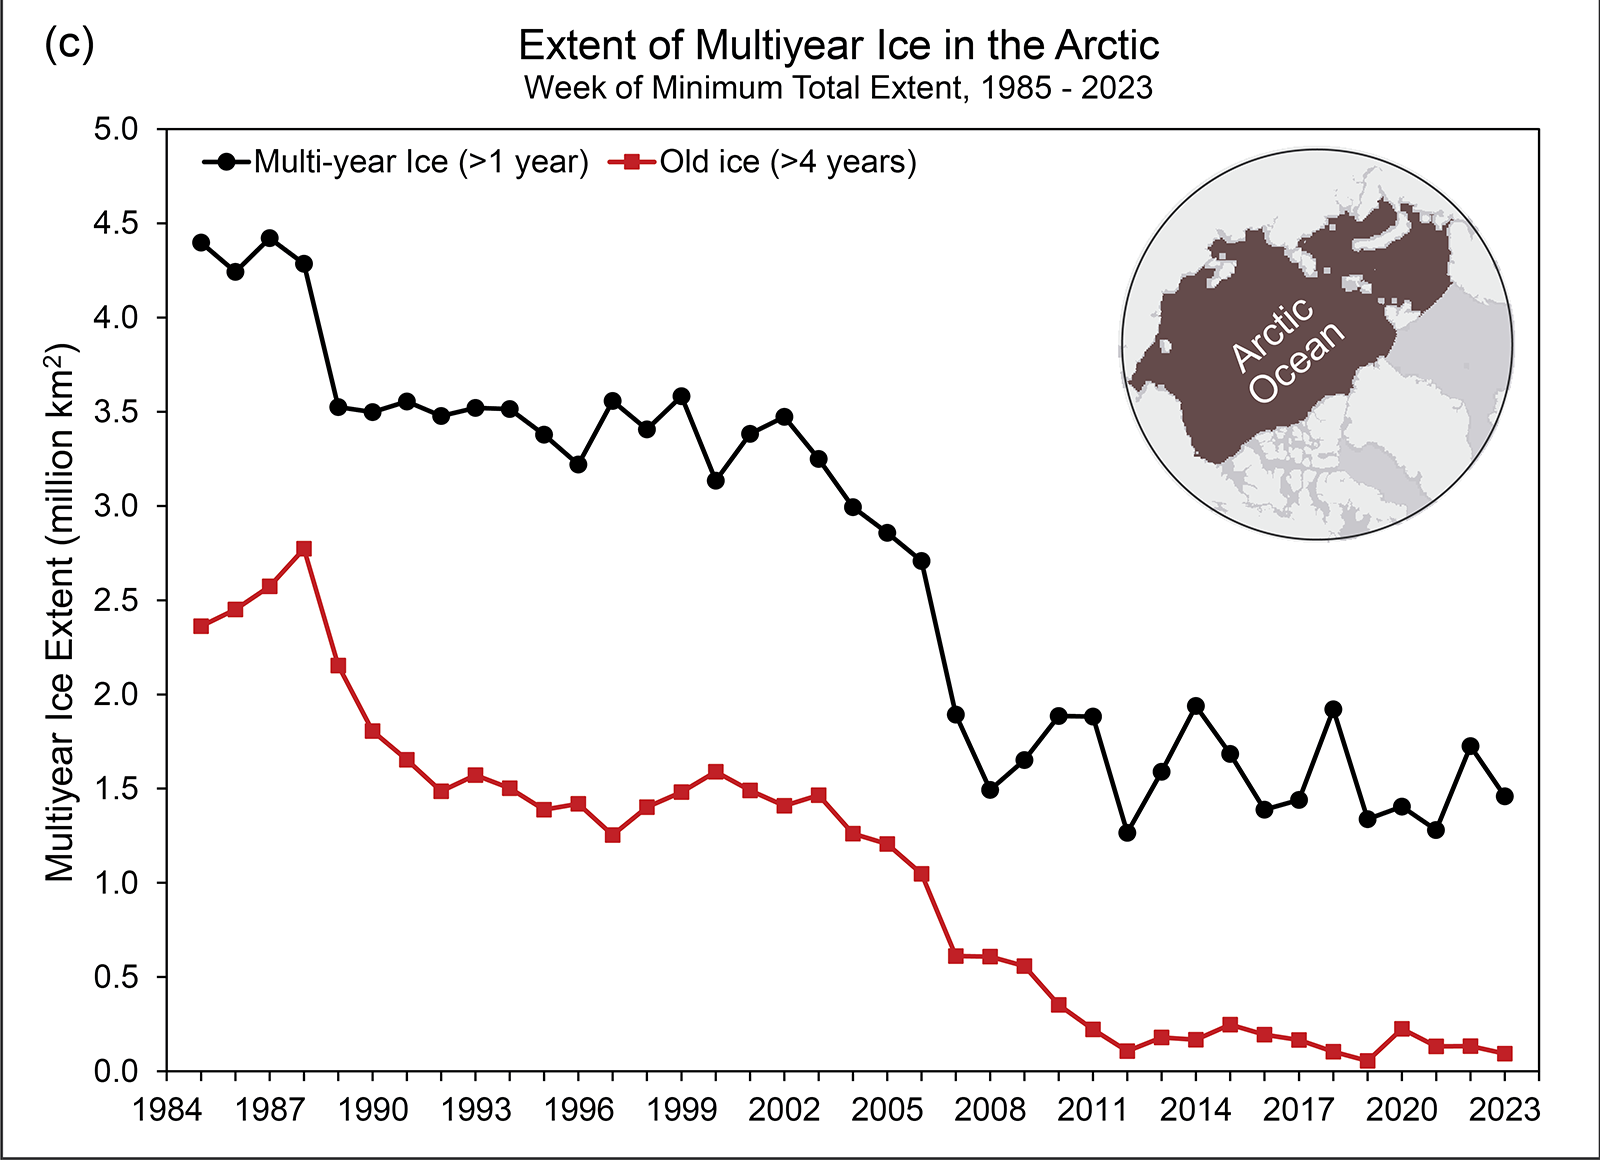
Tracking the motion of ice in passive microwave imagery using feature tracking algorithms can be used to infer sea ice age. Age is a proxy for ice thickness because multiyear ice generally grows thicker through successive winter periods. Multiyear ice extent has shown interannual oscillations but no clear trend since 2007, reflecting variability in the summer sea ice melt and export out of the Arctic. After a year when substantial multiyear ice is lost, a much larger area of first-year ice generally takes its place. Some of this first-year ice can persist through the following summer, contributing to the replenishment of the multiyear ice extent:
However, old ice (here defined as >4 years old) has remained consistently low since 2012. Thus, unlike in earlier decades, multiyear ice does not remain in the Arctic for many years. At the end of the summer 2023 melt season, multiyear ice extent was similar to 2022 values, far below multiyear extents in the 1980s and 1990s:
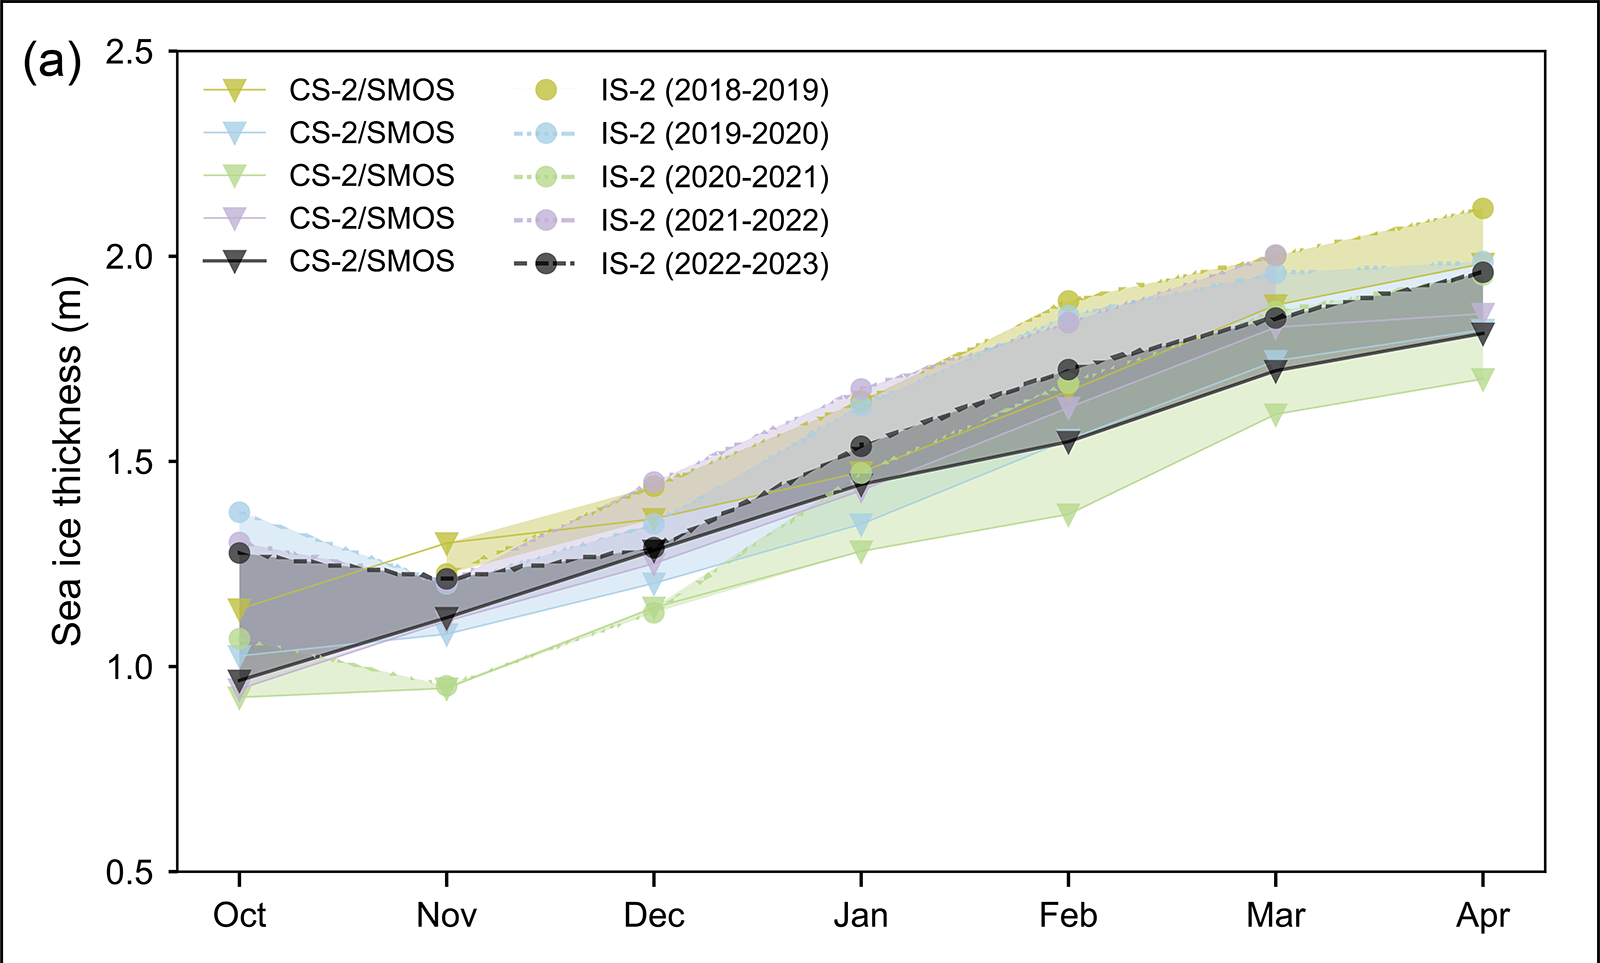
Estimates of sea ice thickness from satellite altimetry can be used to more directly track this important metric of sea ice conditions, although the data record is shorter than for extent and ice age. Data from ICESat-2 and CryoSat-2/SMOS satellite products tracking the seasonal October to April winter ice growth over the past four years (when all missions have been in operation) show a mean thickness generally thinner than the 2021/22 winter but with seasonal growth typical of recent winters:
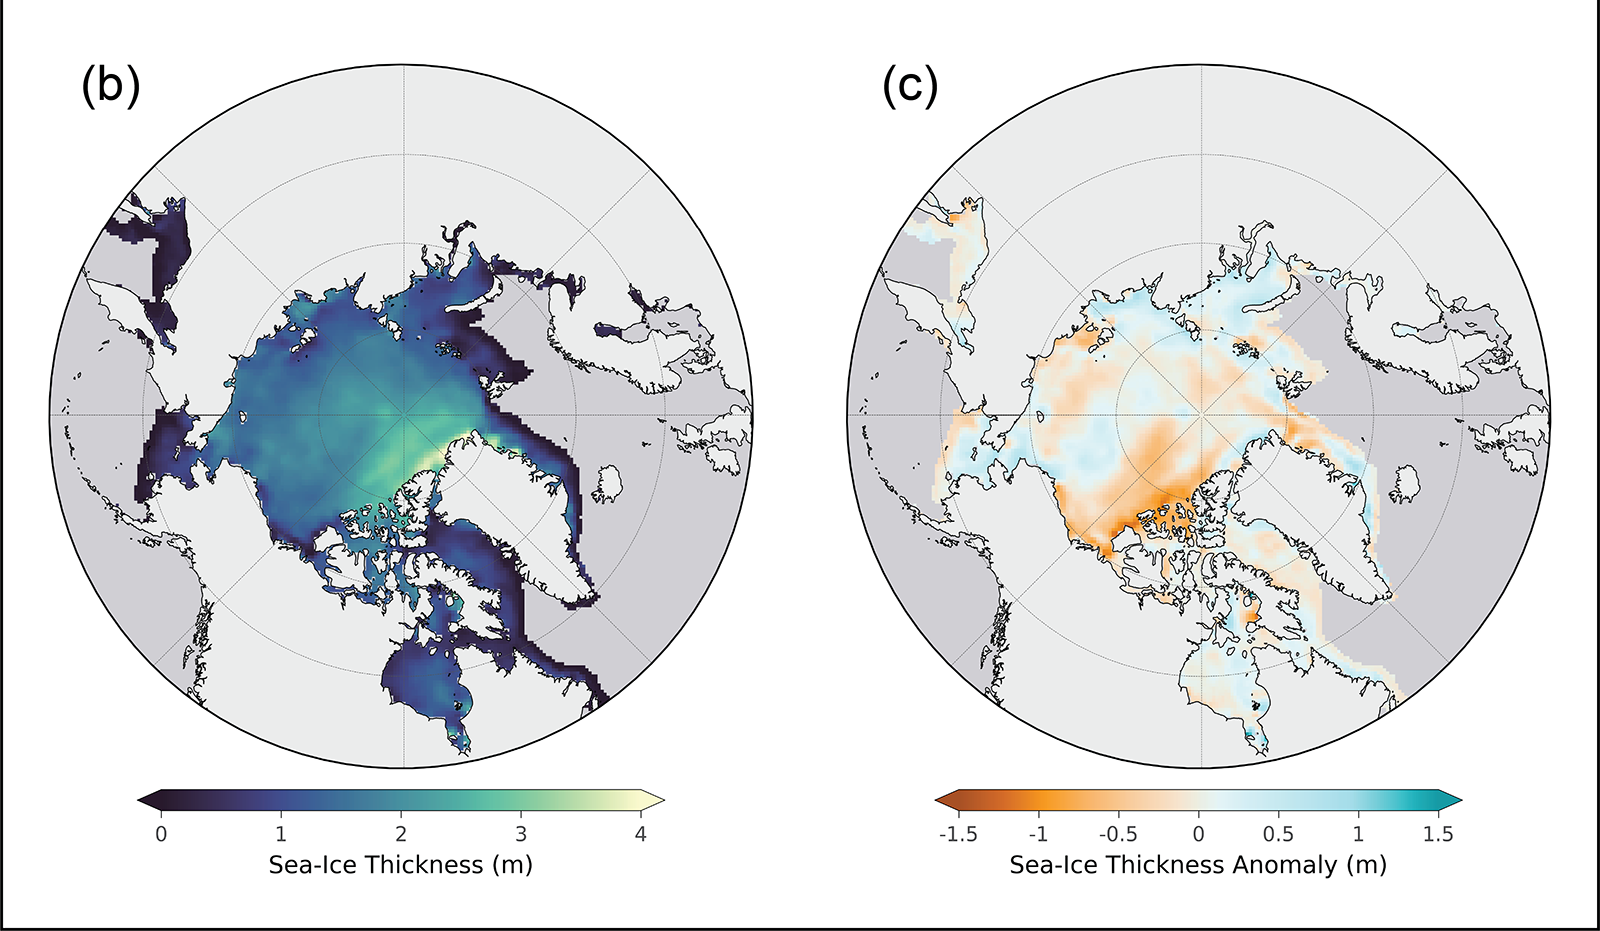
April 2023 thickness from CryoSat-2/SMOS relative to the 2011-22 April mean shows that the eastern Beaufort Sea and the East Siberian Sea had relatively thinner sea ice than the 2011-22 mean, particularly near the Canadian Archipelago. Thickness was higher than average in much of the Laptev and Kara Seas and along the west and northwest coast of Alaska, extending northward toward the pole. The East Greenland Sea had a mixture of thicker and thinner than average ice:
An excellent analysis (IMHO!), but I do have one quibble. I was following events in the Northwest Passage very closely last summer, and according to the Canadian Ice Service on September 1st:
Prompted by a comment by Tom in the June open thread, the time has evidently come to open the 2023 Northwest Passage passage thread. First of all let’s get our bearings with the help of this map of the area:
and another map detailing the routes through Canadian Arctic Archipelago that have previously been successfully traversed:
As our starter for ten for 2023, there is already plenty of open water in the Amundsen Gulf, together with plenty of melt ponding on the remaining fast ice in Franklin and Darnley Bays:
This website uses cookies to improve your experience. We'll assume you're ok with this, but you can opt-out if you wish. Cookie settingsACCEPT
Privacy & Cookies Policy
Privacy Overview
This website uses cookies to improve your experience while you navigate through the website. Out of these, the cookies that are categorized as necessary are stored on your browser as they are essential for the working of basic functionalities of the website. We also use third-party cookies that help us analyze and understand how you use this website. These cookies will be stored in your browser only with your consent. You also have the option to opt-out of these cookies. But opting out of some of these cookies may affect your browsing experience.
Necessary cookies are absolutely essential for the website to function properly. This category only includes cookies that ensures basic functionalities and security features of the website. These cookies do not store any personal information.
Any cookies that may not be particularly necessary for the website to function and is used specifically to collect user personal data via analytics, ads, other embedded contents are termed as non-necessary cookies. It is mandatory to procure user consent prior to running these cookies on your website.