The 2023 Arctic Report Card has been published by the US National Oceanic and Atmospheric Administration (NOAA). All sorts of things are discussed in the report, but sticking to Snow White’s speciality of sea ice here’s an extract:
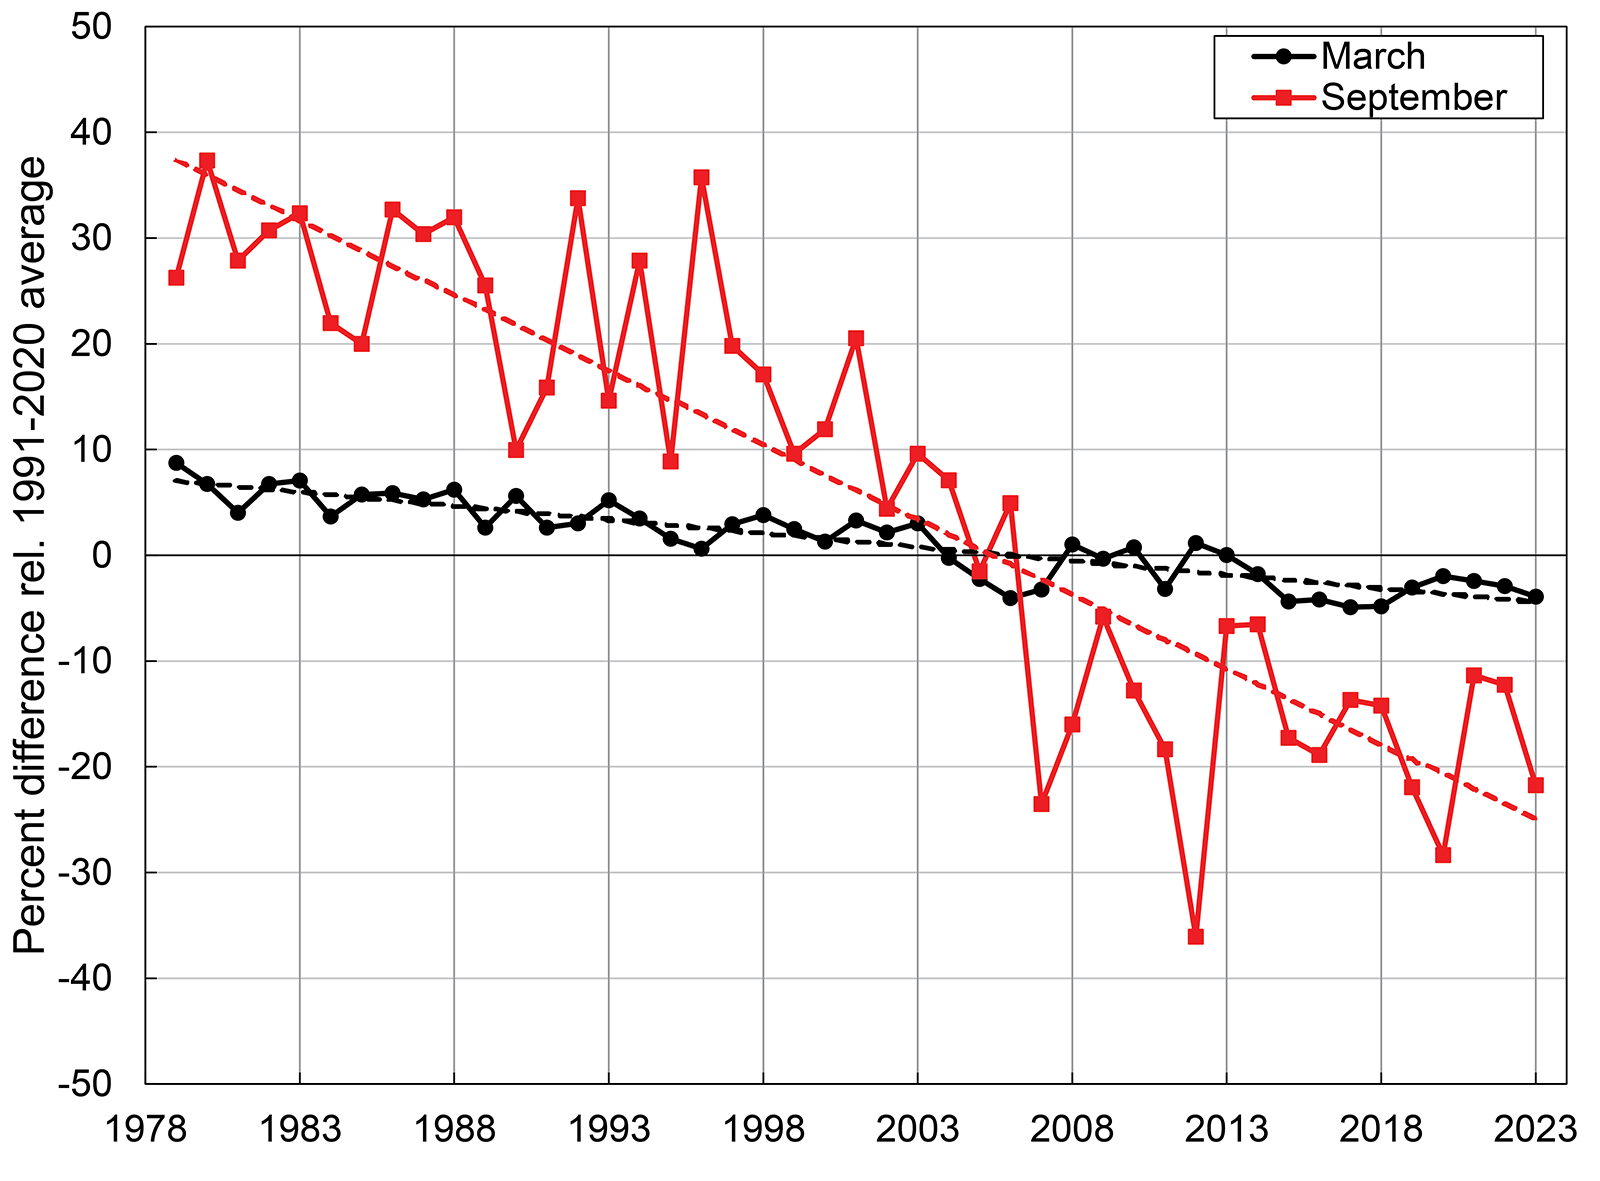
This satellite record tracks long-term trends, variability, and seasonal changes from the annual extent maximum in late February or March and the annual extent minimum in September. Extents in recent years are ~50% lower than values in the 1980s. In 2023, March and September extents were lower than other recent years, and though not a new record low, they continue the long-term downward trends:
March 2023 was marked by low sea ice extent around most of the perimeter of the sea ice edge, with the exception of the East Greenland Sea where extent was near normal. At the beginning of the melt season, ice retreat was initially fairly slow through April. In May and June, retreat increased to a near-average rate, and then accelerated further through July and August. By mid-July, the ice had retreated from much of the Alaskan and eastern Siberian coast and Hudson Bay had nearly melted out completely. In August, sea ice retreat was particularly pronounced on the Pacific side, opening up vast areas of the Beaufort, Chukchi, and East Siberian Seas. Summer extent remained closer to average on the Atlantic side, in the Laptev, Kara, and Barents Seas
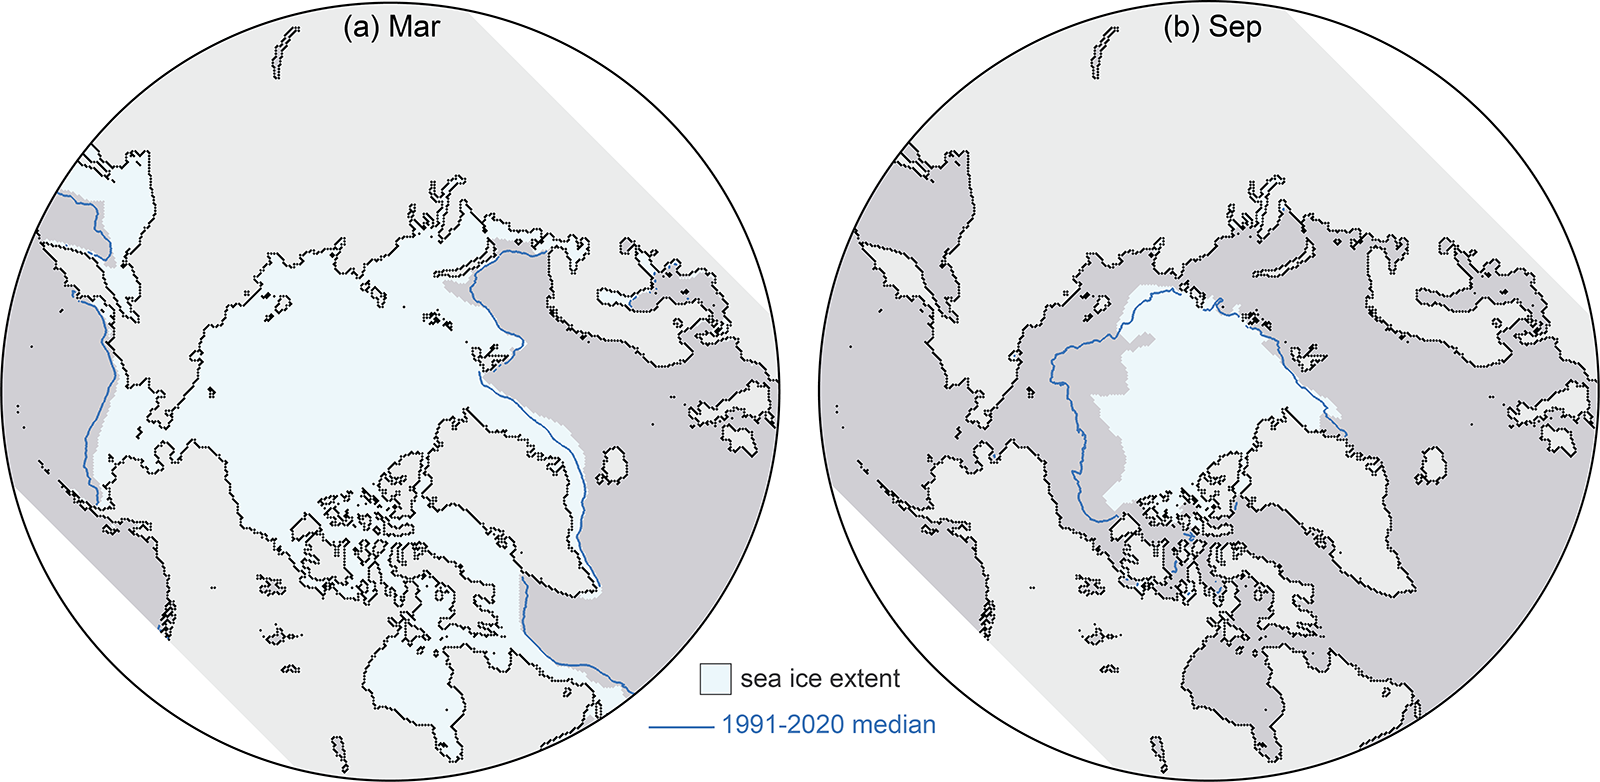
The Northern Sea Route, along the northern Russian coast, was relatively slow to open as sea ice extended to the coast in the eastern Kara Sea and the East Siberian Sea, but by late August, open water was found along the coast through the entire route. The Northwest Passage through the Canadian Archipelago became relatively clear of ice, though ice continued to largely block the western end of the northern route through M’Clure Strait through the melt season. Nonetheless, summer 2023 extent in the Passage was among the lowest observed in the satellite record, based on Canadian Ice Service ice charts.
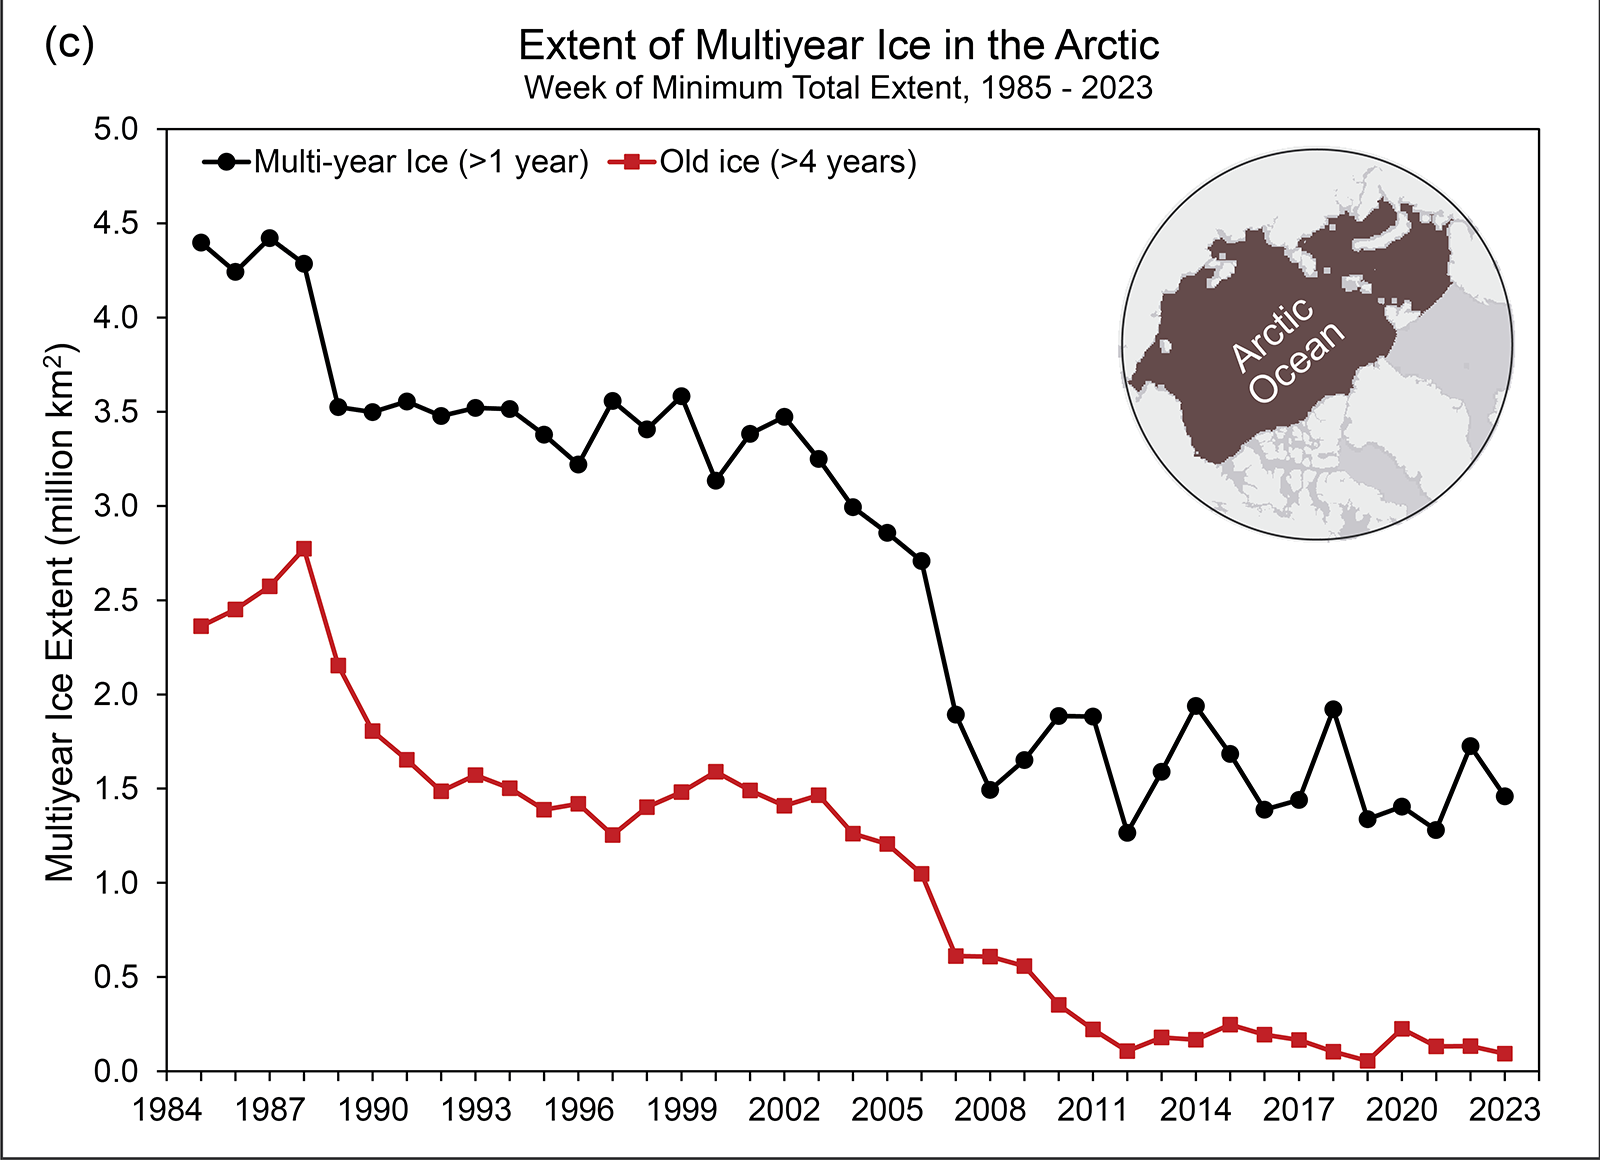
Tracking the motion of ice in passive microwave imagery using feature tracking algorithms can be used to infer sea ice age. Age is a proxy for ice thickness because multiyear ice generally grows thicker through successive winter periods. Multiyear ice extent has shown interannual oscillations but no clear trend since 2007, reflecting variability in the summer sea ice melt and export out of the Arctic. After a year when substantial multiyear ice is lost, a much larger area of first-year ice generally takes its place. Some of this first-year ice can persist through the following summer, contributing to the replenishment of the multiyear ice extent:
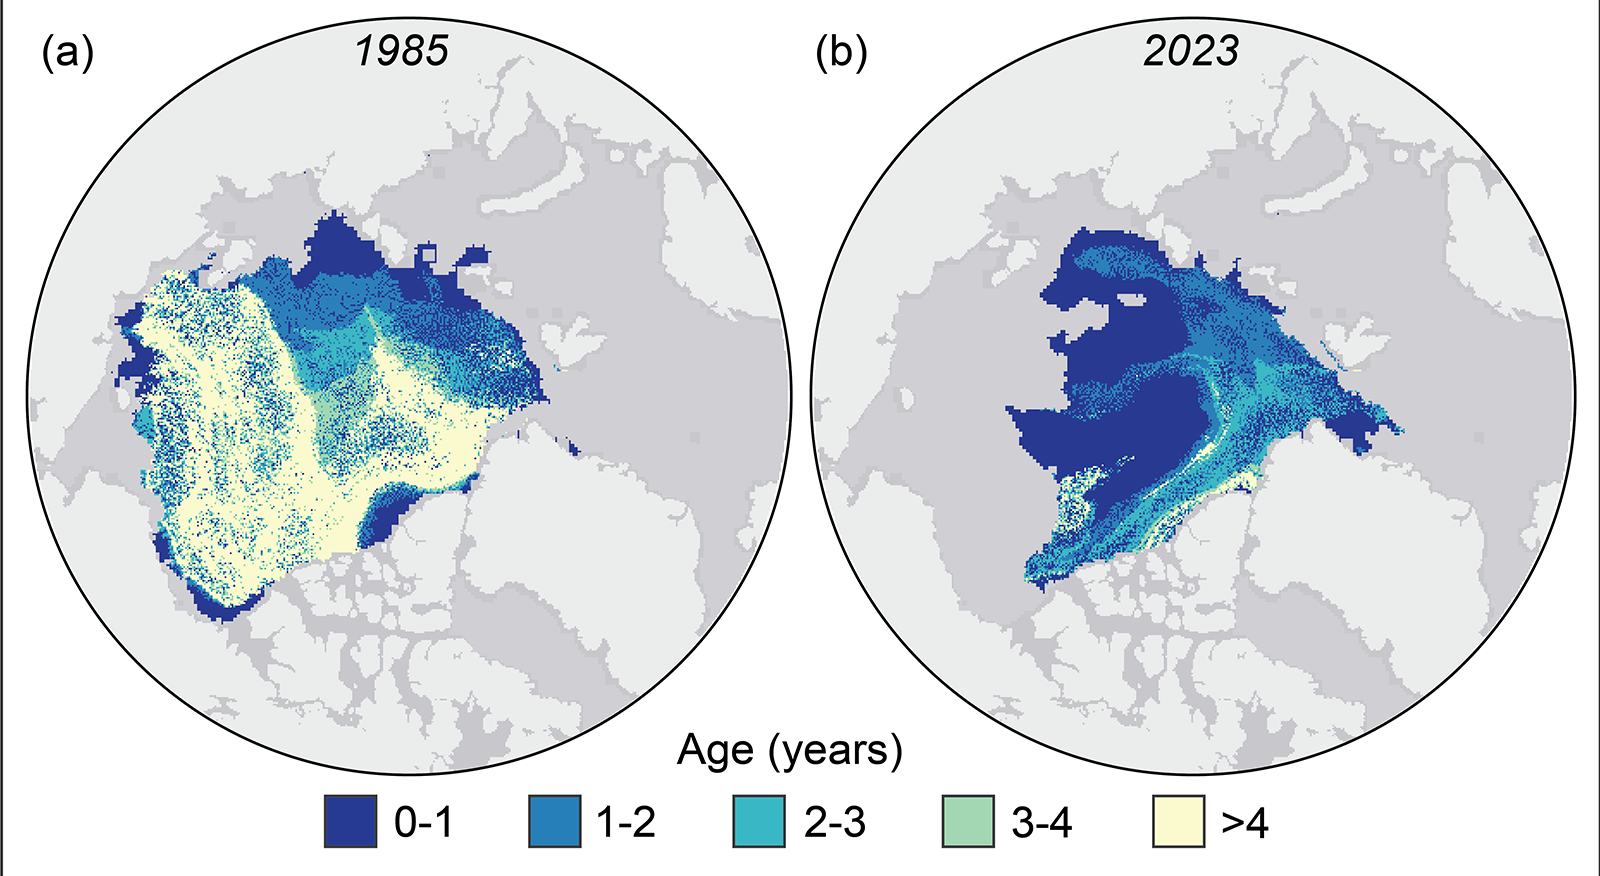
However, old ice (here defined as >4 years old) has remained consistently low since 2012. Thus, unlike in earlier decades, multiyear ice does not remain in the Arctic for many years. At the end of the summer 2023 melt season, multiyear ice extent was similar to 2022 values, far below multiyear extents in the 1980s and 1990s:
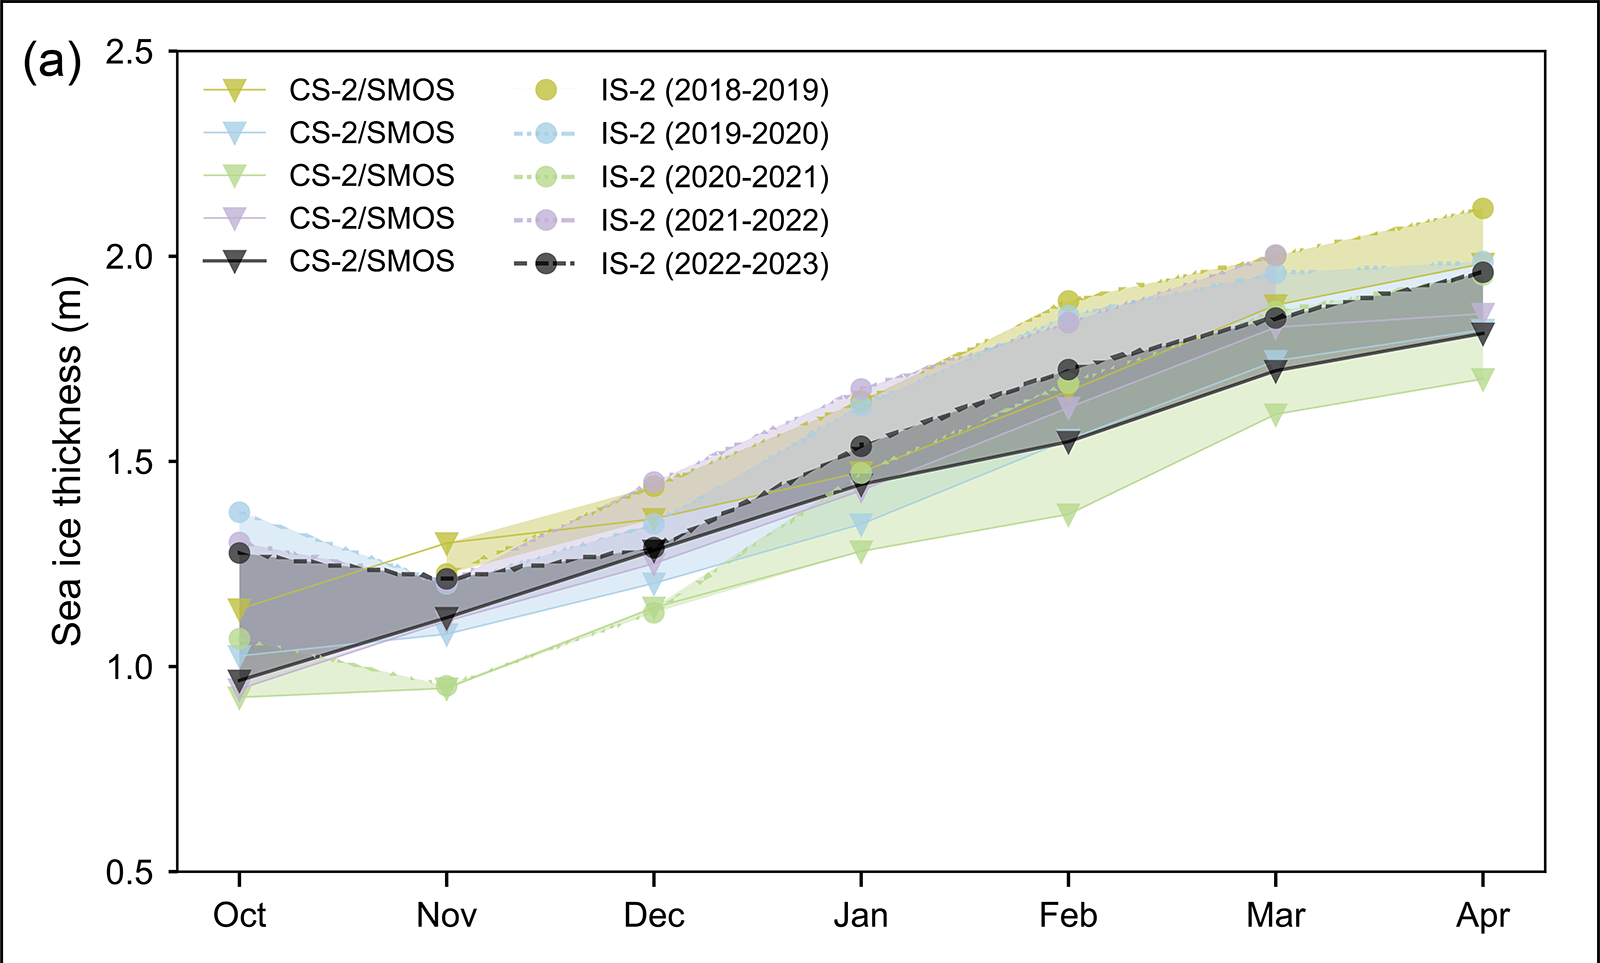
Estimates of sea ice thickness from satellite altimetry can be used to more directly track this important metric of sea ice conditions, although the data record is shorter than for extent and ice age. Data from ICESat-2 and CryoSat-2/SMOS satellite products tracking the seasonal October to April winter ice growth over the past four years (when all missions have been in operation) show a mean thickness generally thinner than the 2021/22 winter but with seasonal growth typical of recent winters:
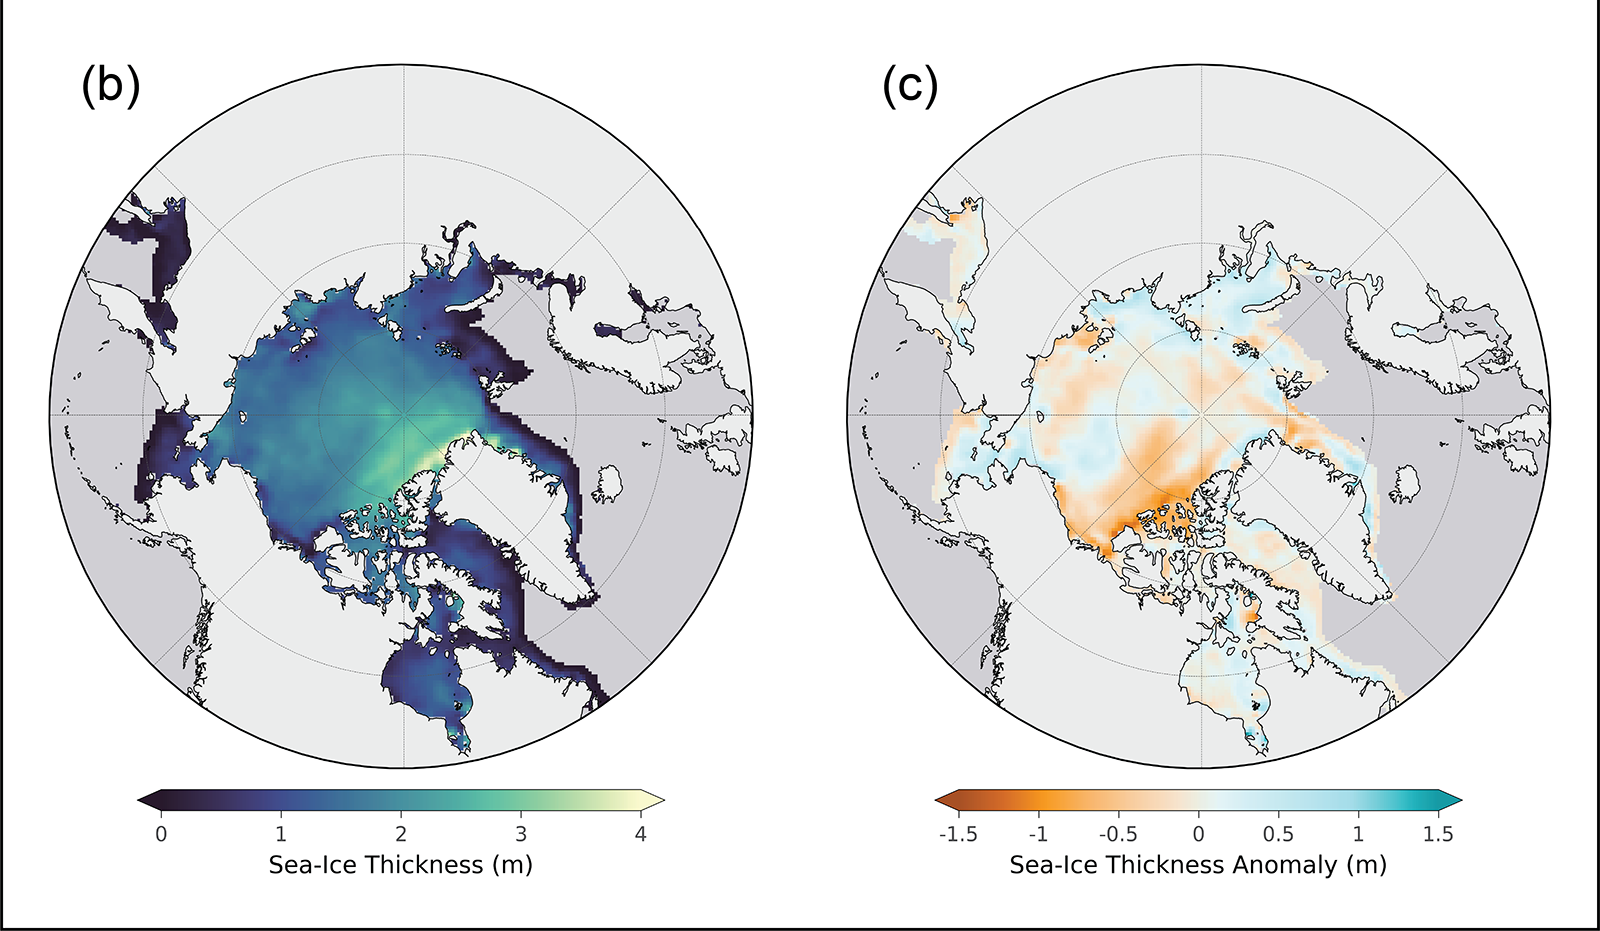
April 2023 thickness from CryoSat-2/SMOS relative to the 2011-22 April mean shows that the eastern Beaufort Sea and the East Siberian Sea had relatively thinner sea ice than the 2011-22 mean, particularly near the Canadian Archipelago. Thickness was higher than average in much of the Laptev and Kara Seas and along the west and northwest coast of Alaska, extending northward toward the pole. The East Greenland Sea had a mixture of thicker and thinner than average ice:
An excellent analysis (IMHO!), but I do have one quibble. I was following events in the Northwest Passage very closely last summer, and according to the Canadian Ice Service on September 1st:
I didn’t know about “old ice” greater than 4 years compared to multiyear ice greater than 1 year. Yeah NOAA really doesn’t cut corners on that report. Oceanographer Jim Massa has a great youtube “science talks” channel that emphasizes the hot ocean currents coming up from the Mediterranean to melt the arctic as Atlantification. Of course with El Nino – I don’t know – seems like the ice could move fast. Did you see Natalia Shakhova’s new paper on the ESAS methane isotope study (she is one of many coauthors). It’s quite stunning how the US scientists ignore the ESAS methane. In fact Michael Mann seems particularly peeved that this ESAS methane goes against the computer models saying methane is not a serious “abrupt eruption” issue. Nevertheless Shakhova has said 50 gigatons abrupt eruption could happen at any time and would double atmospheric temperatures.
Double atmospheric temperatures: you want some serious resources supporting the hat claim I would suspect.
the latest arctic-news blogspot says the “seafloor methane tipping point” of 1.3 C will be broached this year. ESAS methane “abrupt eruption” will no longer be ignored.
Hi VIYY,
As previously discussed, I’ll believe it when I see it. I’ve met Peter Cox, who contributed to this chapter in the IPCC’s AR6 WG1 report:
https://www.ipcc.ch/report/ar6/wg1/downloads/report/IPCC_AR6_WGI_Chapter05.pdf
I met Kevin Anderson once too:
First Calibrated Methane Bubble Wintertime Observations in the Siberian Arctic Seas: Selected Results from the Fast Ice
by Denis Chernykh
1,2,3,* [ORCID] , Natalia Shakhova
1,2,3, Vladimir Yusupov
1,2,4 [ORCID] , Elena Gershelis
2,5,6 [ORCID] , Boris Morgunov
3 and Igor Semiletov
1,2,3,5,*
1
V.I. Ilyichev Pacific Oceanological Institute, Far Eastern Branch of the Russian Academy of Sciences, 690041 Vladivostok, Russia
2
Laboratory of the Arctic Land Shelf Interaction, Tomsk State University, 634050 Tomsk, Russia
3
Institute of Ecology, Higher School of Economics (HSE), 101000 Moscow, Russia
4
Federal Scientific Research Center “Crystallography and Photonics” RAS, Institute of Photon Technologies, 108840 Moscow, Russia
5
School of Earth Sciences and Engineering, Tomsk Polytechnic University, 634050 Tomsk, Russia
6
International Research Center for Ecology and Climate Change, Sirius University of Science and Technology, 354340 Sochi, Russia
“In winter, the flux of CH4 transported by rising bubbles to the bottom water in the shallow part of the ESAS was estimated at ~19 g·m−2 per day, while the flux reaching the water/sea ice interface was calculated as ~15 g·m−2 per day taking into account the diffusion of CH4 in the surrounding water and the enrichment of rising bubbles with nitrogen and oxygen. We suggest that this bubble-transported CH4 flux reaching the water /sea ice interface can be emitted into the atmosphere through numerous ice trenches, leads, and polynyas. This CH4 ebullition value detected at the water/sea ice interface is in the mid high range of CH4 ebullition value estimated for the entire ESAS, and two orders higher than the upper range of CH4 ebullition from the northern thermocarst lakes, which are considered as a significant source to the atmospheric methane budget.”