A change is perhaps even better than a rest? Let’s start February with a reminder that following close behind another recent Arctic cyclone, Storm Ingunn caused red weather warnings for high winds and avalanches in Norway two days ago:

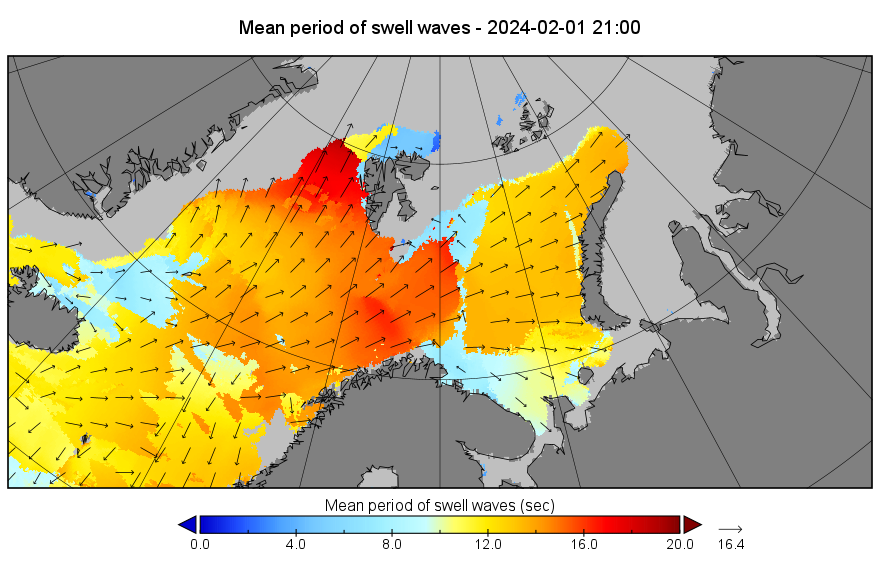
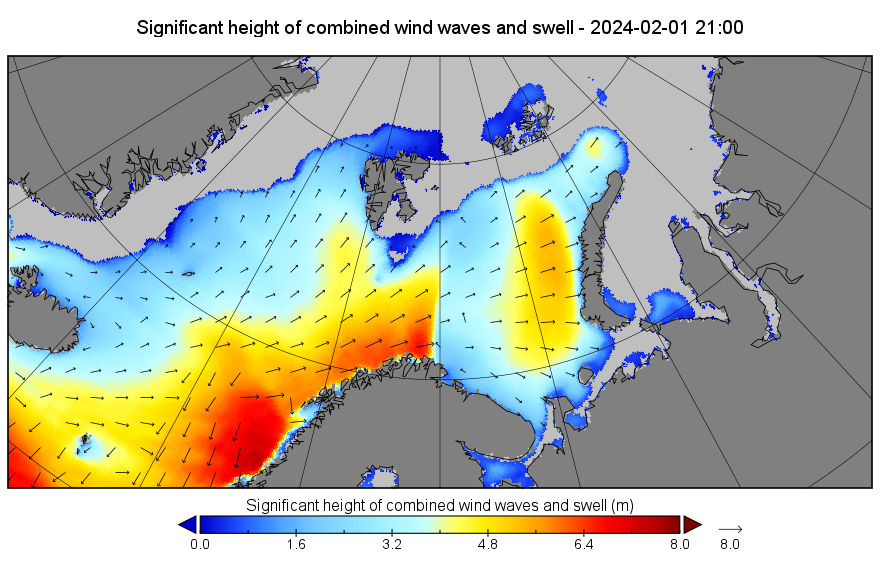
By yesterday evening another long period, storm driven swell was arriving at the sea ice edge in the Fram Strait, and to a lesser extent in the Barents Sea:
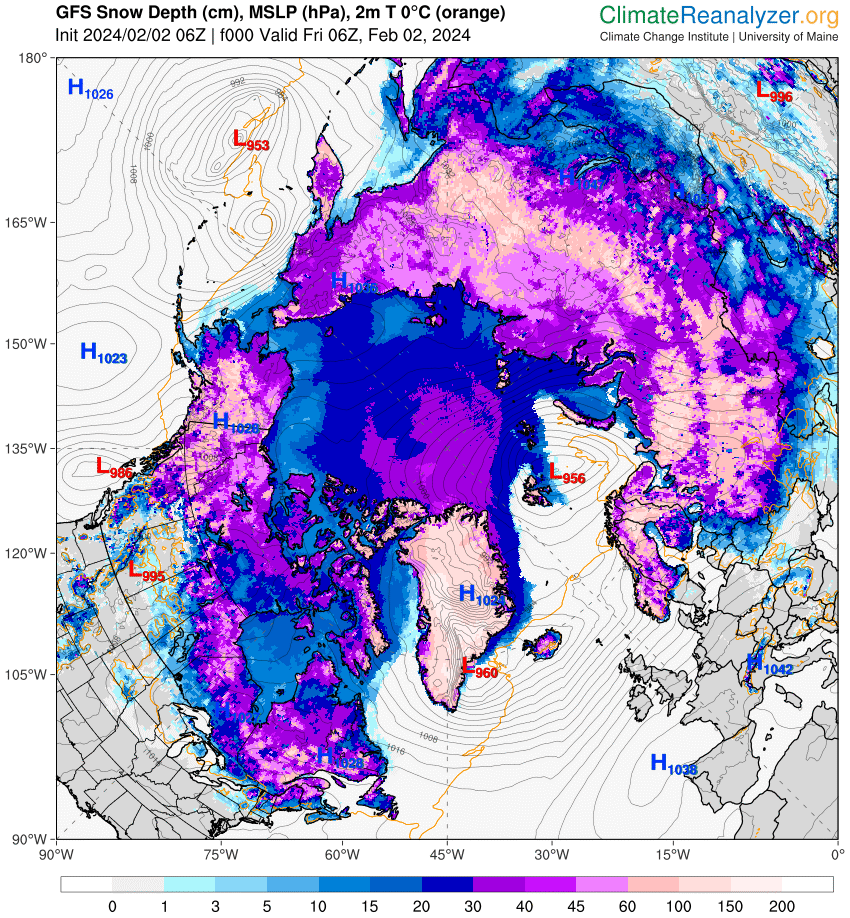
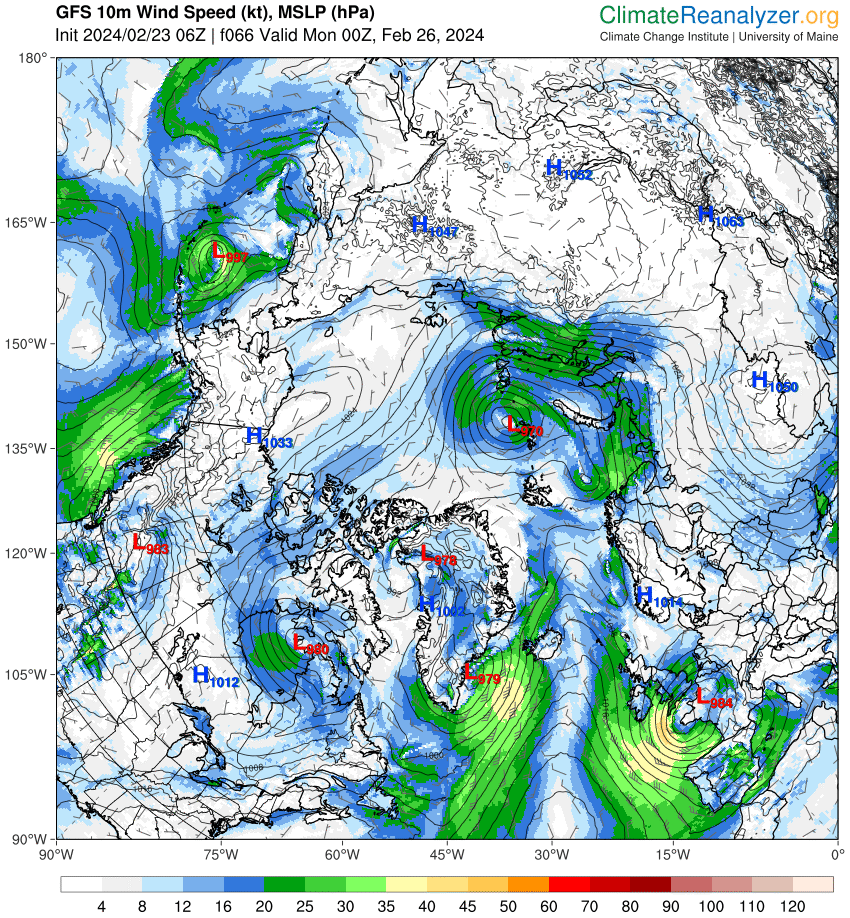
By this morning Ingunn had merged with the remnants of the prior cyclone, as revealed in Climate Reanalyzer’s visualisation of the latest GFS model run::
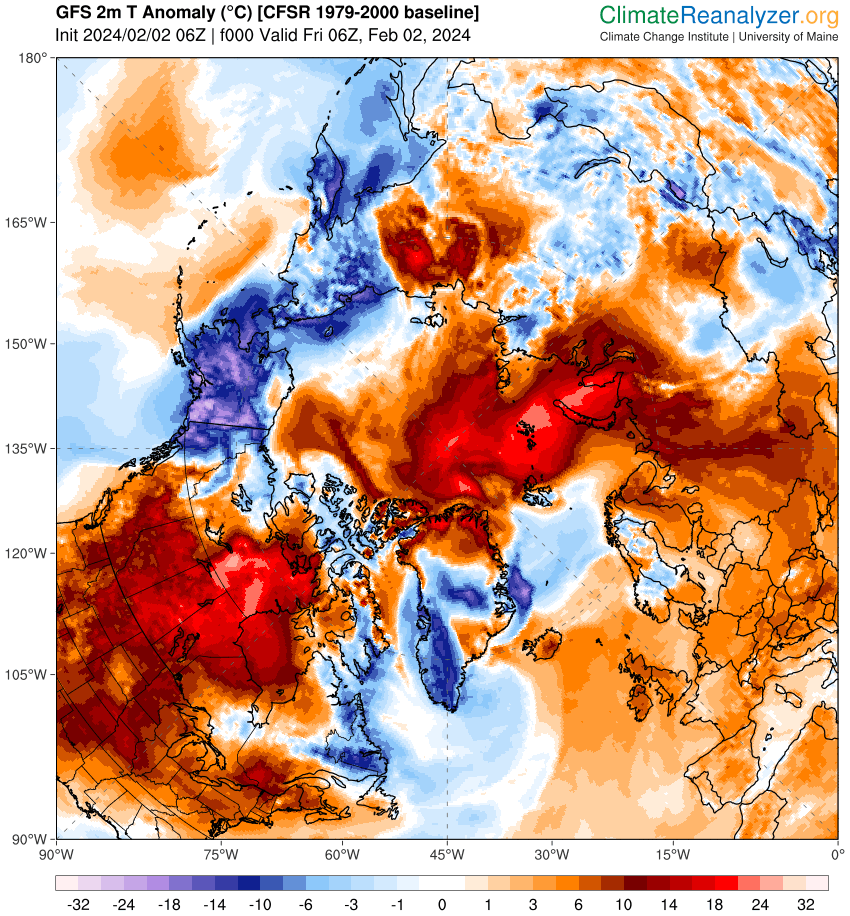
The storms have sucked plenty of anomalously warm air into the central Arctic:
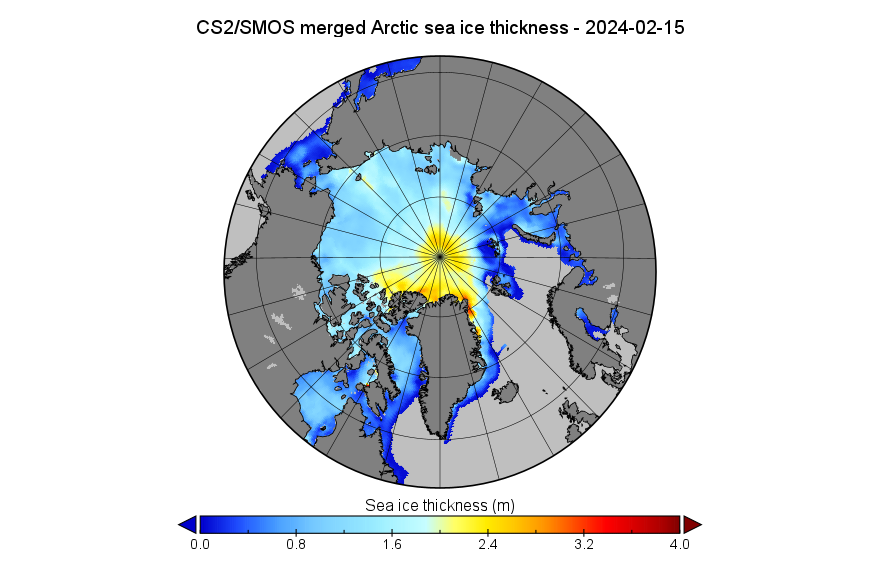
Getting to back to more conventional fare, here is the the CryoSat-2/SMOS thickness map for January 31st in Greenland down orientation:
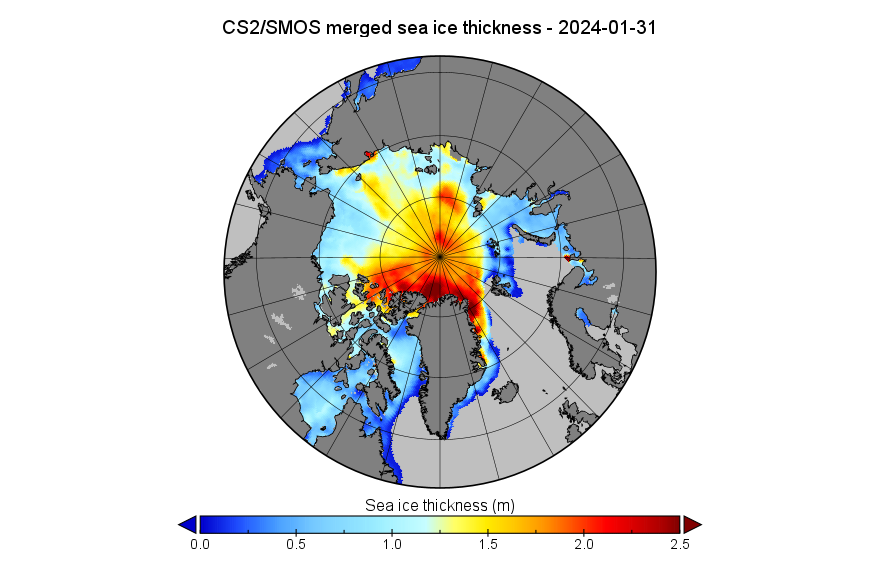
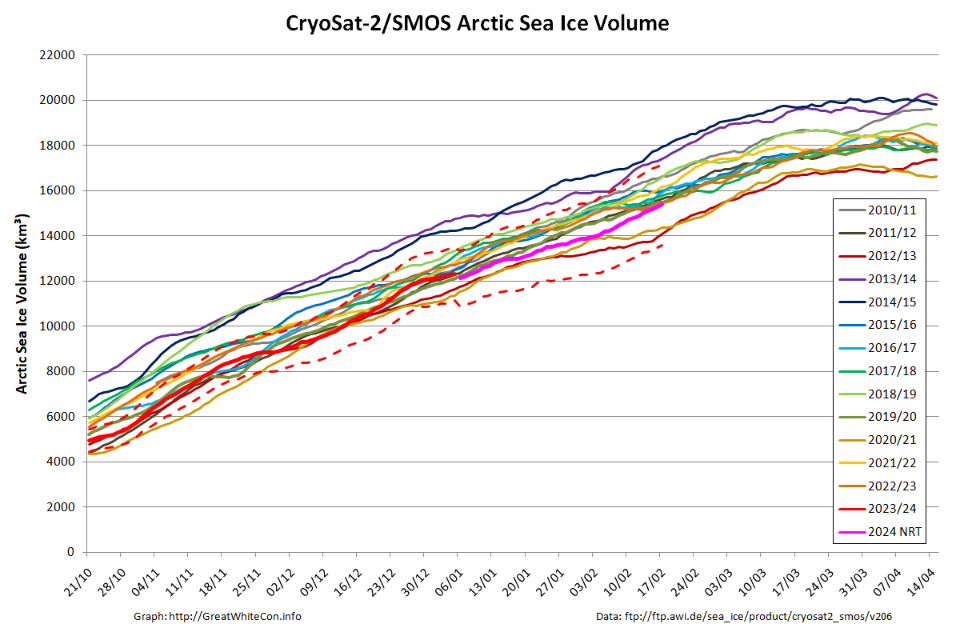
Plus the associated volume graph:
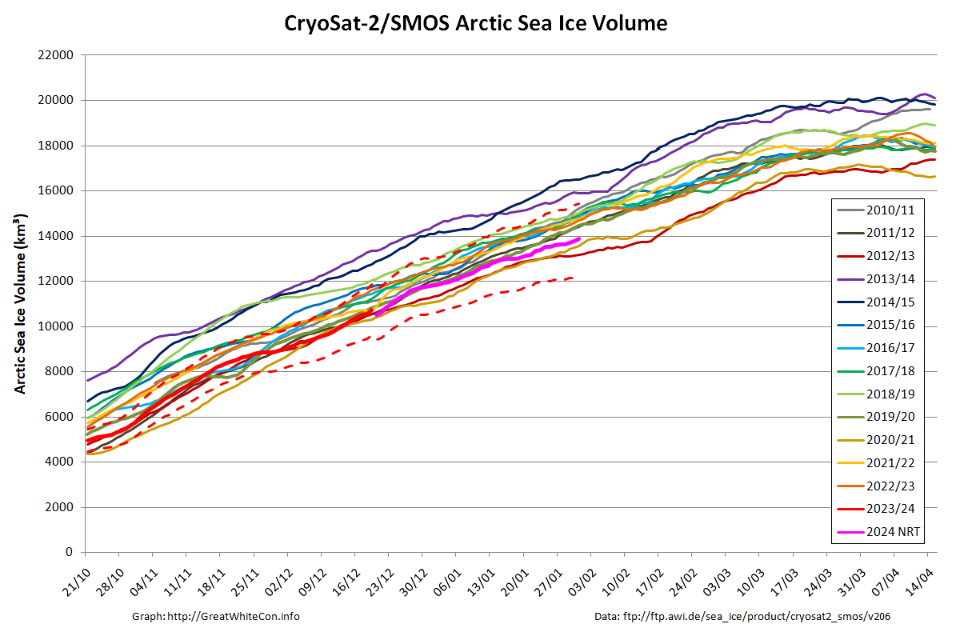
In mid December the reanalysed volume was briefly lowest for the date in the CryoSat-2 era. Currently the near real time numbers are still close to the bottom of the range.
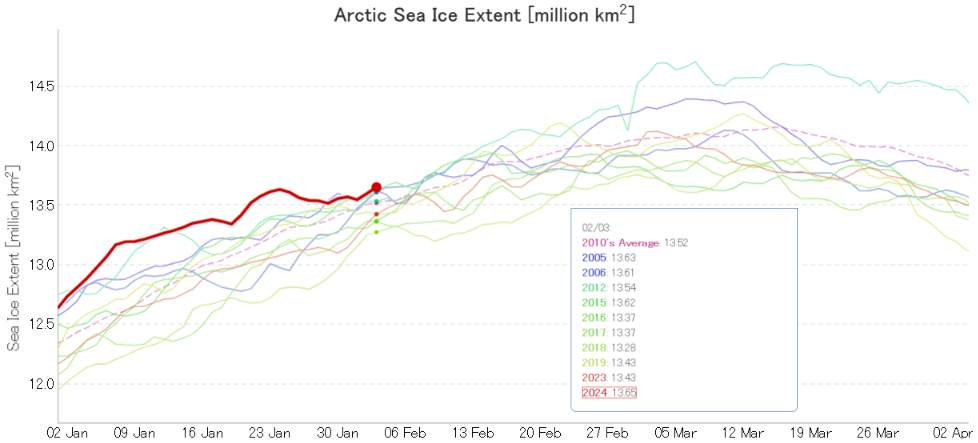
[Update – February 4th]After flatlining for a couple of weeks, JAXA extent has just reached a new maximum for the winter:
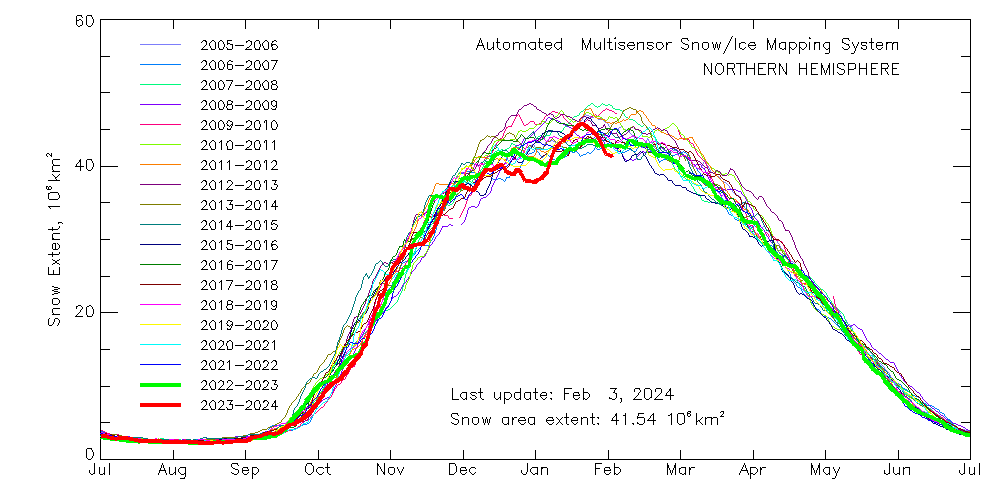
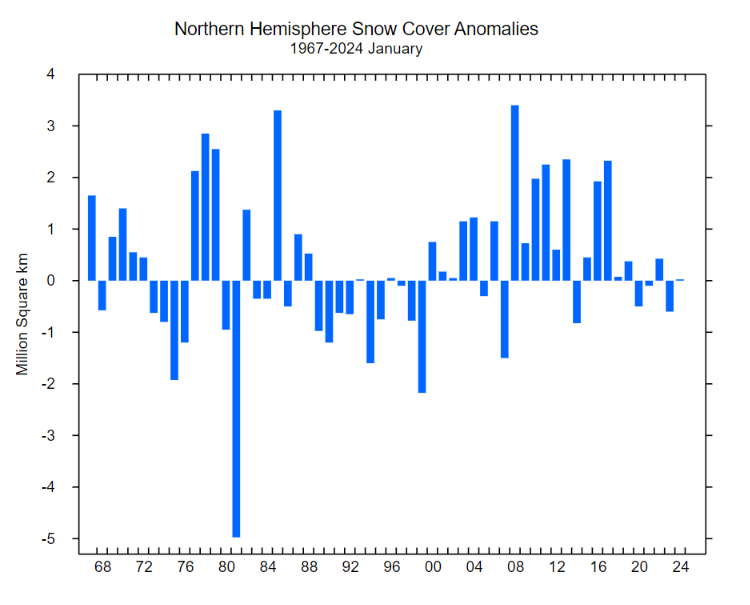
Especially for Matt, Northern Hemisphere snow extent has taken a bit of a tumble recently:
Here too is the latest AMSR2 update on recent sea ice motion on the Atlantic periphery of the Arctic Ocean:

The overall anti-clockwise motion has resulted in breakup of the usually fast ice in the Vilkitsky Strait, and plenty of thick ice exported from the central Arctic via the Fram Strait
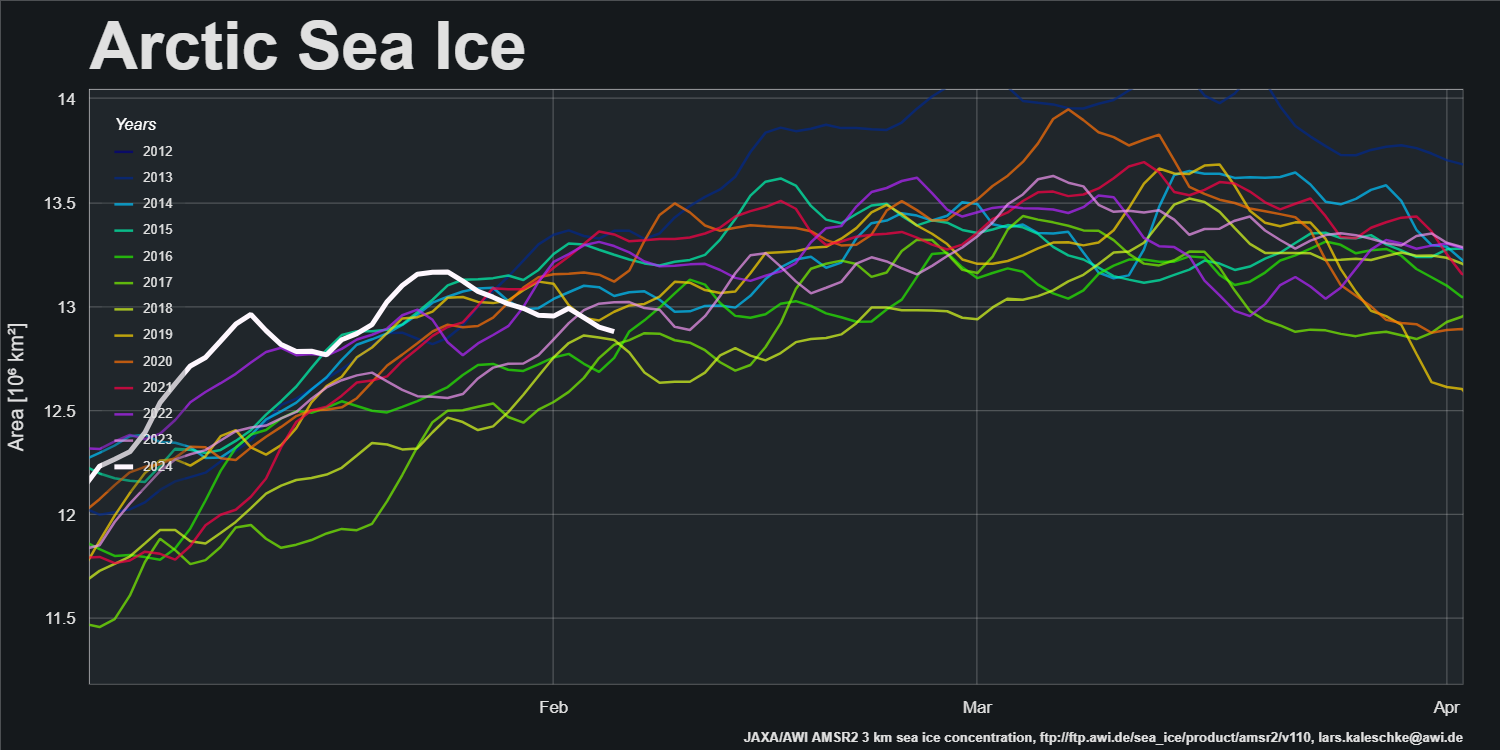
[Update – February 6th]In an intriguing divergence, AWI’s high resolution AMSR2 pan Arctic sea ice area is declining even as extent makes new highs for this winter:
The PIOMAS gridded thickness data for January 2024 has been released. Here’s the calculated Arctic sea ice volume graph:
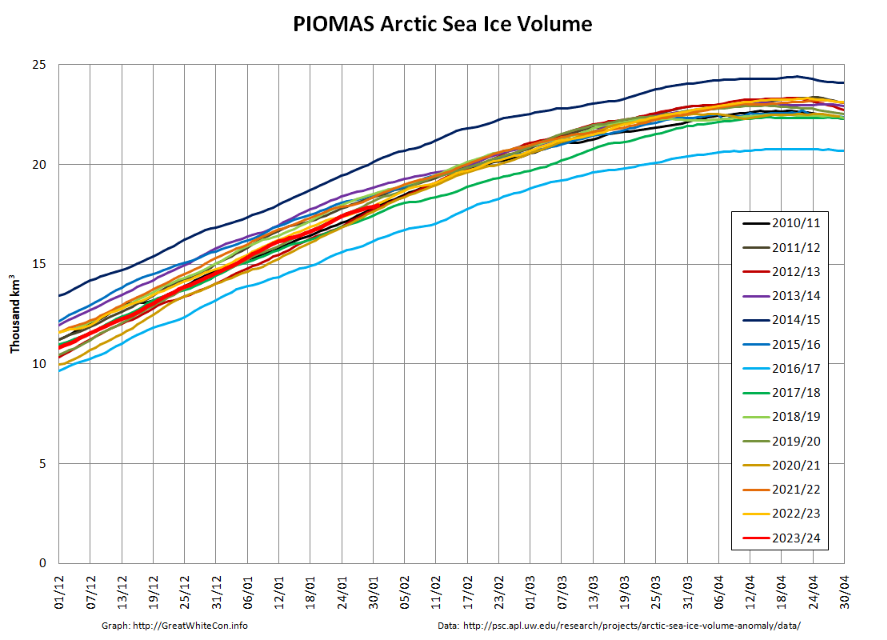
Volume is 6th lowest for the date in the PIOMAS record going back to 1979. Here’s the associated end of month thickness map:
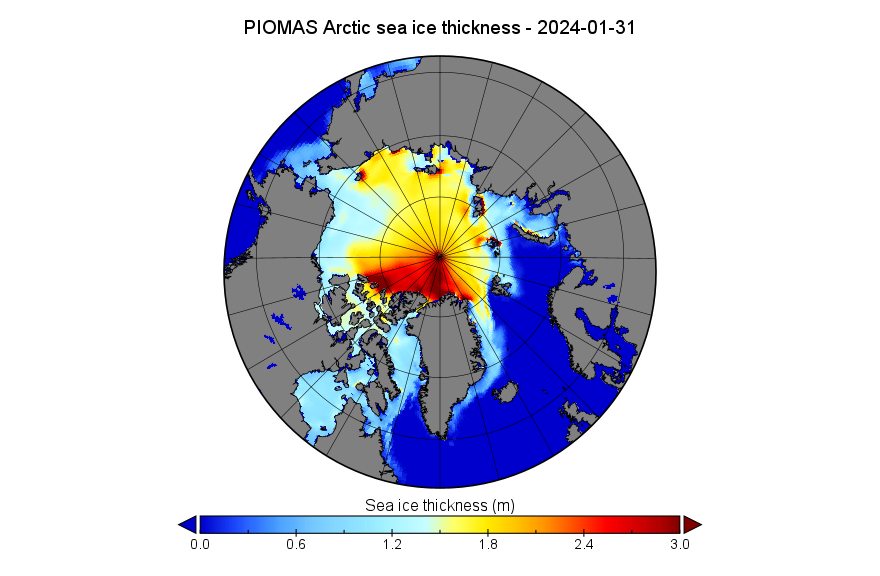
Much like the CryoSat-2/SMAP map above, this one also currently lacks the band of thicker ice that is usually advected into the Beaufort Sea by the Beaufort Gyre over winter. Note the difference in the scales.
Here too is the Rutgers Global Snow Lab anomaly chart for January:
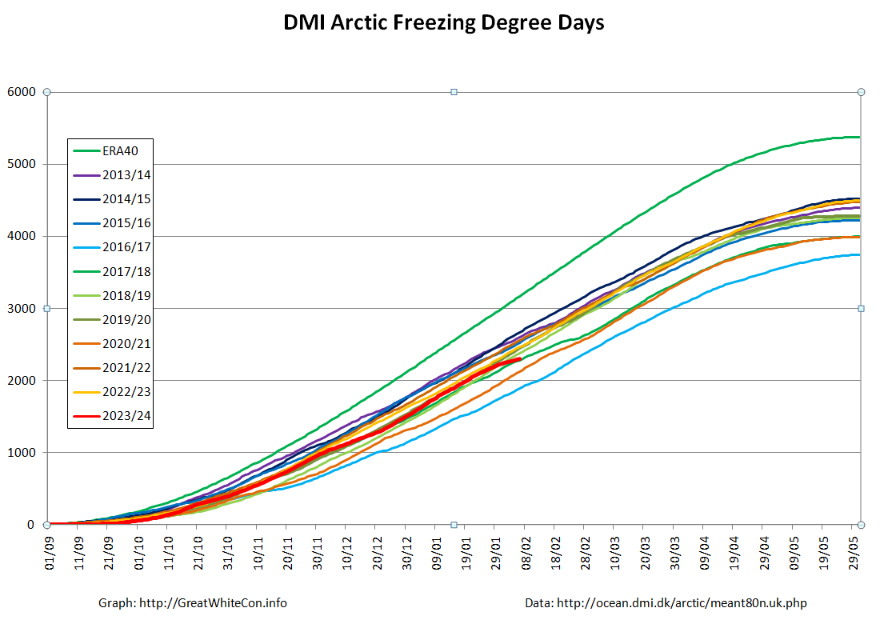
DMI have got back to me! Spot the slow down:
The National Snow and Ice Data Center have published the latest edition of their Arctic Sea Ice News. Especially for Peter, here’s the perennial monthly extent trend graph:
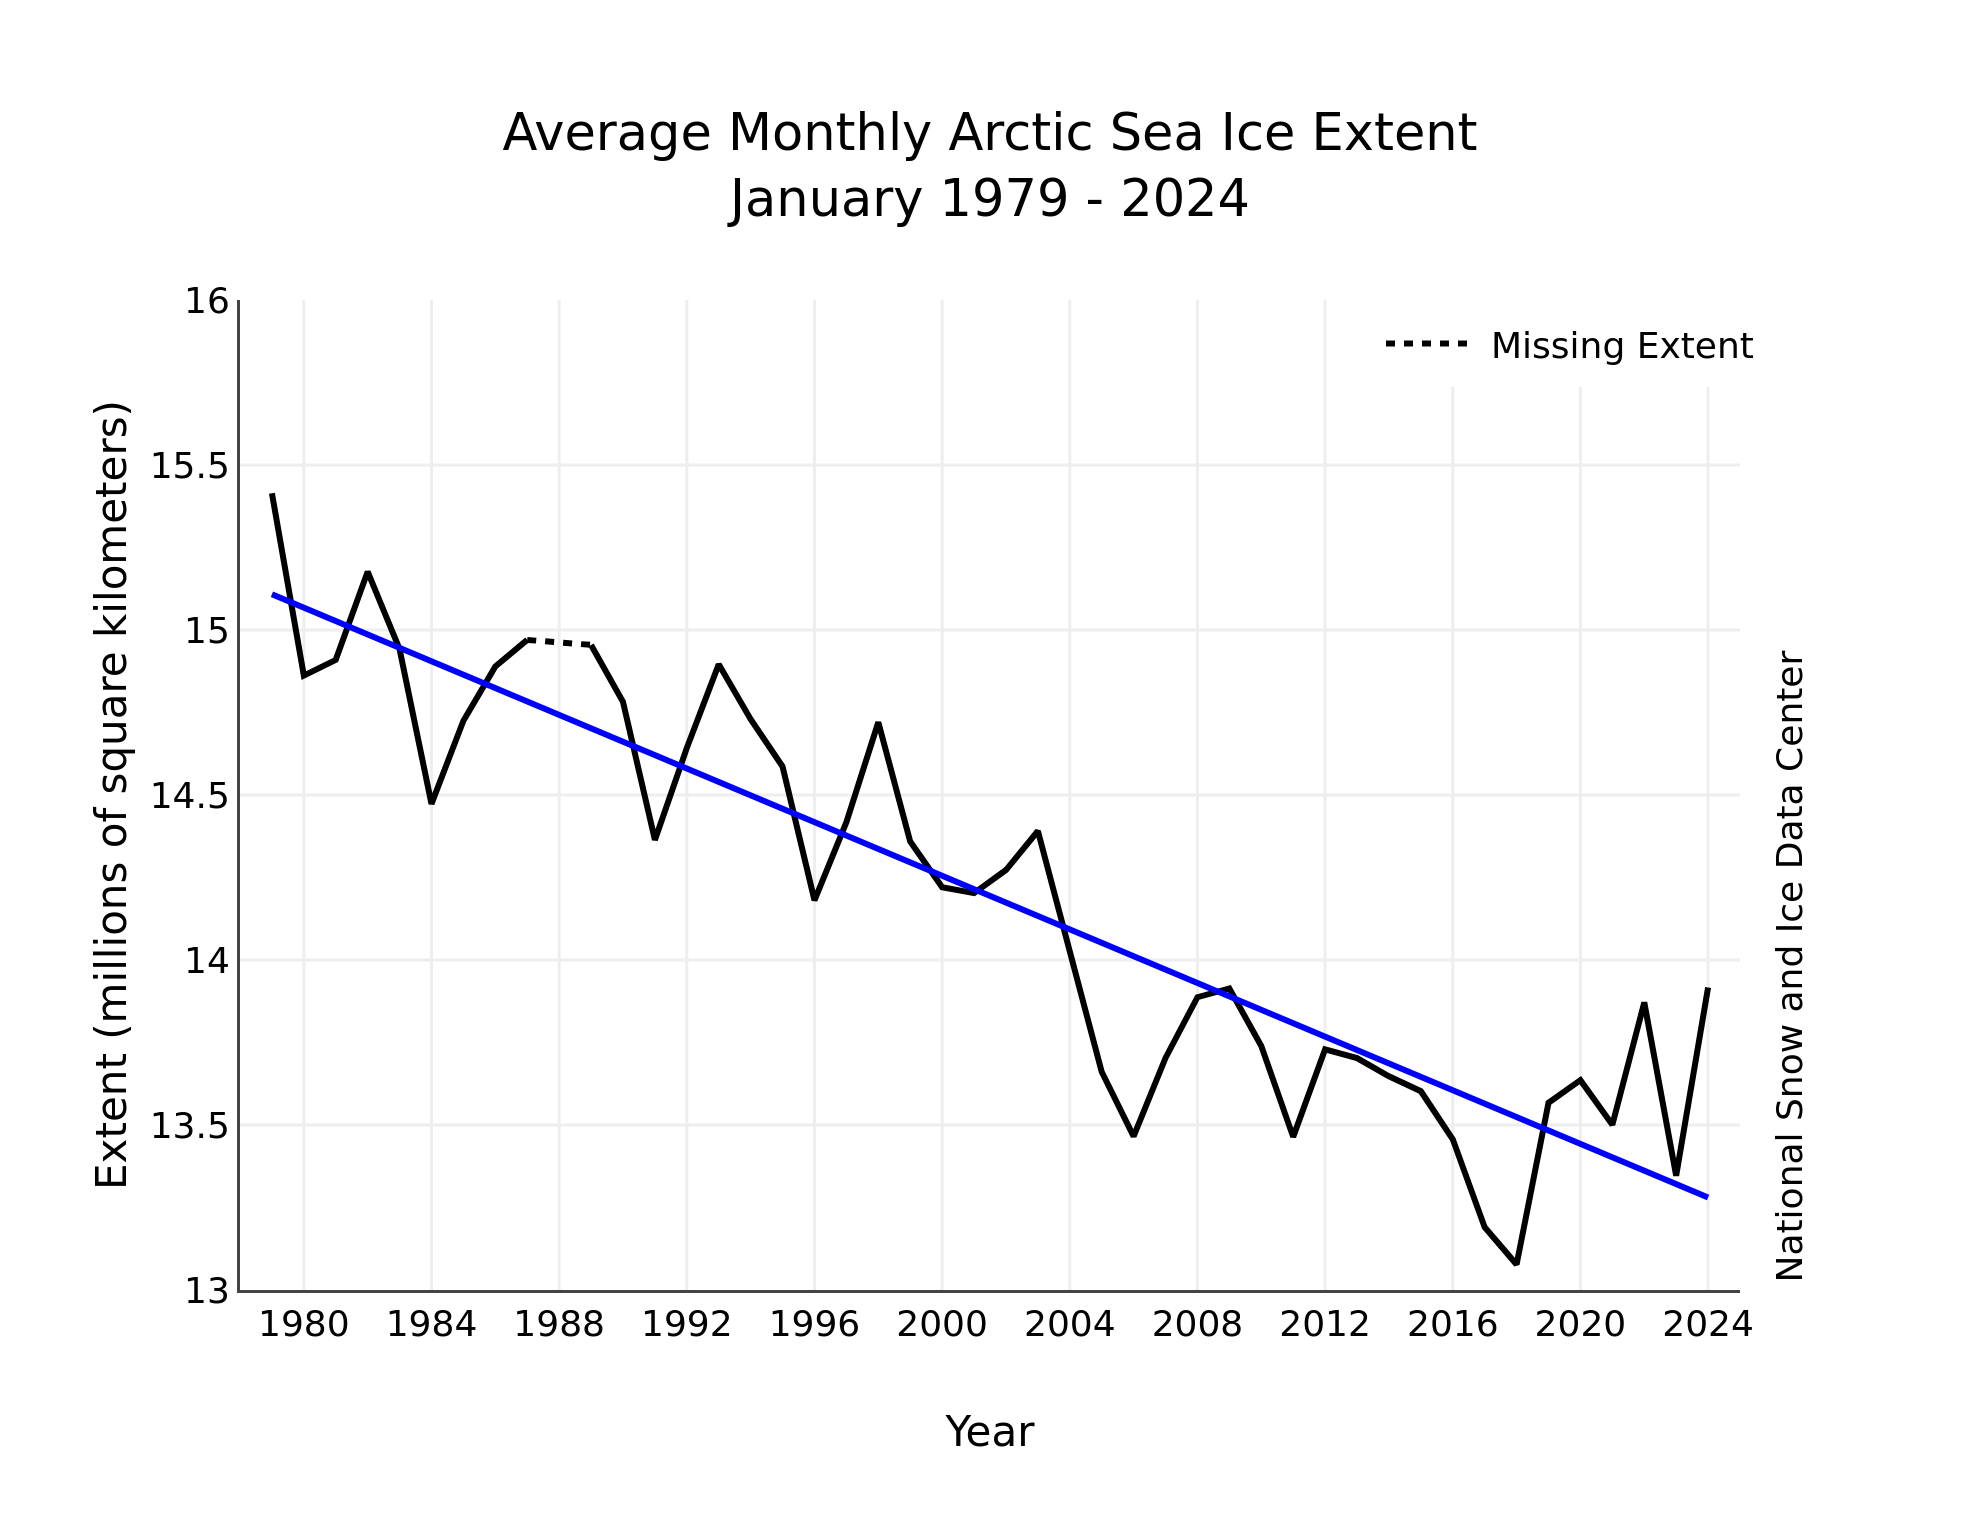
The so called “skeptics” are probably already salivating over that image! However I’m willing to bet a thousand pretend pounds (UK political in joke!) that they won’t publish this map as well:
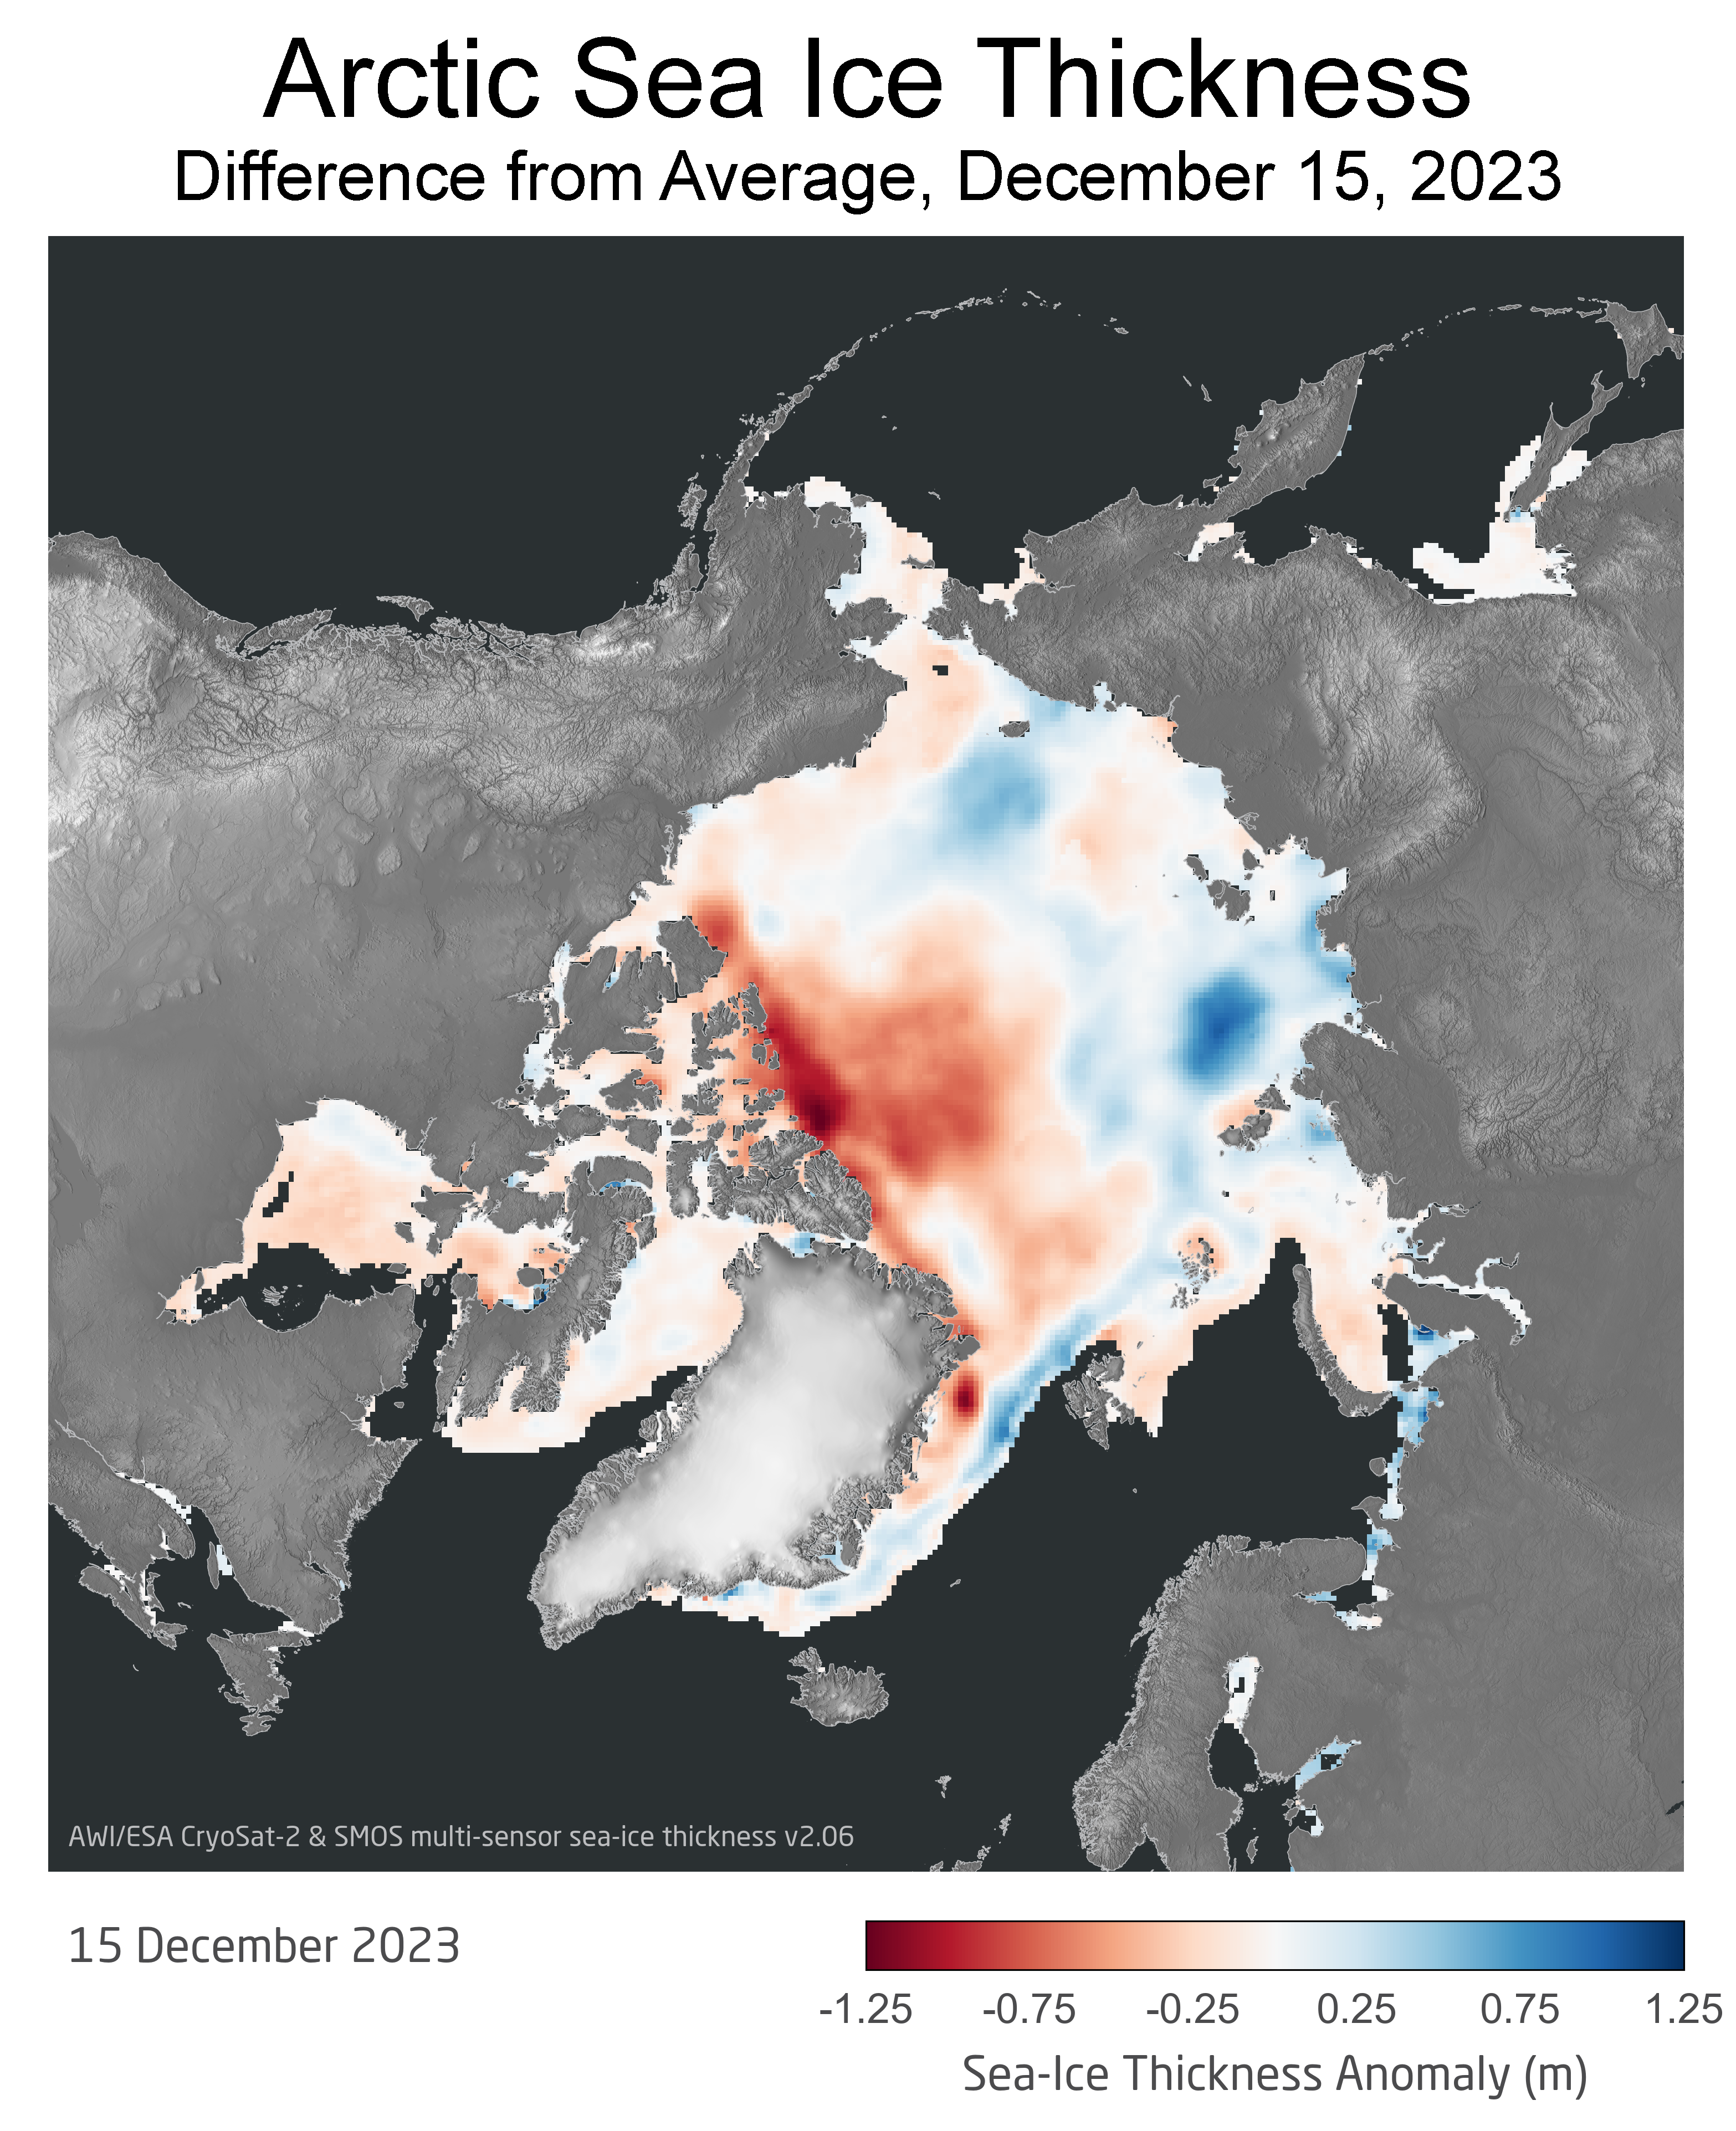
They won’t publish these two images from the NSIDC update either, not least because they haven’t got the faintest inkling of what they mean:
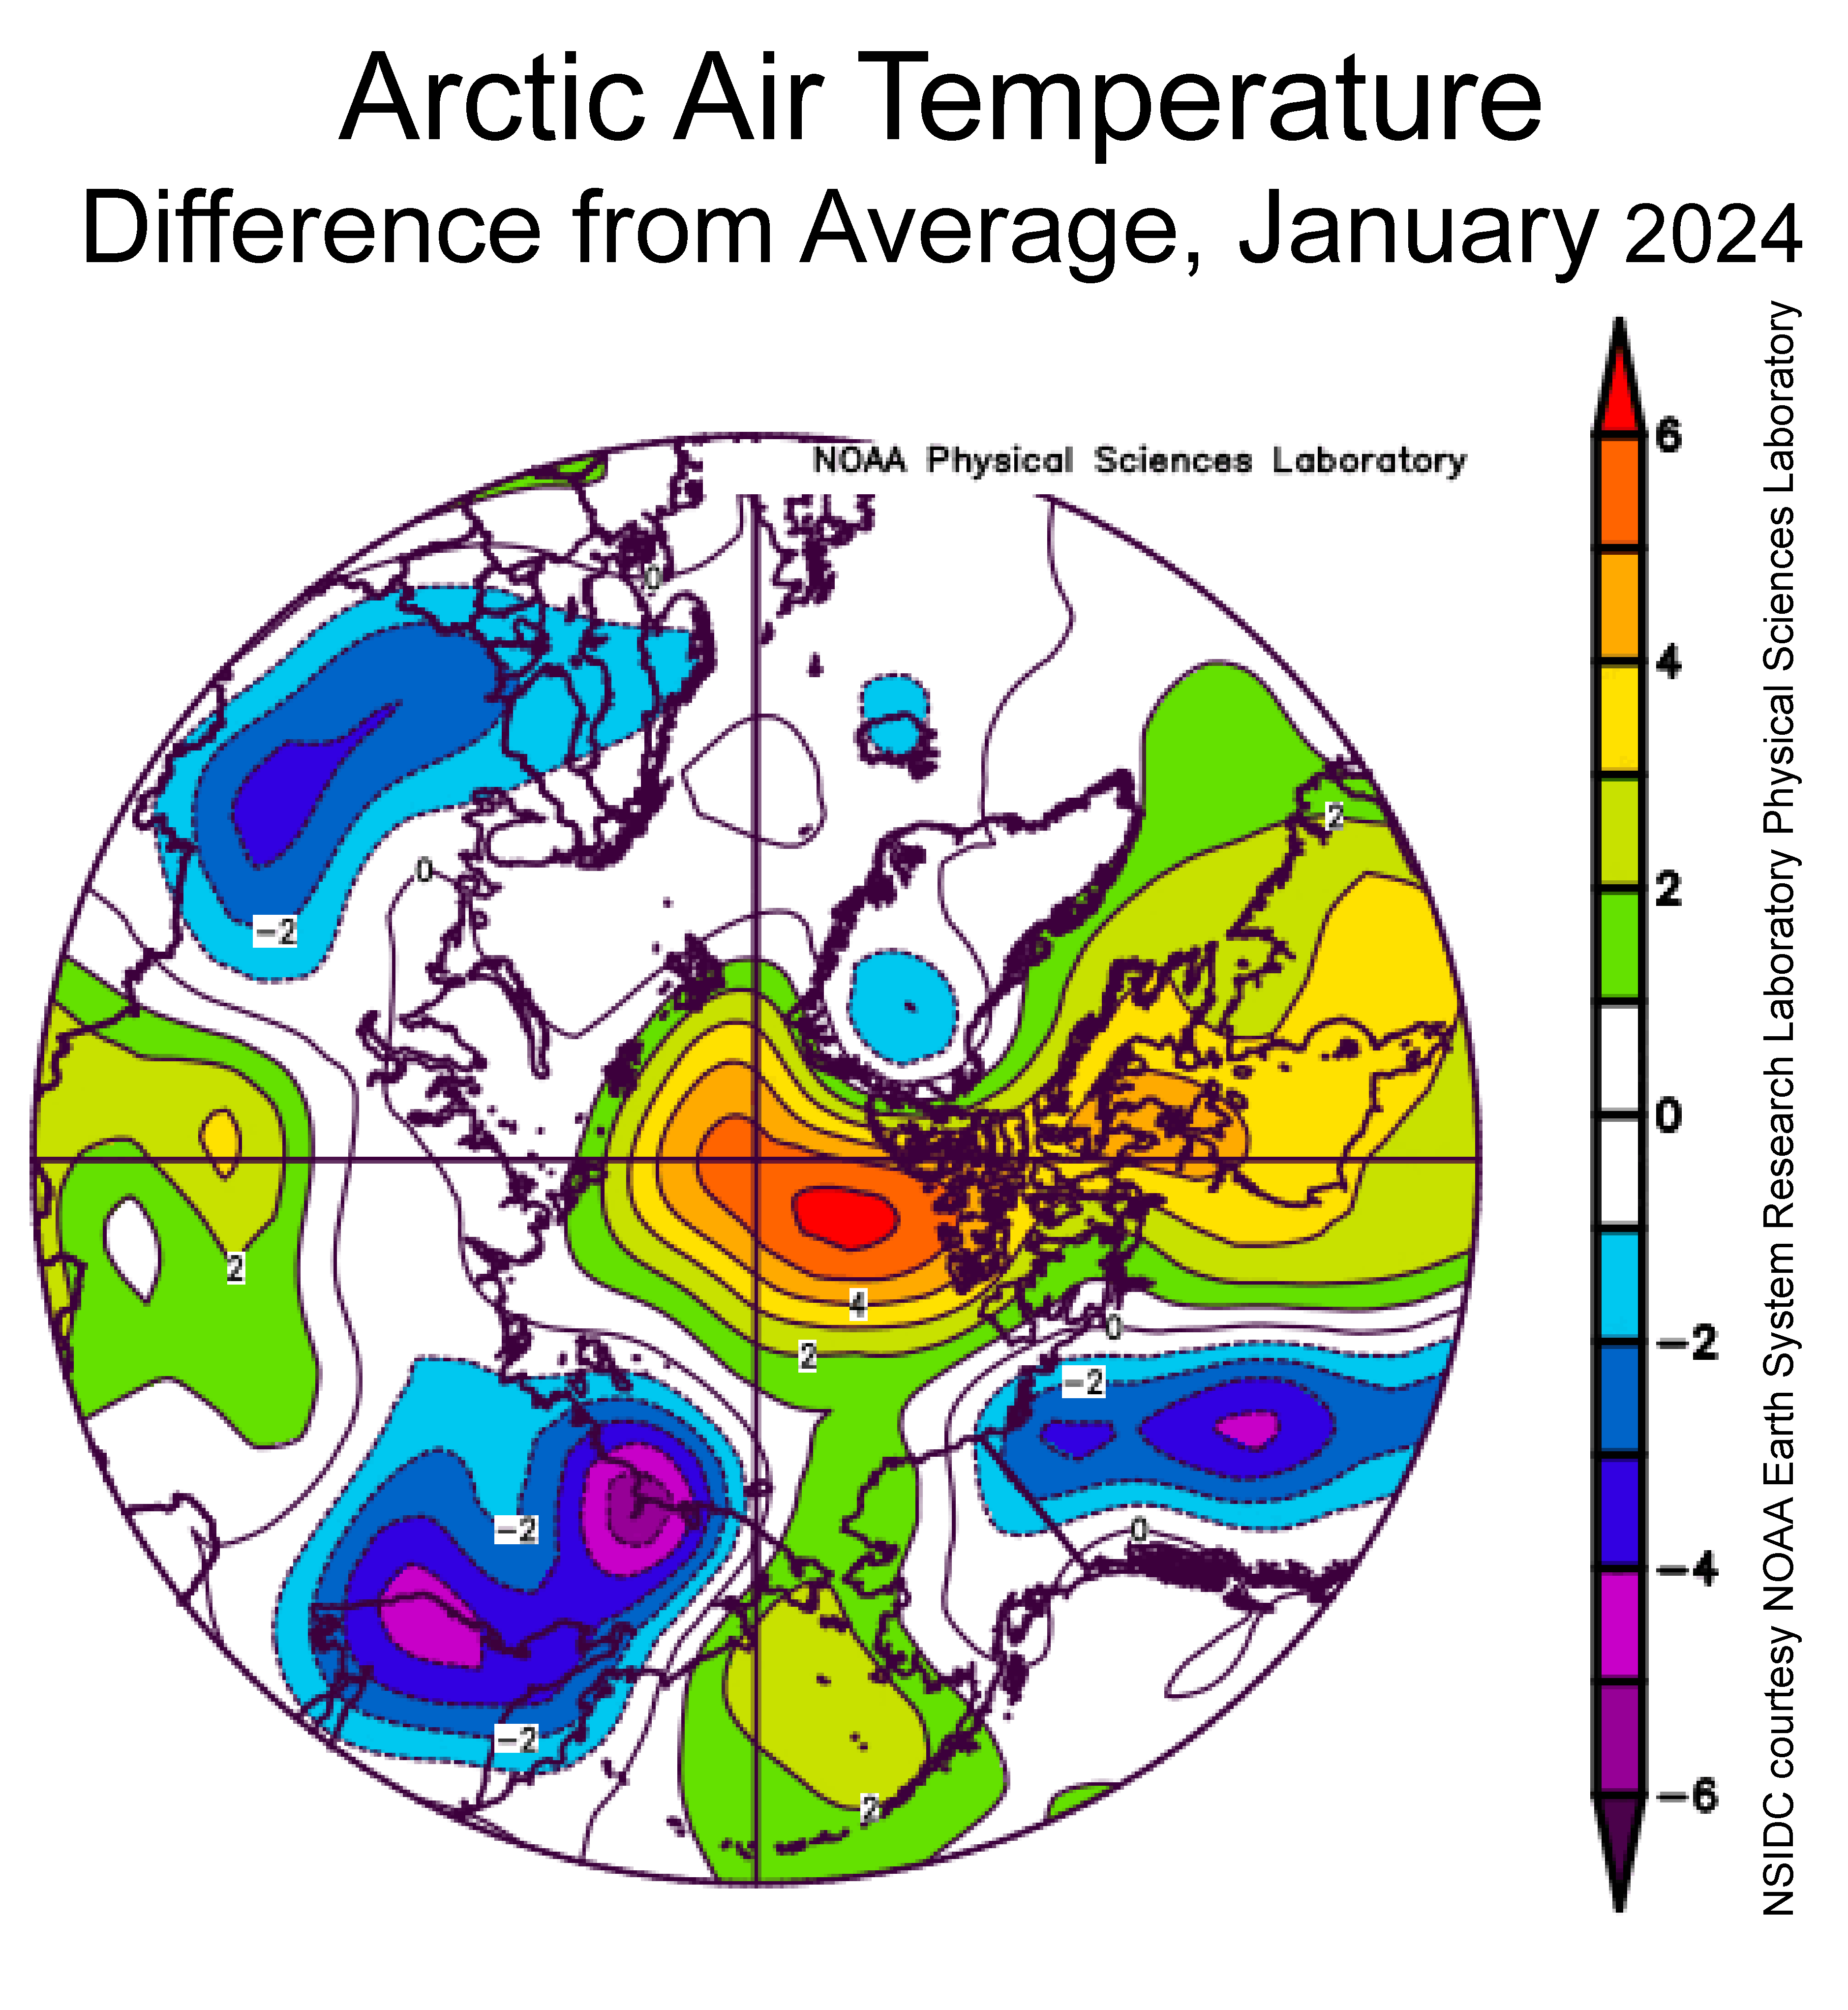
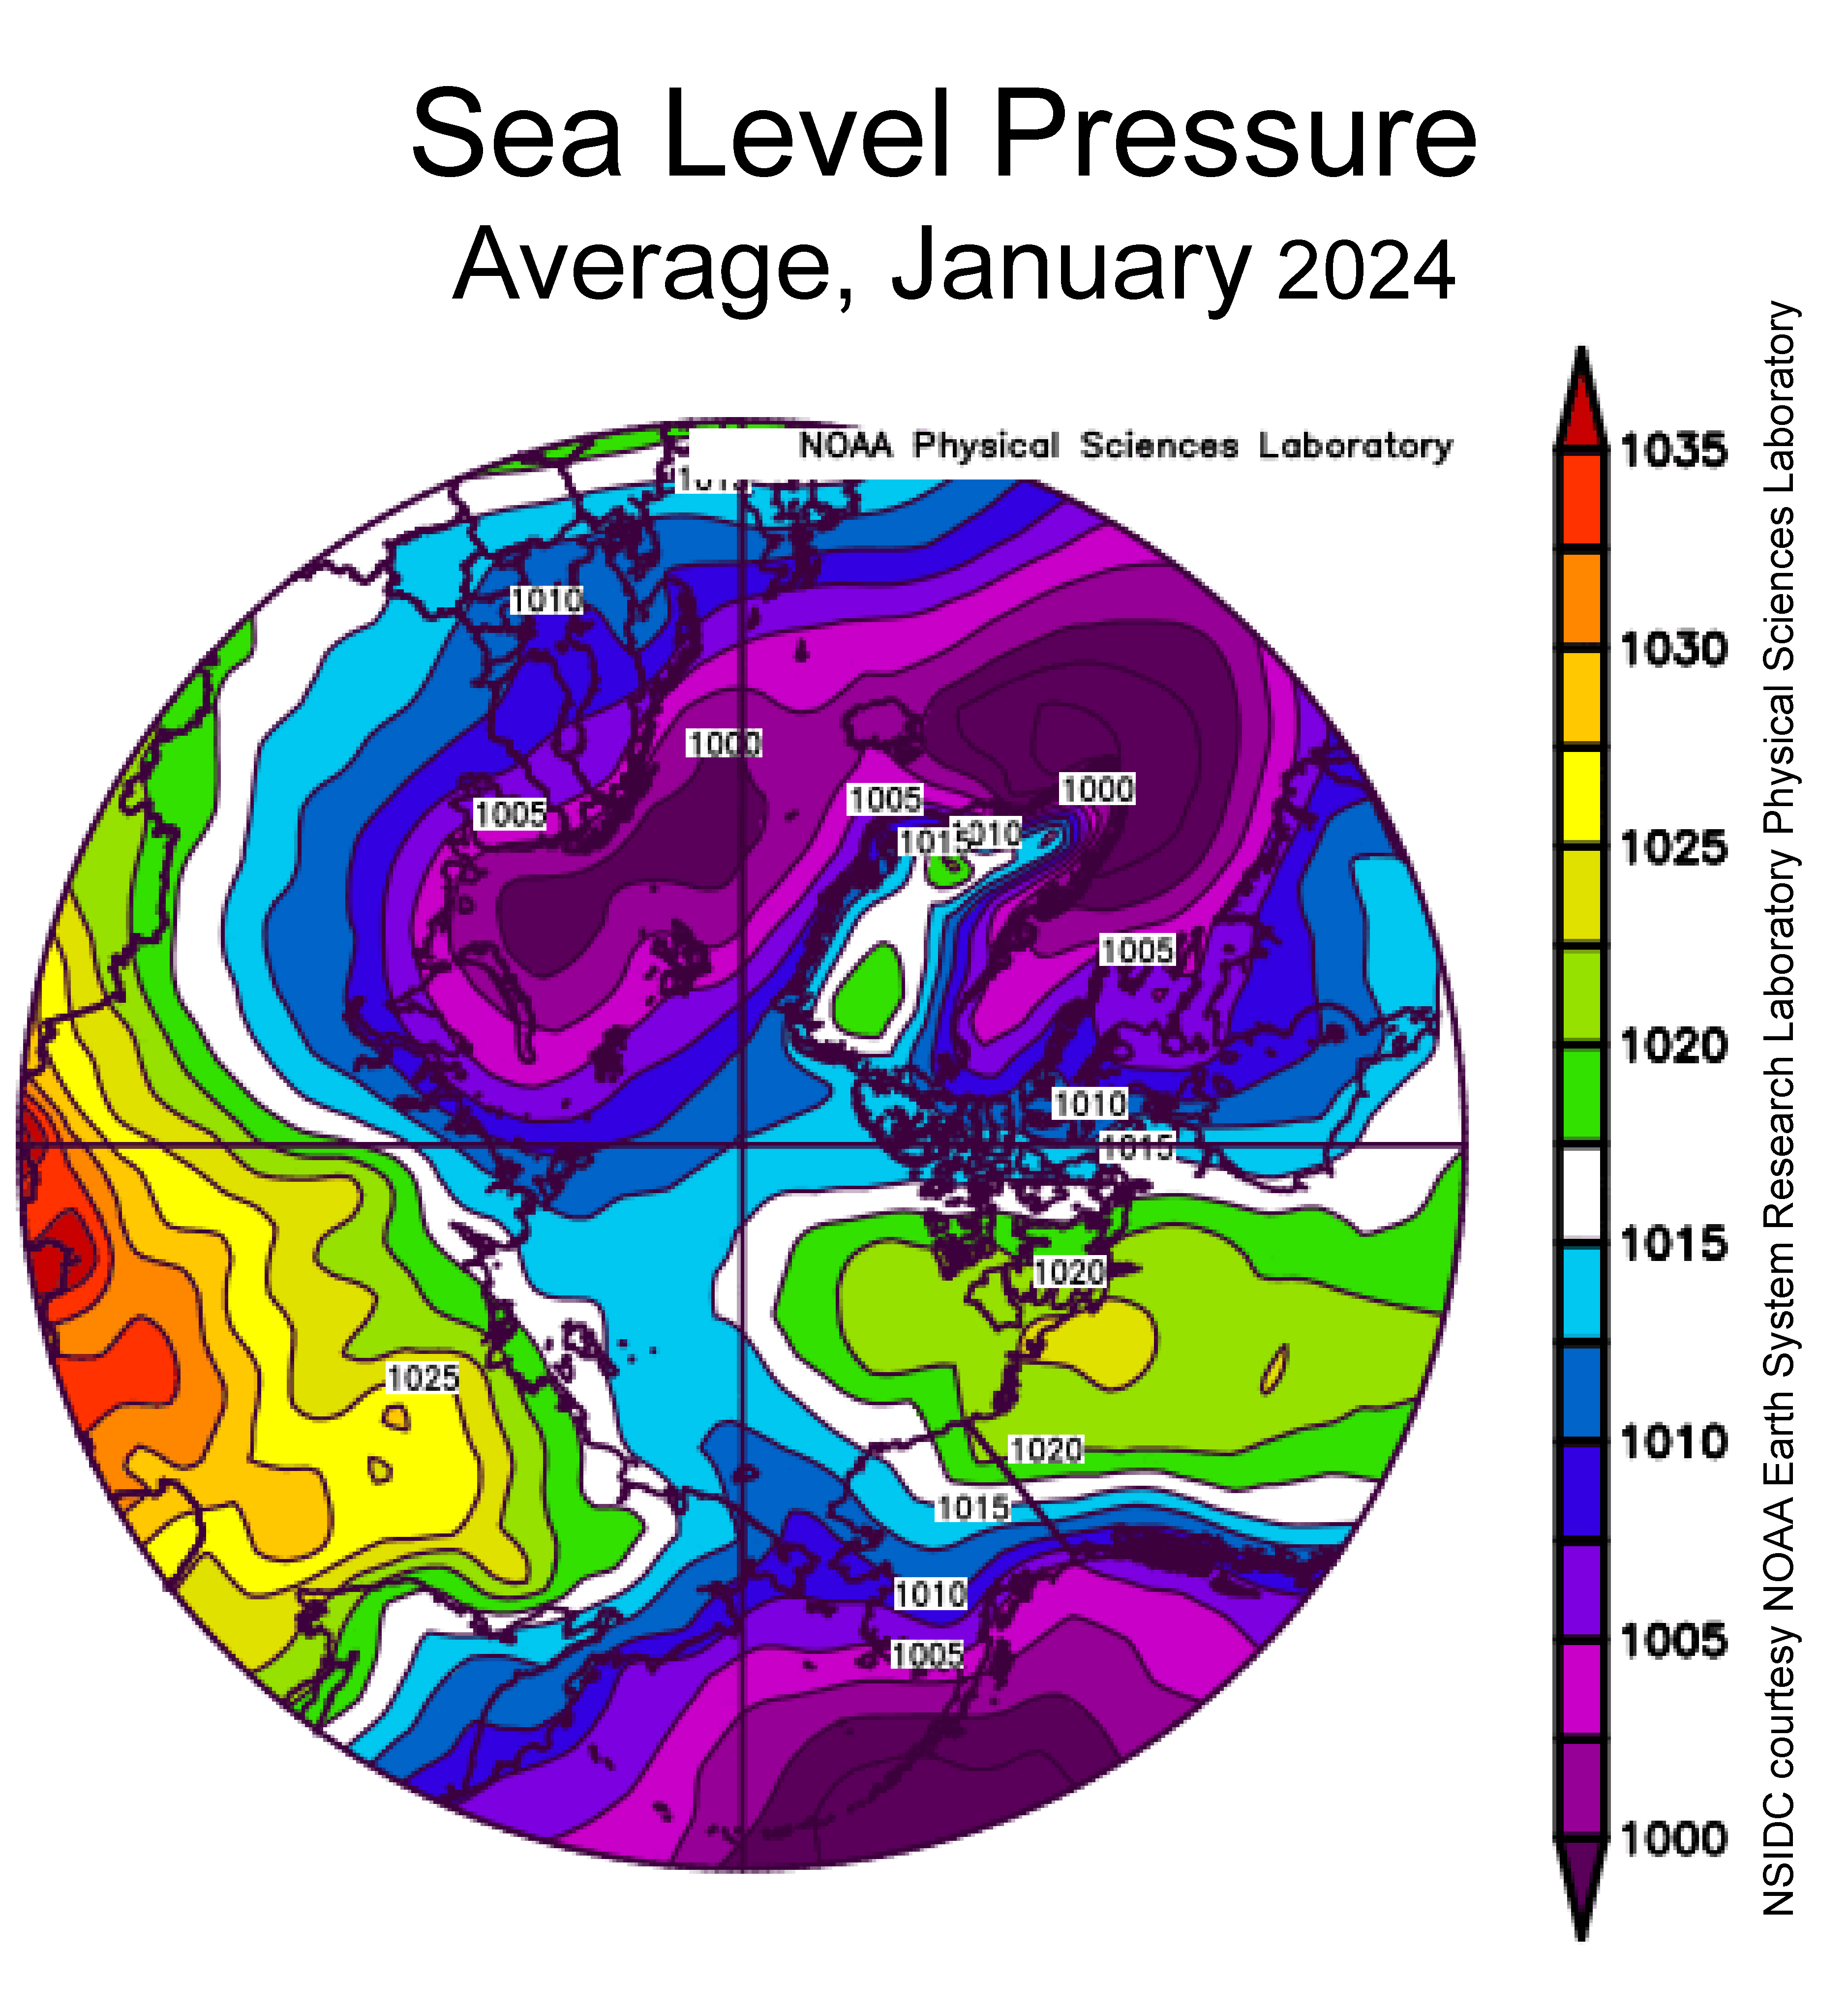
The NSIDC explain that:
Overall, it was relatively warm over the Arctic Ocean during January. Air temperatures at the 925 millibar level (about 2,500 feet above sea level) were up to 6 degrees Celsius above average over the central Arctic Ocean and the Canadian Archipelago. Air temperatures in the Bering Sea were 2 to 3 degrees Celsius above average. It was slightly cooler than average over the East Siberian Sea.
The sea level pressure pattern was characterized by low pressure over the Barents and Bering Seas and a saddle of relatively high pressure extending from Eastern Siberia across the Arctic Ocean into northwestern Canada. Overall, pressure gradients were not particularly strong, indicating slack winds.
The winds have picked up a bit since!
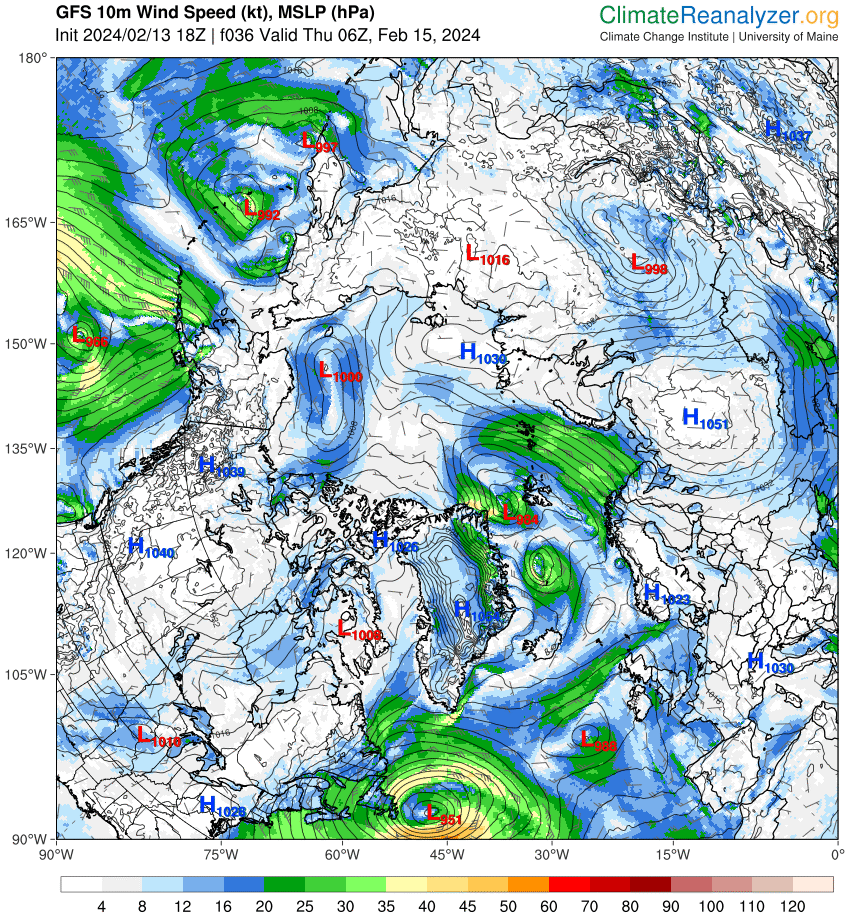
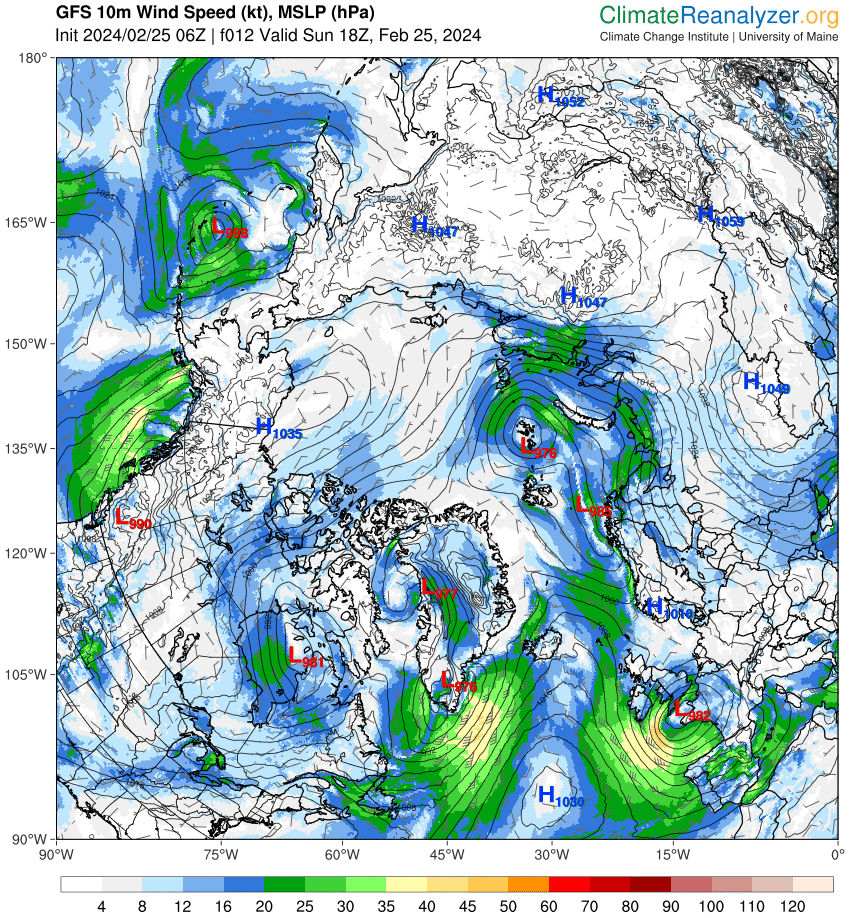
[Update – February 13th]Although they are nothing like as strong as the recent cyclones, a series of storms are currently forecast to hit the Fram Strait over the next few days. Here’s the GFS wind forecast for Thursday morning:
Here too is an update on the motion of sea ice on the Atlantic periphery, in the comparative calm before the inclement weather returns once again. Click to animate:
As well as the obvious open water created north of Svalbard and Franz Josef Land note the Odden Ice Tongue apparently flashing into and out of existence north of Iceland.
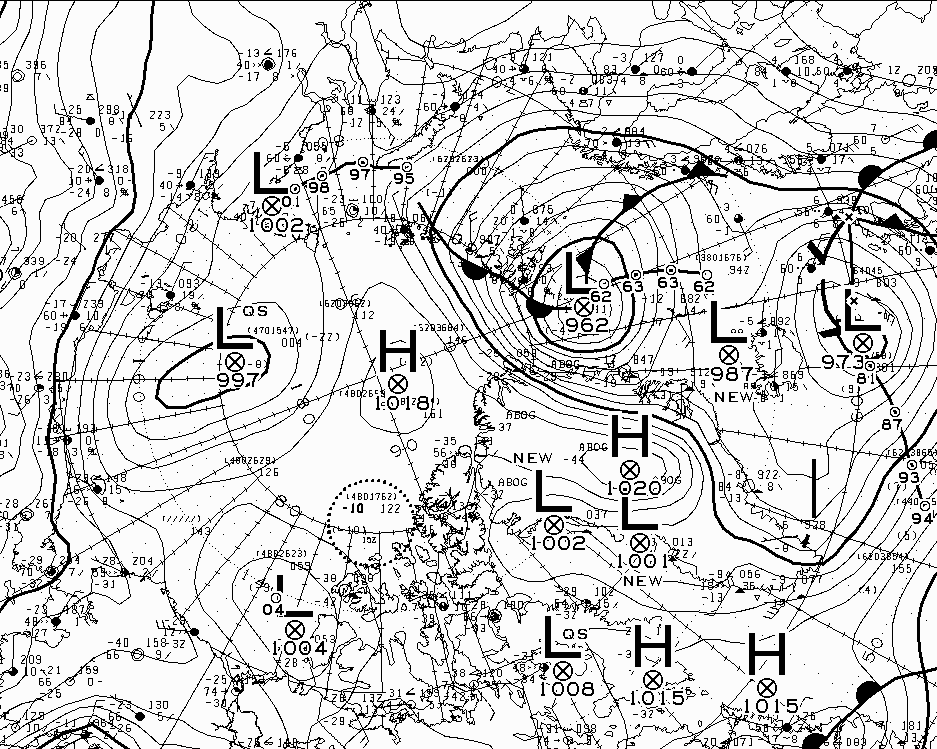
[Update – February 15th]According to Environment Canada the most recent Fram Strait storm bottomed out with an MSLP of 987 hPa earlier today:
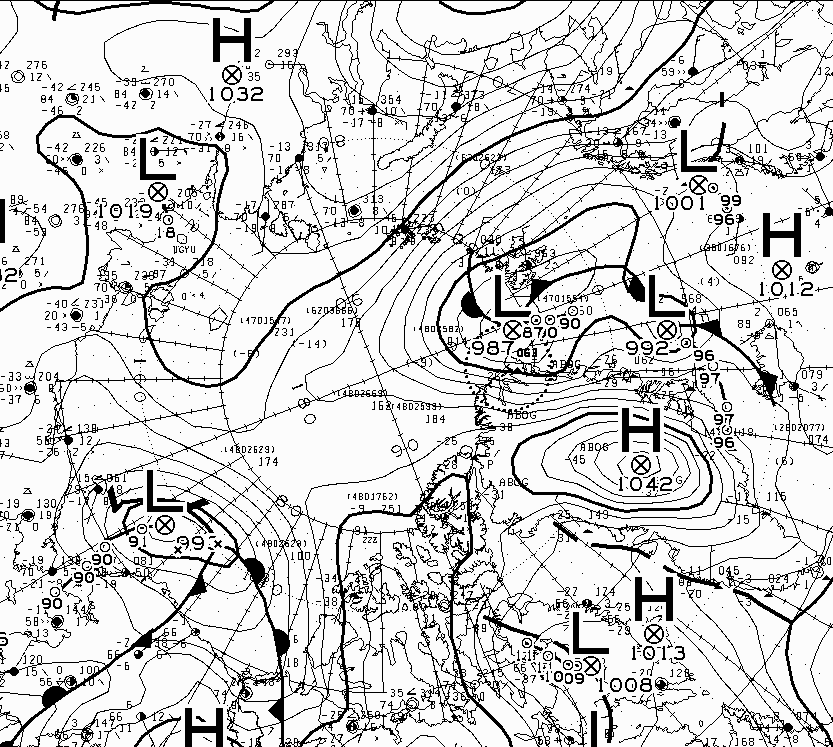
Not a patch on Cyclone Ingunn et al., but not insignificant nevertheless.
Meanwhile in related news, over on Ron Clutz’s “Science (Doesn’t) Matters” blog I attempted to wave hello to Neil but for some strange reason he hasn’t waved back yet:
For further news about “Snow White’s” adventures in the denialosphere see also “Will the AMO Save Arctic Sea Ice?“.
[Update – February 19th]Spring is coming, and the sun has risen over the Chukchi Sea. Here is a fairly clear satellite image of the region:
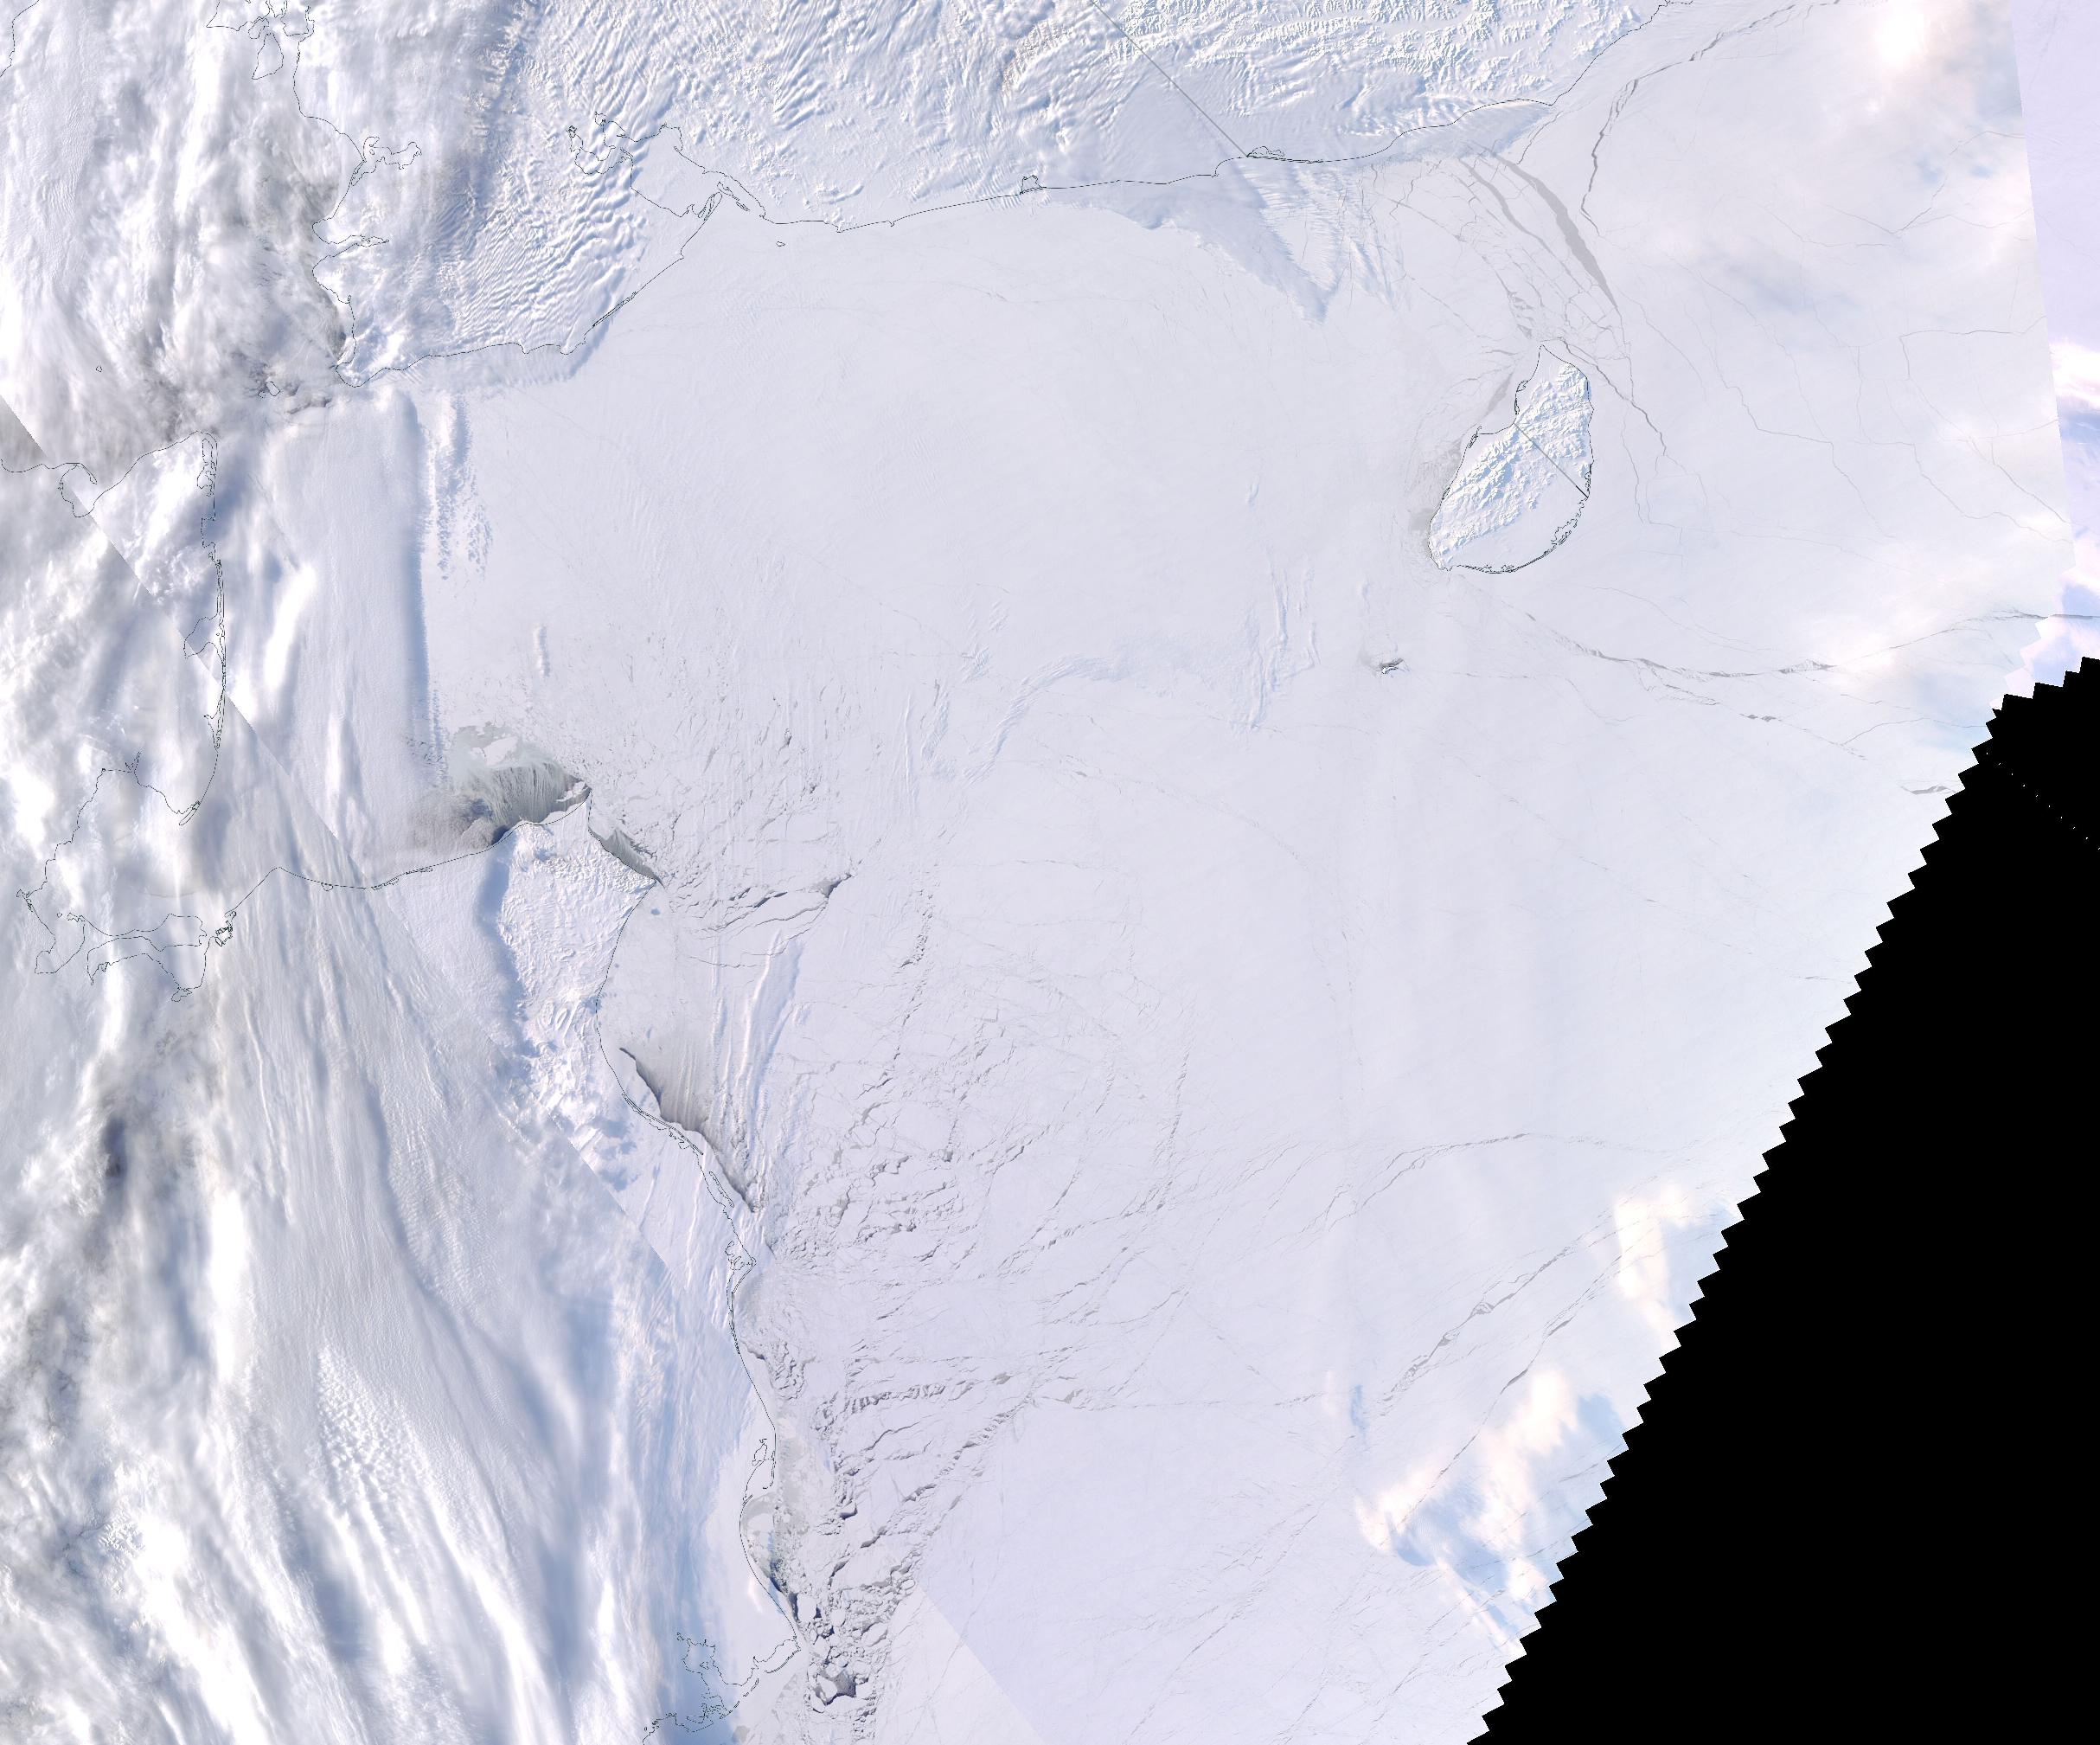
There’s plenty of evidence of recent open water along the coast of Alaska.
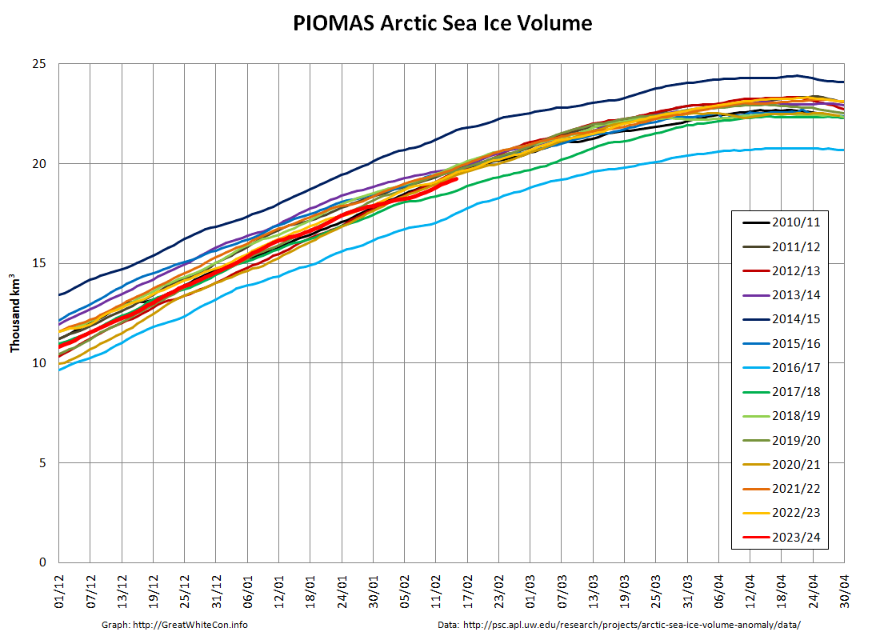
In other news, the mid month PIOMAS gridded thickness data has been released. Volume is currently 3rd lowest in the post 1979 record:
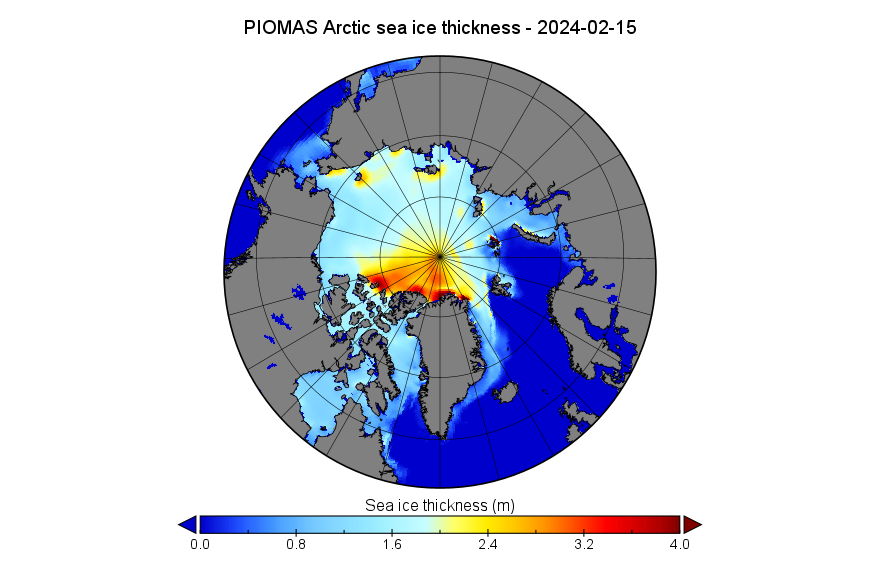
The PIOMAS thickness map reinforces this year’s remarkable lack of old, thick ice advected into the Beaufort and Chukchi Seas by the Beaufort Gyre:
For comparison purposes, here are the mid month CryoSat-2/SMOS “measured” equivalents:
Yet another storm is forecast to hit the Atlantic periphery. This one is directed more towards the Barents Sea, and is currently forecast by GFS to achieve a minimum MSLP of 970 hPa by midnight on Sunday:
GFS has backed off on the depth of the latest Arctic low:
Let’s see how the forecast for the next one fares?
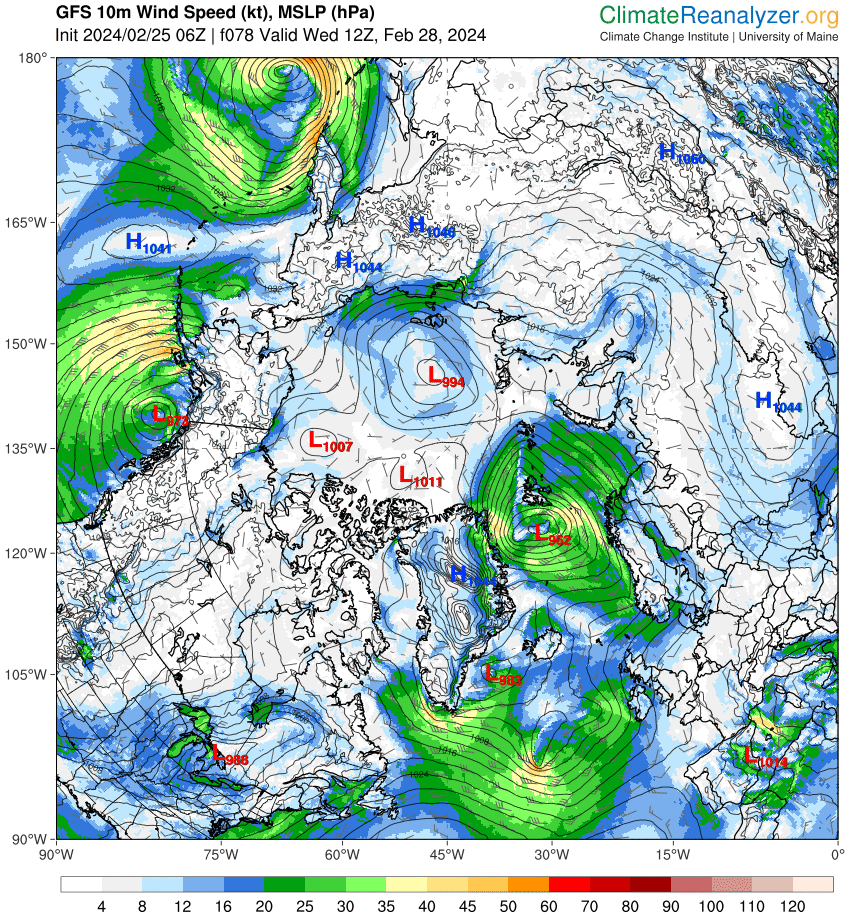
The latest Arctic cyclone has bottomed out in the Fram Strait with an MSLP of 962 hPa:
The conversation continues over on the March open thread.
arctic – news blogspot has a new post on how the temperature anomaly in the arctic is why higher than the previous high – and that volume? 4 feet of ice is not that thick!! 3 feet? Wow – it could melt fast. Here in Minnesota we’ve had pond hockey tournament cancelled – global tournament! Winter carnival canceled. basically all ice fishing on lakes have been canceled. It’s huge. Farmers are starting to freak out also.
No food is kind of a problem.
Brand new physics study says 1 degree celsius increase = 60% drop of net income for farmers – already having next to no net income for most farmers.
Arctic ice volume has not changed significantly since 2012
Hello again Peter,
Would you like to play “Spot the difference” with me?
Just got my glasses out, it’s definitely been trending downwards since 2013 though
I wouldn’t call at the 57 year mean a tumble.
You’re misquoting me Matt.
At the risk of repeating myself:
“A bit of a tumble”
I don’t think “snow cover” is the key data. Ice thickness is the key data.
Also sea surface temperature – with “arctic-news” reporting it was 70 degrees F. sea surface temp!
Thickness is indeed “the key data”, but snow cover is also important. In winter it provides insulation and reduces the rate of thickening of sea ice. Over land in spring it reduces the rate at which the air temperature increases. Any that remains at high latitudes in high summer reflects sunlight and reduces the rate of melting.
I haven’t had time to read “Sam’s” recent output in detail. SSTs of “70 degrees F” inside the Arctic Circle?
Jim, is the pan-Arctic sea ice area just the 7 internal seas?
Hi SML,
No – It includes the peripheral bits as well, although exactly which bits does vary slightly from product to product.
Here’s the NSIDC’s MASIE map:
Oh yeh, like The great good pan – I forgot
Wow! A very strong start to this year in terms of Northern sea ice volume!
From just 3 current data points, the PIOMAS releases of the year 2024, we got the following:
* 7th lowest for the date on Jan 15th
* Descent of 1 place to 6th lowest on Jan 31st
* Descent of no less than 3 places to 3rd place on Feb 15th
Immediately, this looks so radical that I’d feel like combing through the Book of Records. One thing is the Descent of 4 places in 30 days, but of course even more rad the Über Descent of 3 places in only 15 days. Did anything like it ever happen before, since … umm … 1984?
Phenomenally we might all actually conclude, I dare say.
Jim,
Antarctic sea ice extent beat the 2017 minimum and the 2022 minimum, but it didn’t set a new record, so the 2023 Antarctic sea ice extent minimum record still stands. Here’s the new Top 3:
#1 2023 at 1949 k km2
#2 2024 at 2090 k km2
#3 2022 at 2128 k km2
Antarctic sea ice is now gaining day by day again, so the melt season is over.