My apologies for the mixed metaphors in today’s title, but the news I bear is beyond bizarre.
In a press release earlier today The Global Warming Policy Foundation proudly announced that:
A new paper by an eminent meteorologist says that trends in polar sea-ice levels give little cause for alarm. The paper, by Professor J. Ray Bates has just been published by the Global Warming Policy Foundation.
According to Professor Bates, climate model simulations indicate significantly decreasing sea ice levels in both hemispheres, with the greatest decreases occurring in September each year. However, the observed September trend in the Antarctic is actually slightly upwards, and while observed levels in the Arctic have fallen over the last 40 years, they have been quite stable since around 2007.
Professor Bates said:
“In 2007, Al Gore told us that Arctic sea ice levels were ‘falling off a cliff’. It’s clear now that he was completely wrong. In fact, the trends in sea-ice are an antidote to climate alarm.”
Professor Bates also says that little reliance should be placed on model simulations of future sea-ice decline:
“Climate models failed to predict the growth in Antarctic sea ice, and they missed the recent marked slowdown of sea-ice decline in the Arctic. It would be unwarranted to think they are going to get things right over the next 30 years.”
Professor Bates’ paper is published today, and can be downloaded here (pdf).
By all means download Ray’s “paper” from the link above and take a look at his introduction, which begins as follows:
The recent publication of the book Unsettled by Steven Koonin has led to the likelihood of increased scrutiny of the perception of a climate emergency,1 an idea which has become so widely established in recent years. Koonin, a former scientific advisor to the Obama administration, has demonstrated that what the public are being told by the media is not necessarily what the scientists are saying. He has also shown that what is being relayed in the national and UN climate assessments has often been written for the purpose of persuading rather than informing.
Unsettled clearly shows that important aspects of climate science, which the public have been persuaded to regard as beyond dispute are, in fact, quite unsettled.
Regular readers may recall that as soon as Steve’s book was published in machine readable format we established that it made no mention whatsoever of sea ice, whether of the Arctic or Antarctic variety.
Furthermore, when I attempted to debate that fact with Prof. Koonin he disappeared without trace before justifying that strange omission, beyond asserting that:
The topic is somewhat distant from ordinary folks’ perception.
It seems that Prof. Bates and the GWPF disagree with Prof. Koonin on this topic, since presumably their “paper” is addressed to ordinary folks? Ray even explicitly states that:
Although Unsettled covers a broad spectrum of climate topics, it does not treat in depth the issue of recent polar sea-ice trends, which are key indicators of changes in the global climate.
His “paper” goes on to assert in section 2 that:
Since the introduction of passive-microwave satellite observations in the late 1970s, polar sea-ice extent has been among the most accurately observed climate indicators. Sea-ice volume, on the other hand, is much more difficult to measure.
So far so good I suppose, but then we are told:
In December 2007, former US vice-president Al Gore, in his Nobel Peace Prize acceptance speech in Oslo, referred to scientific studies warning that the Arctic sea ice was ‘falling off a cliff’. He highlighted forthcoming model results that projected largely ice-free Arctic summers in ‘as little as seven years’. He repeated this warning two years later at the 2009 COP15 climate meeting in Copenhagen.
Gore’s claim was based on a study by researchers from the US Naval Postgraduate School, who used a regional model of the sea ice–ocean system in the Arctic, constrained using observational data for the 12-year period 1996–2007, and concluded that the Arctic would be nearly ice-free in summer by 2016 (plus or minus three years).
Prof. Bates seems blithely unaware that we thoroughly debunked this nonsense many moons ago. What Prof. Wieslaw Maslowski, one of those pesky “researchers from the US Naval Postgraduate School”, actually said in December 2007 was:
If we project this trend ongoing for the last 10–15 years, we probably will reach zero in summer some time mid next decade.
At the risk of repeating myself it seems I must once again:
Reiterate for the benefit of those who seem unable to understand either English or Mathematics that a “projection” is not the same thing as a “prediction”.
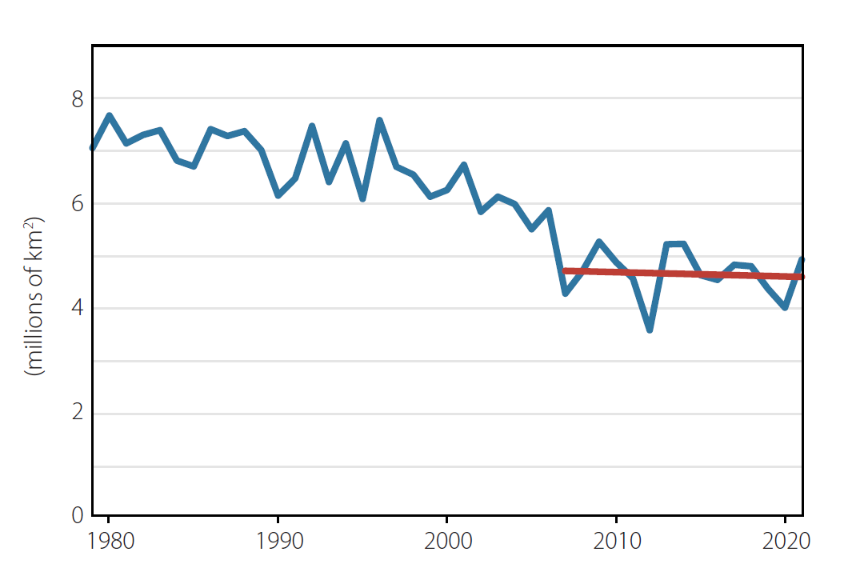
Ray then goes on to quibble with the NSIDC’s graph of September average Arctic sea ice extent:
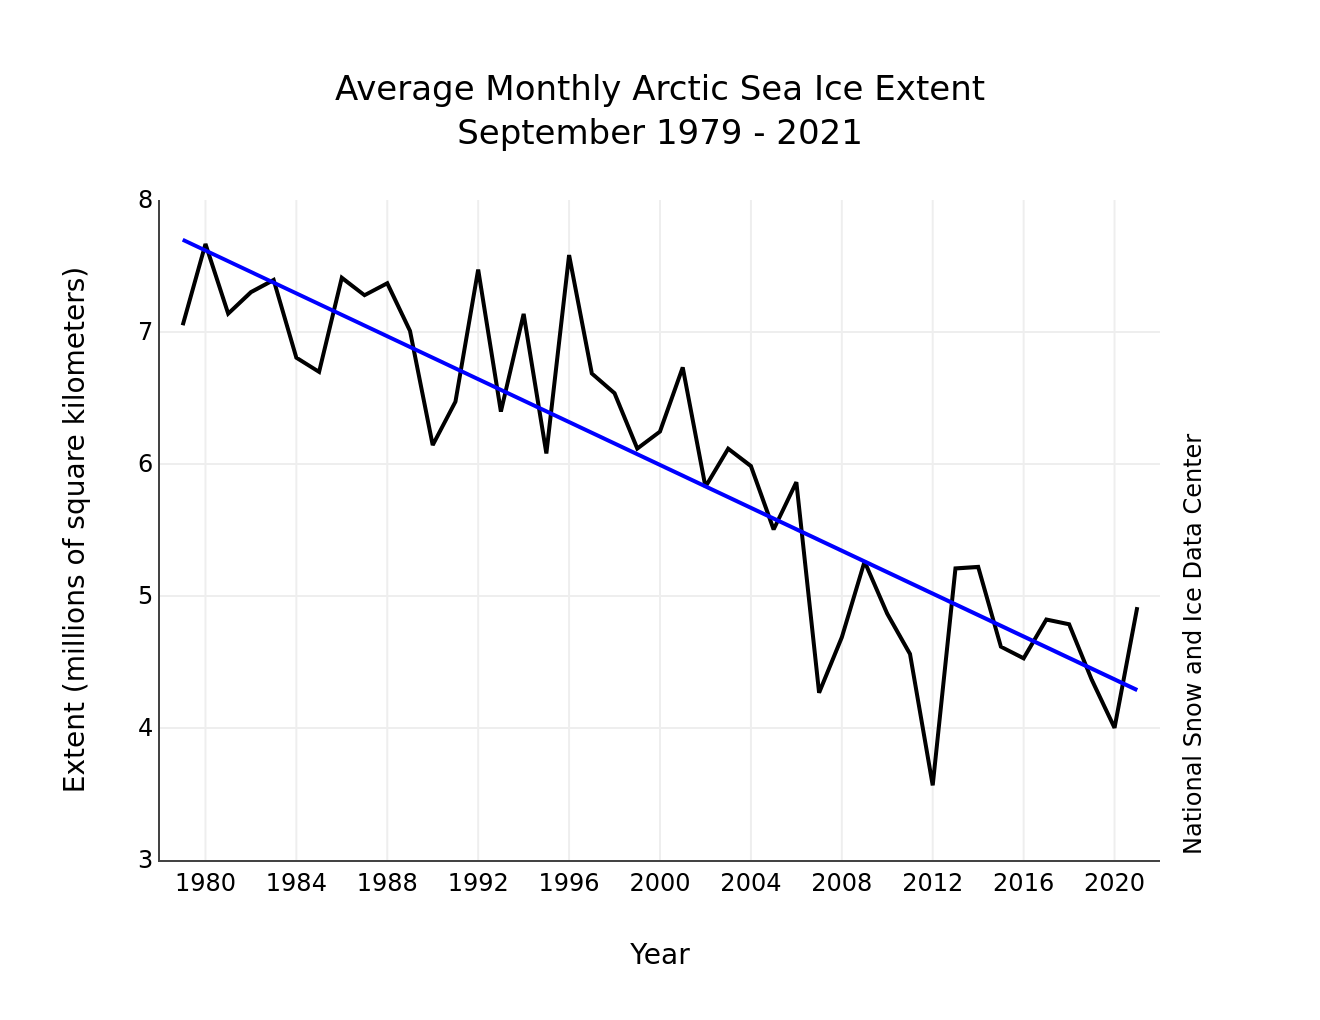
preferring instead a version of his own construction, which looks like this:
Ray then confidently asserts that:
The current slowdown in the rate of sea-ice loss was not expected, and the reasons for it are uncertain.
Sadly Ray’s exhaustive list of references fails to mention this learned journal article from 2011 by authors from the University of Washington and Los Alamos National Laboratory, which not only anticipated such a “slow transition” but also offered reasons for it:
Given the strong thickness–growth feedback of sea ice (Bitz and Roe 2004), where in a warming climate we can expect the thicker MY ice to thin at a greater rate than the thinner FY ice, and the fact that the ratio of MY to FY ice entering into the MY ice category each year is decreasing, it is likely that the difference between FY and MY ice survival ratios will decrease in a warming climate. If this occurs, the Arctic sea ice system would move toward a regime of decreased memory and decreased sensitivity to climate forcing…
There is of course plenty more GWPF sea ice nonsense where that lot came from, but it’s already past my tea time (UTC) and so further debunking will have to wait a while. In the meantime here’s a wake up call for Professor J. Ray Bates:

Moving further down section 2 Ray assures us that:
Any objective discussion of the recent Arctic sea-ice decline also requires that some consideration be given to the evidence regarding past natural variability on a multi-decadal timescale. In the pre-satellite era, reliable data on sea-ice coverage was sparse.
So far so good again? Not really! Ray’s gets on to his go to reference, Connolly, Connolly and Soon (2017):
By combining the temperature and partial sea-ice records, statistical reconstructions of the total sea-ice extent going back to the early 1900s can be created. Some of these reconstructions indicate that between the 1900s and 1940s, Arctic sea-ice extent comparable to the present reduced levels may have occurred.
Ray doesn’t sound very certain, which is perhaps because the paper in question blithely states that:
Because Arctic sea ice trends are closely correlated to Arctic temperature trends, they are often discussed in the context of global temperature trends.
Maybe so, but to the best of my recollection Connolly et al. never attempt to “prove” the asserted correlation. Here’s an alternative assessment of “Arctic sea-ice extent between the 1900s and 1940s“:
Watch this space!
That Bates graph is packed with loads of unintentional humor. I wonder if he knows that it reminds many of us of this graph:
This graph you show of a escalator view of the data is no good to battle for CO2 as the driver of these temperature changes.
If you plot CO2 graph concentrations from Mauna Loa and on top of the temperature graph, you will notice that the CO2 increase did not have a flinch since it started being measured. How you would explain this escalator graph I don’t know but that is no good to prove your point.
The steadfast CO2 increase is not represented in nor explains the temperature graph.
Thanks, mountaineerbr:
“How you would explain this escalator graph I don’t know but that is no good to prove your point.”
No, it did prove the point that I was making, which is pointing out Professor Bates’ misleading graph and the “steps” he takes to make it look legitimate.
The point that *you* made has to do with natural variability and how it prevents the global warming trend from lining up perfectly with the CO2 trend, which may confound some people who have trouble seeing beyond the mathematical black and white.
Here it is. Professor Fritz Vahrenholt – Second Thoughts of an Environmentalist
I refer you to Wood for Trees.
Need I say more?
Mr Hunt, shall we see the MET Office temperature graph?
We should never use shortest-time-range graphs.
Here is MET office Central England temperature record. I cannot see escalator nor correlation to CO2.
For your information “Central England” is not “Global”.
Very far from it!
In the Central England temperature graph, temperature is rising since ~1680. DO notice that from 1700 to 1725 there was a steep ramping up of temps, so whatever we see from 1975 to now has happened in the past, is not unprecedented.
Now, I wonder how if MET office does adjustments to its record data, such as for urban heat effect, but there is no reason to not think the temp has not been increasing, albeit we are not sure about the rate of increase.
It does not make sense if you refute every new information.
AFAIK the temp should increase faster in higher latitudes, specially the poles, like twice as fast or something.
Plus, I checked the “wayback machine” and got the tables for temperatures from 1659 and while the resulting graph is not very much different, one can observe how they have been messing about with the data (adjustments). Also, the website says they account -0.2 ºC for urban warming although I did not dig much deeper. There is no CO2 correlation and no escalator in the longest thermometer temperature record on earth.
When China went modern age circa 2000 the sea ice started deteriorating;
Case closed.
Sorry about my poor sense of humour, David, but I didn’t see anything odd about Ray Bates’ sea ice extent figure.
He has not cherry picked the data. He has simply re-expressed the NSIDC data using a true y-axis down to zero. This is a reasonable thing to do because he was referring to sea ice predictions made in 2007 which claimed we were likely to see an ice free Arctic within 7 years.
He then shows the trend line from 2007 to 2021. In the text he makes it clear you should not draw conclusions from such short periods of time.
I am prepared to wait and see what happens over the next 5 years.
Afternoon Neil (UTC),
David is referring to the famous Skeptical Science global surface temperature “escalator”
No such “predictions” were made in 2007, as I have already explained. Do I need to do so again?
If no conclusions should be drawn from Ray’s trend line, why bother including it in the document?
Can I safely assume that, much like Ray, you have yet to read Armour et al. (2011) from cover to cover? I cannot help but wonder whether he even read Bitz & Roe (2004), which he does at least include in his list of references.
Who predicted an ice free arctic in 7 years from 2007?
Thanks, Jim.
Hi Neil,
The two graphs Jim shows look exactly the same to me. The Bates graph, however, is flattened to show his escalator step as looking (as a visual effect) not as steep as it would look if it were superimposed on NSIDC’s graph. That’s all it is.
And once again, nobody made any predictions. What is even more ridiculous is that this whole report seems to hinge on Al Gore’s purposely misinterpreted amplification of a scientific paper’s projection.
“…a projection is a probabilistic statement that it is possible that something will happen in the future if certain conditions develop.”
https://sciencepolicy.colorado.edu/zine/archives/1-29/26/guest.html
“In the text he makes it clear you should not draw conclusions from such short periods of time.”
Advice which the overall “paper” makes clear it doesn’t follow.
This not a scientific exercise, but a political one. Here’s the last paragraph:
These facts deserve to be recognised when the notion of a climate emergency, requiring the most drastic and immediate changes to the world’s economy, is being put forward. Some concern might also be shown among those involved for the increasing eco-anxiety being inflicted on the younger generation.
Facts vs. notion? At least have some facts before such a comparison is made. And how about that younger generation, so naive they can’t see through the fog of reality that they’re being handed an abused planet? I think I might be a tad more insulted if *I* was part of that younger generation being the subject of such outrageous condescension–especially by those they see as making a sustainable future less attainable.
Jim,
Just checked Al Gore’s actual text recorded at:-
https://www.nobelprize.org/prizes/peace/2007/gore/26118-al-gore-nobel-lecture-2007/
“Last September 21, as the Northern Hemisphere tilted away from the sun, scientists reported with unprecedented distress that the North Polar ice cap is “falling off a cliff.” One study estimated that it could be completely gone during summer in less than 22 years. Another new study, to be presented by U.S. Navy researchers later this week, warns it could happen in as little as 7 years.”
I quite agree he is often miss quoted, but he clearly implied there was a possibility of an Ice Free Arctic within seven years.
The IPCC has now talked about “practically ice free” (1 sq.km.) by 2050.
Al Gore isn’t a scientist though Neil.
Although allegedly he once claimed to have “invented the internet”:
https://www.snopes.com/fact-check/internet-of-lies/
‘Al Gore isn’t a scientist…’. No, but he was used by some (in my view) unscrupulous scientists to politically support their crusade against CO2 and fossil fuels by frightening children with his nonsense. A few brave scientists pointed out his distortions in ‘An Inconvenient Truth’ and at least got UK schools to put a disclaimer on it.
“Al Gore… was used by some (in my view) unscrupulous scientists to politically support their crusade against CO2 and fossil fuels”
Can you provide some examples of said scientists by any chance?
Michael Mann and Galvin Schmidt come to mind. I just took a few minutes with DuckDuckGo, but I’m sure there are many more:
Happy New Year Taylor,
I’m afraid I fail to see how that Real Climate article supports your assertion. An extract from the introduction:
Jim,
You wanted some scientists who used Gore’s scientifically embarrassing movie to frighten kids. I quickly gave you two. You weren’t expecting them to do anything other than cast Gore in the best possible light, were you?
I wasn’t posting something to prove Gore wrong – that’s been done by better folks than me. I was giving you (quickly) two examples out of many. The examples of disclaimer materials ordered by the judge make good reading, BTW.
Taylor,
The article you linked to provides no evidence for your assertion that Professors Mann and Schmidt are “unscrupulous scientists… who used Gore’s scientifically embarrassing movie to frighten kids”
It discusses the science behind the alleged “errors” in the movie, which is a very different kettle of fish.
Neil,
The ‘1 sq km’ metric for an ‘ice fre Arctic’ is actually 1M sq km, a unit now derisively referred to as “1 Wadham” in ‘honor’ of Professor Wadham, who repeatedly predicted the end of Arctic sea ice every year for many years. Jim would likely know him well, I believe they are countrymen.
Neil apparently doesn’t recognize science has always been political: hence the military complex that promoted air superiority, and thus fossil fuels, because of the great lessons learned from that particular war.
There dreamt of going to the moon in the 20s !
We now have the ‘Educational-Government’ complex, wherein the government funds higher Ed and government labs to produce studies that support their political ambitions. It used to be just in climate, but given COVID, we now see the unholy alliance extending to medicine. Opposing government means loss of funding, so the system is self-reinforcing. Given a compliant media, I see little hope in stopping the juggernaut.
Jim,
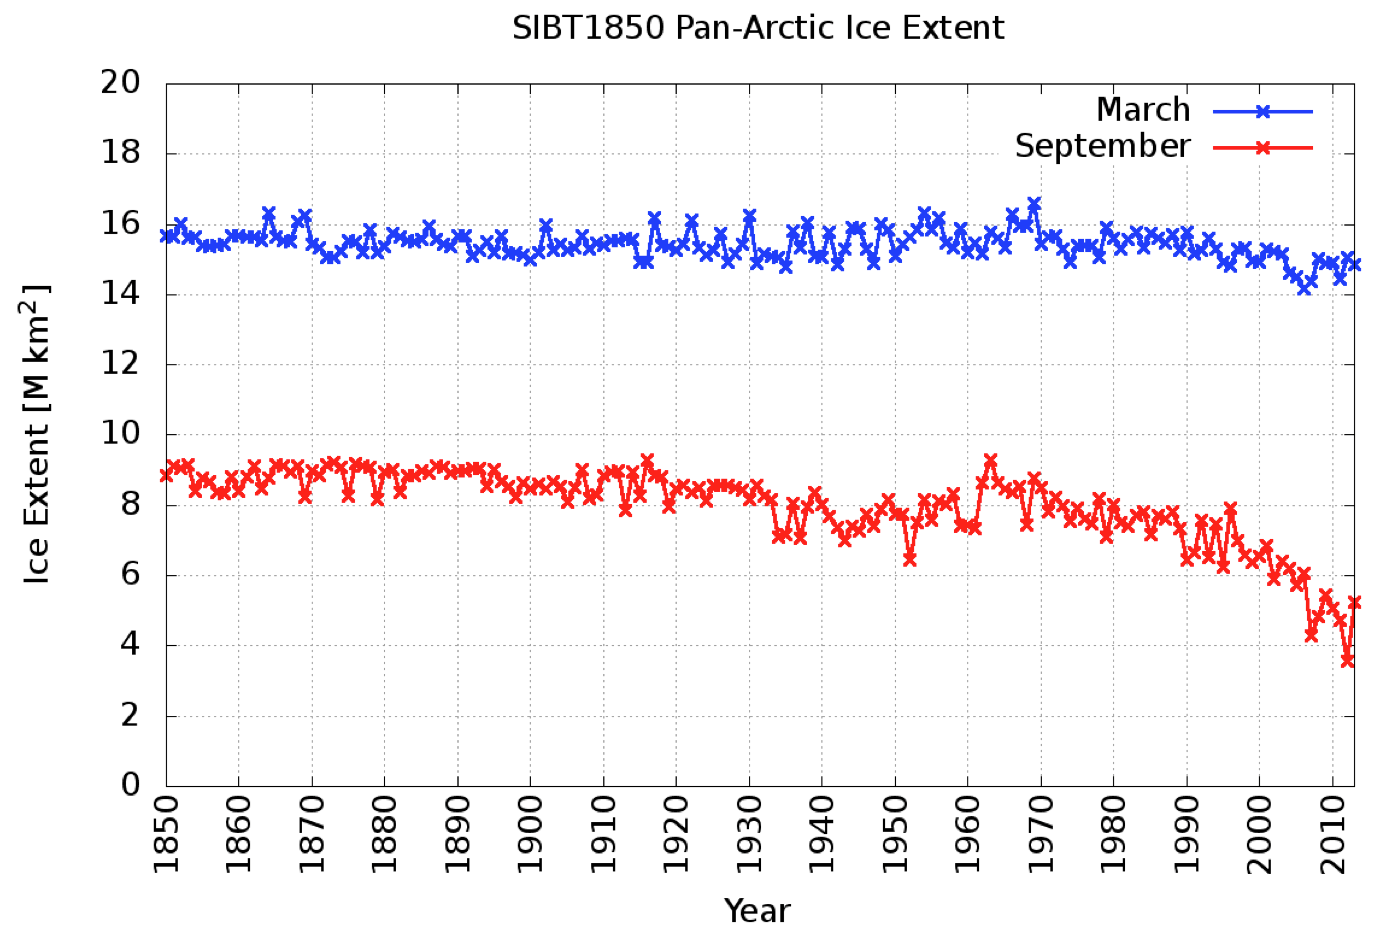
Just a quick comment on the graph from Walsh2016 at the end of your post. It would appear that Arctic Sea Ice has some correlation to temps, since the low point he finds in the late 40’s corresponds well to the general warming in the late 30’s/early 40’s. I note with some interest that it took 50 years for the extent to again get that low.
As for the graph itself, I think it suffers a bit from ‘Mann Disease’. That is, like the good doctor’s infamous ‘Hockey Stick’, it’s proxy data with recent observations spliced on. I’m not saying it’s not useful, it just needs to be used with caution, particularly since Walsh neglected to add the most recent years (as of publication) to his graph.
“It’s proxy data with recent observations spliced on.”
According to the linked article:
Hi Jim,
This paper also makes an estimate back to 1910
https://phys.org/news/2019-08-century-arctic-sea-ice-volume.html
Indeed it does Neil, even going as far back as 1901!
See also:
https://GreatWhiteCon.info/2021/03/the-2021-maximum-arctic-sea-ice-volume/#comment-431443
Thanks for posting the chart Jim.
It emphasises the significant drop since 1980.
However we should not ignore the drop from 1900 to 1930 when CO2 levels were very much lower than today.
We certainly shouldn’t ignore the rise in sea ice from 1940 to 1980.
Exactly, Jim. Thanks for taking the trouble to paste in the examples I read before making the ‘proxy’ comment. What is being attempted is to measure Extent, a metric with a rather precise definition, by using limited records of ‘Ice edge’ without any possibility of seeing polynyas and other artifacts that would significantly affect the results, vs. today’s ability to ‘count the pixels’.
Essentially, all the techniques they describe, including the ice edge reports and the limited flyovers, are all proxies for the 15% coverage metric. Granted, they are much better proxies than Mann’s few and carefully selected tree rings, but they are proxies for the ‘real thing’, nonetheless.
Well, it appears the truth is still a bit too inconvenient for some–and their reaction to it a bit too silly for me.
Come on, Taylor, it’s almost 2022.
That means it’s many years too late for this political conspiracy nonsense. Please stop reinforcing the idea among a steadily growing number of us that science deniers exercise their apparent right to pick and choose which “science” to deny.
Well, David, I suggest you look again at the delta between much of the science in the IPCC reports and what is described in the ‘Summary for Policymakers’ and decide if there’s political interference , for political advantage, in that report. I suggest you read Koonin’s book for more detailed examples.
For a real-life example of a political conspiracy to exploit climate change, you only need to look at the number one emitter of CO2, China, and how they’ve manipulated ‘the science’ to continue their expansion of fossil fuel usage to support their economic growth while trying to cripple the growth of western nations. ‘Emerging nation’, indeed.
The western Left wants to halt growth and deindustralize, using Climate Change as a rationale. That’s not a conspiracy theory, that’s stated fact, extensively written and spoken about by Leftists themselves.
Net, net, there are a lot of very rational and concerned people, including many scientists, in that group you label as conspiracy theorists. Both sides have their ‘lunatic fringes’, to be sure, but I, and others like me, are not in those groups. You shouldn’t be, either.
You’re the one pretending the Western Left wants to halt growth…
You might start here. I’m actually shocked you’ve never heard of the ‘Degrowth Agenda’. Perhaps we moderates are more widely read.
https://www.degrowth.info/en
Here’s some perspective from a long-time self-described leftist:
And of course, no topic review would be complete without a favorable take by our old friend Wikipedia:
https://en.m.wikipedia.org/wiki/Degrowth
Let me know after reading those if I’m ‘pretending the Western Left wants to halt growth’.
Taylor writes:
“Let me know after reading those if I’m ‘pretending the Western Left wants to halt growth’.”
Beats me what you’re doing, but if you’re not following the science then what *are* you doing? Here in the U.S. we have the slogan, “defund the police” but we know literally that’s not what it means.
The conclusion I draw from that analogy is that your example of what turns out to be an illusory aspect of the overall manufactured “fear of a left planet” is simply one more lame distraction and one more excuse to screw our future.
David,
You’re confusing ‘The Left’ with ‘Liberals’ such as (presumably, based on your comments) yourself. Yes, in the US the ‘Defund the Police’ movement was viewed as ‘not serious’ by Liberals but it was viewed very seriously by Leftists, and where they had political control (Portland, SF, NYC), it happened. The conservative and Liberal pushback after the disastrous results caused the Leftists to go a bit quiet, but don’t kid yourself. Same thing with Degrowth to ‘solve’ Global Warming. They’ll back off a bit as energy prices skyrocket and people freeze in the dark, but the ultimate goal doesn’t change. You should quit assuming that the Left has Liberals as their friends – you’re just ‘useful’ for now. This is the last word I’ll say on politics. This is a Sea Ice blog, and we should get back to the topic. My only closing suggestion, David, is to be more widely read. The Right has had a better tendency to be more correct on some topics, or at least more prescient.
Thanks for the advice, Taylor, but your version of history tells me (among other things) you may not be aware that “defund the police” only means putting more money toward mental health and preventing people from committing crimes in the first place, rather than spending that money toward surplus military hardware. That’s all it is, it’s ongoing and there were no alternative reality disasters caused by leftists.
American liberals are simply placeholders content to have their hands slapped every time they reach across the isle. A blind man can see how ineffective they’ve been.
It’s ironic that you’re no longer interested in discussing politics since, it seems, the subject is behind practically comment you’ve made here.
Guaranteed, though, I’ll stop the politics as soon as you stop the politics.
My detailed answer with links to sources is in moderation, but I’m sure Jim will soon release it.
In the meantime, try googling ‘degrowth’.
Thanks, Jim for getting this post out of moderation. I assume it was the multiple links that prevented it initially.
Yes – The GWC “spam” filter doesn’t like lots of links.
I suggest you read my detailed critique of the “science” contained in Prof. Koonin’s book. Even Ray Bates (op. cit.) agrees with one of the points I make!
You don’t suppose that Steve Koonin could be conspiring to obtain financial and/or political advantage by such misrepresentation do you?
Jim, I was not referring to ‘the science’ in Dr. Koonin’s book nor your critiques of that science, but rather his critique of the translation of the science into the ‘Summary for Policymakers’ which is about political control of science messaging. That’s a topic about which, as both a scientist and a science advisor to politicians, Dr. Koonin is eminently qualified to judge. Or do you disagree that the ‘Summary’ documents represent a deliberately negotiated slant on the actual science in the IPCC reports?
Here’s one take on the “political control of [the] slant on the actual science in the IPCC reports”
https://www.theguardian.com/environment/earth-insight/2014/may/15/ipcc-un-climate-reports-diluted-protect-fossil-fuel-interests
Oh, and BTW, under the Biden Administration, what possible ‘Financial and political advantage’ could Dr. Koonin derive from the stance he took? Certainly the government’s grant programs are less likely to fund him, and fellow scientists on the left have disavowed him. I don’t see Exxon rushing to press filthy petrodollars into his hands, so I’m not clear why a ‘go along to get along’ strategy wouldn’t have been more to his advantage. Maybe (shock of shocks) it’s just a principled stand on his part.
Steve would appear to have a large pile of books to sell?
And unless he and his publisher are very quick workers pen was put to “Unsettled” paper before Biden took office. Who do you predict will be the next US President by the way?
If “filthy petrodollars” are flying around they’re not likely to be in plain sight!
Taylor,
I read the summary for policy makers and it sure looks like we’d better do something–starting yesterday. If you got something totally different out of it, that’s not the IPCC’s fault.
“For a real-life example of a political conspiracy to exploit climate change, you only need to look at the number one emitter of CO2, China, and how they’ve manipulated ‘the science’ to continue their expansion of fossil fuel usage to support their economic growth while trying to cripple the growth of western nations.”
Assuming this was true, how is this relevant?
“The western Left wants to halt growth and deindustralize, using Climate Change as a rationale. That’s not a conspiracy theory, that’s stated fact, extensively written and spoken about by Leftists themselves.”
No, it’s a conspiracy theory. A major red flag is that you’re putting the cart before the horse. The planet is warming, which prompts people to want to do something about it. If we have to change our way of doing things to slow the warming then it must be done. It’s not the other way around, which would be silly, right? We just can’t sit around and wait for people who cannot seem to focus on anything other than an imaginary problem (a problem which “coincidentally” favors politics over science) when we have a real problem staring us right in the face.
Yes, the planet is warming. In general, that’s a good thing (who wants to return to The Little Ice Age). A warm climate, with more CO2, is healthy for us and for plant life, which will help us cheaply feed the population. Civilization’s greatest advances over the last several thousands of years have come during warming periods. However, where skeptics and Alarmists disagree is how much danger that represents, and what is anything to do about it. There is also the question that if less CO2 is ‘the answer’, can unilateral action by developed nations do anything about it. On that topic, the science is clear: even if western nations turned everything down, CO2 would keep growing because of China and others, not to mention outgassing from oceans already warmed by previous warming. It’s time for mitigation, and I don’t mean crazy schemes to pump aerosols into the sky.
There is not the political will to shut down economies and let people starve and freeze, just to do an experiment based on models that are wildly in disagreement (which is why they use ensemble ‘averages’ to avoid embarrassment). By all means, become more energy-efficient. By all means, reduce particulate emissions. By all means, build low CO2 base load power, like nuclear. But stop pretending you can make Arctic Ice grow again with windmills.
“Yes, the planet is warming. In general, that’s a good thing (who wants to return to The Little Ice Age).”
No, it’s NOT a good thing, especially since (without the extra GHGs humans are putting into the atmosphere) we would naturally now be in a cooling phase. (“global warming is awesome” is taken off the table.)
“There is also the question that if less CO2 is ‘the answer’, can unilateral action by developed nations do anything about it.”
It IS the answer, and (red herring) there is no unilateral action. That’s why we have the COPs. Taken off the table.
“It’s time for mitigation, and I don’t mean crazy schemes to pump aerosols into the sky.”
If your definition of mitigation includes reducing the CO2 we’re putting into the atmosphere then I’m all for it. Radical mitigation like using particulates or aerosols need not be necessary if everyone would just start thinking and align themselves with the science. This of course means you and others like you.
“There is not the political will to shut down economies and let people starve and freeze, just to do an experiment…”
Another red herring. Nobody’s talking about doing any of what you describe. And the “experiment” started with the Industrial Age, and so far the results are already coming in. Taken off the table.
Again, all I see from the contrarians are whining, spurious accusations and lame excuses. No science.