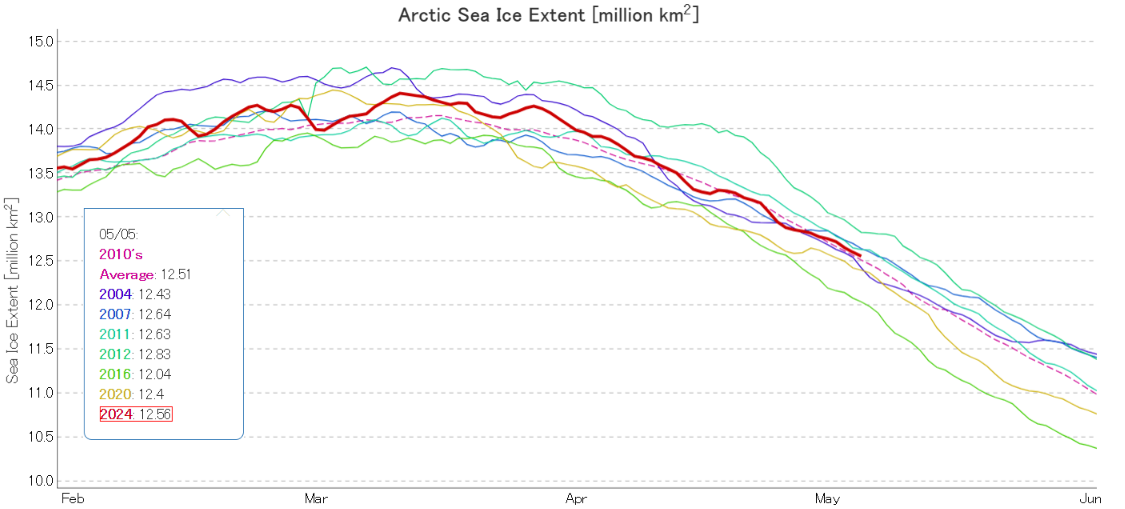
Since a certain “sceptic” has recently been comparing 2024 sea ice extent to “20 years ago”, here’s the current JAXA/ViSHOP extent graph of selected years, including 2004:
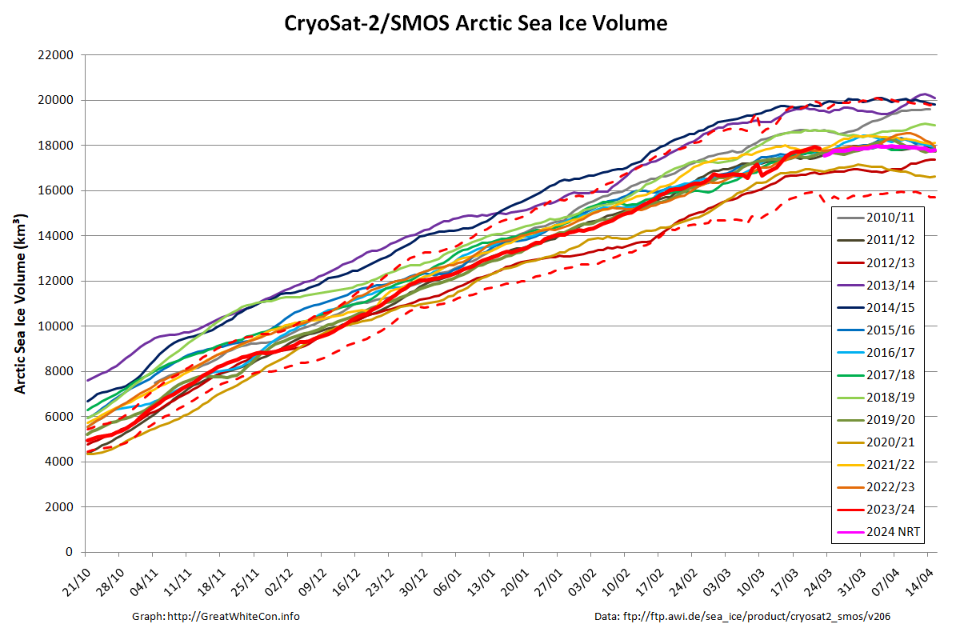
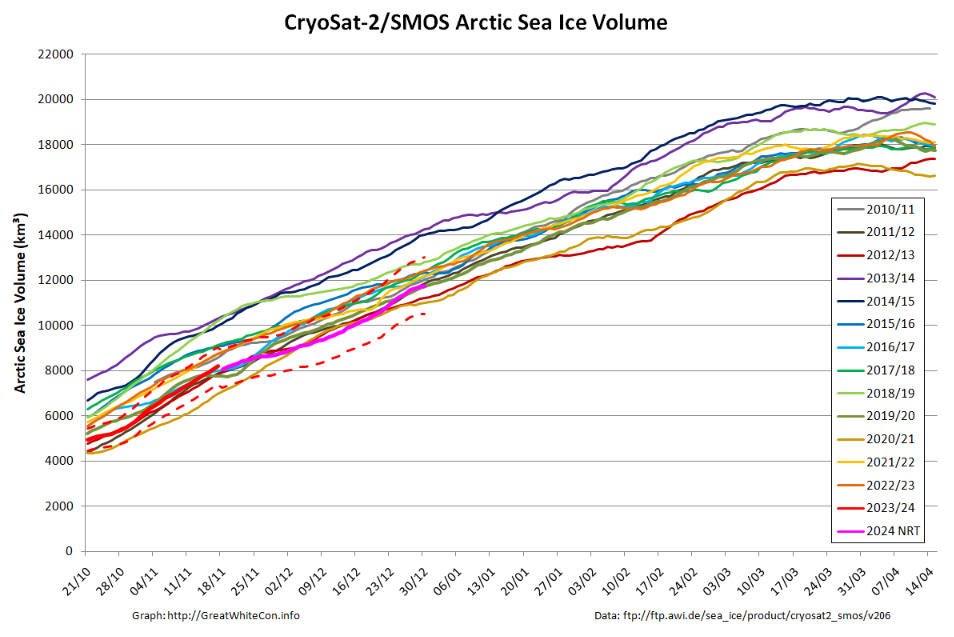
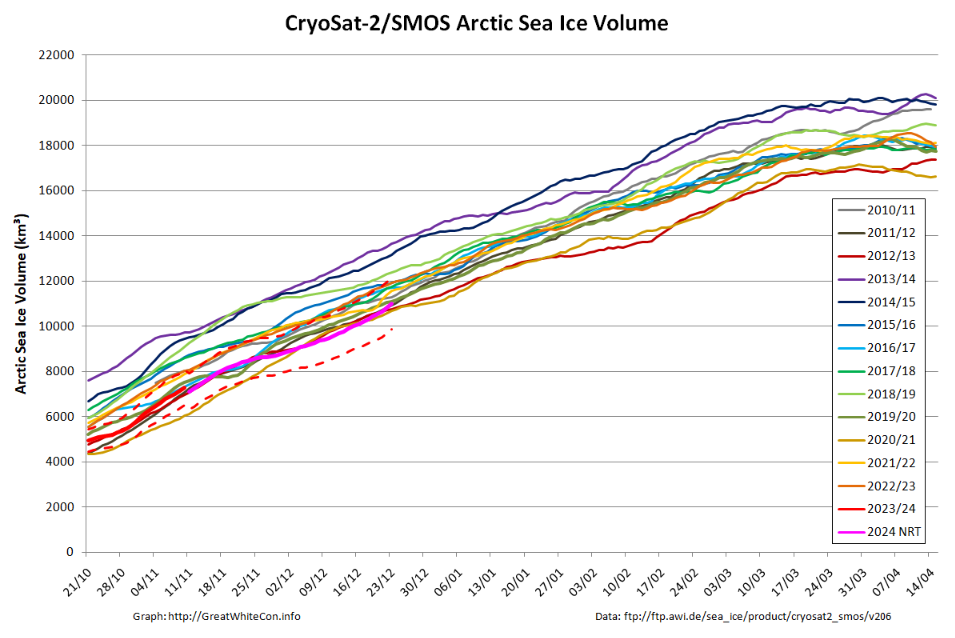
The CryoSat-2/SMOS merged Arctic sea ice volume graph finishes on April 15th, but older data is being reanalysed and here is the latest version:
The gap in the near real time data due to the problem with the SMOS satellite during the first half of March has been filled in, but the result doesn’t look very convincing to say the least!
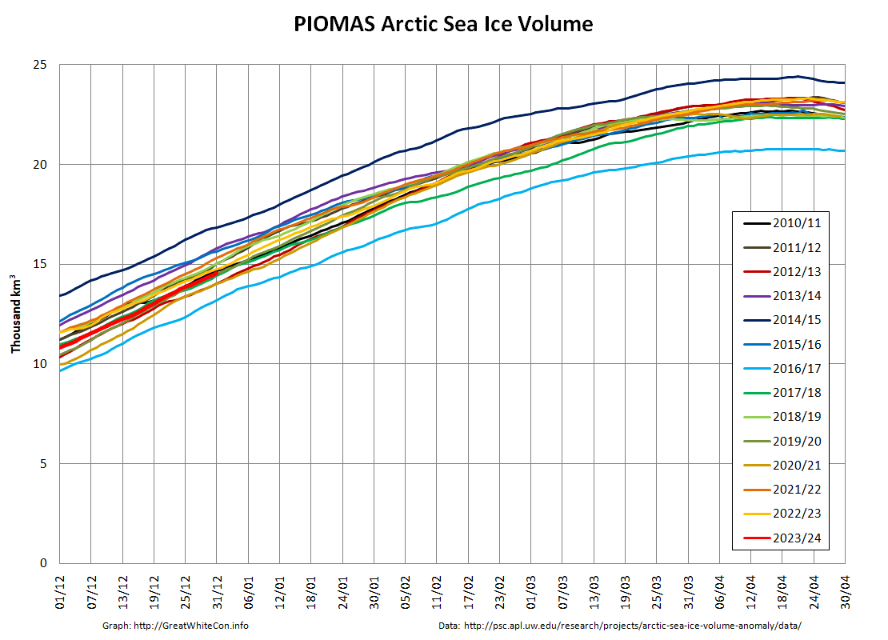
The PIOMAS gridded thickness data for April 2024 is now available. Here’s the end of month volume graph:
Our regular reader(s) may be wondering at this juncture, but that is not a typo in today’s title. For an in depth discussion of how alleged “renowned amateur naturalist and honorary doctor” Chris Packham sensationally rebranded Toby Young’s self identified “skeptical” web site live on air on the BBC’s “Sunday with Laura Kuenssberg” see here.
By way of additional background information see also our in depth investigation of the Daily Sceptic’s Arctic porky pie production line over here.
To the apparent astonishment of the Septic’s alleged “Environment Editor”, Chris Morrison, Reuters Fact Check has now followed in “Snow White’s” dainty footsteps through the as yet unmelted Arctic snow cover:
The so called “skeptics” are probably already salivating over that image!
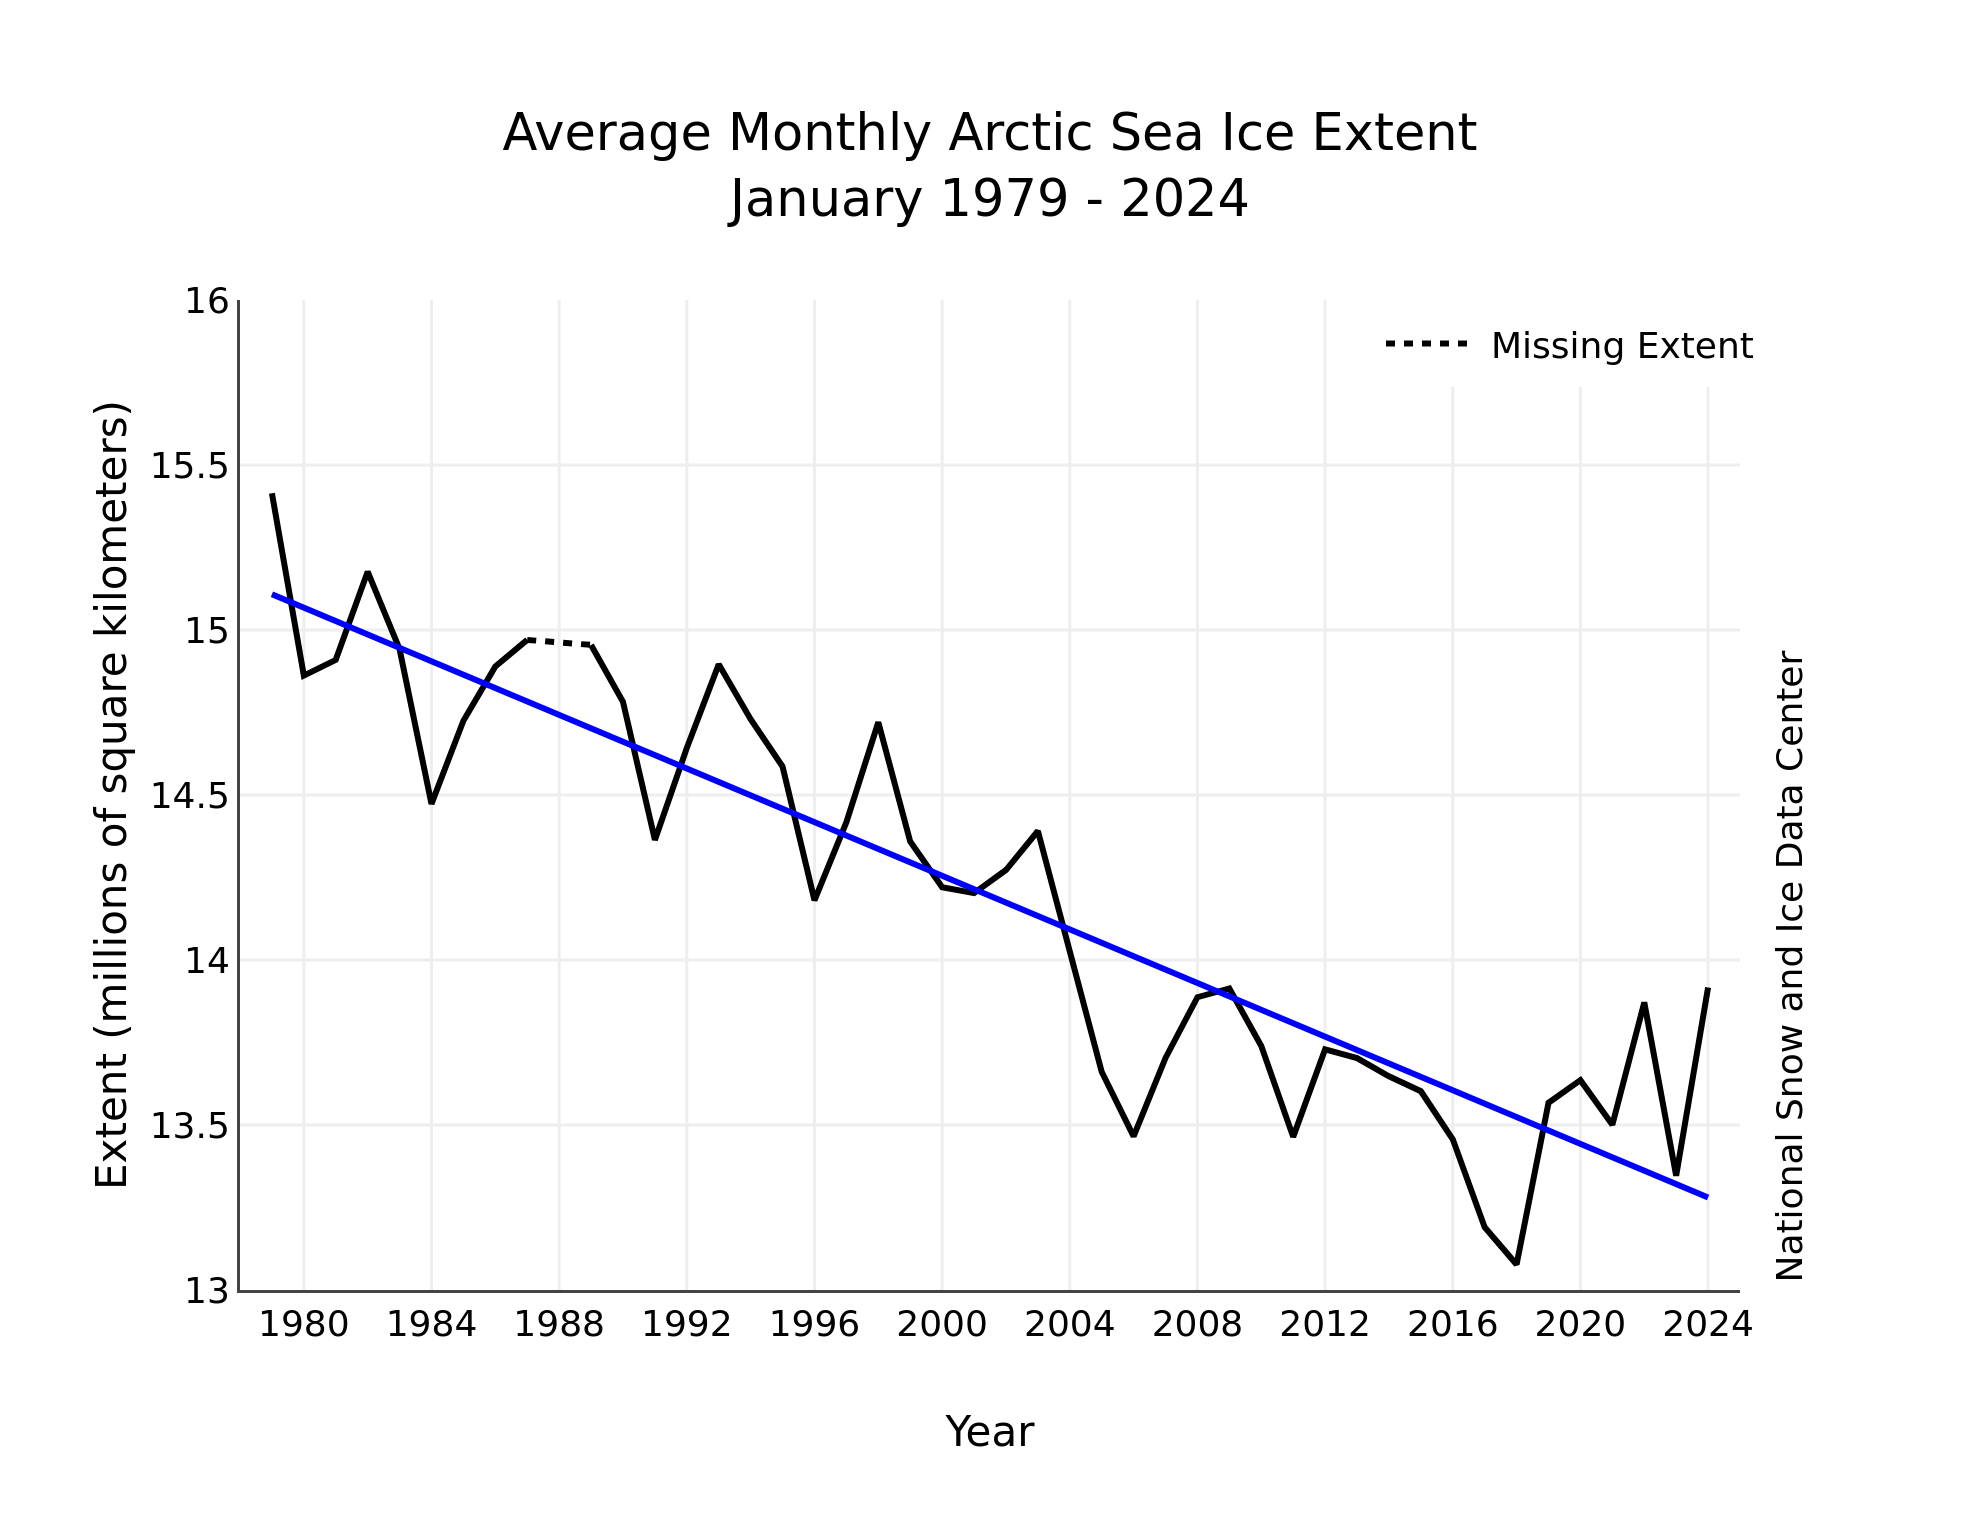
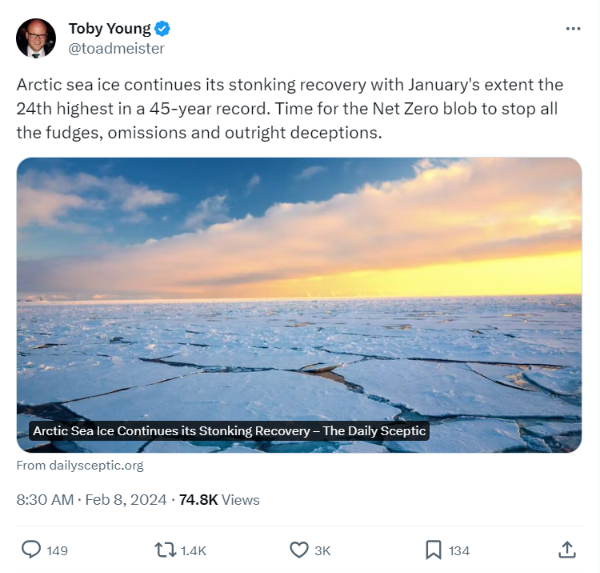
The name may not be familiar on the other side of the Atlantic, but here in the once United Kingdom Mr. Toby Young self identifies as “skeptical”, having named his web site the “Daily Sceptic”. This morning he Xweeted thus:
The linked article was written by the Daily Sceptic’s alleged “Environment Editor” Chris Morrison. Mr. Morrison Xweeted thus:
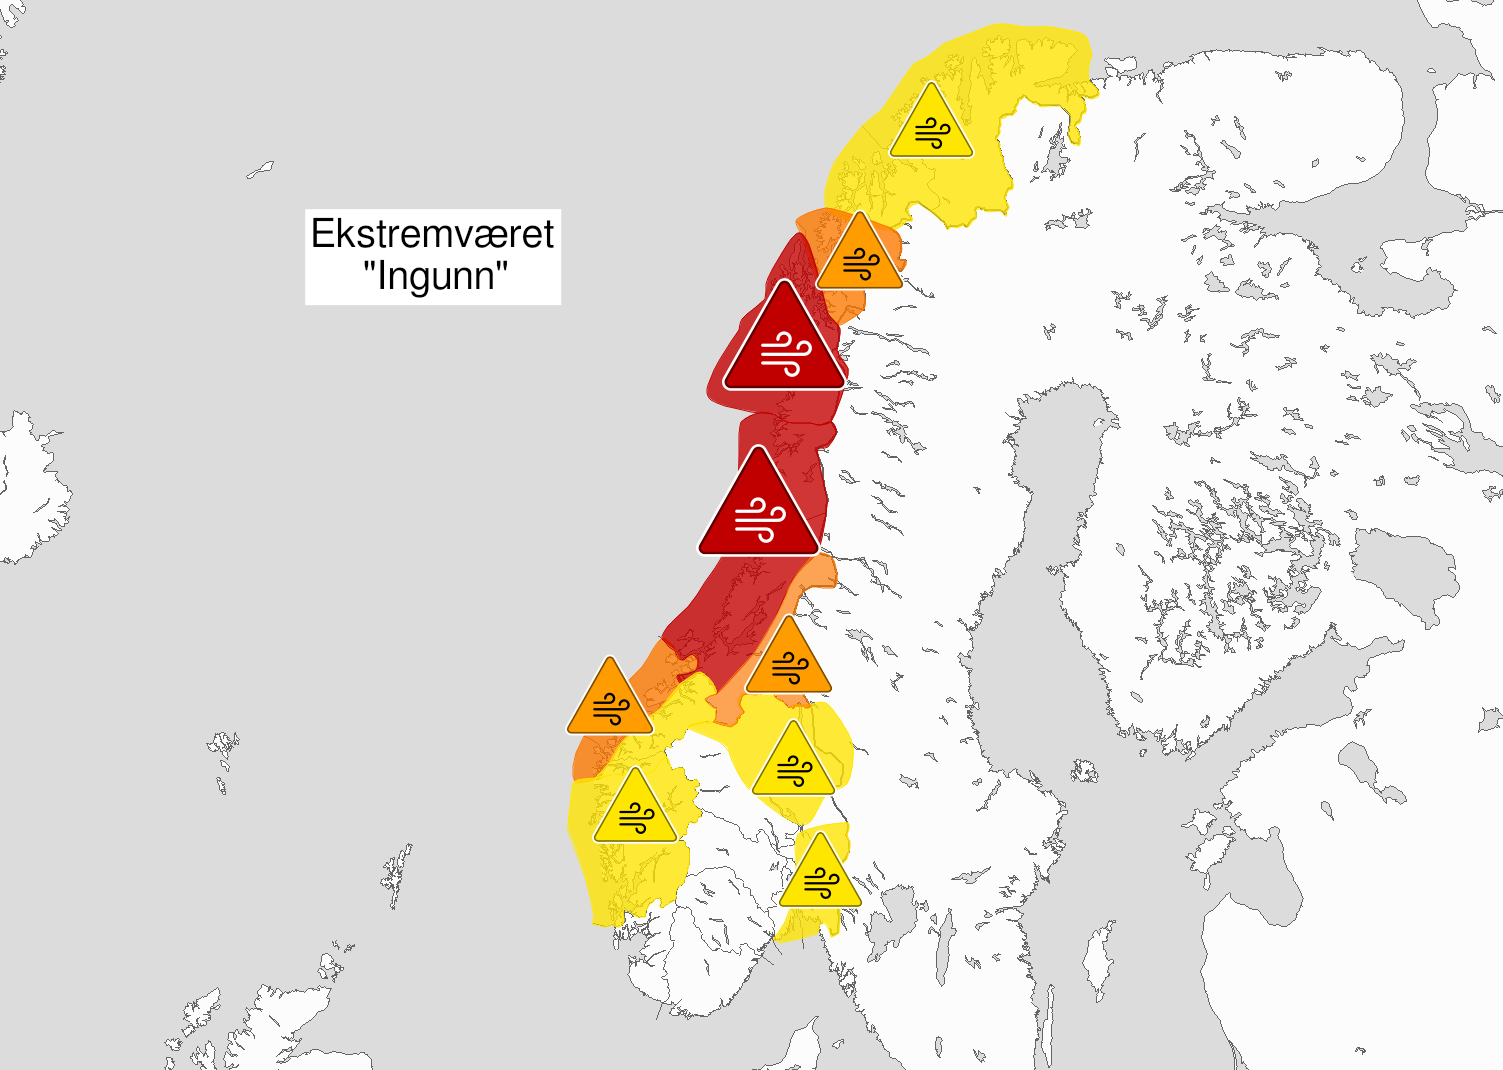
A change is perhaps even better than a rest? Let’s start February with a reminder that following close behind another recent Arctic cyclone, Storm Ingunn caused red weather warnings for high winds and avalanches in Norway two days ago:
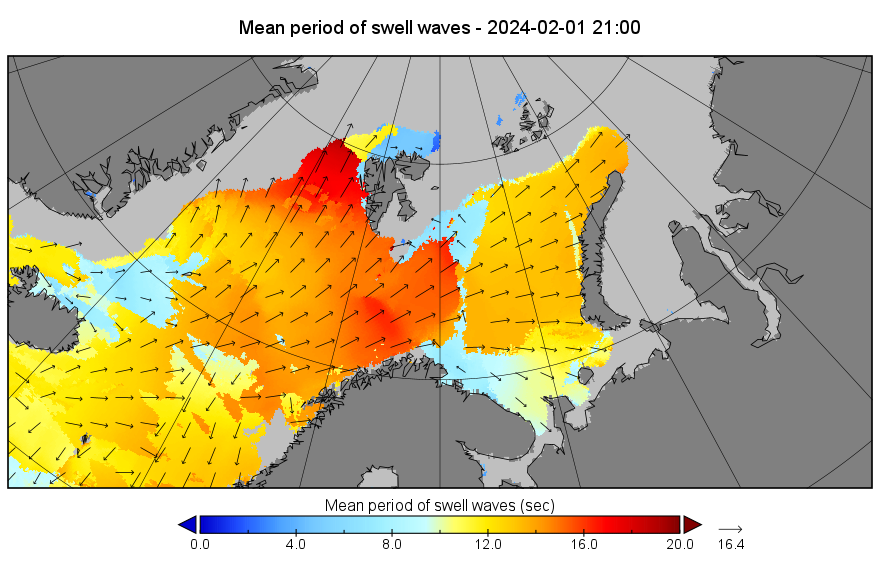
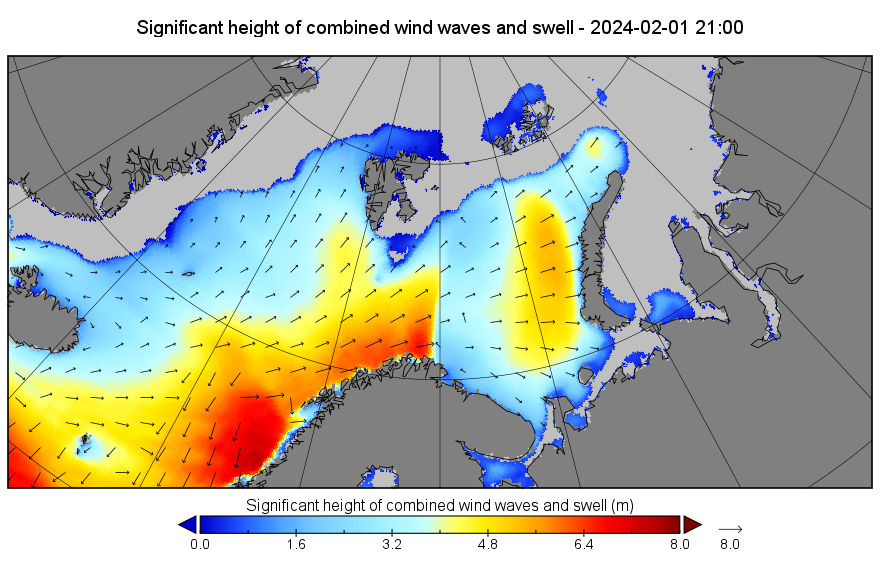
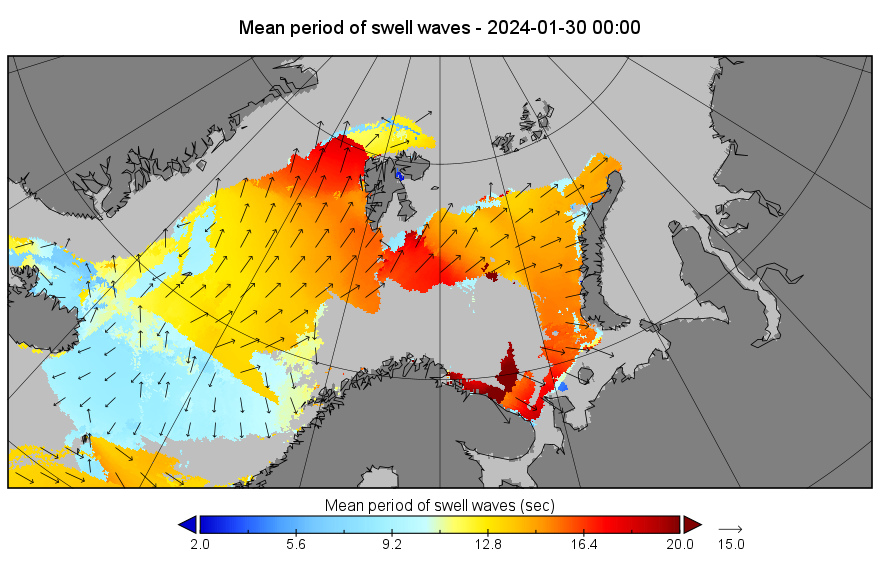
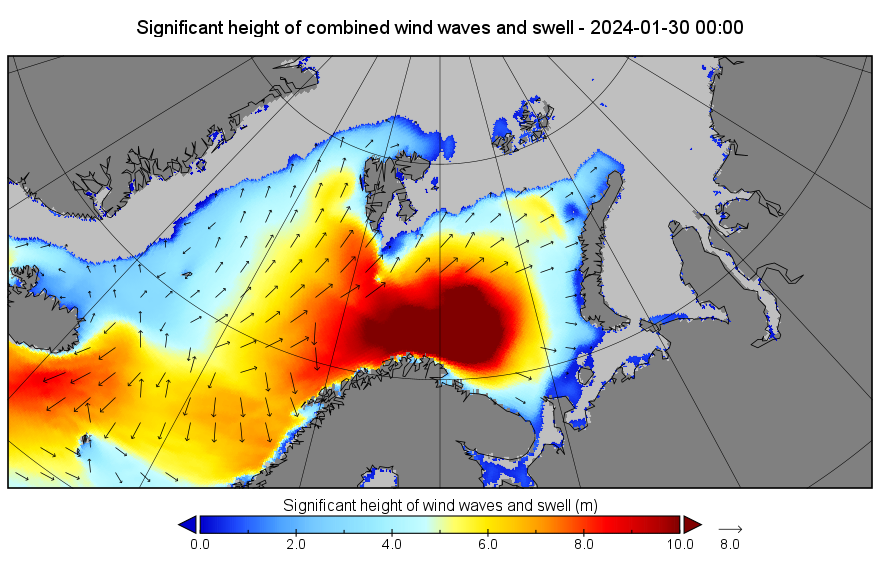
By yesterday evening another long period, storm driven swell was arriving at the sea ice edge in the Fram Strait, and to a lesser extent in the Barents Sea:
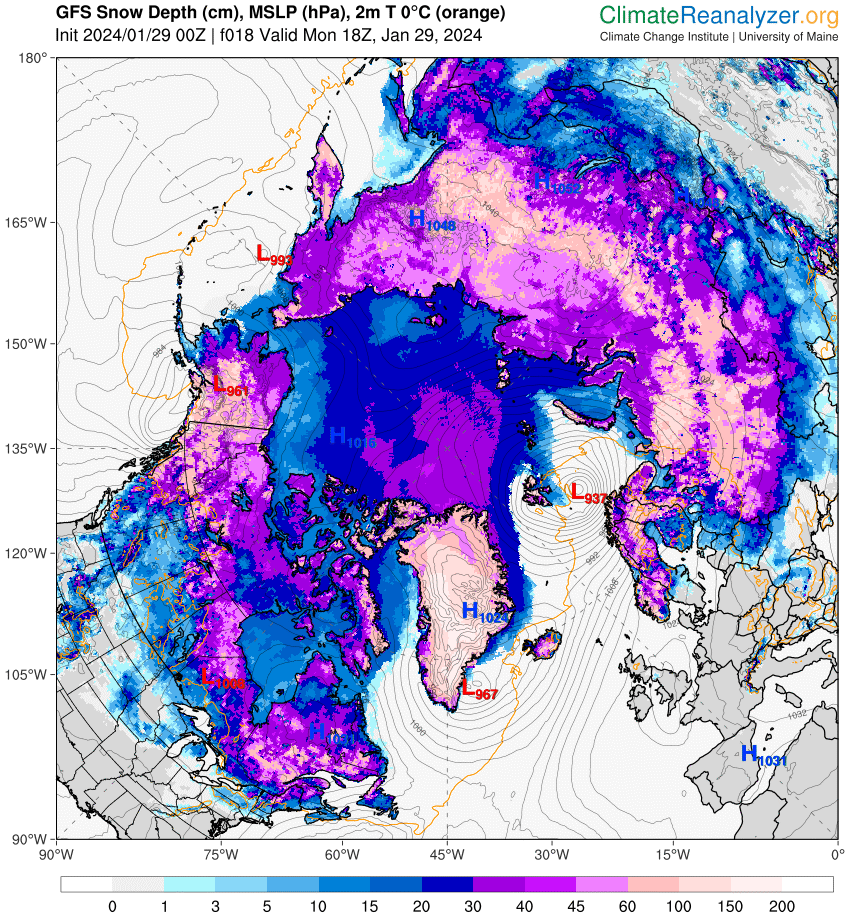
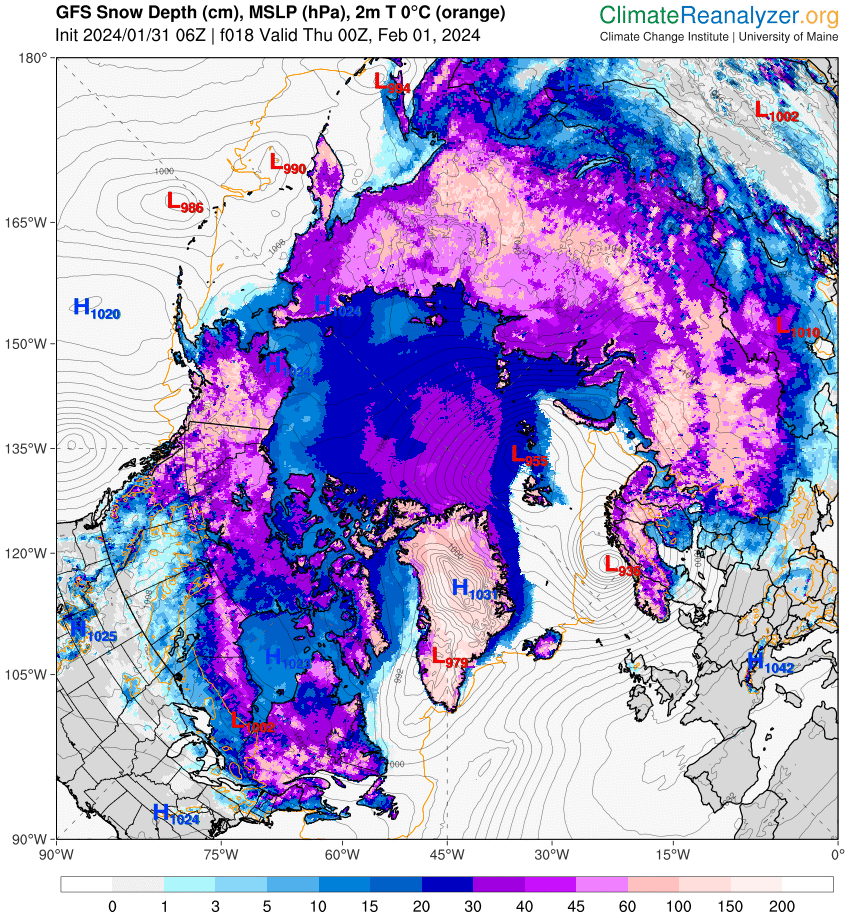
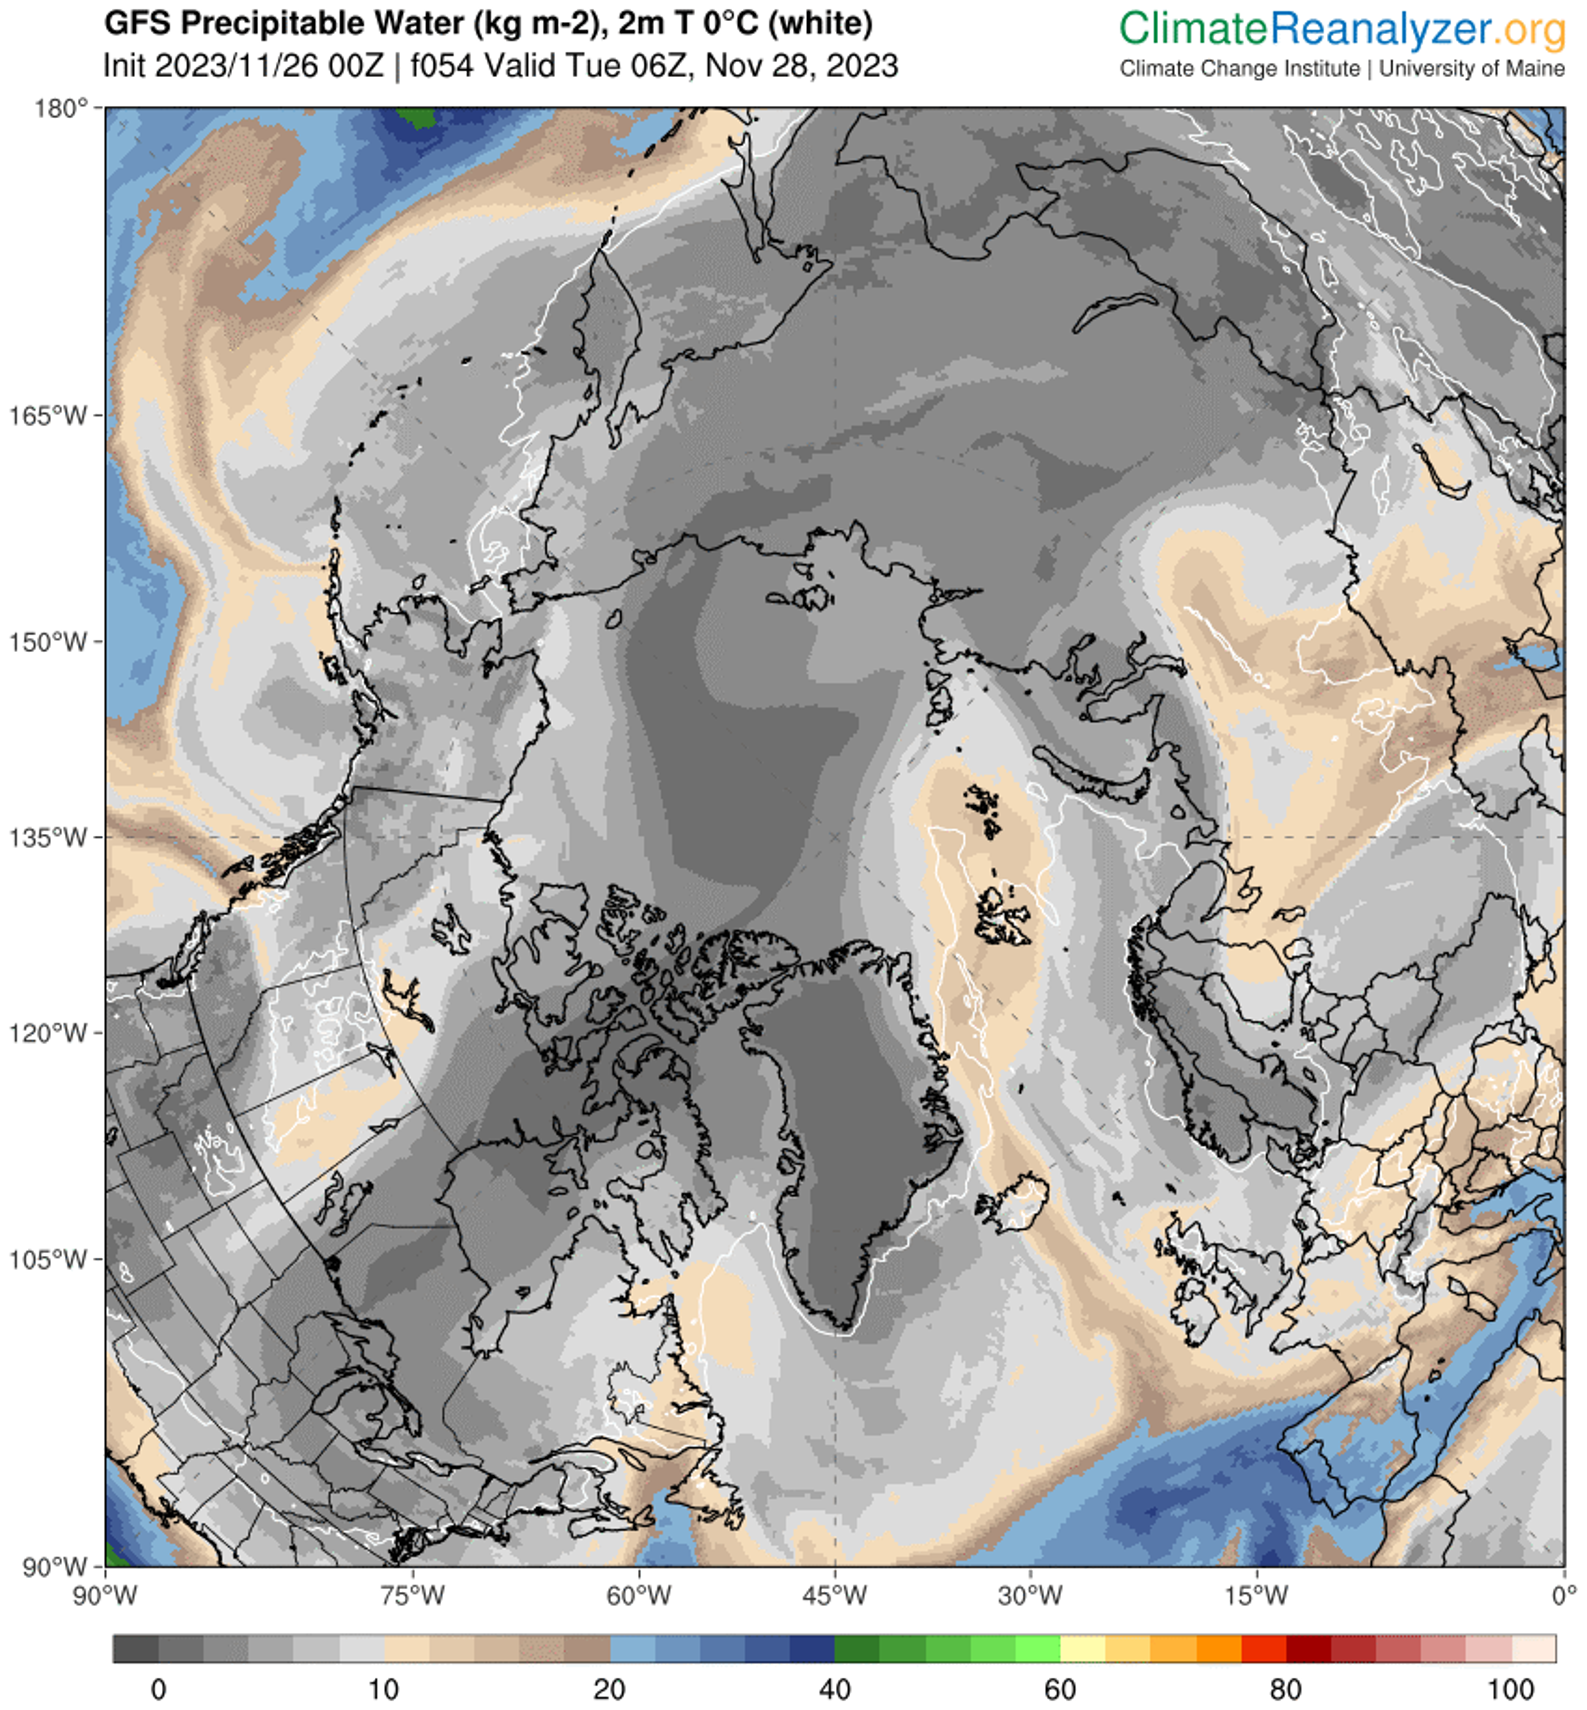
By this morning Ingunn had merged with the remnants of the prior cyclone, as revealed in Climate Reanalyzer’s visualisation of the latest GFS model run::
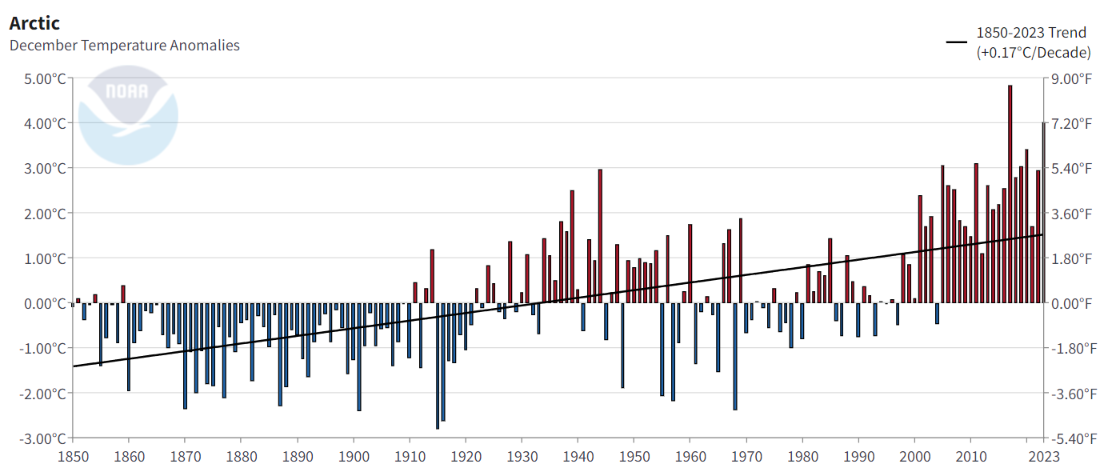
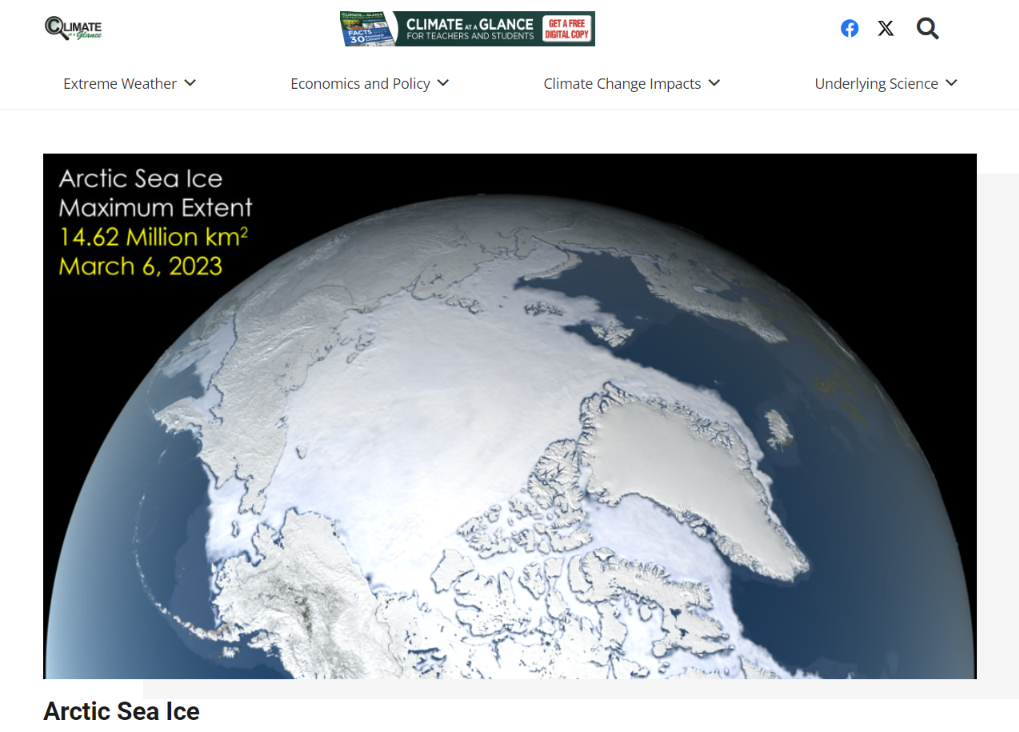
I was mildly surprised when a somewhat “skeptical” interlocutor of my Arctic alter ego linked to “Climate at a Glance” in the course of our alleged “debate”. I was even more surprised to discover that the far end of the suggested link was not NOAA’s familiar overview of the Arctic temperature trend:
but instead a similarly named web site proudly sponsored by the Heartland Institute:
The “Climate at a Glance” home page currently features the Arctic at the top, and it probably won’t surprise you to learn that the linked article is full of half truths and untruths about “Snow White’s” favourite topic? Here are the Heartland Institute’s key Arctic takeaways:
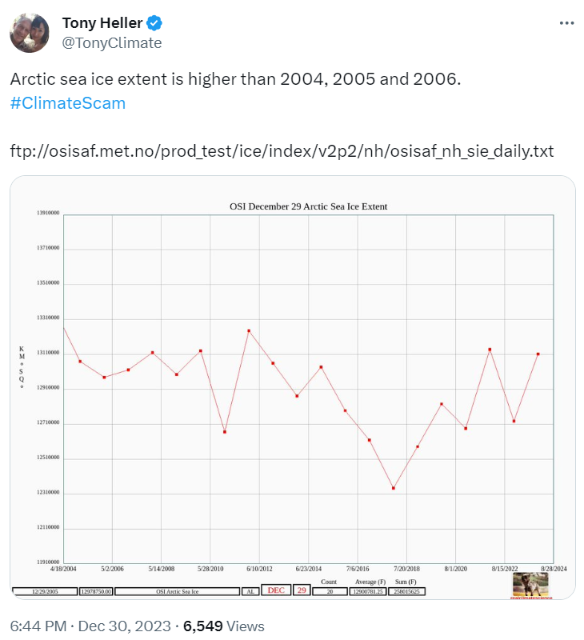
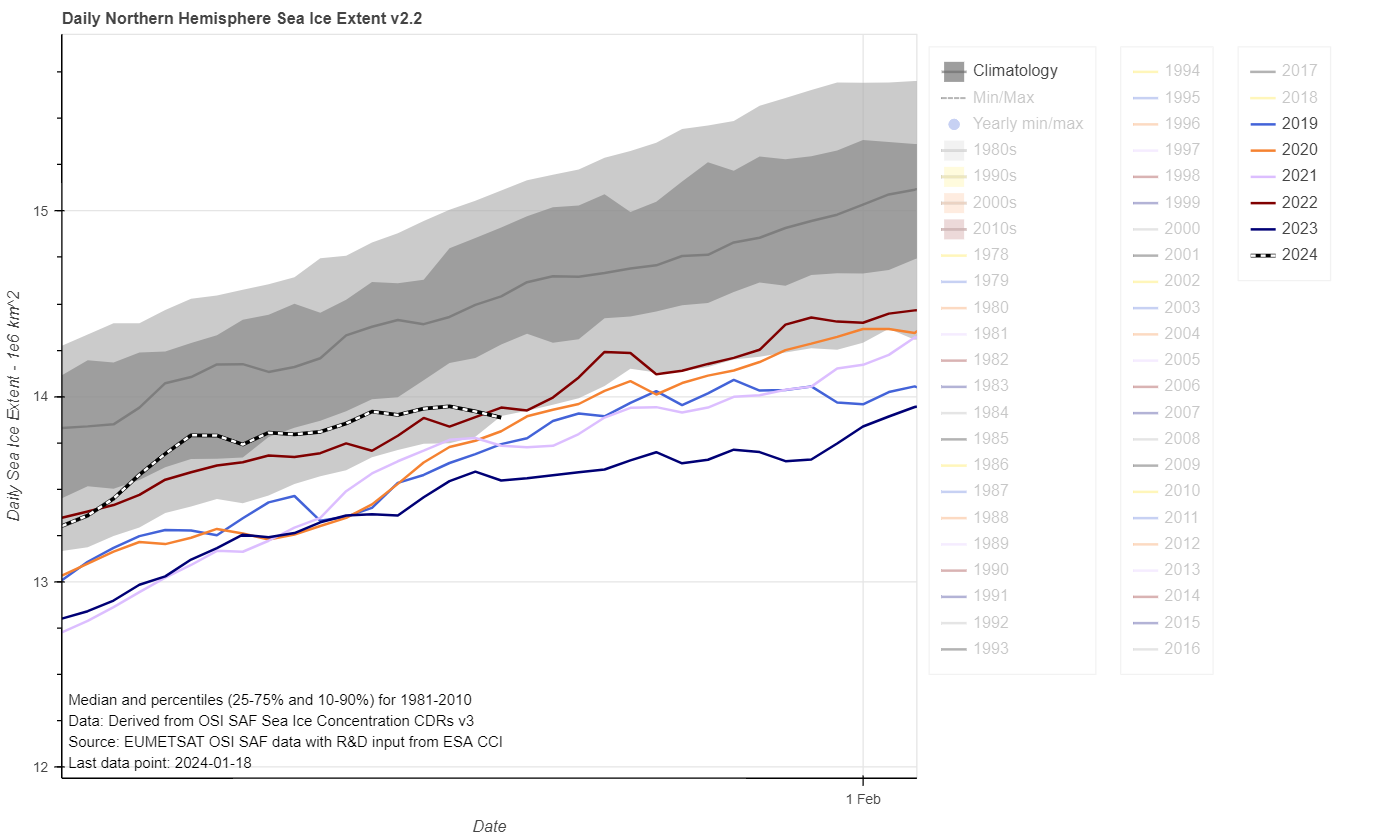
Apart from (presumably accidentally) empirically confirming global warming and Arctic sea ice volume decline, Tony Heller has also been frantically attempting to persuade his flock of faithful followers that the current value of the OSI SAF’s extent metric means that the impending series of “2023 has been the hottest year evah!” stories are all lies.
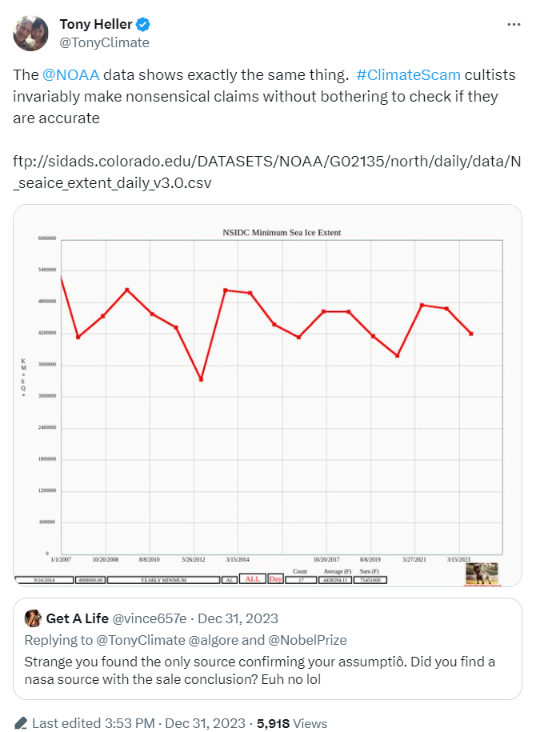
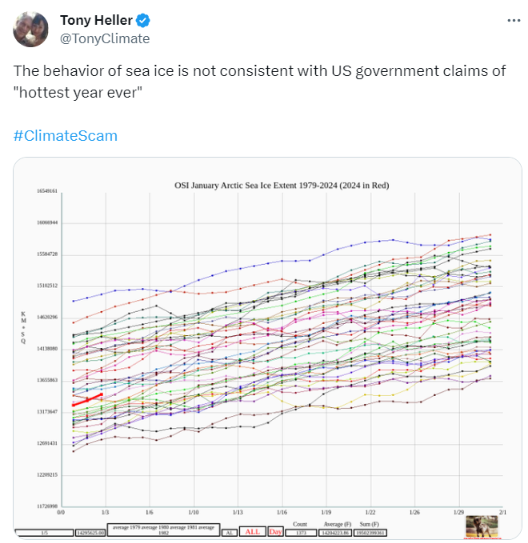
Here a few examples of his infamous oeuvre, together with “Snow White’s” responses:
Can you rustle up one of those for another date Tony?
Switching swiftly to a cherry picked graph of the OSI SAF minimum extent, Tony invokes the spirit of a deceased parrot that went to meet its maker several decades ago. He remains blissfully unaware that I watched the Monty Python dead parrot sketch when it was first broadcast:
When do you suppose Tony will get around to implementing my suggestion of revealing the OSI SAF extent graph for December 8th to his flock of faithful followers?
Or a multi decade graph of NSIDC extent for that matter?
[Update – January 4th]
My prediction has come true in next to no time:
[Update – January 20th]
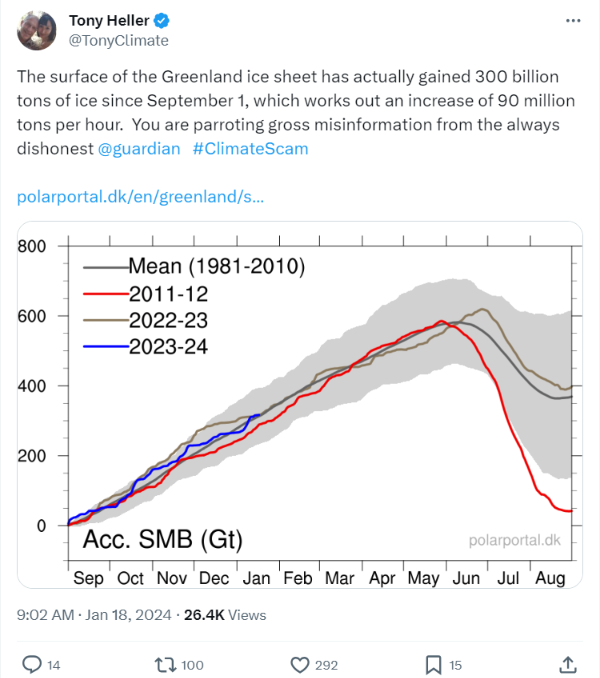
For some strange reason Tony has been silent about Arctic sea ice extent for a while, and has moved on to the Greenland ice sheet instead:
Presumably that’s in response to an article in The Guardian:
The Greenland ice cap is losing an average of 30m tonnes of ice an hour due to the climate crisis, a study has revealed, which is 20% more than was previously thought…
The study, published in the journal Nature, used artificial intelligence techniques to map more than 235,000 glacier end positions over the 38-year period, at a resolution of 120 metres. This showed the Greenland ice sheet had lost an area of about 5,000 sq km of ice at its margins since 1985, equivalent to a trillion tonnes of ice.
“Snow White” felt compelled to respond to Mr. Heller as follows:
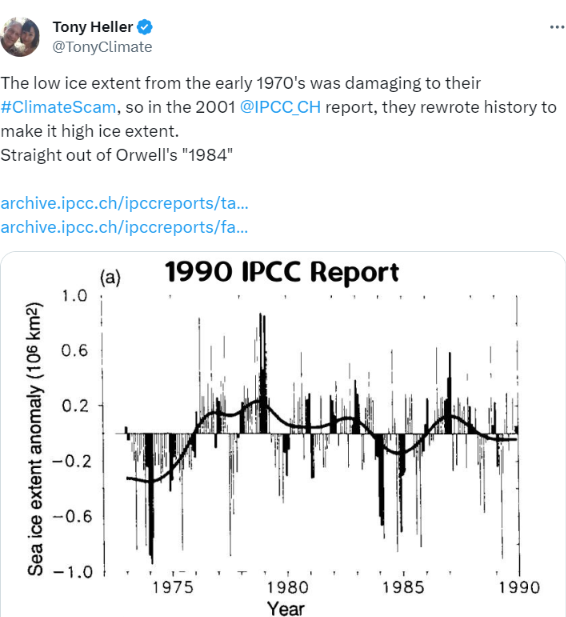
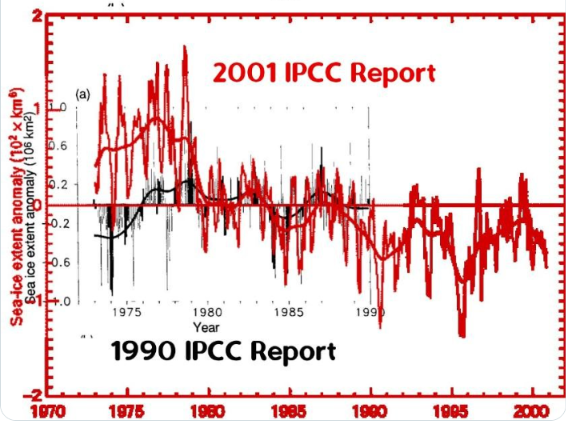
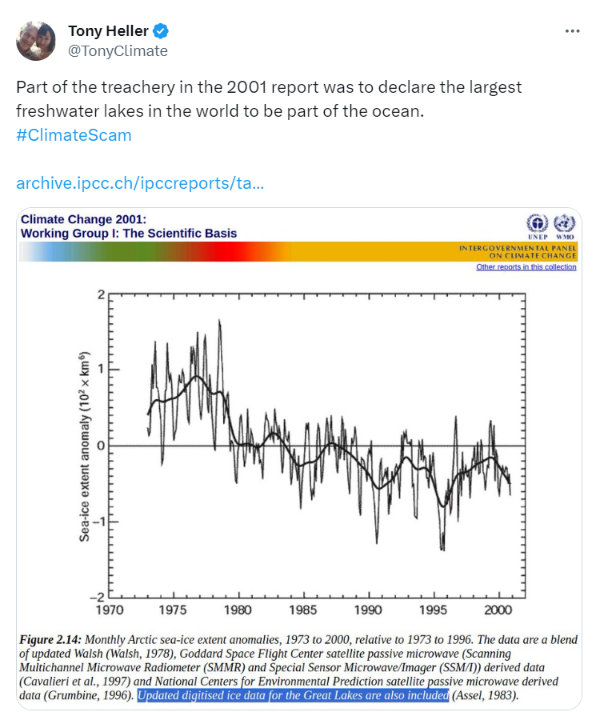
Evidently Tony has still not learned that it’s impossible to compare 1990 apples with 2001 oranges, despite having the difference explained to him on numerous previous occasions.
Stop Press! Tony has suddenly discovered that he’s been comparing apples with oranges all these years!!
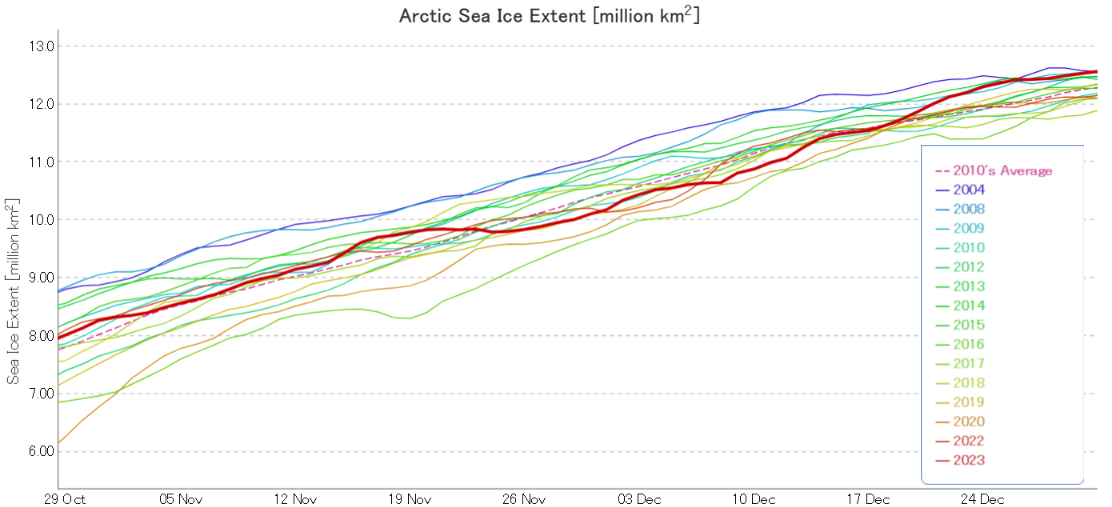
Whilst waiting for the all important thickness and volume data to arrive, we’ll start the new year in traditional fashion with a graph of JAXA extent:
The 2023 calendar year finished with this particular extent metric sitting at 15th lowest in the satellite era.
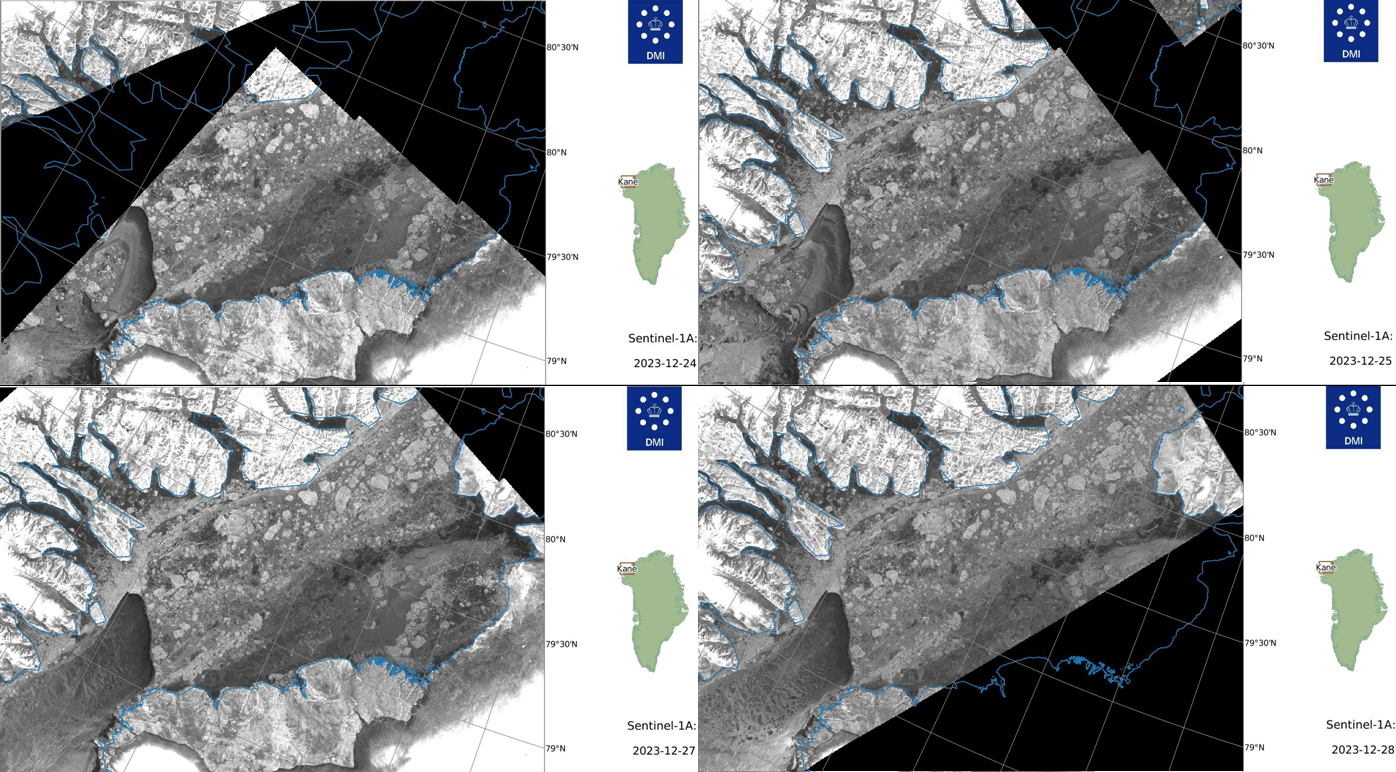
From Niall Dollard on the Arctic Sea Ice Forum comes evidence via the Sentinel 1A satellite that an arch formed in the Nares Strait between Greenland and Ellesmere Island in late December:
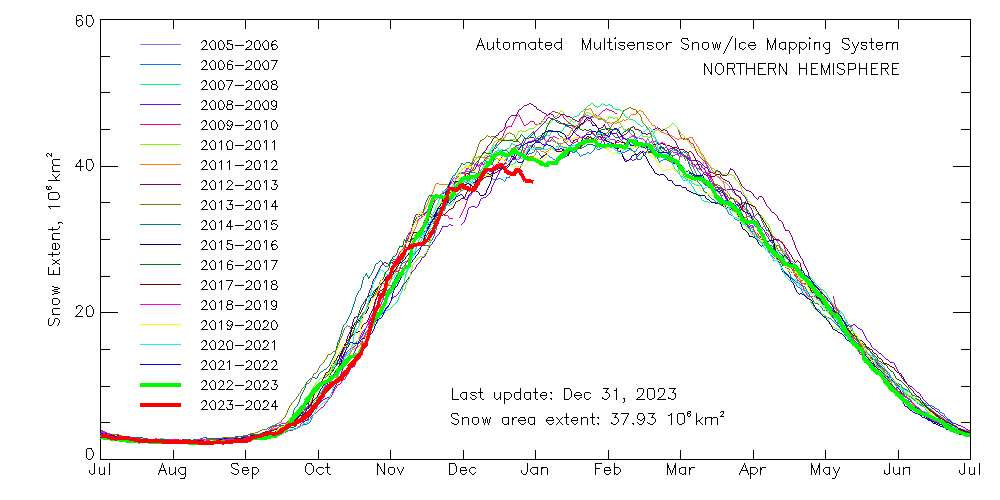
Please note the current record low NH snow extent. Matt predicts all that is about to change:
How sure? And in what way "totally different"?
Have you pointed out to Tony yet that the current daily snow cover data you cite utterly negates his recent assertion that "Autumn/Winter snow cover has been increasing for almost 60 years"?
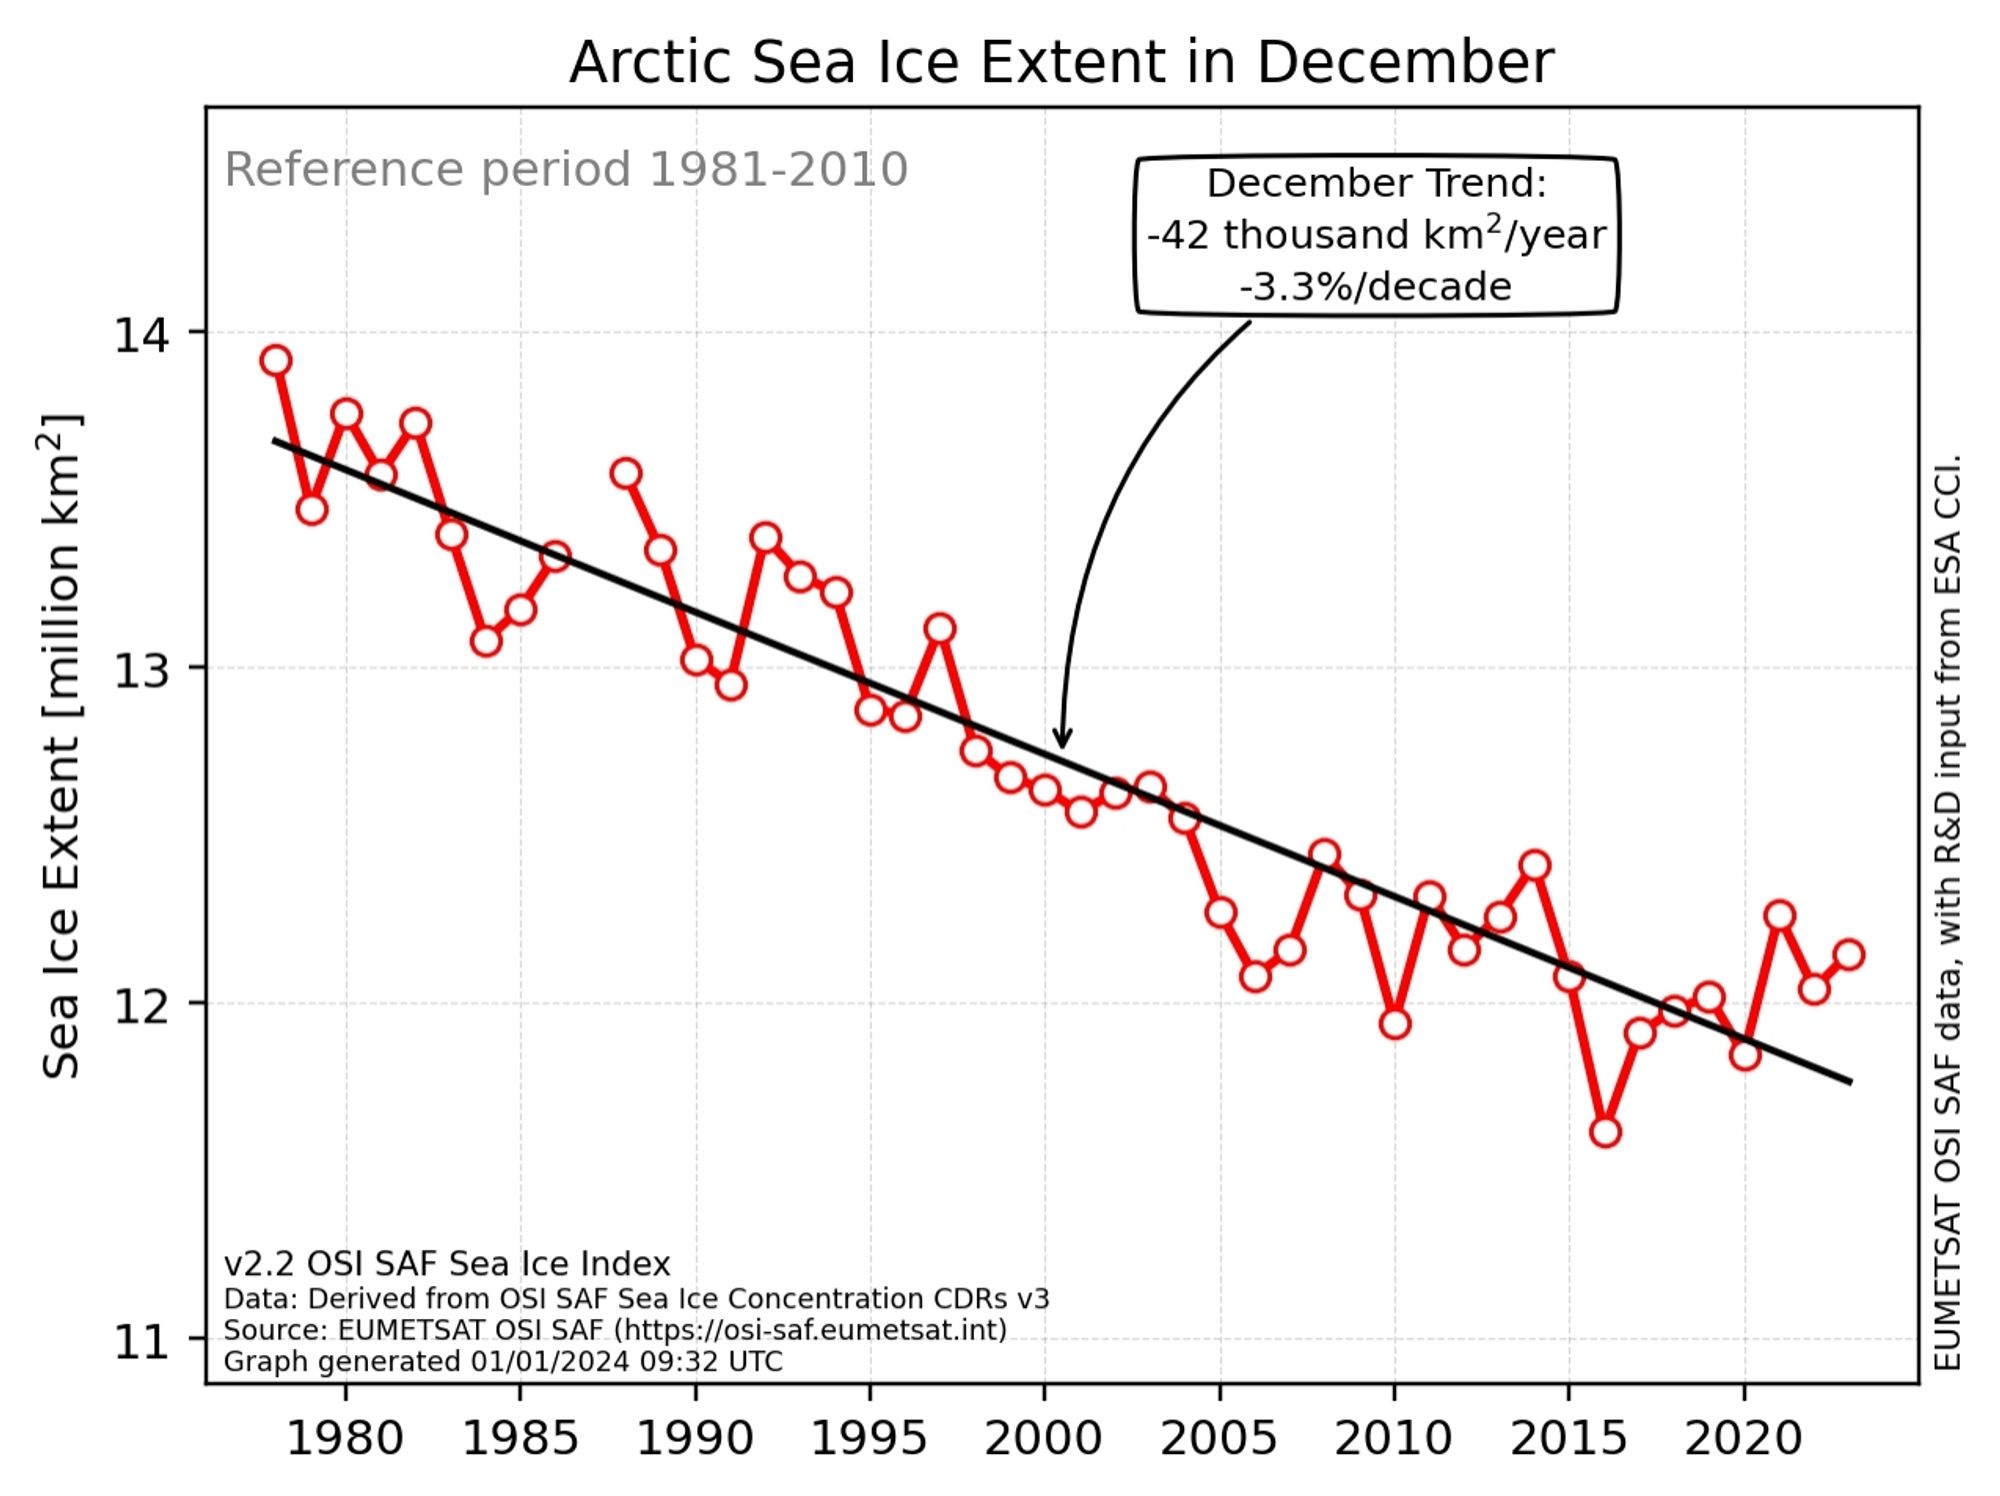
Hot off the Scandinavian virtual printing presses, here is the official December Arctic sea ice extent trend graph from the OSI SAF:
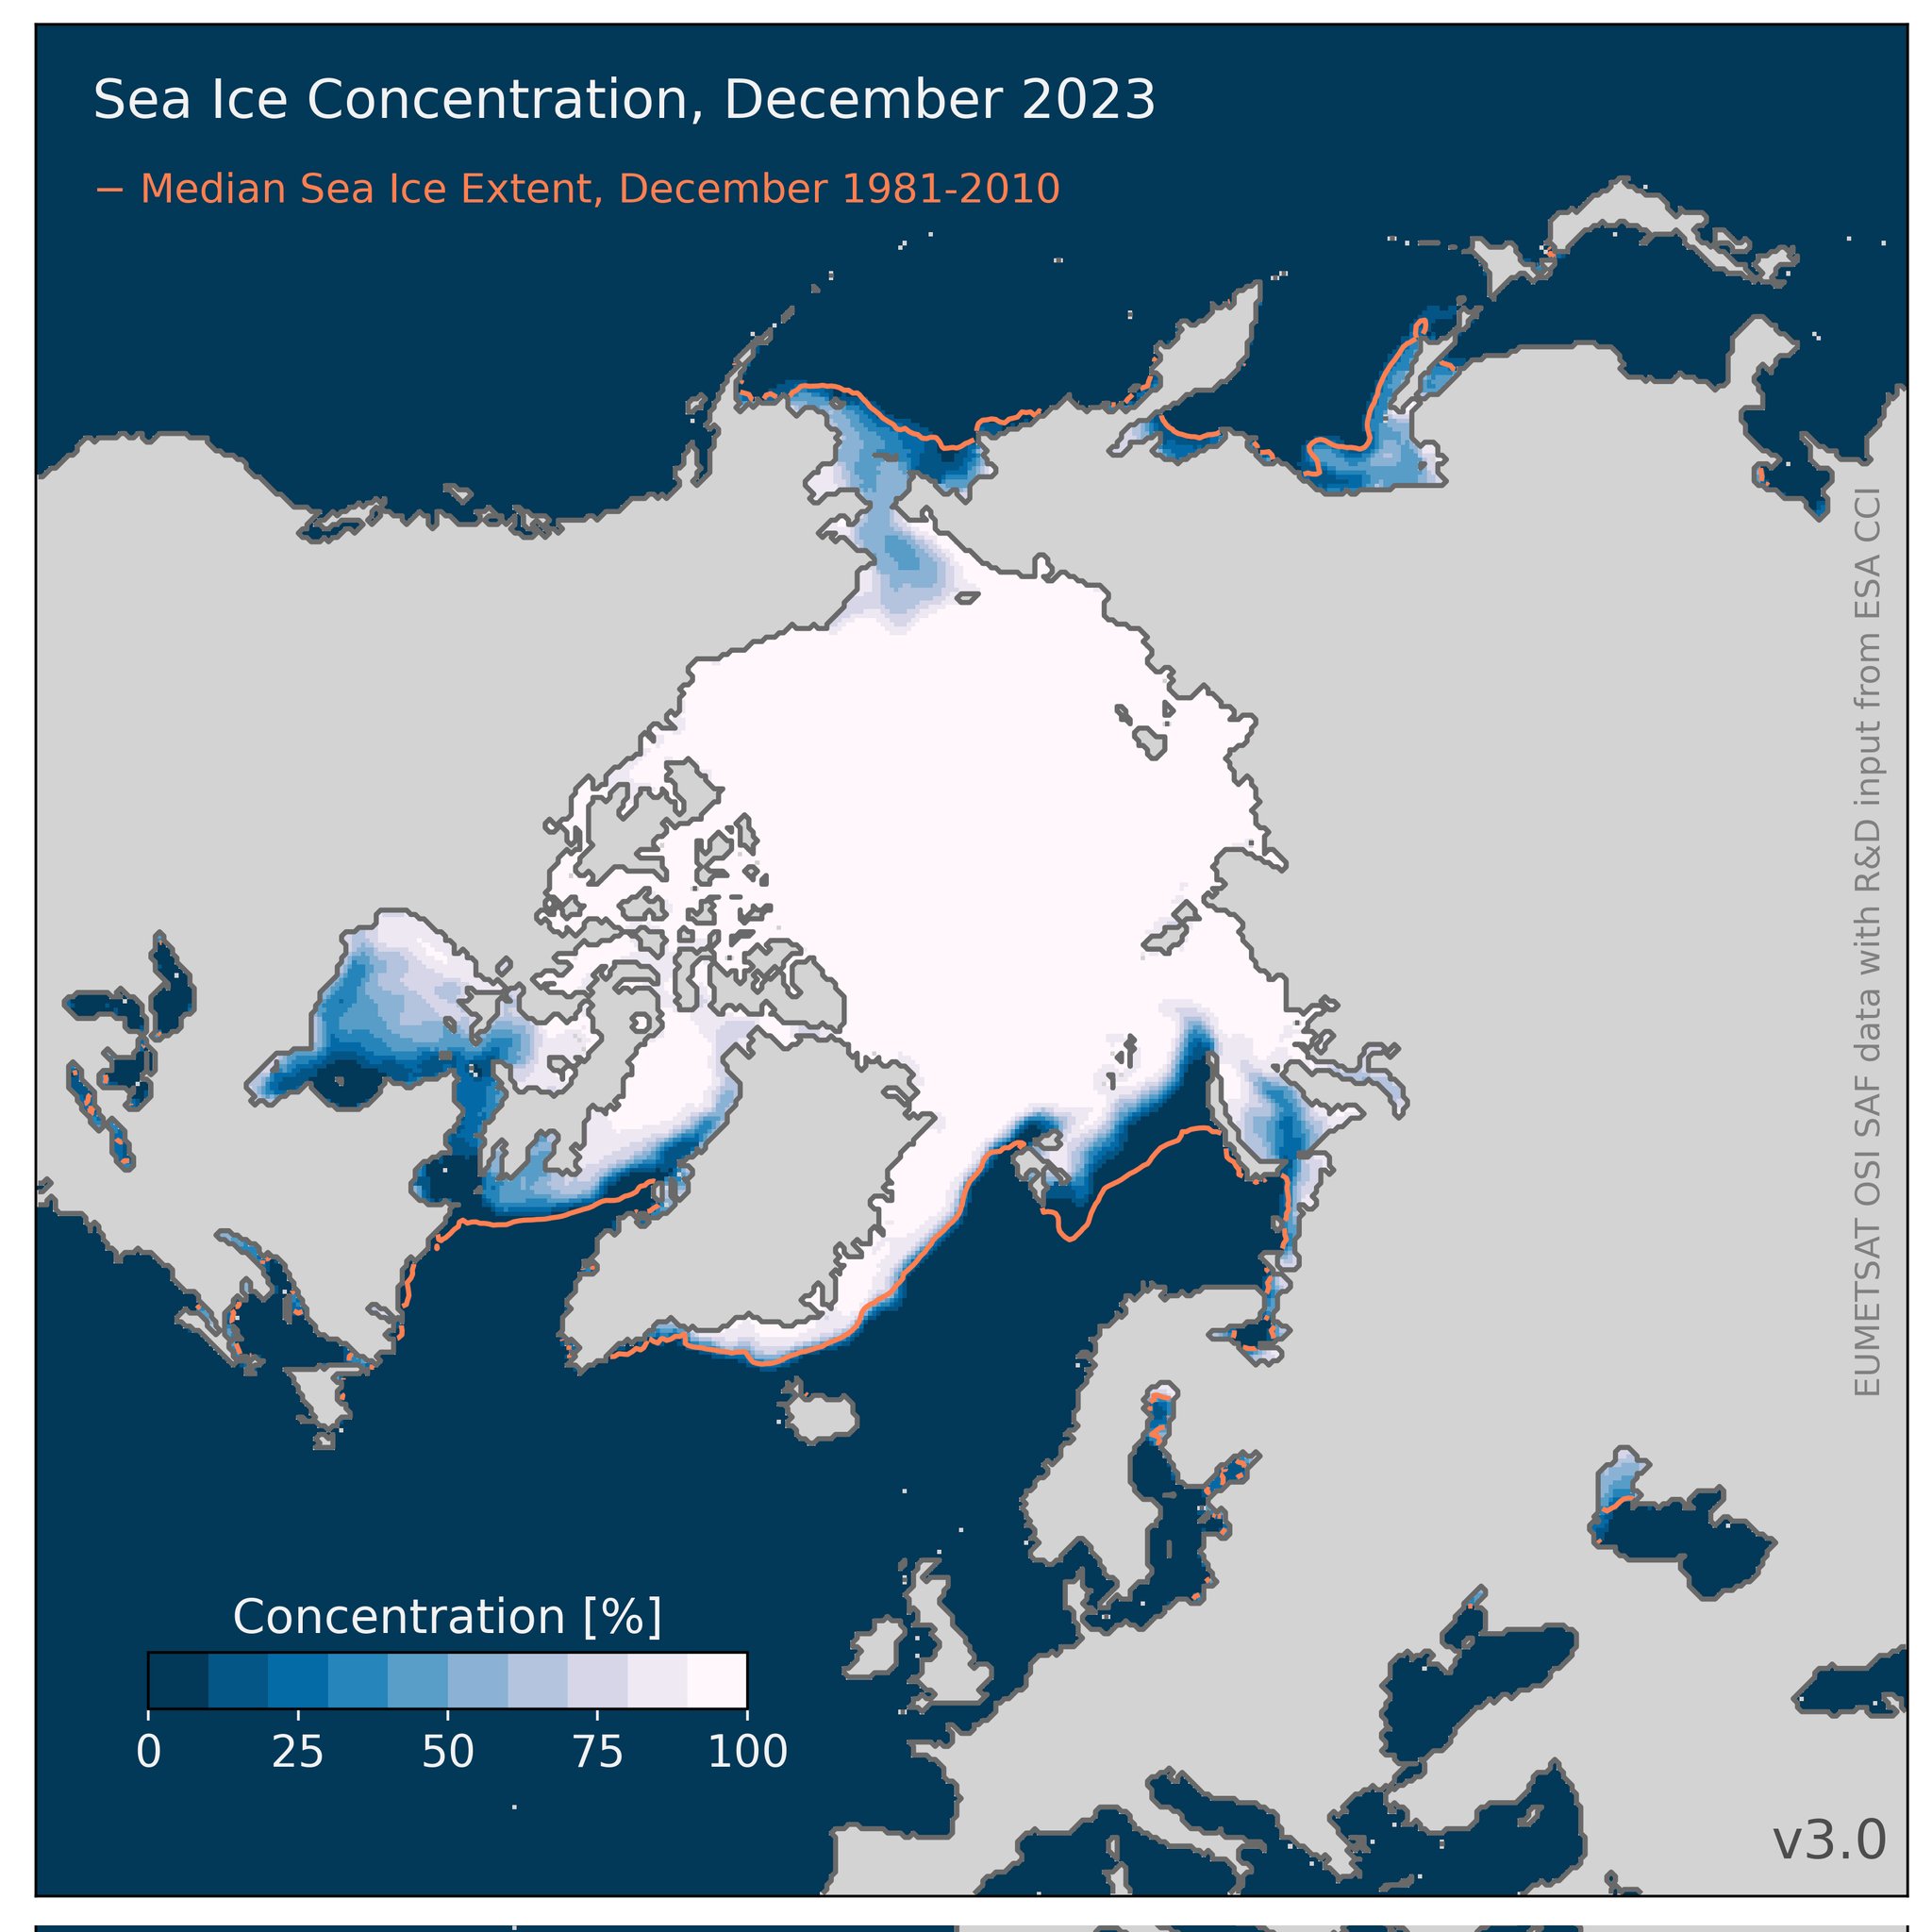
That’s “Steve”/Tony’s current metric du jour. When do you suppose he will bring it to the attention of his horde of regular readers? It’s accompanied by this matching concentration map:
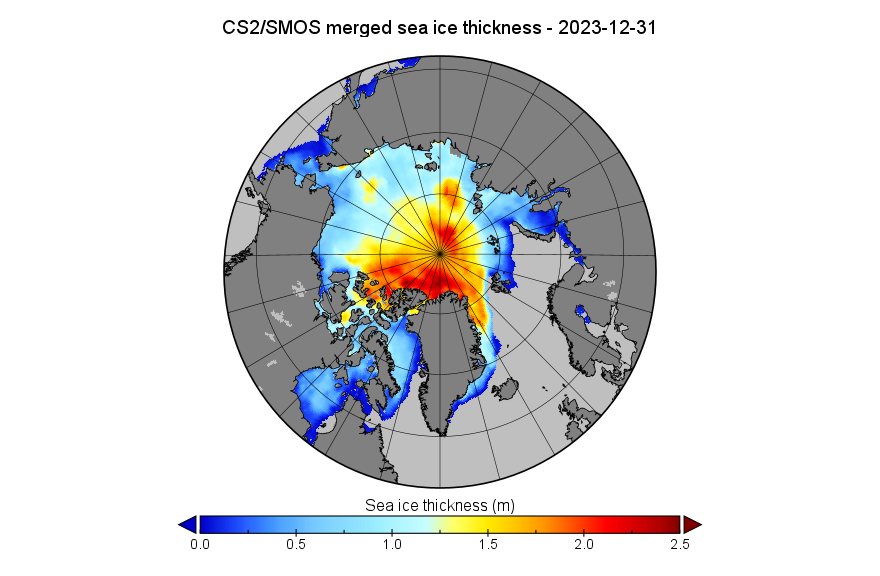
Here too is the CryoSat-2/SMOS thickness map for December 31st, in a different format to the one usually used here:
[Update – January 3rd]
The December PIOMAS modelled gridded thickness data has been released. The calculated volume is 6th lowest in the satellite era:
Here is the equivalent CS2/SMOS volume graph
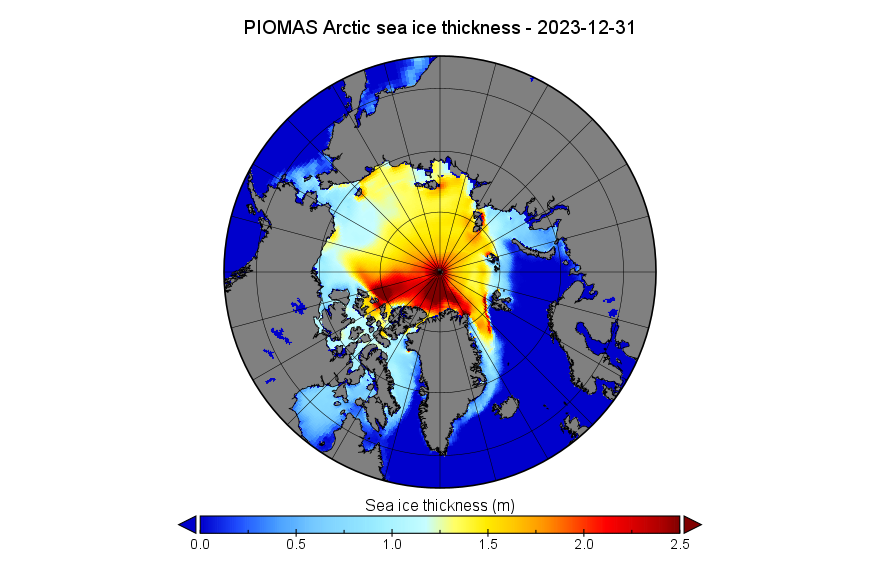
Here too is the PIOMAS thickness map for December 31st:
This uses the same Greenland down orientation and 2.5 meter maximum scale value as the CS2/SMOS map above.
The end of 2023 had above average sea ice growth, bringing the daily extent within the interdecile range, the range spanning 90 percent of past sea ice extents for the date. Rapid expansion of ice in the Chukchi and Bering Seas and across Hudson Bay was responsible.
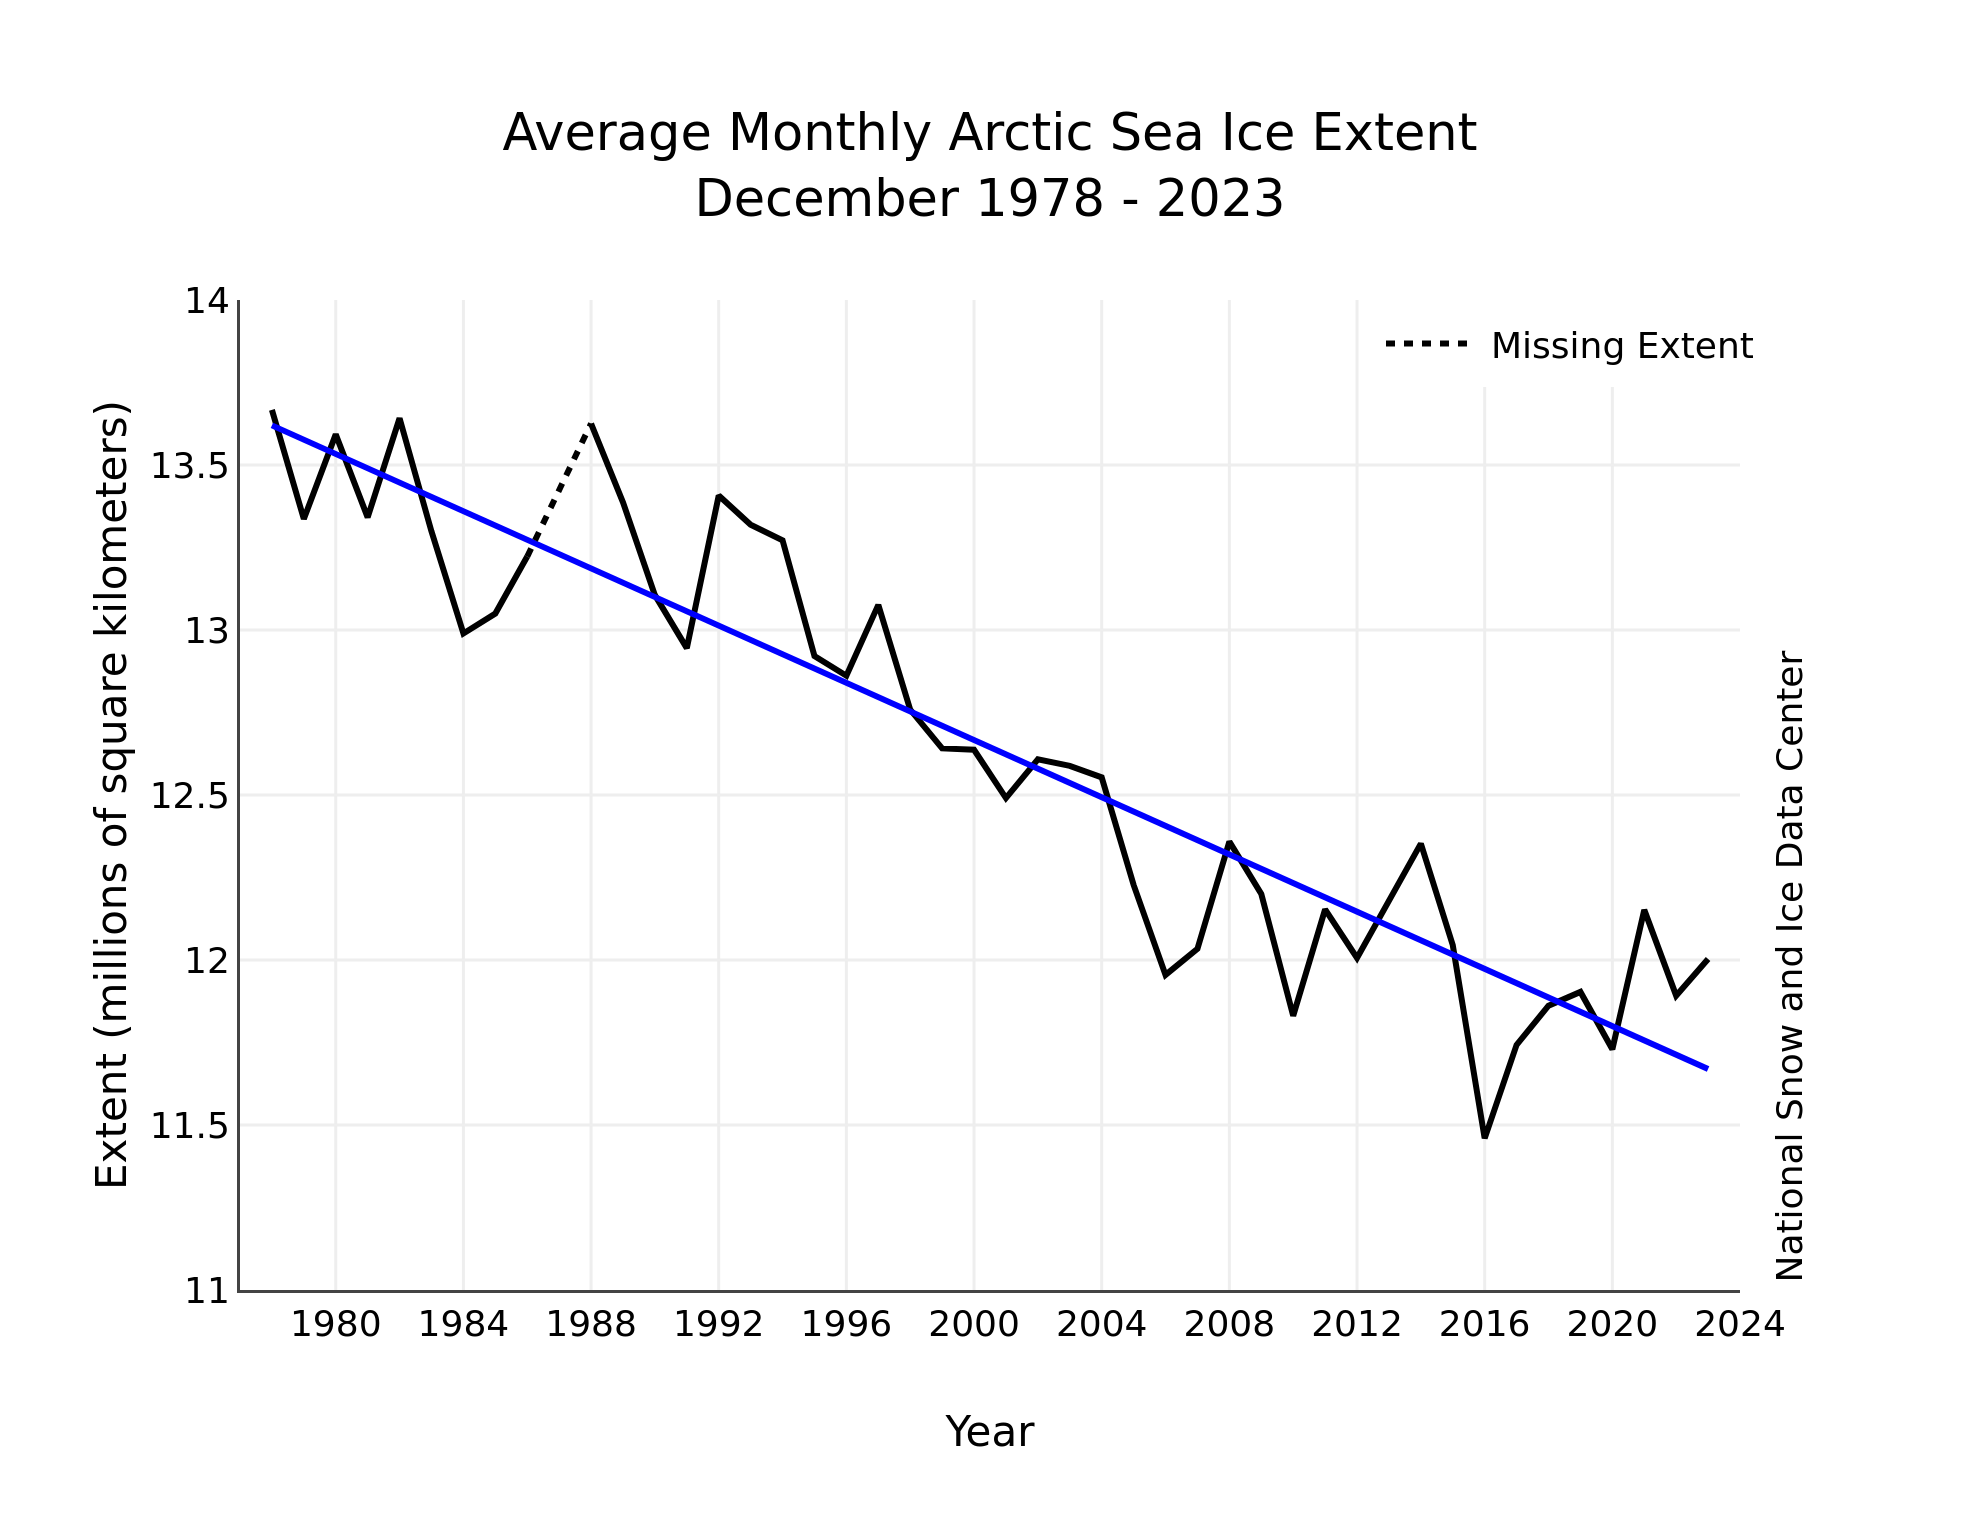
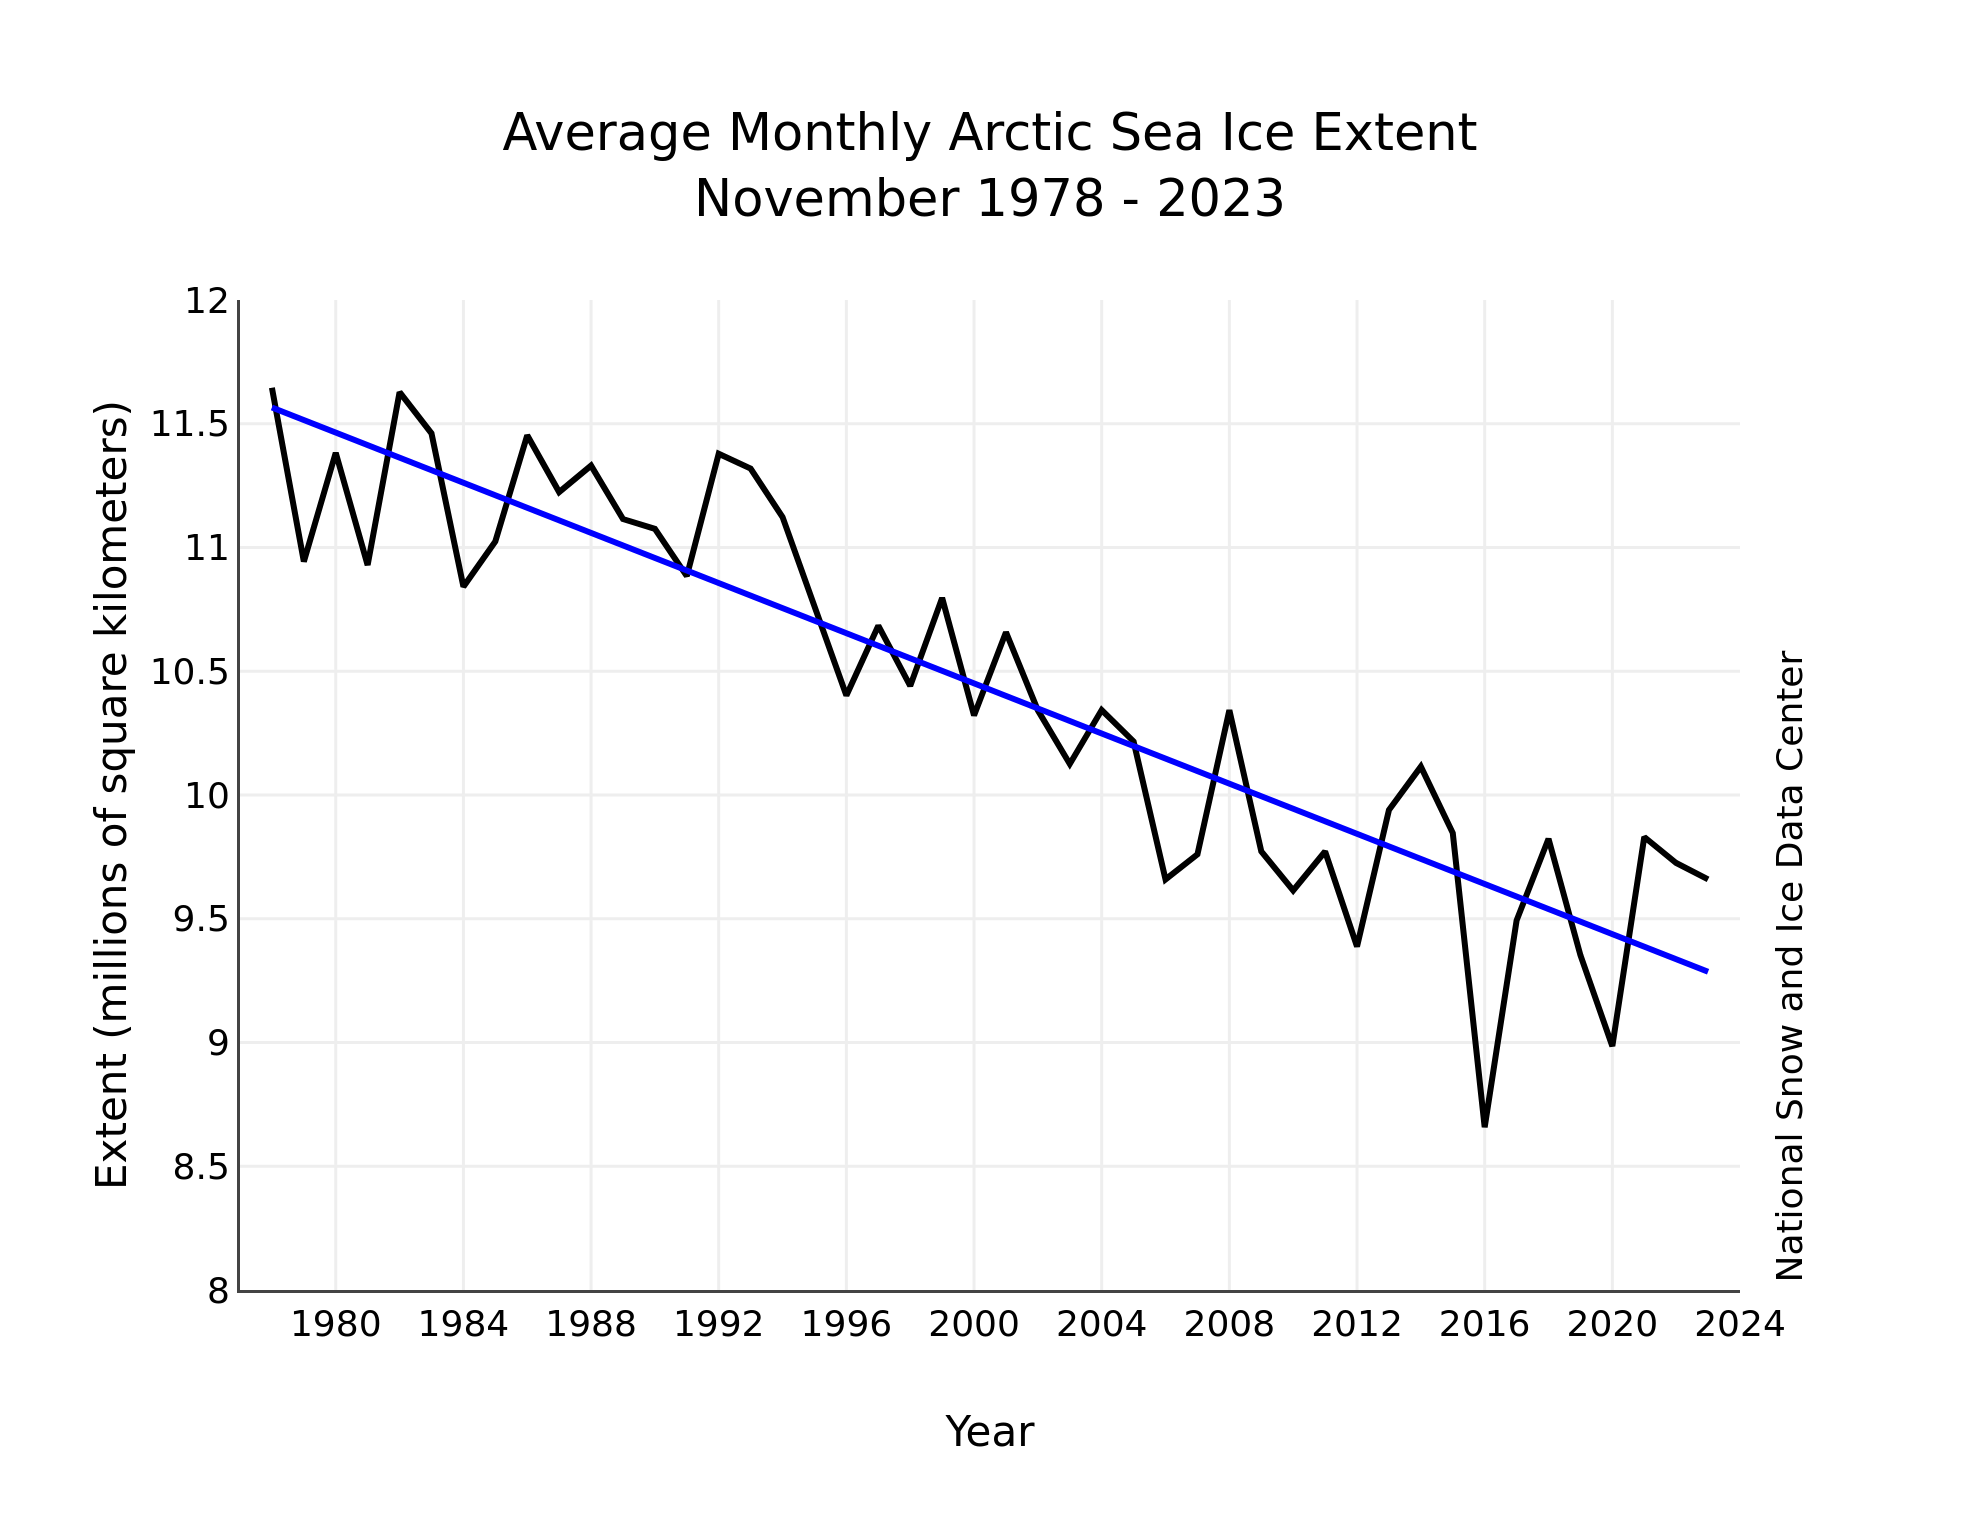
Average Arctic sea ice extent for December 2023 was 12.00 million square kilometers, ninth lowest in the 45-year satellite record . Sea ice extent increased by an average of 87,400 square kilometers per day, markedly faster than the 1981 to 2010 average of 64,100 square kilometers per day.
After a delayed start to the freeze-up in Hudson Bay, sea ice formed quickly from west to east across the bay, leaving only a small area of open ocean near the Belcher Islands at month’s end. In the northern Atlantic, sea ice extent remained below average extent, as has been typical for the past decade.
For December overall, 2023 had the third highest monthly gain in the 45-year record at 2.71 million square kilometers, behind 2006 at 2.85 million square kilometers and 2016 at 2.78 million square kilometers.
Moving on to the “Conditions in context” section:
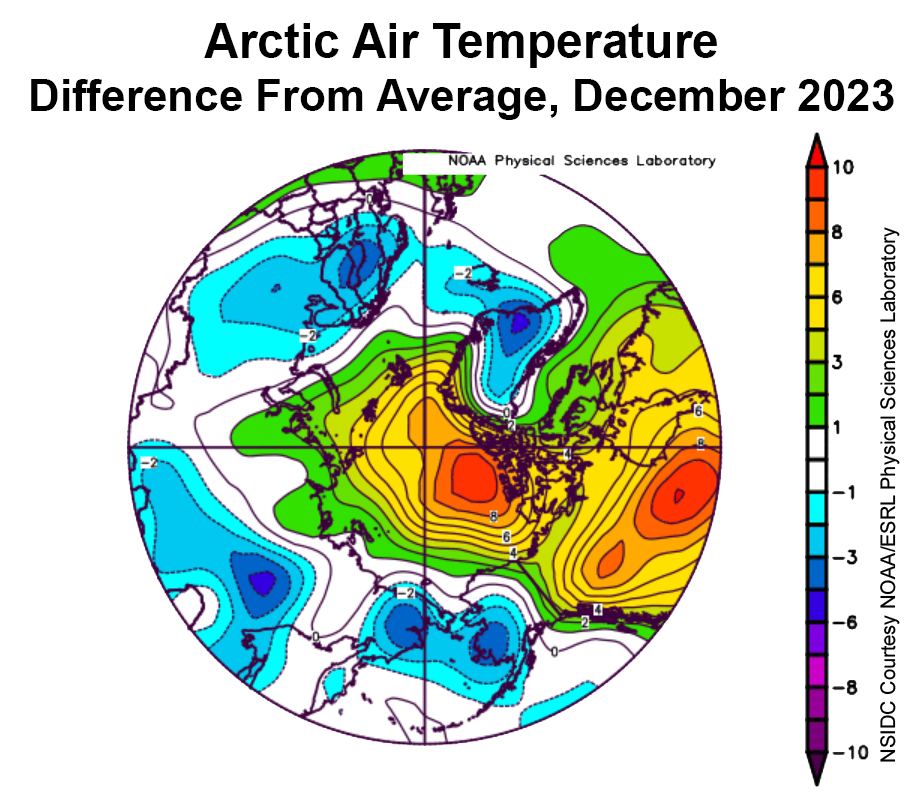
Warm conditions prevailed over the central Arctic Ocean and Beaufort Sea regions, as well as over Hudson Bay and much of northern Canada, with air temperatures at the 925 millibar level (around 2,500 feet above sea level) 8 to 9 degrees Celsius above the 1991 to 2020 average. Elsewhere, relatively cool conditions prevailed, with air temperatures 2 to 4 degrees Celsius below average in southwestern Alaska, easternmost Russia, Scandinavia, and southeast Greenland. Cool conditions in the Bering and southern Chukchi Seas explain the rapid ice growth there. By contrast, the warm conditions over Hudson Bay, continuing since November, explain its delayed start of ice formation there.
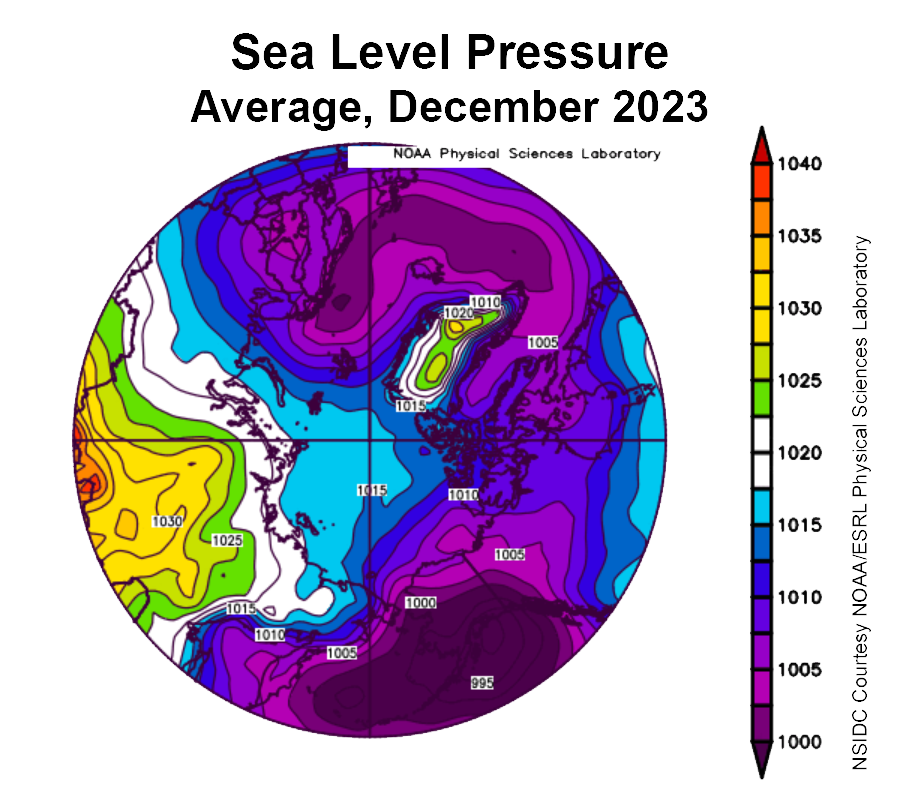
The atmospheric circulation pattern for December was marked by low sea level pressure over the Gulf of Alaska and northern Europe and high sea level pressure over central Russia. This pattern led to cold Arctic air flowing across the Chukchi Sea and into the Bering Sea as well as advection of relatively warm air across Canada into the Beaufort Sea:
Here’s a taste, but there’s much more at the dedicated article linked to above:
[Update – January 12th]
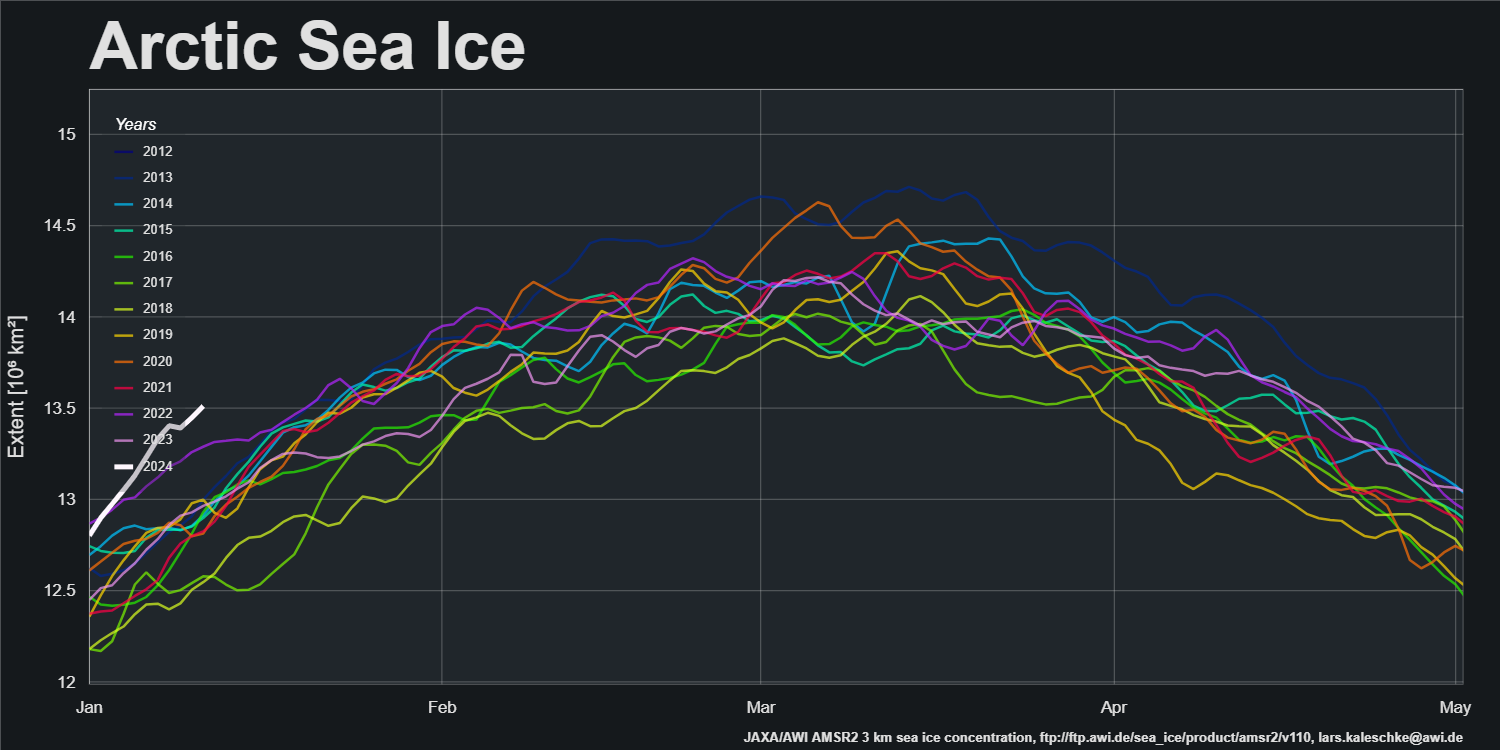
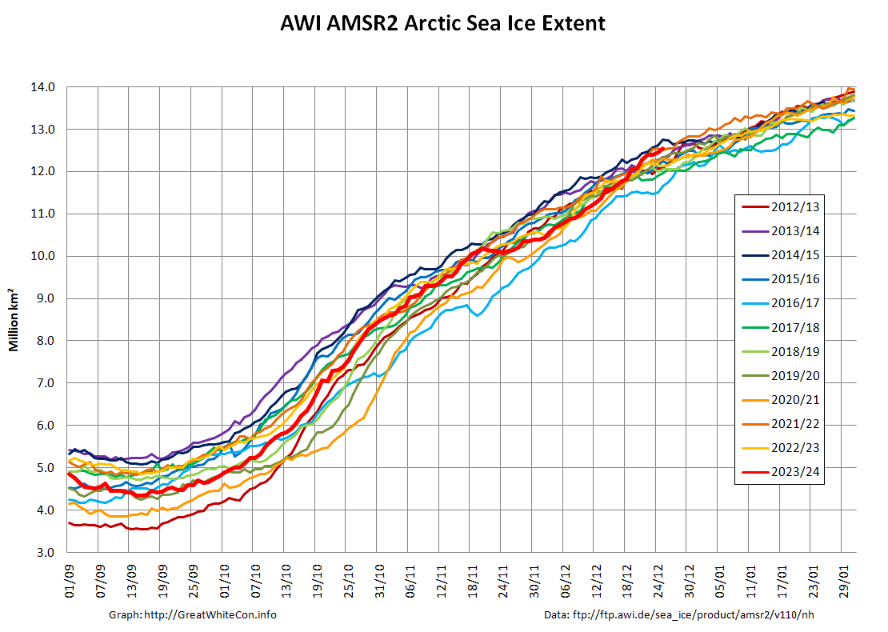
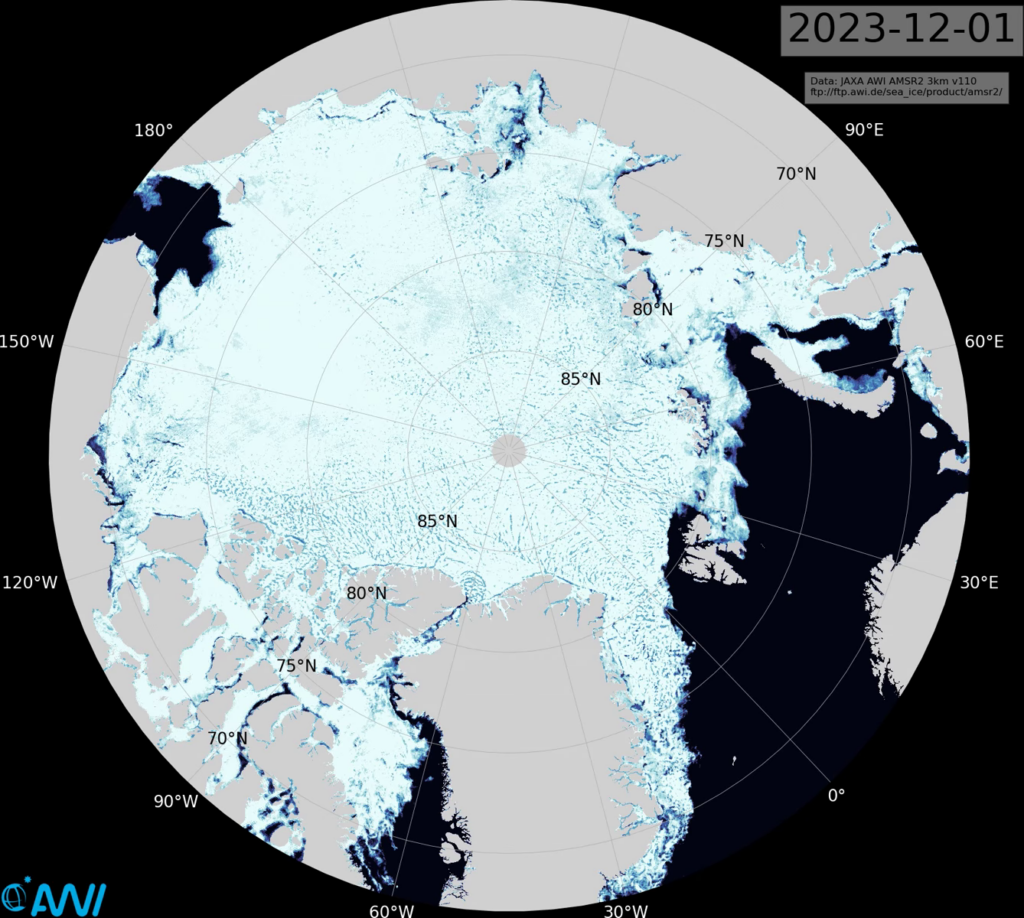
A change is as good as a rest, so here’s the AWI “high resolution” AMSR2 Arctic wide sea ice extent graph
It’s currently highest for the date in the AMSR2 era by a significant margin.
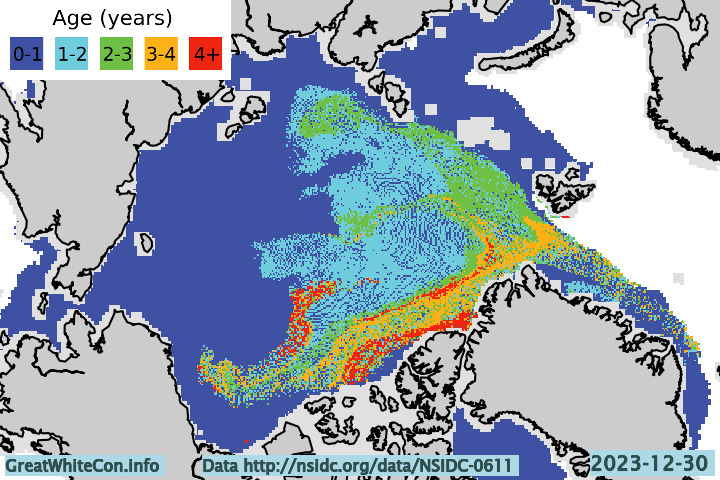
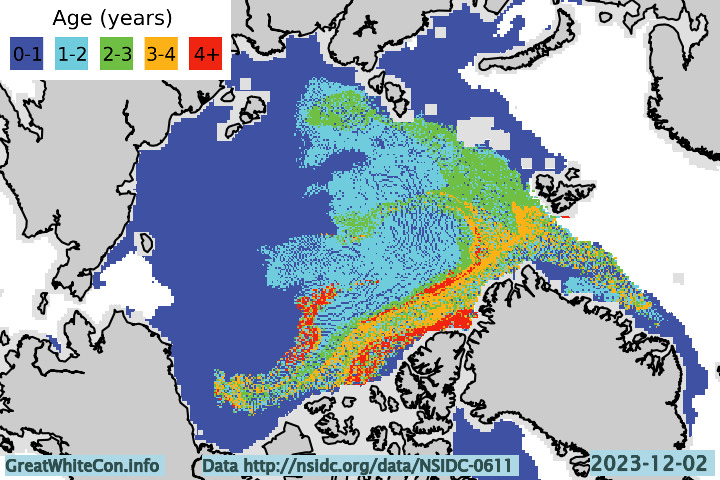
Here too is the ice age map for the end of 2023:
[Update – January 19th]
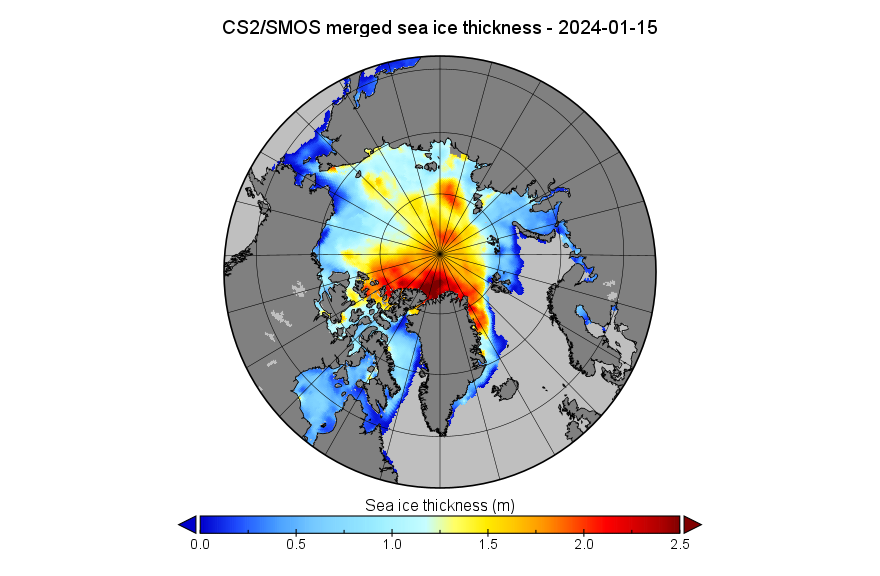
Something seems to have gone wrong with the processing of the mid-month PIOMAS gridded thickness data. For the moment we’ll have to make do with just the CryoSat-2/SMOS thickness map:
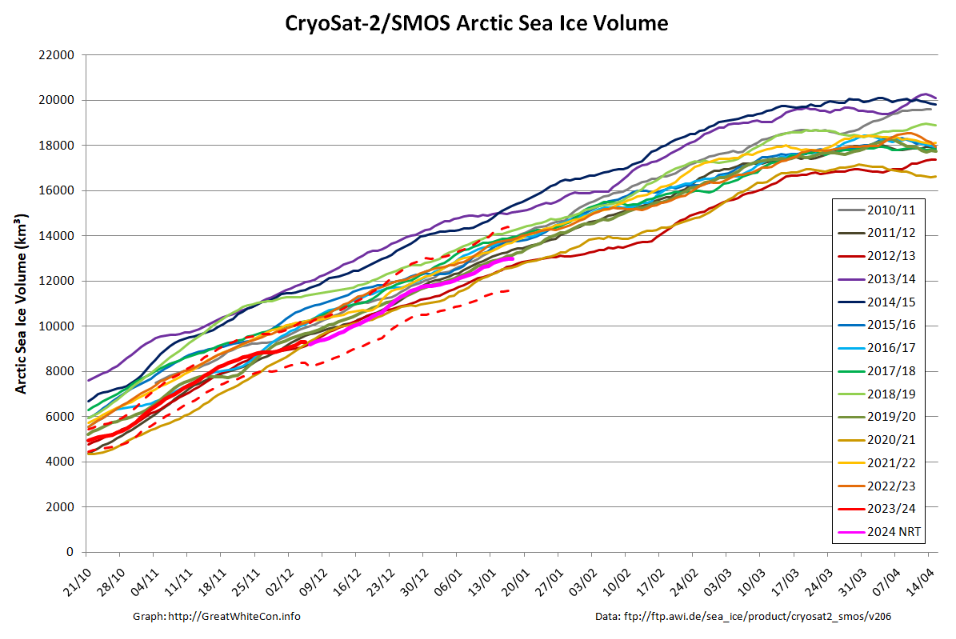
and volume graph:
With the perennial caveat of a probable upward revision when the reanalysed data is released, Arctic sea ice volume is still close to the bottom of the range during the CryoSat-2 era.
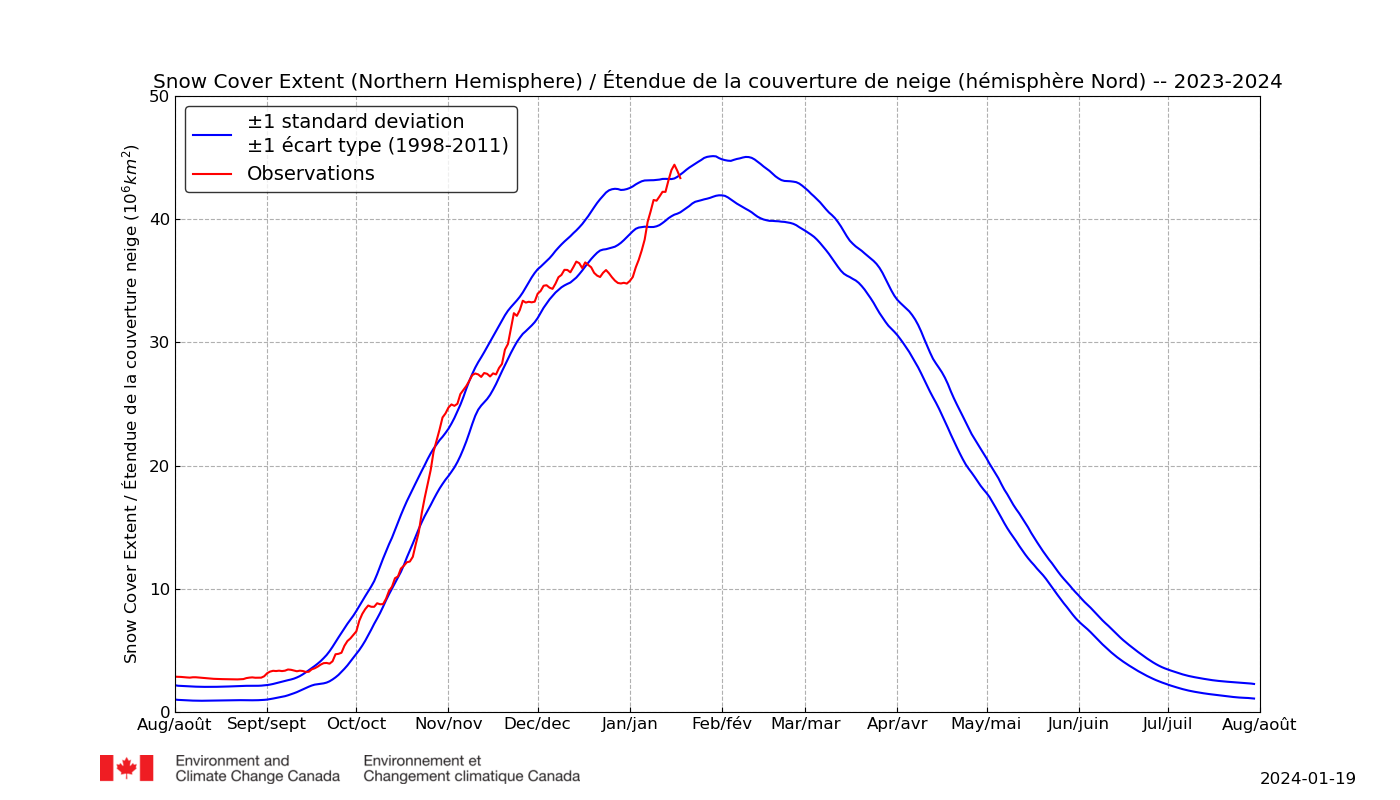
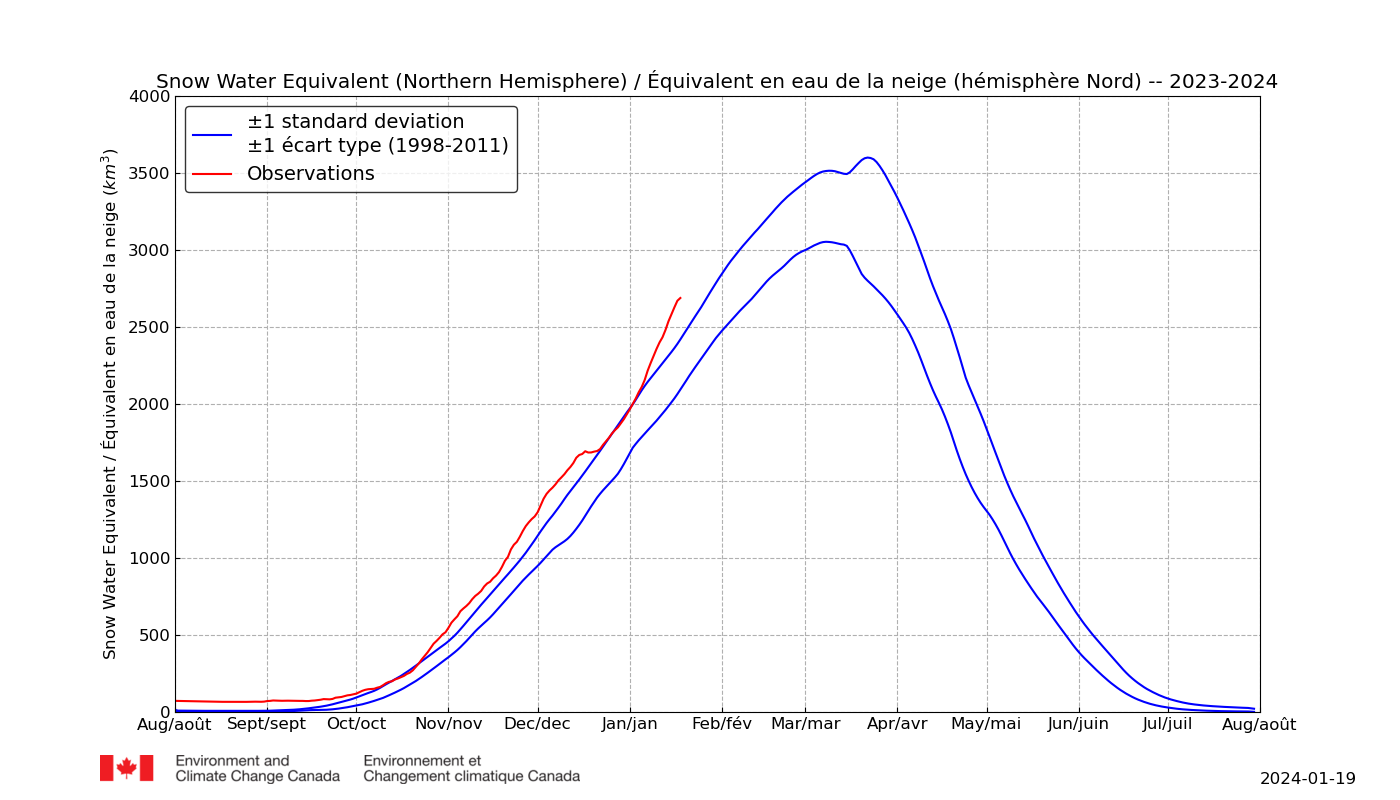
In addition especially for Matt, “Steve”/Tony and numerous others of a “skeptical” persuasion, here are the latest Environment & Climate Change Canada snow extent and snow water equivalent graphs for the northern hemisphere:
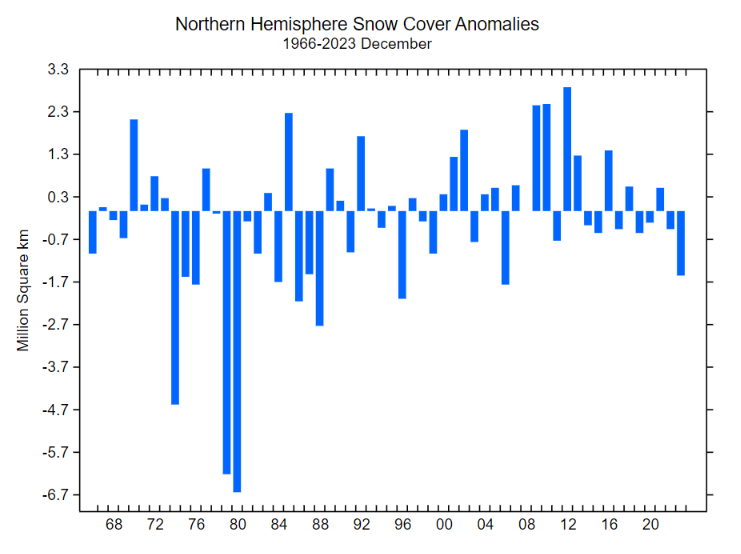
Last but certainly not least is the Rutgers Global Snow Lab northern hemisphere snow cover anomaly chart for December:
[Update – January 29th]
A winter cyclone is stirring up the far North Atlantic. It’s currently forecast to bottom out later today with a minimum MSLP of 937 hPa:
The storm has been creating a long period swell directed at the ice edge in the Barents Sea. By midnight that swell will be battering the ice in the Fram Strait too:
[Update – January 30th]
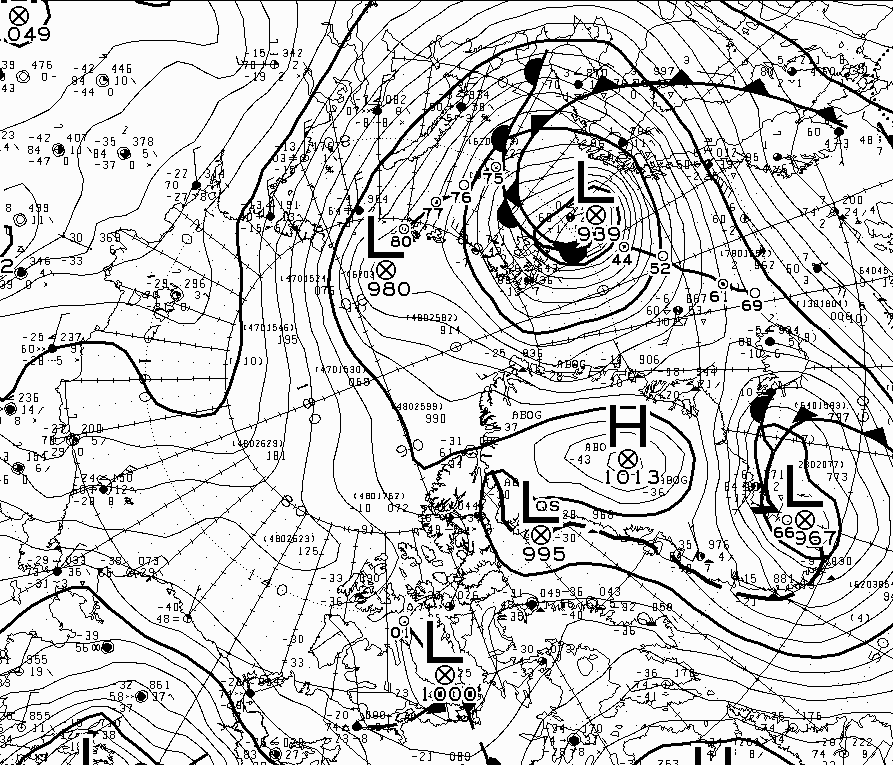
According to Environment Canada the cyclone bottomed out with an MSLP of 939 hPa at 12 PM UTC yesterday:
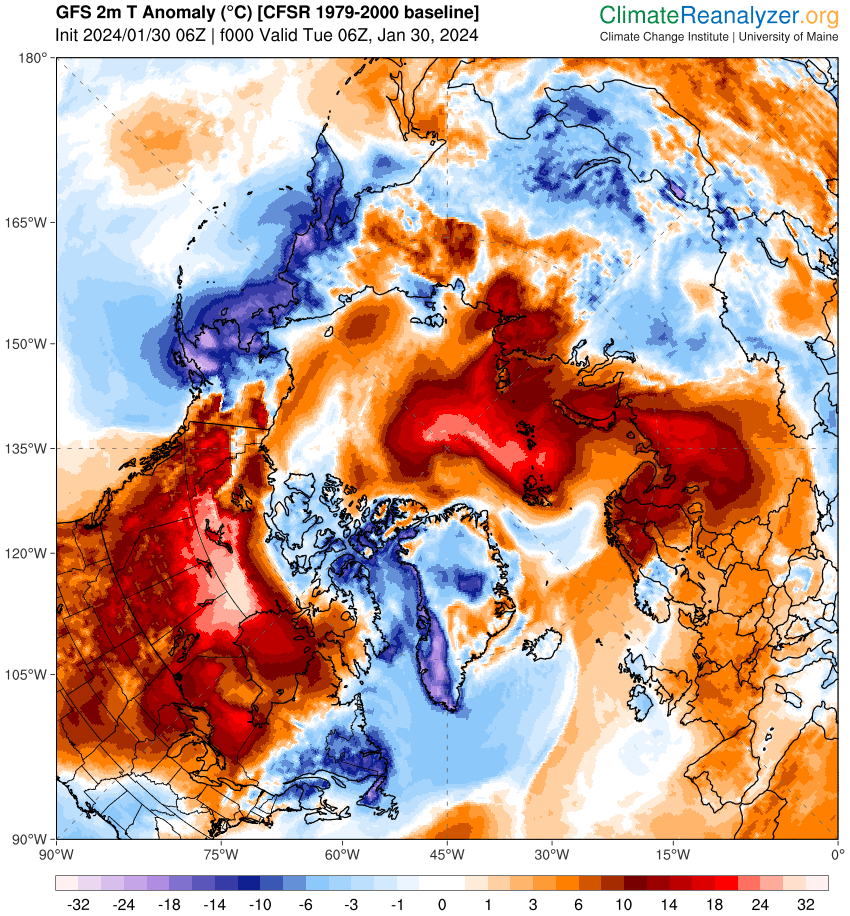
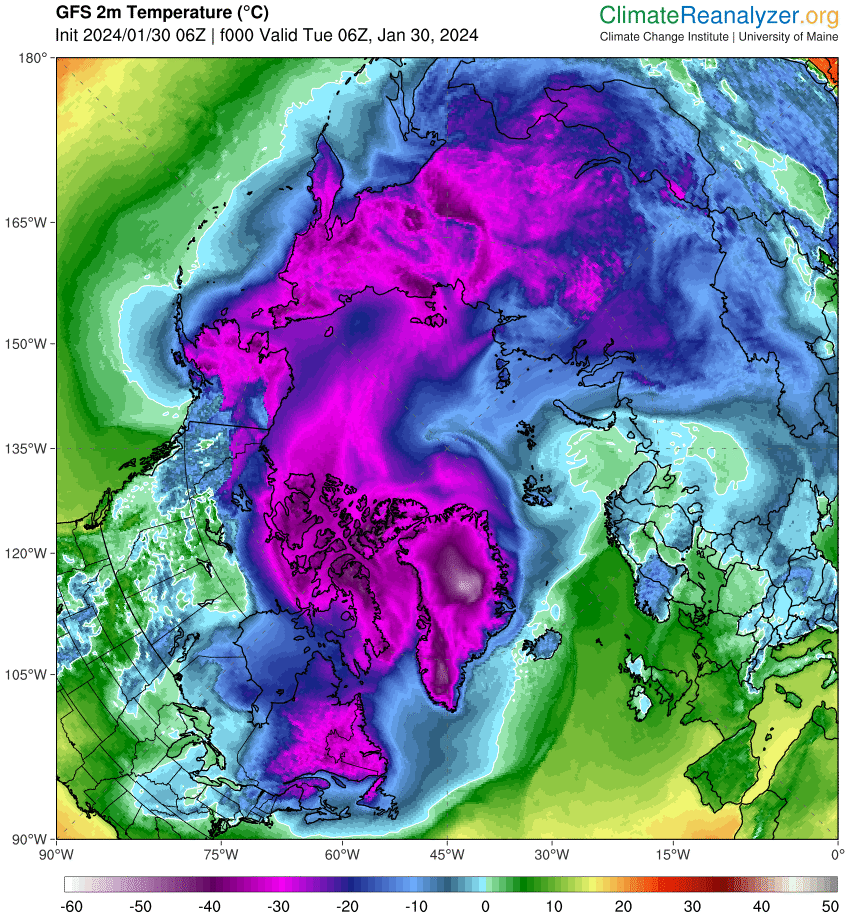
Associated with the storm is a pulse of abnormally warm air reaching to the North Pole and beyond:
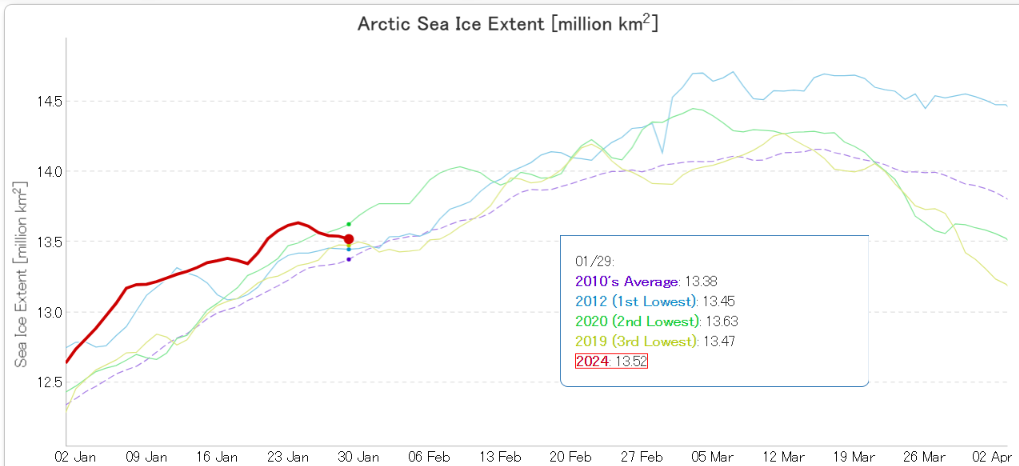
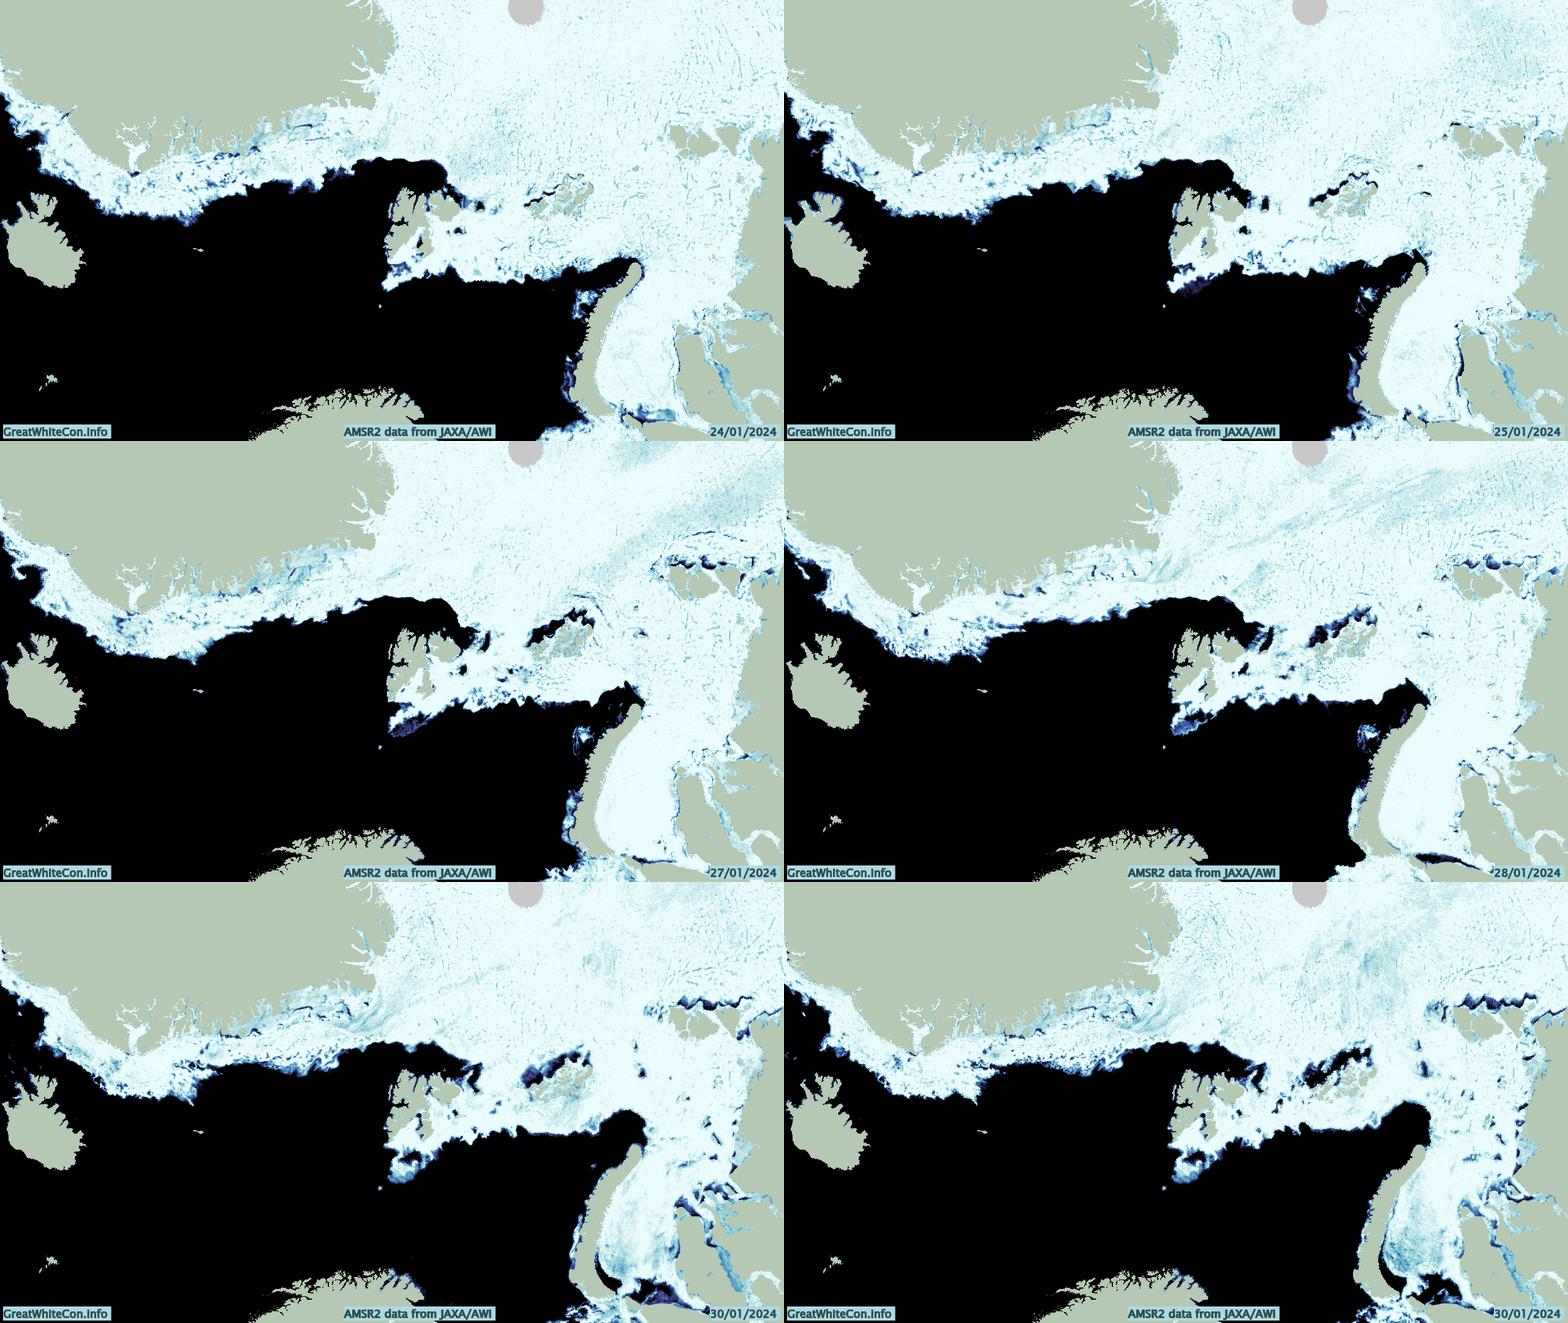
Here’s how JAXA extent looks as the big swell arrives:
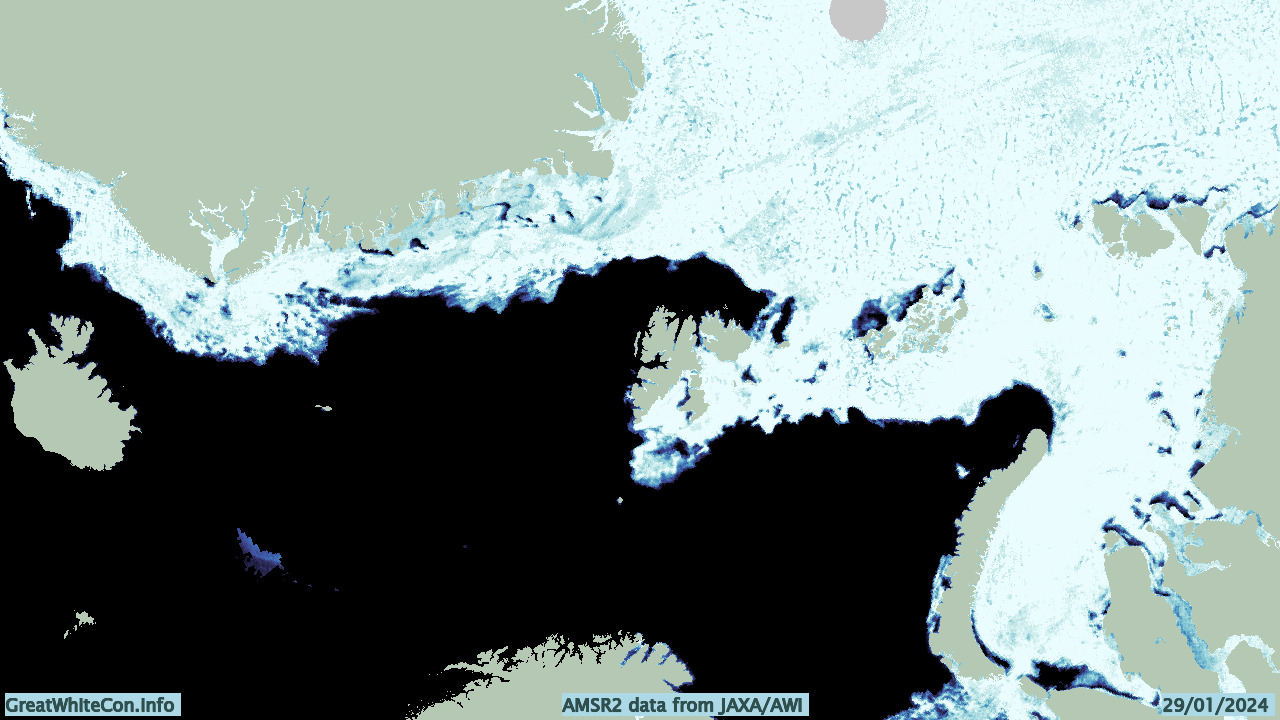
And here’s the lead enhanced AWI AMSR2 concentration map of the Atlantic periphery:
Let’s see how things change over the next few days.
[Update – January 31st]
Here’s a preliminary look at the effect of the recent Arctic cyclone and other “weather” on the sea ice in the Fram Strait and Barents & Kara Seas:
There is also another cyclone heading for the Barents Sea. This one is forecast to bottom out at 936 hPa at around midnight tonight near the Norwegian coast:
P.S. The cyclone mentioned just above has been named Storm Ingunn by the Norwegian Meteorological Institute:
👀 This swirl of cloud is #StormIngunn – an intense area of low pressure that's still rapidly deepening
😮 Wind gusts of over 120 mph have been reported in the Faroe Islands with the storm now moving towards Norway pic.twitter.com/TNuo52L7MW
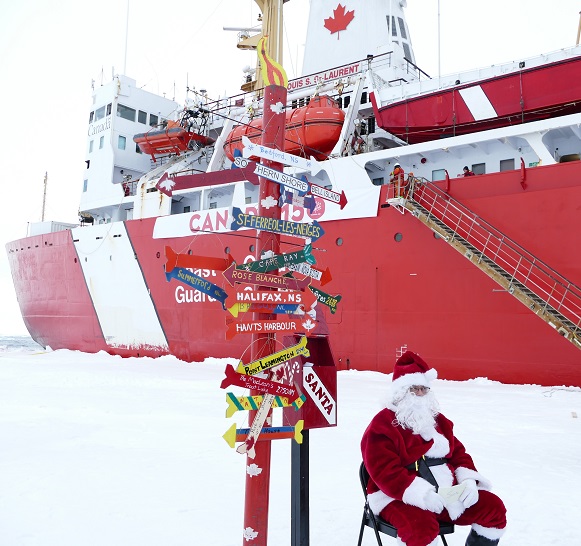
Christmas is rapidly approaching, and Santa and Snow White send festive greetings to one and all from the North Pole:
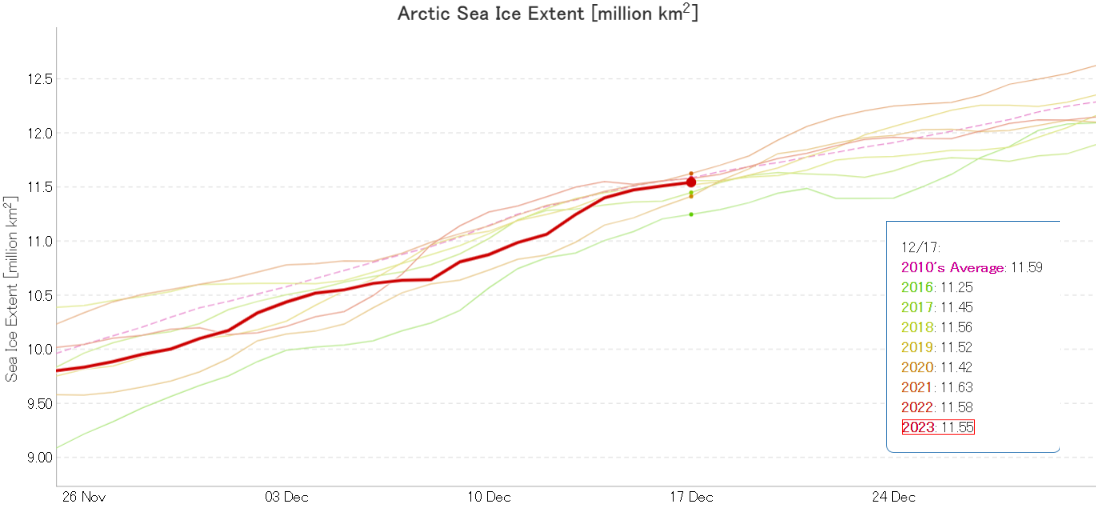
JAXA extent currently seems to be stuck on December 17th, but here’s how it looked a couple of days ago:
Having been comfortably in 3rd lowest position in the satellite era a few days ago, AMSR2 extent is now 5th lowest and very close to the 2010s average for the date.
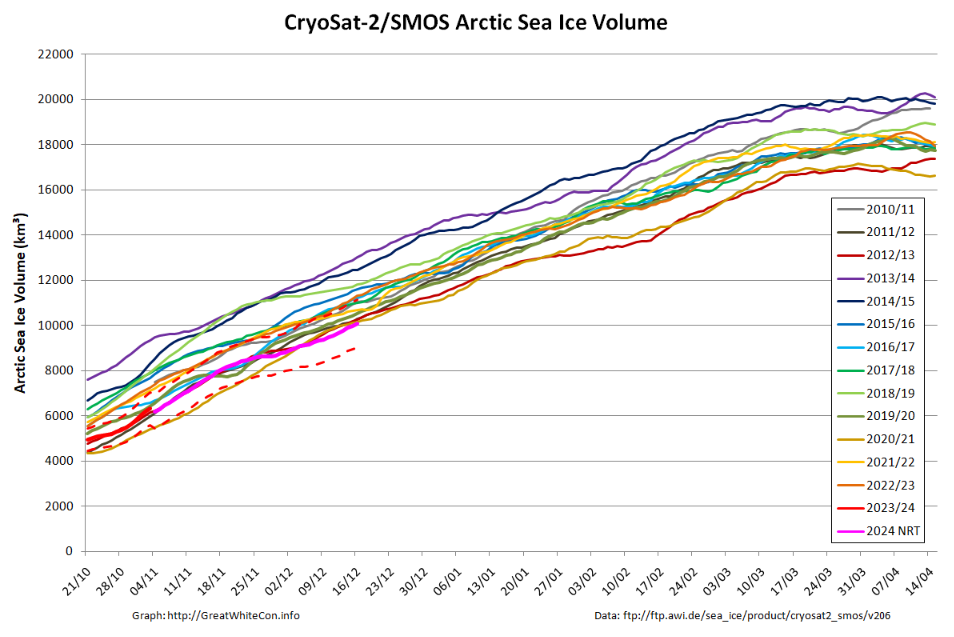
The Alfred Wegener Institute have been releasing reanalysed CryoSat-2/SMOS merged thickness data for a few days, and here is the resulting Arctic sea ice volume chart:
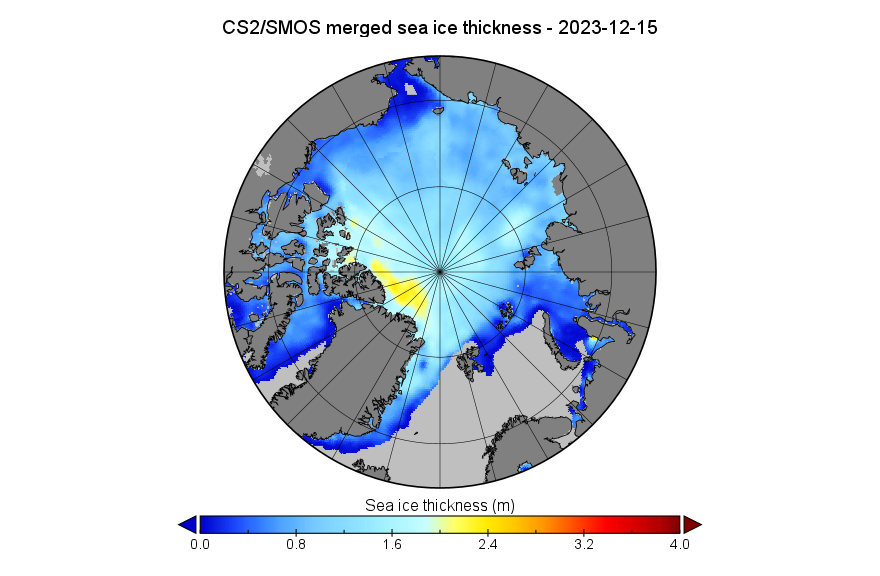
Near real time volume is currently lowest for the date in the CS2 record, but is likely to be revised upwards when the reanalysed data is eventually released. The associated NRT thickness map looks like this for December 15th:
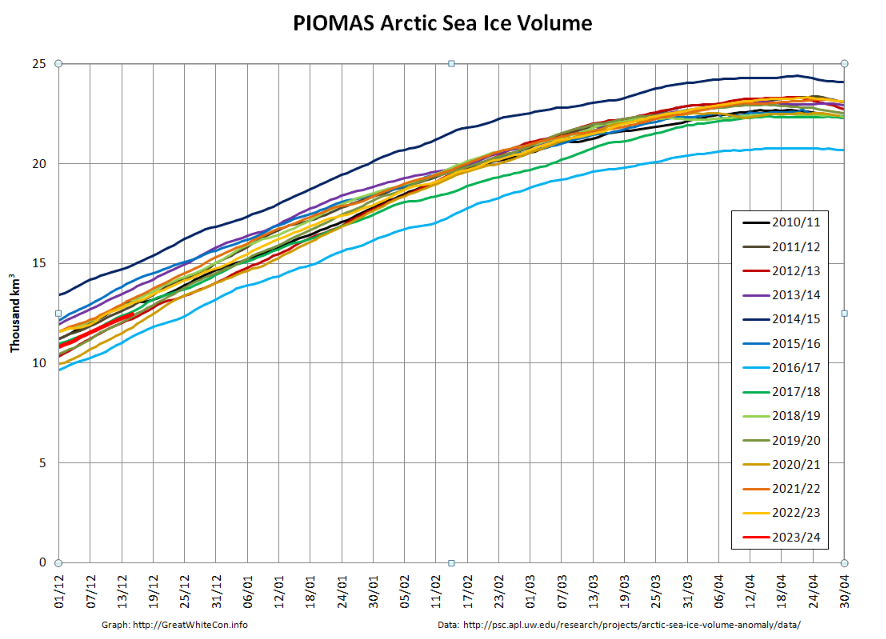
The mid-month PIOMAS modelled gridded thickness data has also been released. The calculated volume is 5th lowest in the satellite era:
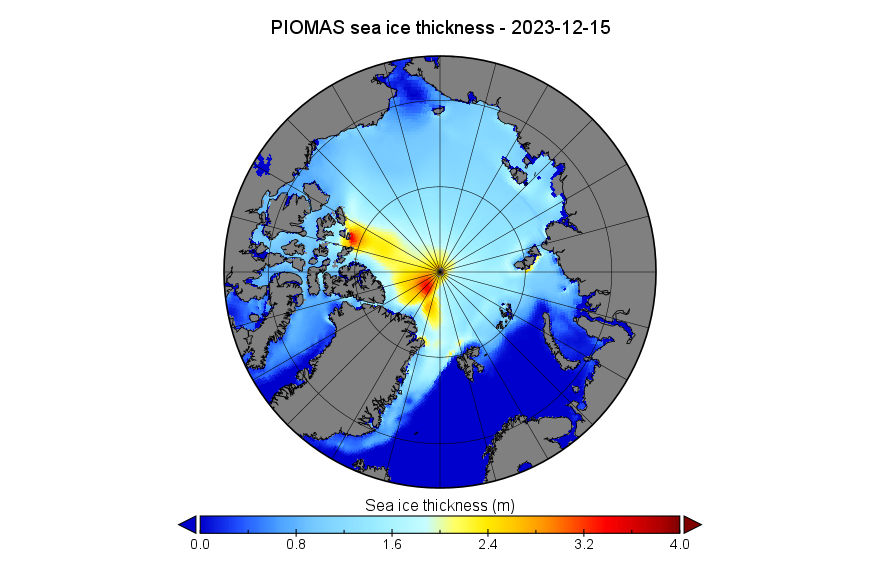
Here too is the PIOMAS thickness map for December 15th:
[Update – December 24th]
Merry Xmas everyone, especially Matt! Here’s a couple of images from the National Snow and Ice Data Center’s latest edition of Arctic Sea Ice News. In the short term sea ice is always melting somewhere:
From November 21 to 28, a series of three extratropical cyclones followed a common track from the northeast coast of Greenland eastward along the northern edge of the Barents, Kara, and Laptev Seas. As each storm moved into the Arctic Ocean, it merged with its predecessors, creating a persistent cyclonic (counter clockwise) wind regime. The first and third of these storms originated in the Icelandic Low region before migrating up the east side of Greenland. The second storm originated just north of Greenland. Simultaneously, a center of high pressure developed over the ice-free part of the Barents Sea, becoming especially strong on November 26 to 28.
This combination of persistent low pressure to the north and west of Svalbard and a high-pressure center to the southeast created a strong, persistent flow from the south of relatively warm and moist air from the North Atlantic Ocean toward Svalbard, which then turned eastward along the marginal ice zone. This is seen as an extension of an atmospheric river into the Arctic. Atmospheric rivers are long narrow corridors that carry a large amount of water vapor. A recent study suggests that atmospheric rivers lead to ice loss by transporting warm, moist air into the Arctic that can limit sea ice growth. This is consistent with the observed pause in seasonal ice growth in late November.
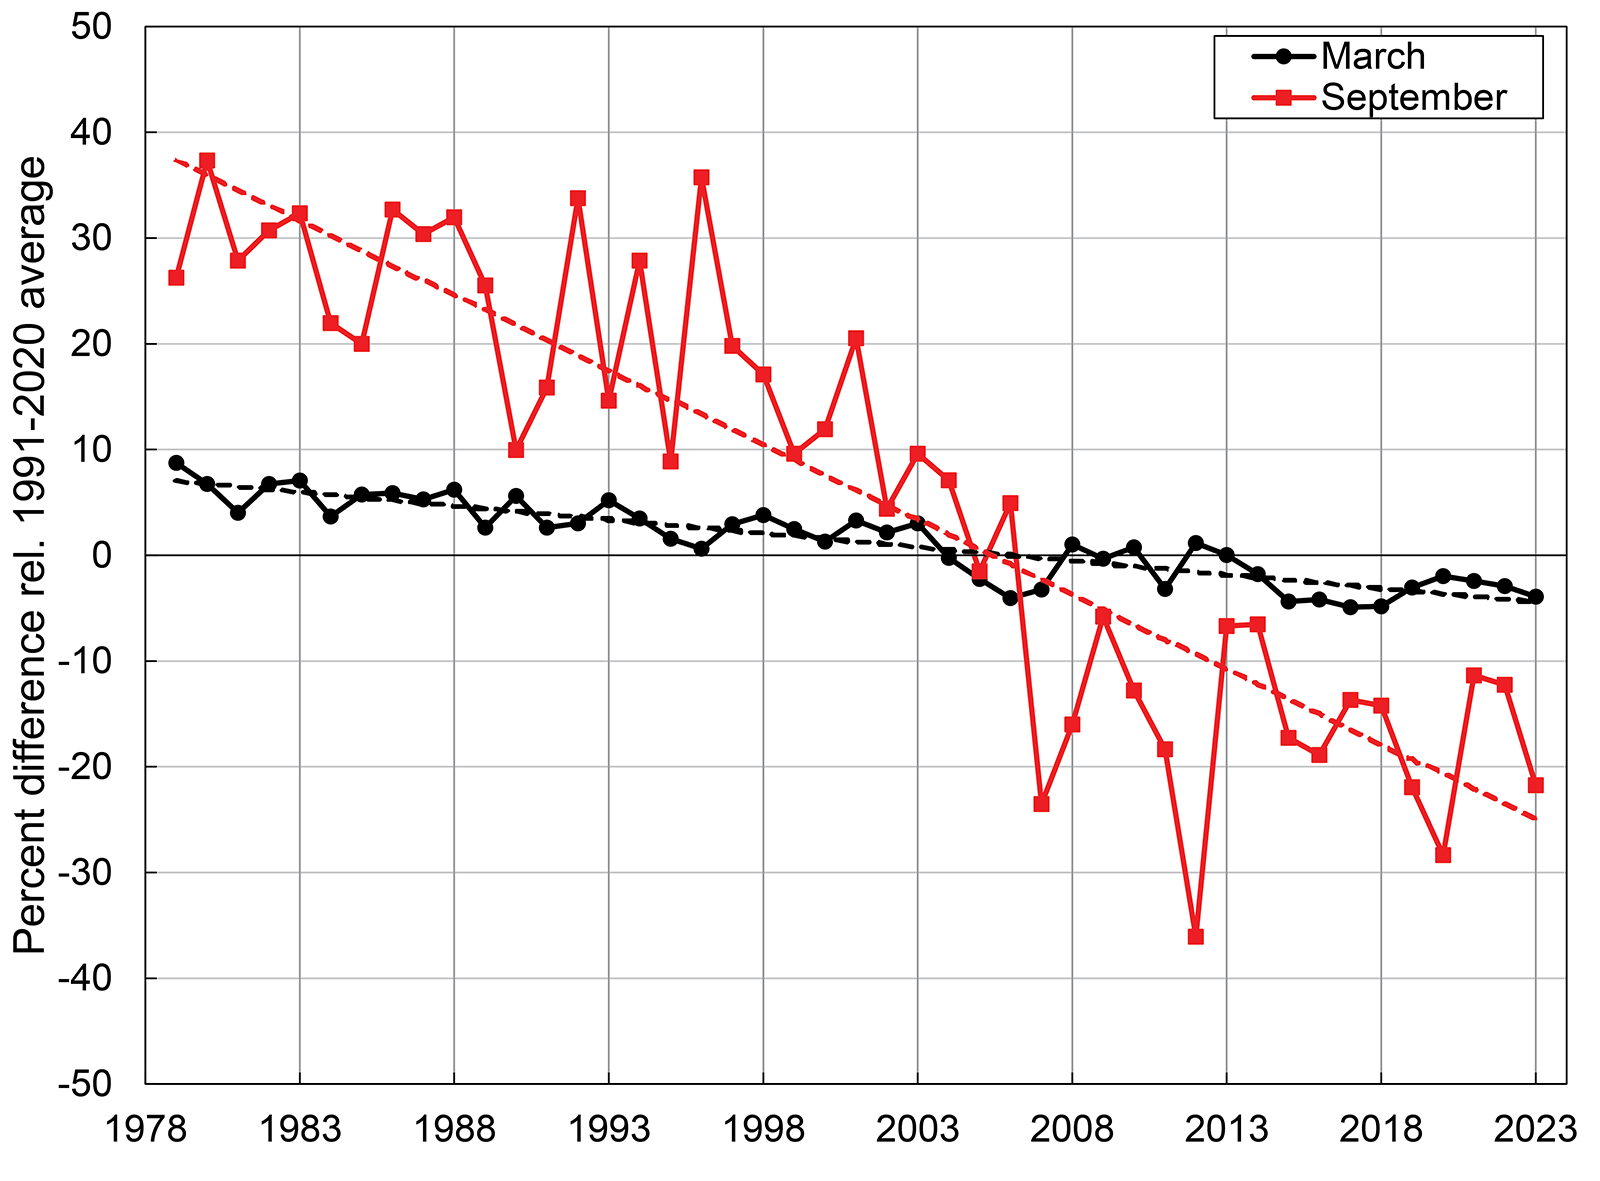
And over the longer term:
[Update – December 26th]
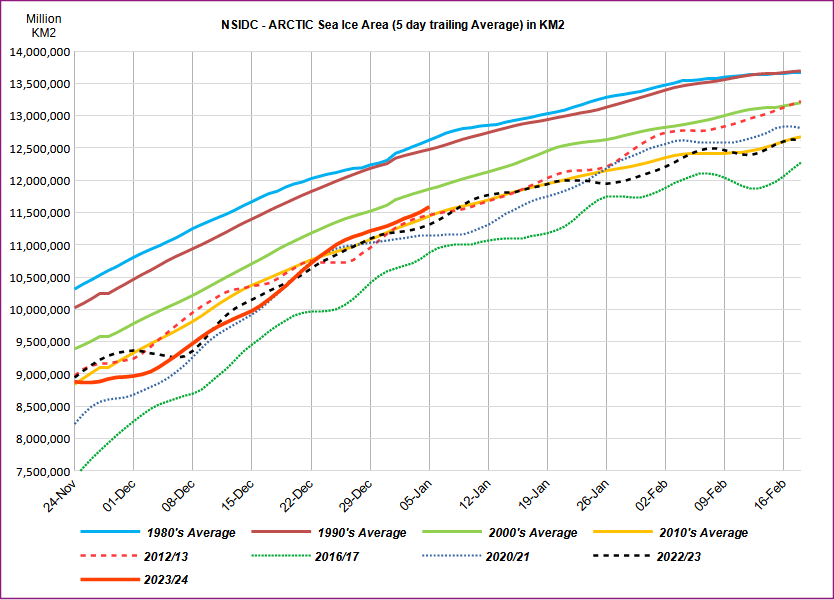
From being near the bottom of the recent pack at the end of November, Arctic sea ice extent is now edging towards the top of the 2010s range. Here’s the AWI high resolution AMSR2 metric:
However sea ice volume has not followed suit, and remains near the bottom of the range:
Here’s an animation of sea ice motion over the last month, revealing amongst other things the recent rapid refreeze of the Chukchi Sea (click to animate):
[Update – December 29th]
Matt is getting very excited about the allegedly “high Arctic sea ice extent” over on XTwitter. So is Tony Heller, although he has also helpfully provided convincing empirical evidence that the IPCC’s global warming “predictions” are correct!
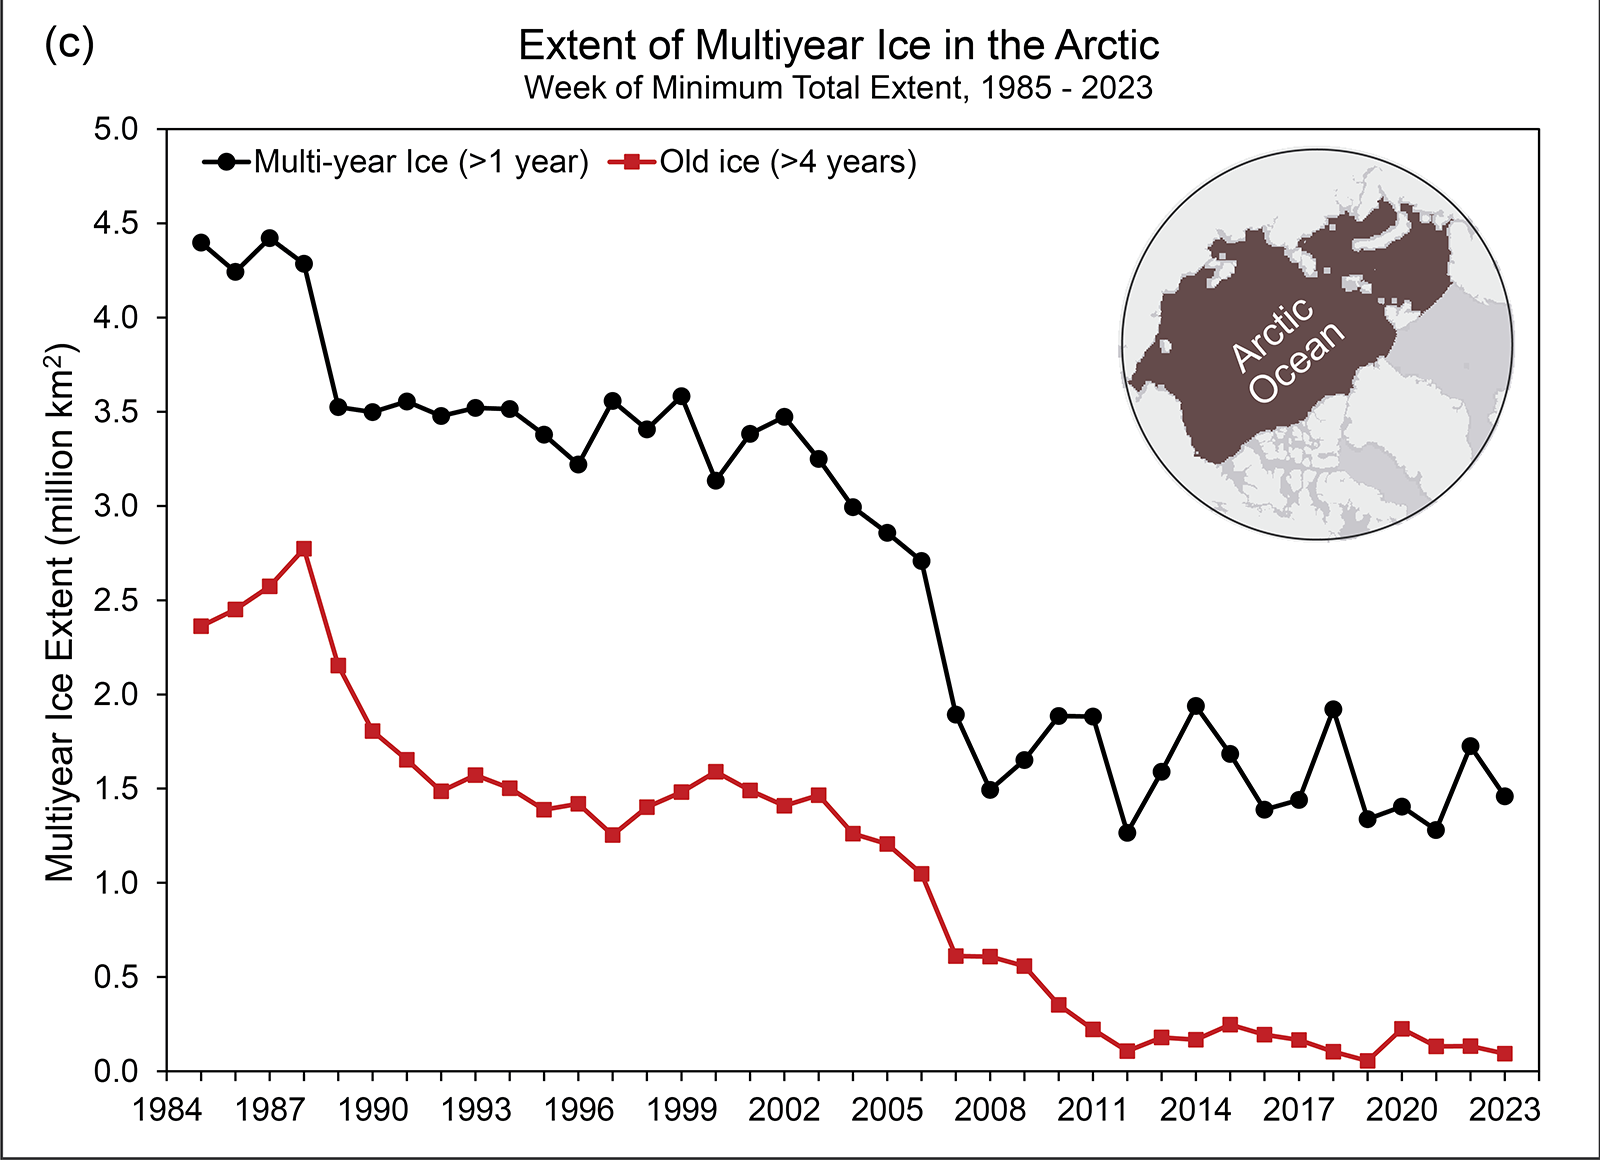
However neither of them seem to be at all interested in the age of Arctic sea ice. Here’s the early December update:
Drifting off topic only slightly, whilst perusing social media I also found this animation from Kev Pluck highly amusing:
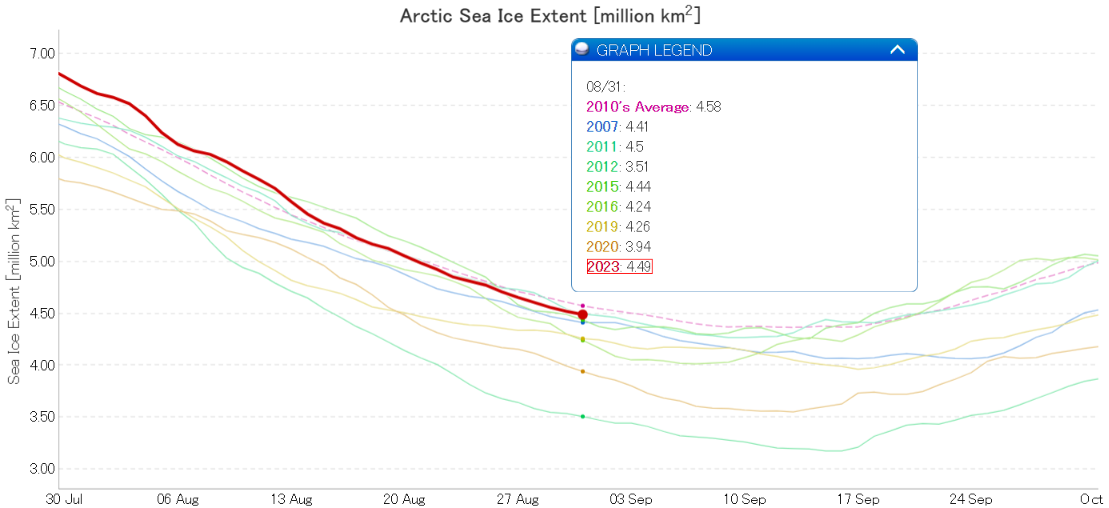
There’s lots of coverage specifically about assorted Arctic sea ice extent metrics over on the “2023 Minimum Extent” thread. However we’ll start the September open thread ball rolling with a couple of cross posted images.
At the end of August JAXA daily extent was 7th lowest for the date, at 4.49 million km² :
The median prediction of the contributors to the August call by the Sea Ice Prediction Network for the September monthly average extent is 4.6 million km² :
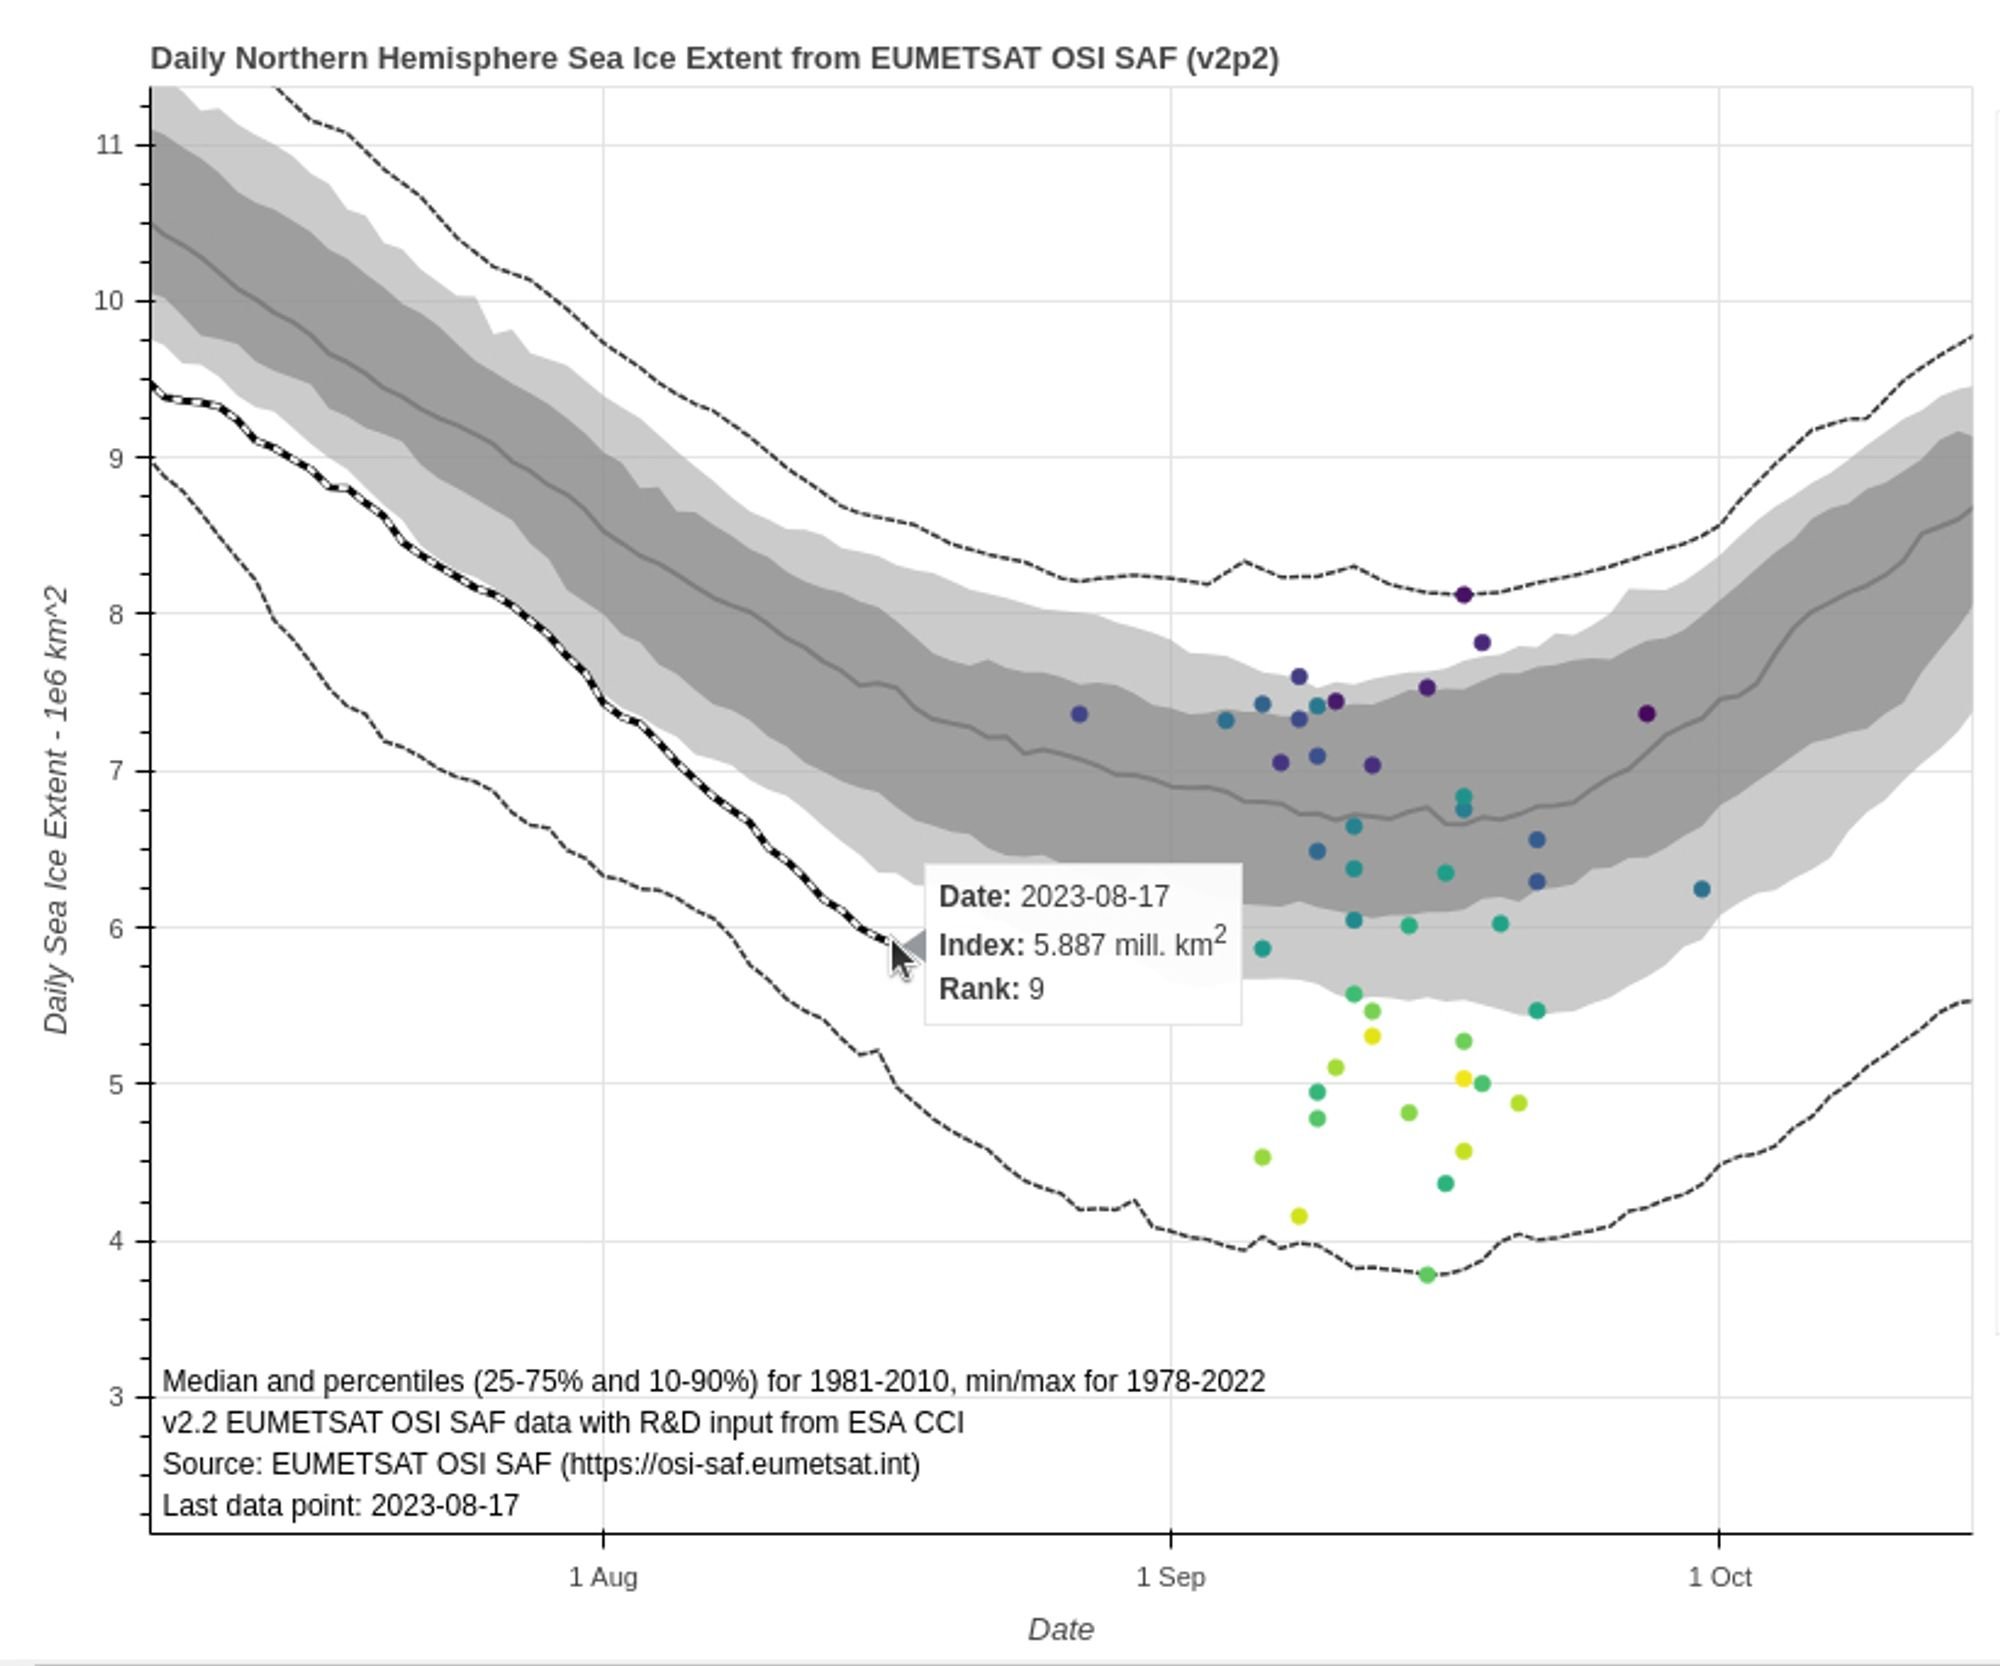
It’s that time of year again! Tony Heller has been asserting that “summer is over at the North Pole” for several weeks now, and the 2023 Arctic sea ice minimum extent will occur at some point over the next four or five weeks. The exact date and level will almost certainly vary from one extent metric to the next.
To get the minimum extent ball rolling, here’s Signe Aaboe’s graph of previous summer minima based on OSI SAF data:
Here too is Zack Labe’s equivalent, based on JAXA data:
This website uses cookies to improve your experience. We'll assume you're ok with this, but you can opt-out if you wish. Cookie settingsACCEPT
Privacy & Cookies Policy
Privacy Overview
This website uses cookies to improve your experience while you navigate through the website. Out of these, the cookies that are categorized as necessary are stored on your browser as they are essential for the working of basic functionalities of the website. We also use third-party cookies that help us analyze and understand how you use this website. These cookies will be stored in your browser only with your consent. You also have the option to opt-out of these cookies. But opting out of some of these cookies may affect your browsing experience.
Necessary cookies are absolutely essential for the website to function properly. This category only includes cookies that ensures basic functionalities and security features of the website. These cookies do not store any personal information.
Any cookies that may not be particularly necessary for the website to function and is used specifically to collect user personal data via analytics, ads, other embedded contents are termed as non-necessary cookies. It is mandatory to procure user consent prior to running these cookies on your website.