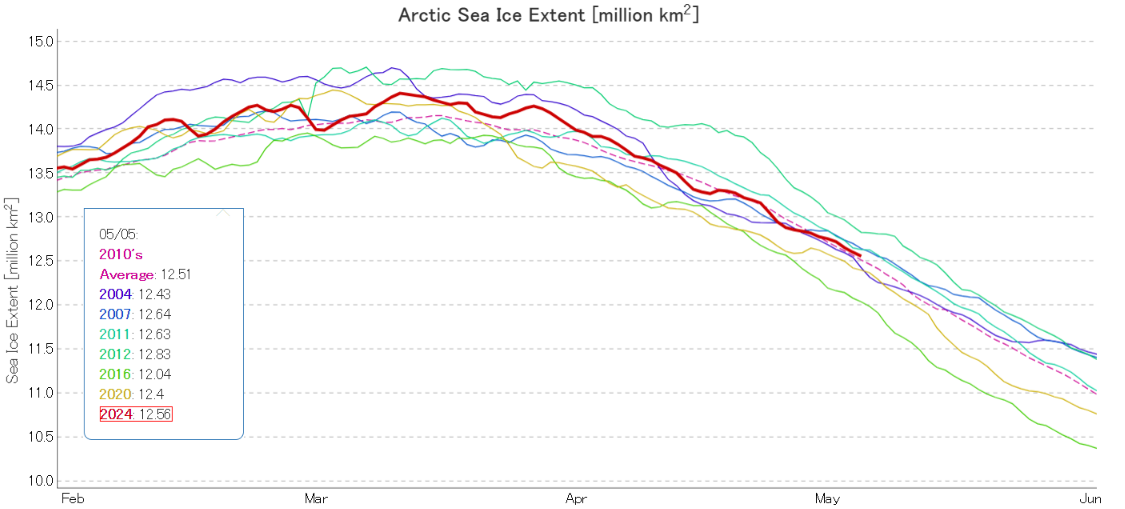
Since a certain “sceptic” has recently been comparing 2024 sea ice extent to “20 years ago”, here’s the current JAXA/ViSHOP extent graph of selected years, including 2004:
The CryoSat-2/SMOS merged Arctic sea ice volume graph finishes on April 15th, but older data is being reanalysed and here is the latest version:
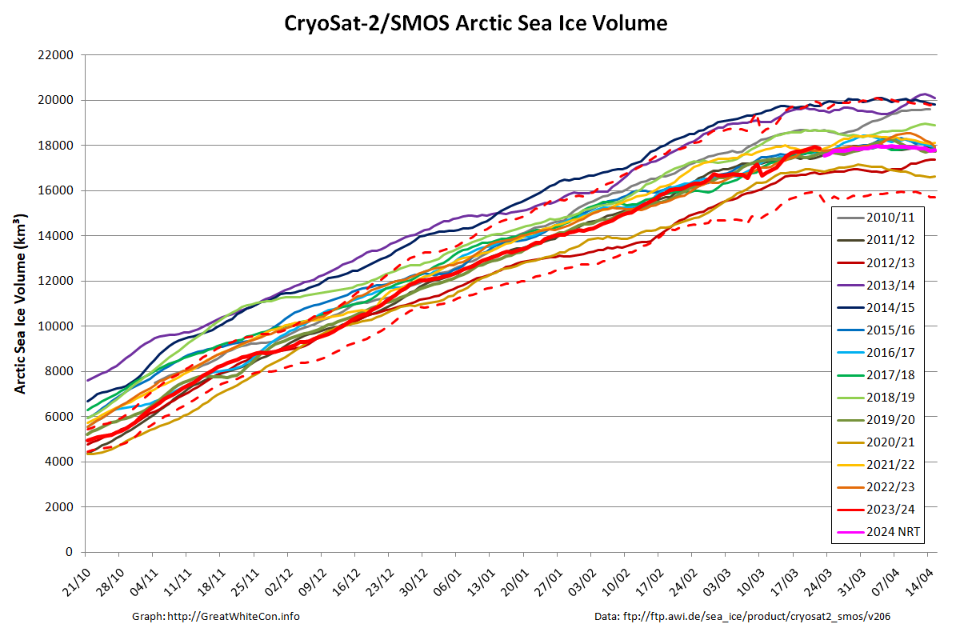
The gap in the near real time data due to the problem with the SMOS satellite during the first half of March has been filled in, but the result doesn’t look very convincing to say the least!
The PIOMAS gridded thickness data for April 2024 is now available. Here’s the end of month volume graph:
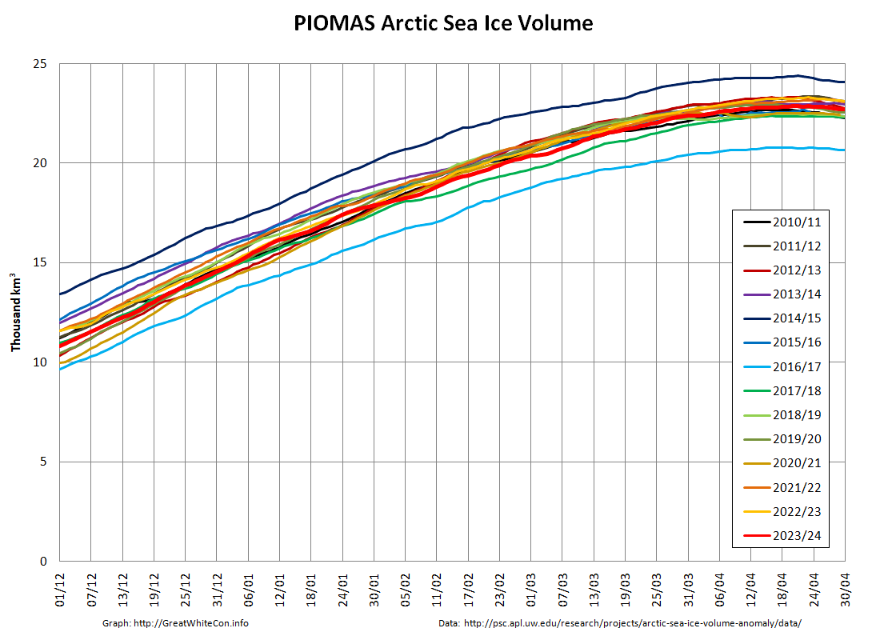
Maximum volume for 2024 was 22.88 thousand km³ on April 19th, which was 7th lowest in the 46 year satellite record.
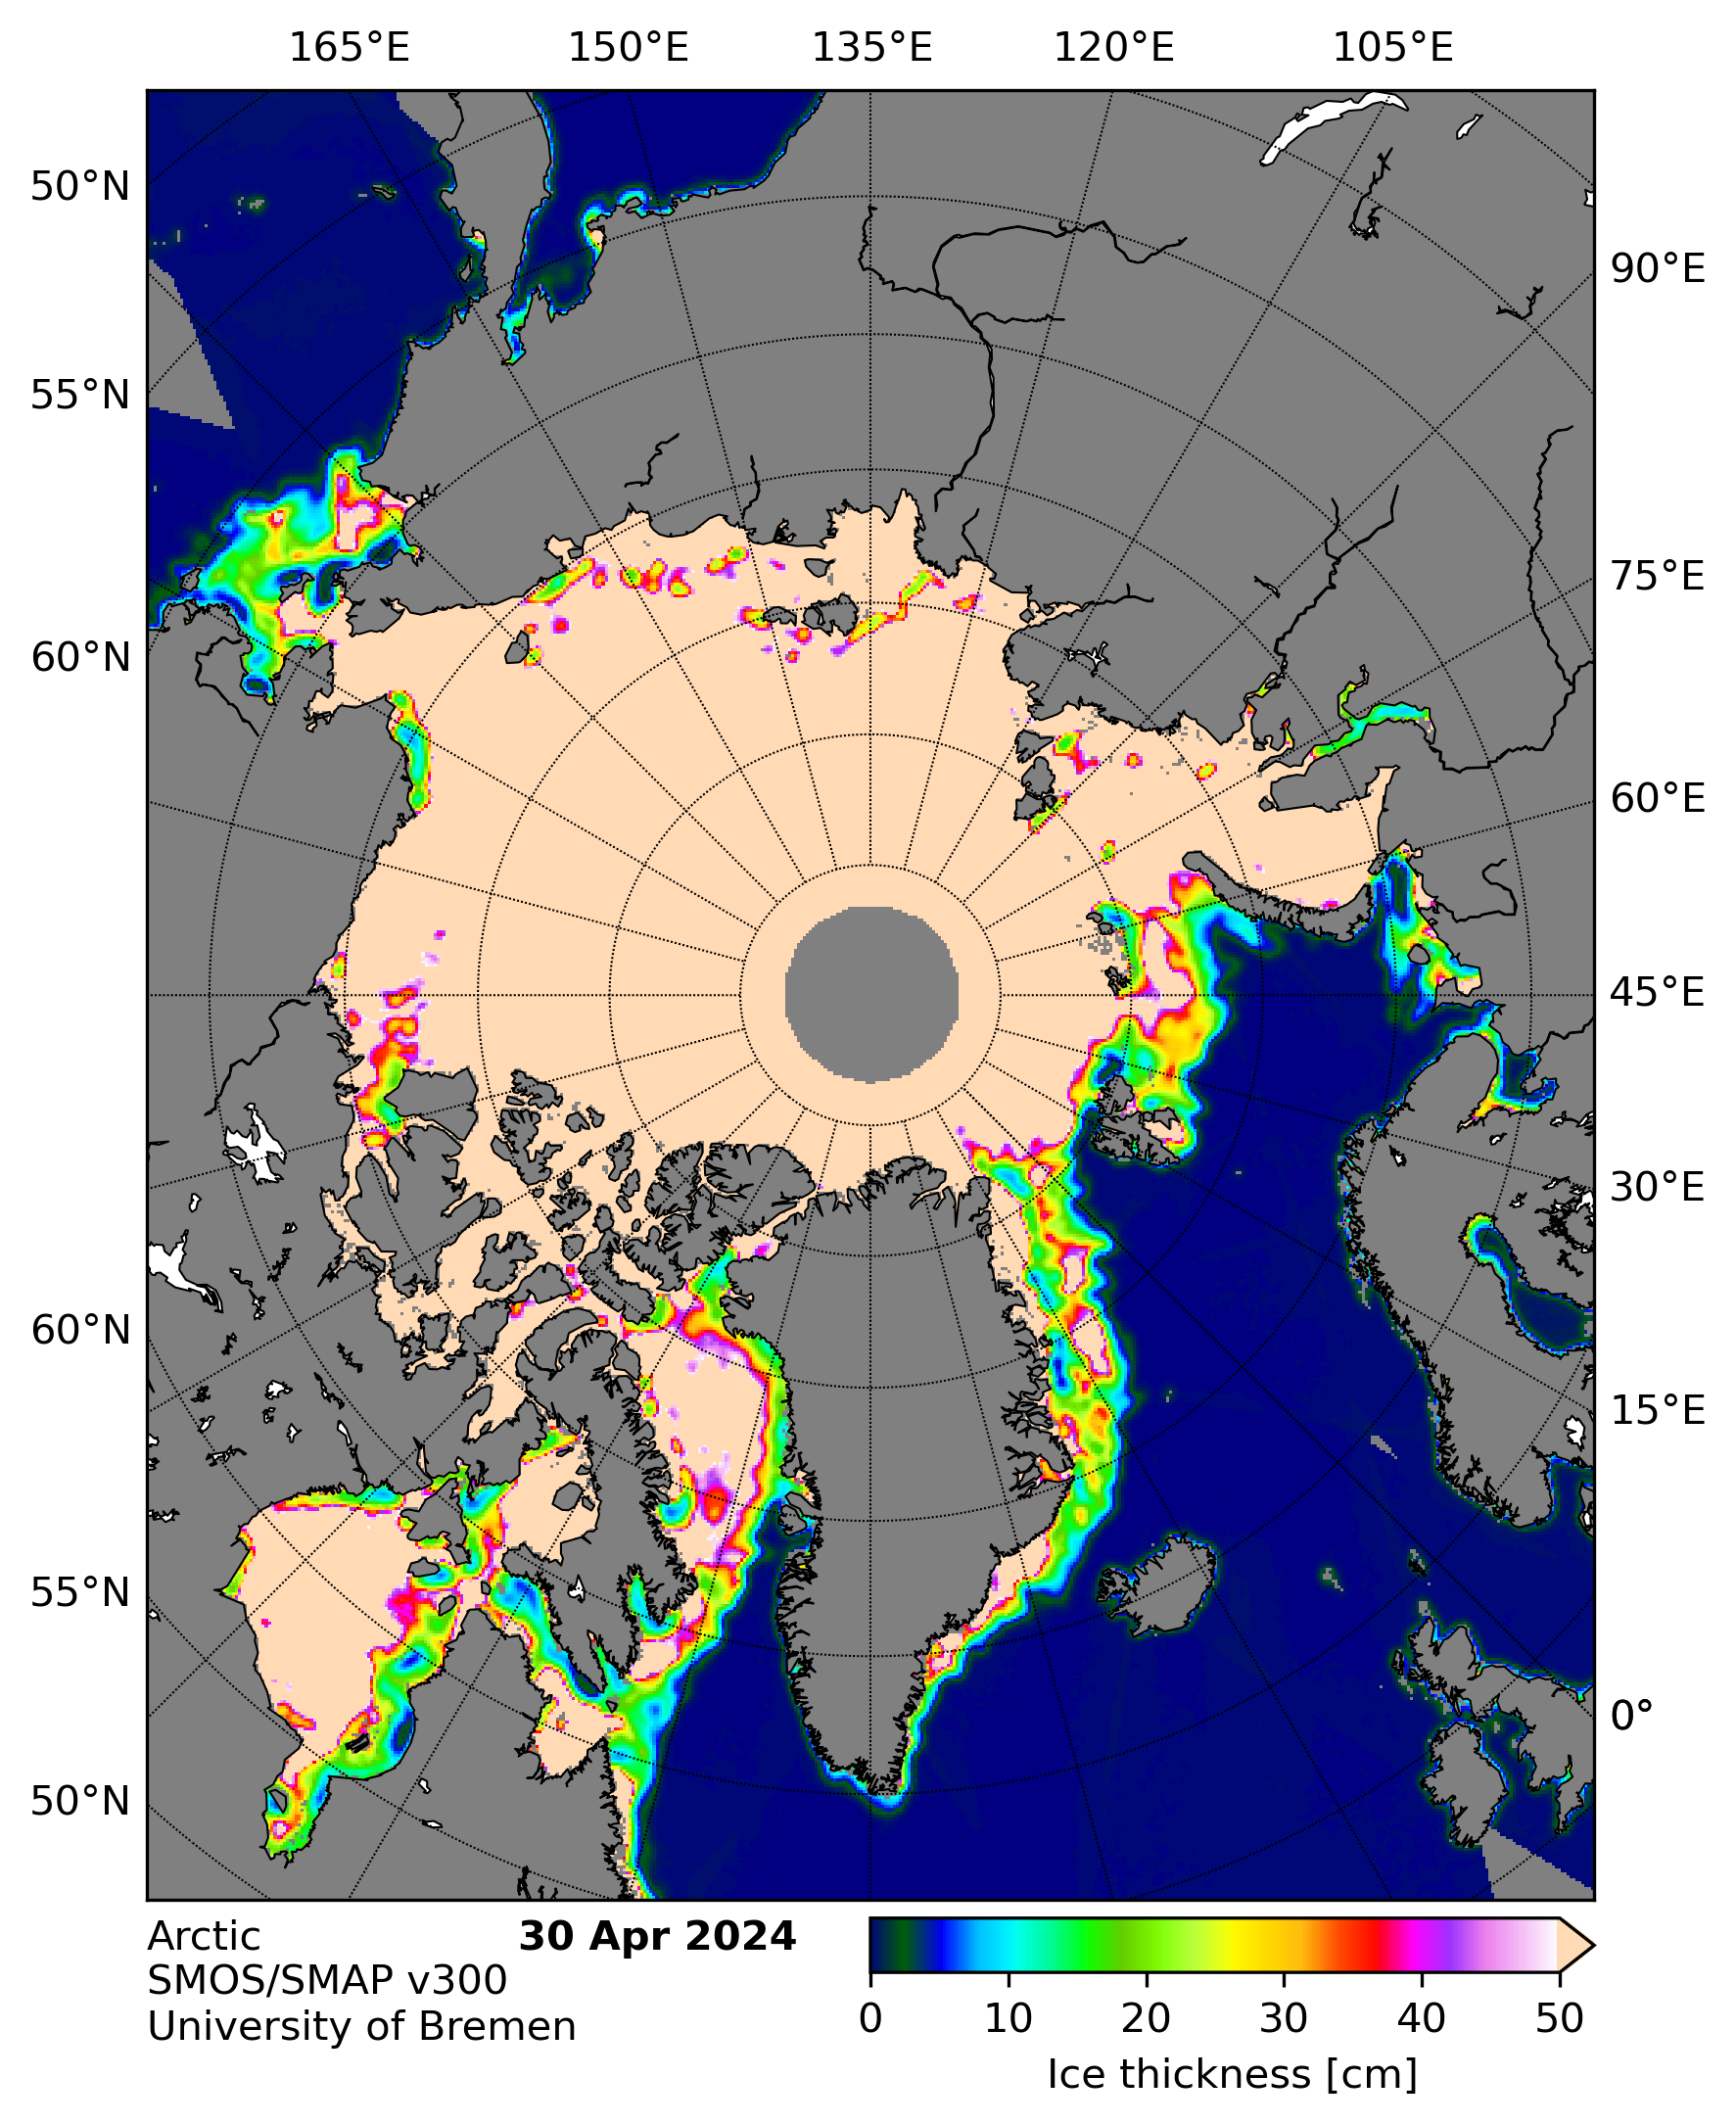
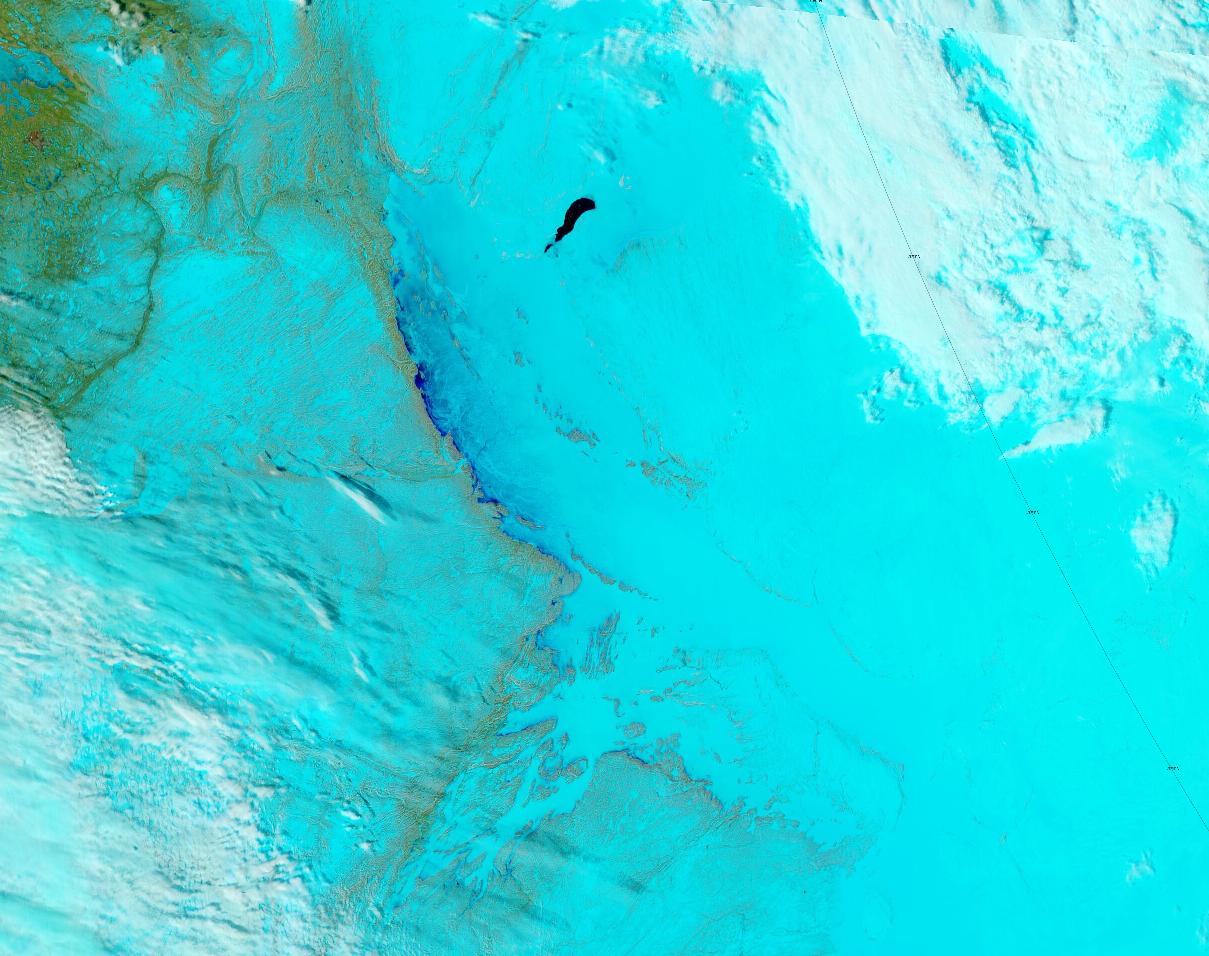
Here too is the end of month thickness map:
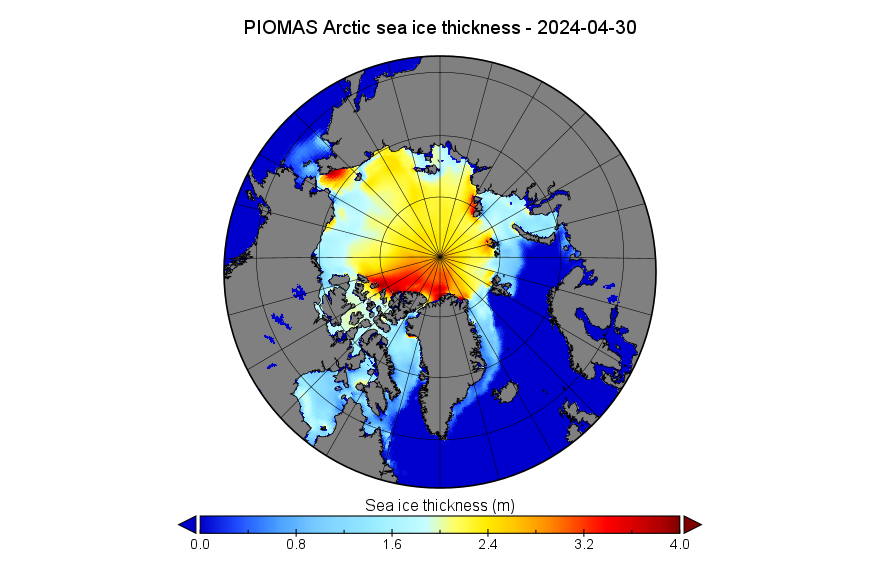
It shows the ice thickening in the Chukchi Sea, with the Beaufort Sea continuing to look vulnerable to early melt. The last SMOS/SMAP thin ice thickness map of the spring reveals thin ice in the Amundsen Gulf and eastern Beaufort Sea, as well as on the Chukchi coast of Alaska:
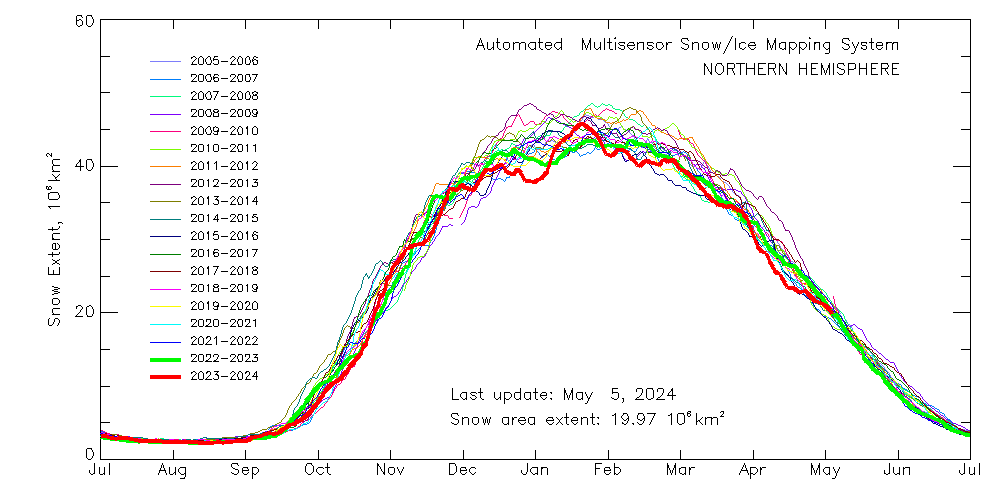
The April Rutgers Global Snow Lab northern hemisphere snow cover chart has not yet been released, so here’s the Northern Hemisphere Multisensor Snow Extent graph instead:
The National Snow and Ice Data Center has published the April edition of their Arctic Sea Ice News:
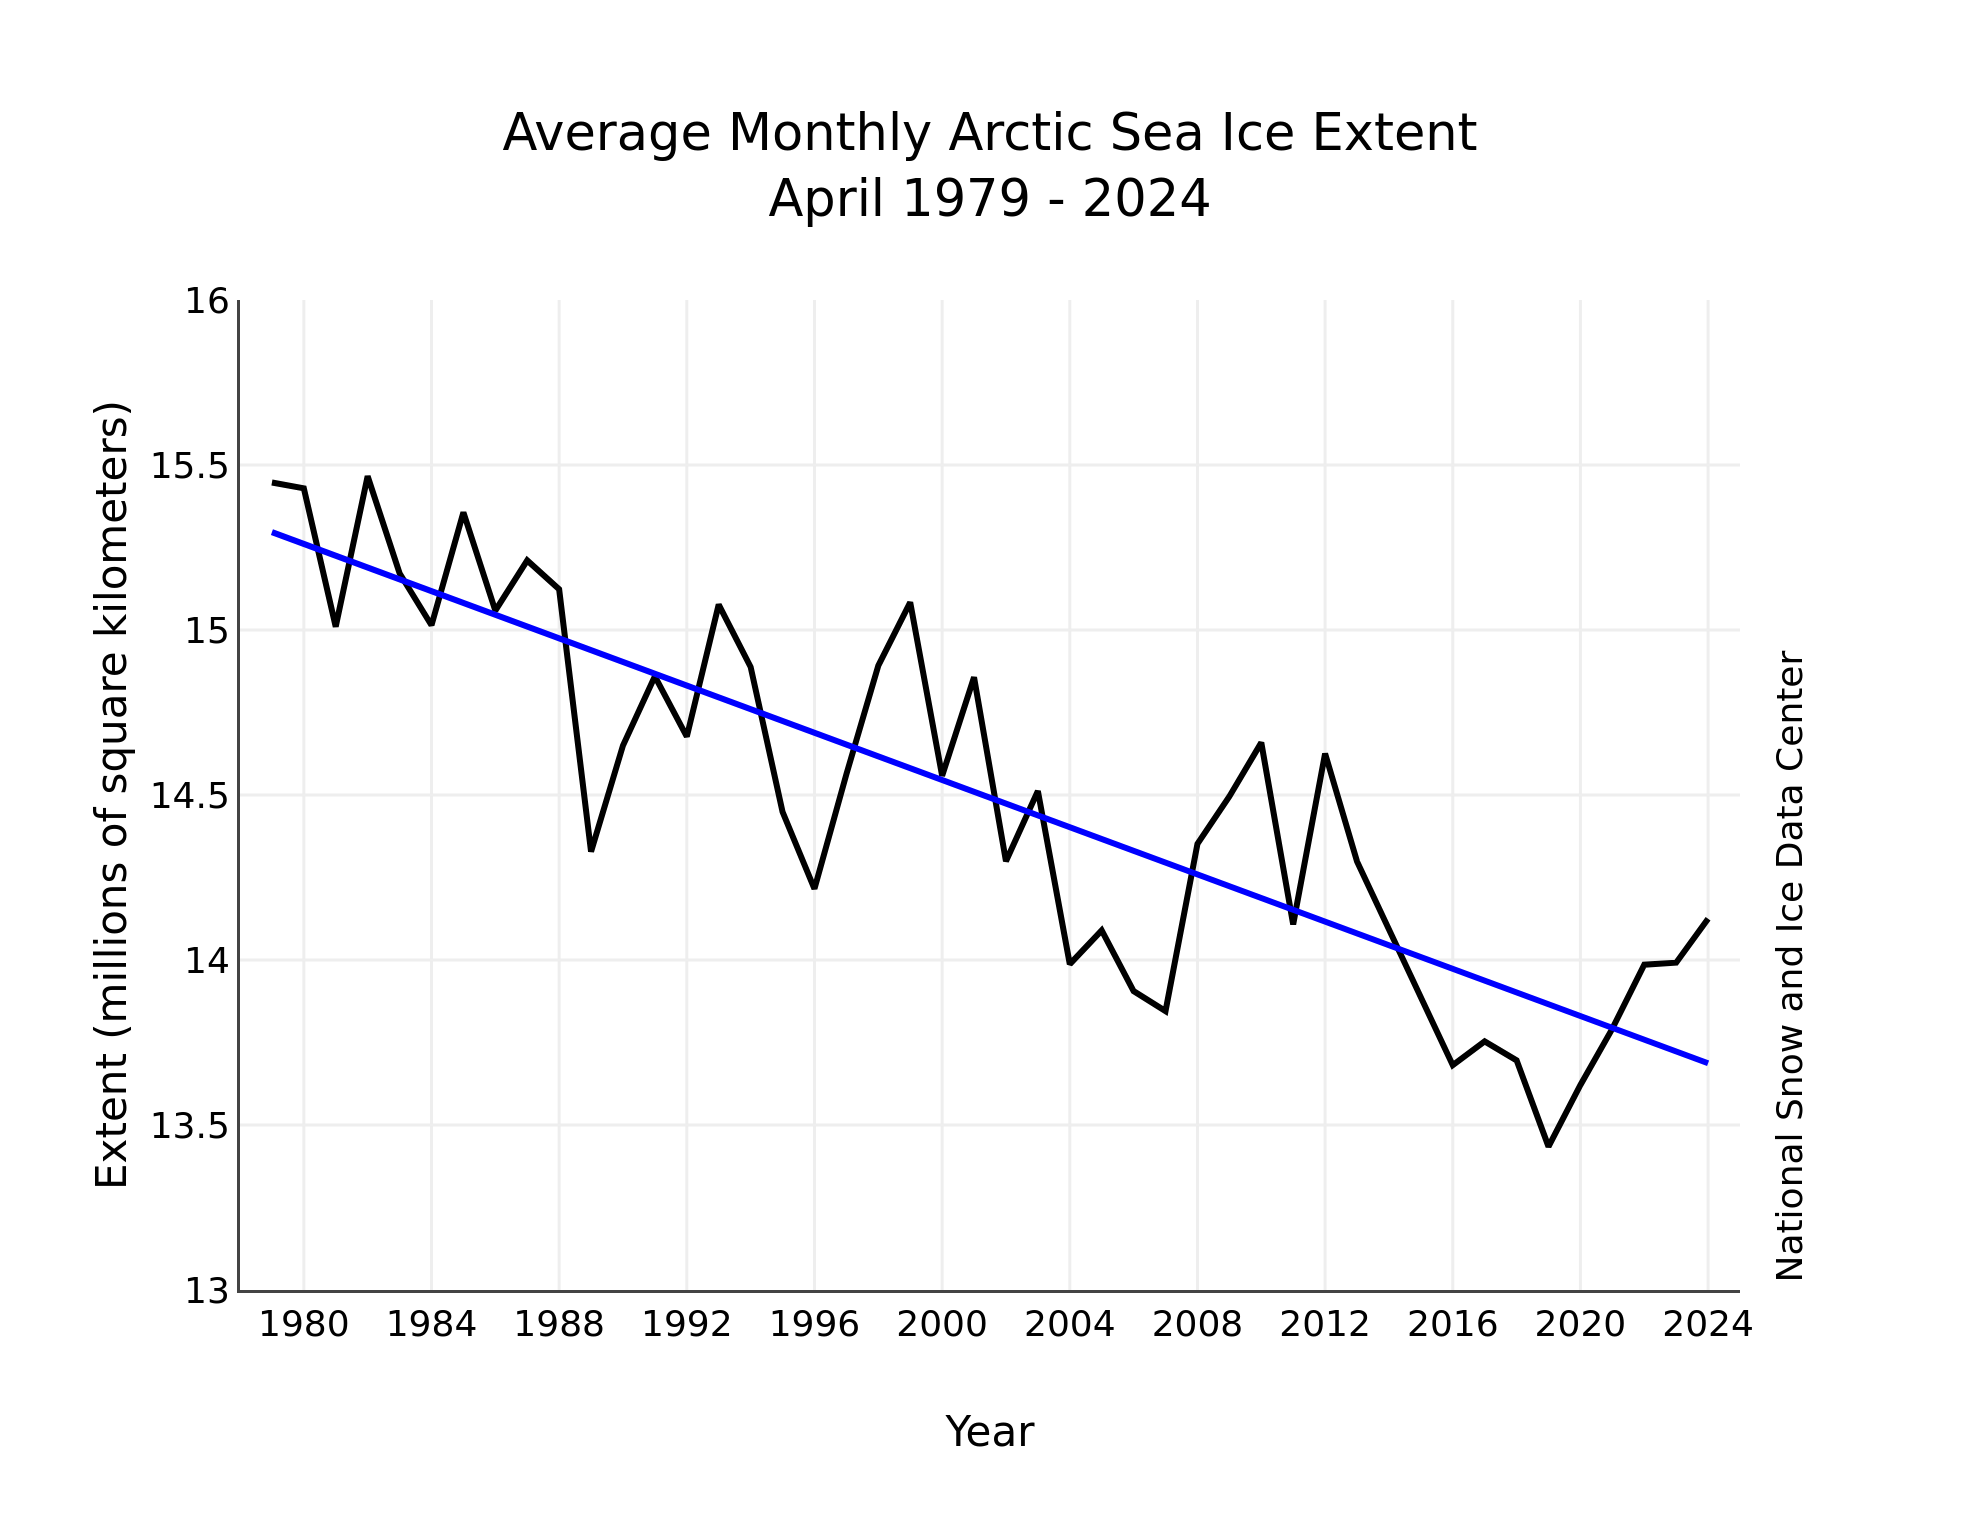
The average Arctic sea ice extent for April 2024 was 14.12 million square kilometers, placing it sixteenth lowest in the passive microwave satellite record. As of the beginning of May, extent is well below average in the Sea of Okhotsk, and slightly below average in the Bering and Barents Seas and off the coast of Labrador. Ice is near the average position along the eastern coast of Greenland.
The global average temperature in April was at a record high in many assessments. By contrast in the Arctic, April 2024 temperatures at the 925 hPa level (about 2,500 feet above the surface) were below average by 3 to 5 degrees Celsius along the Siberian coast and northwestern coast of Scandinavia. Markedly warm conditions were the rule over most of Canada and northern Greenland. The regions near Hudson Bay and along Peary Land on the north coast of Greenland were 3 to 5 degrees Celsius above the 1991 to 2020 climate reference period.
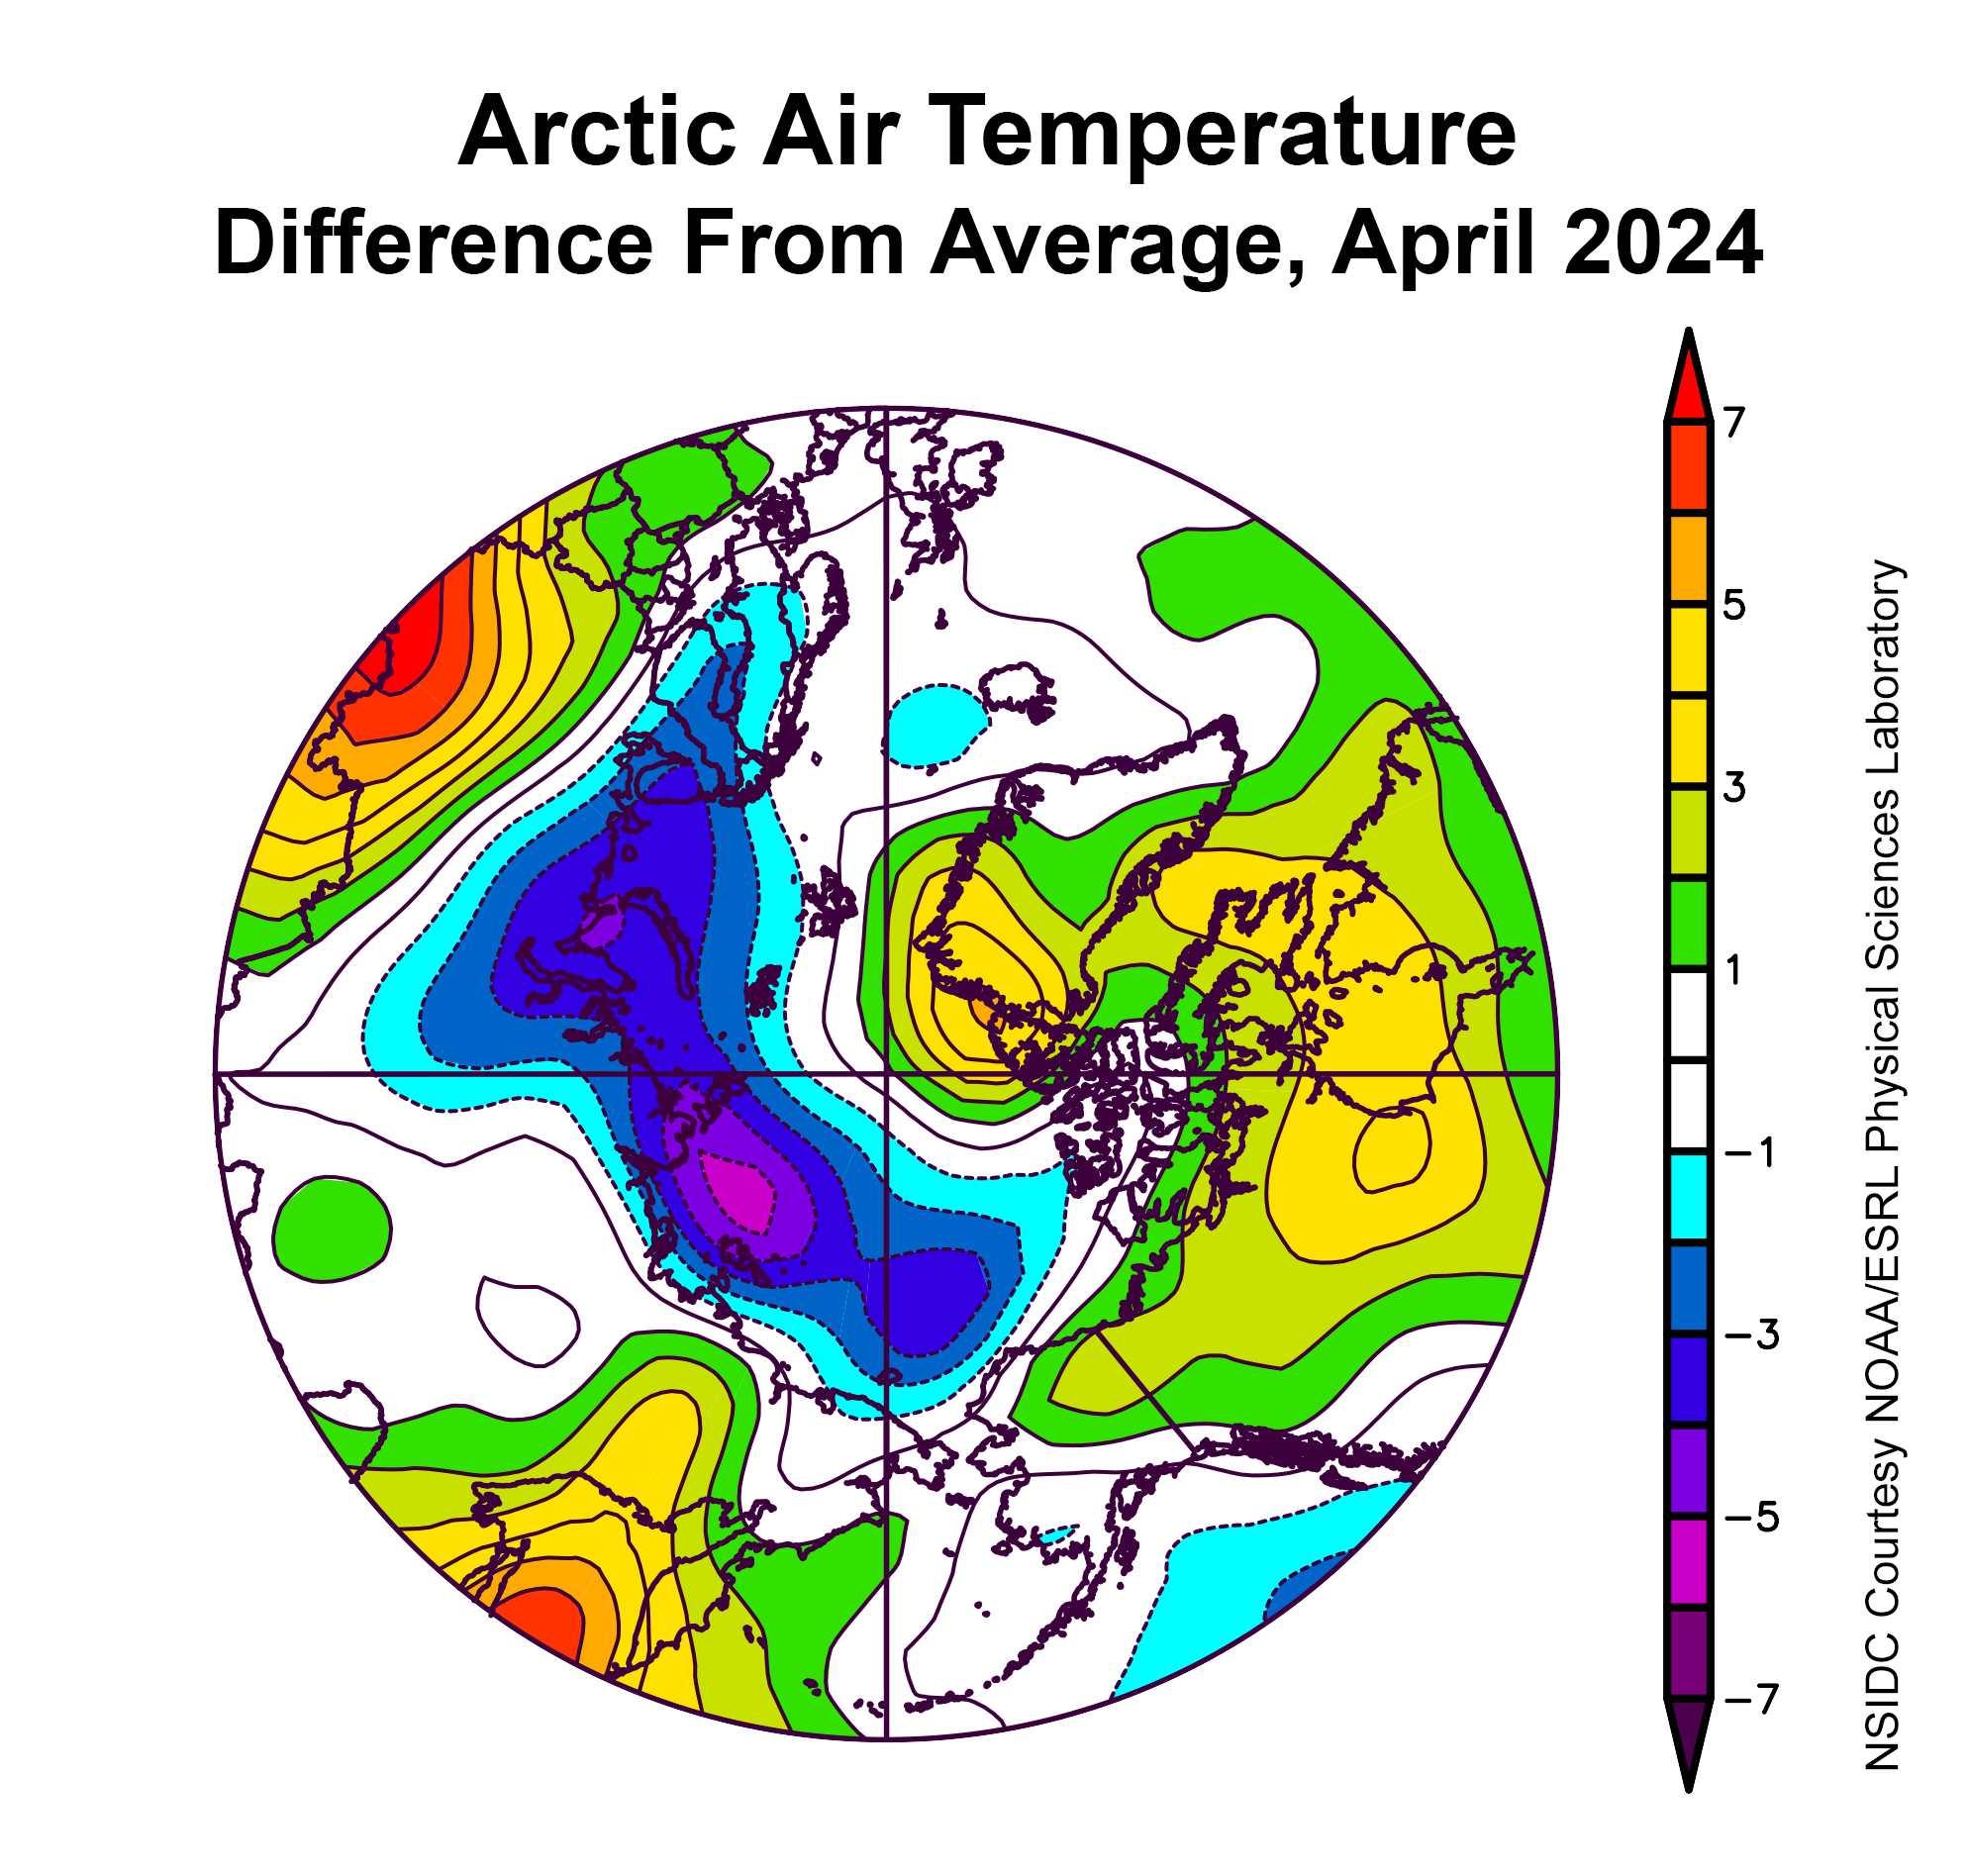
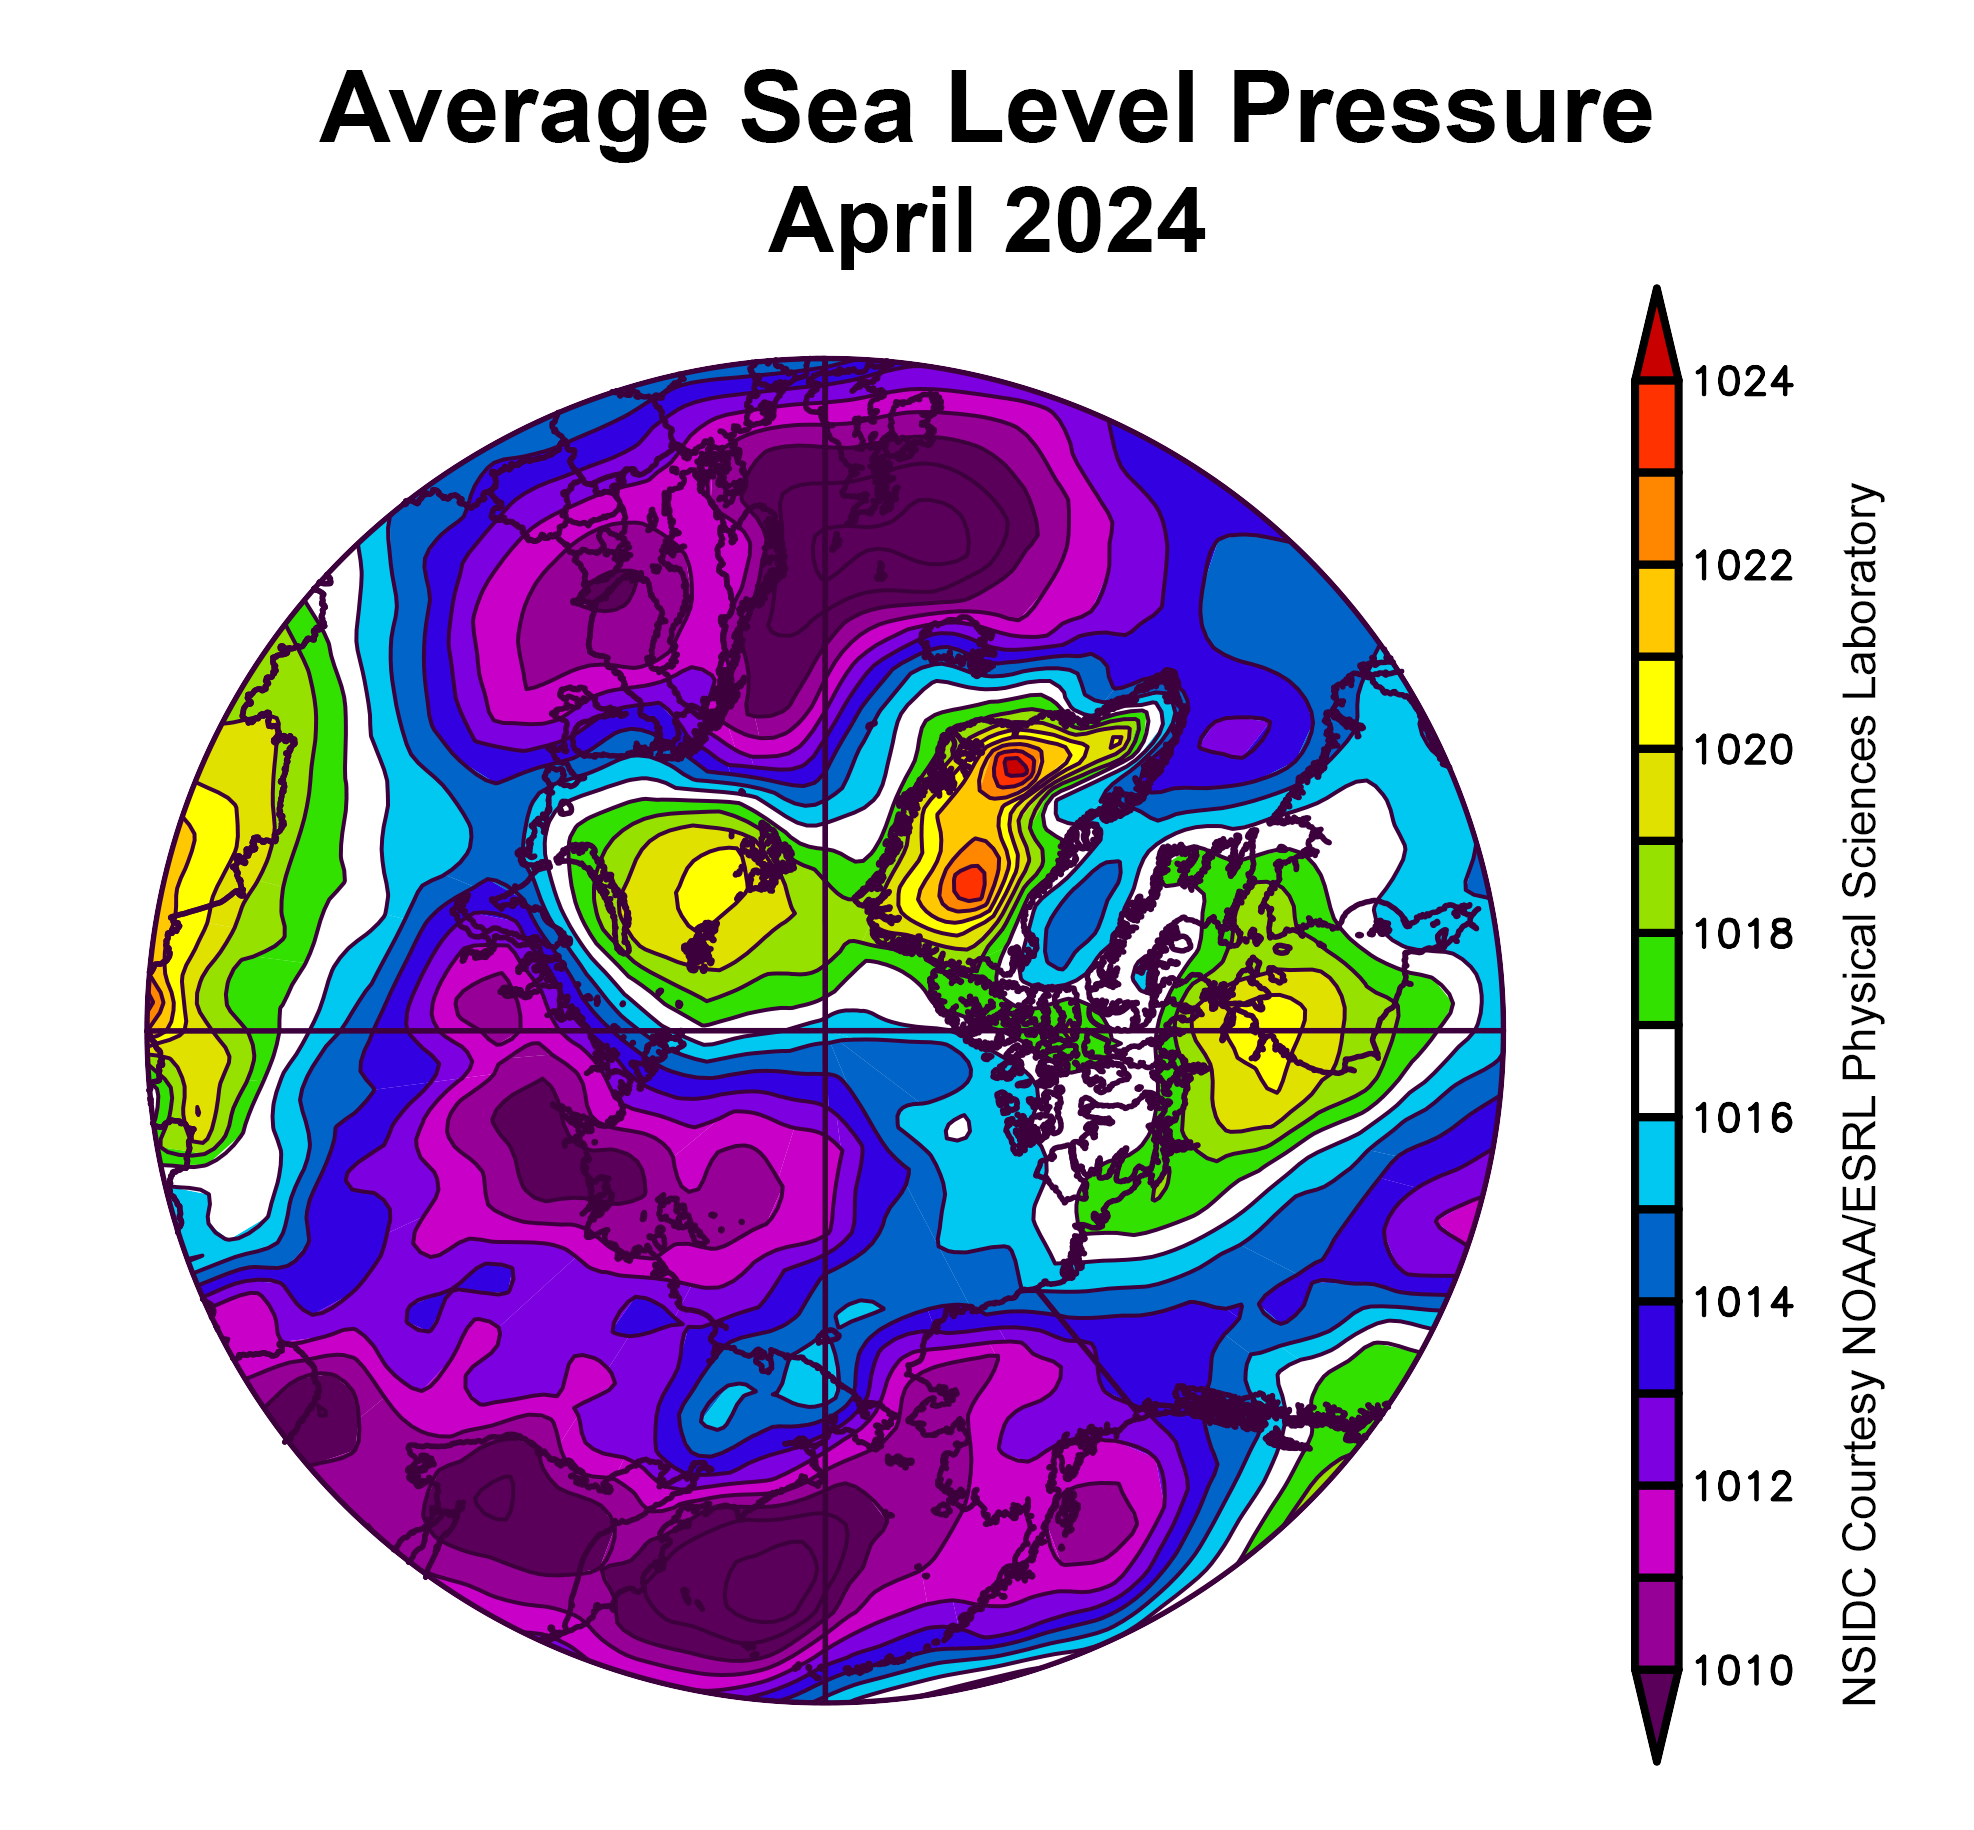
The atmospheric pattern for April featured high sea level pressure centered over the Barents Sea but lower pressure over most of the rest of the Arctic Ocean. In Hudson Bay and Greenland, pressures were relatively high. The pattern in March that favored faster outflow of ice through Fram Strait did not persist into April.
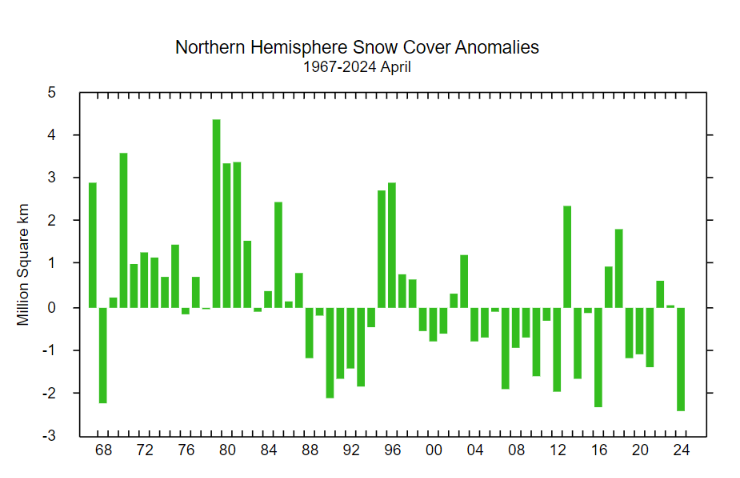
The April Rutgers Global Snow Lab northern hemisphere snow cover anomaly chart reveals a record low area:
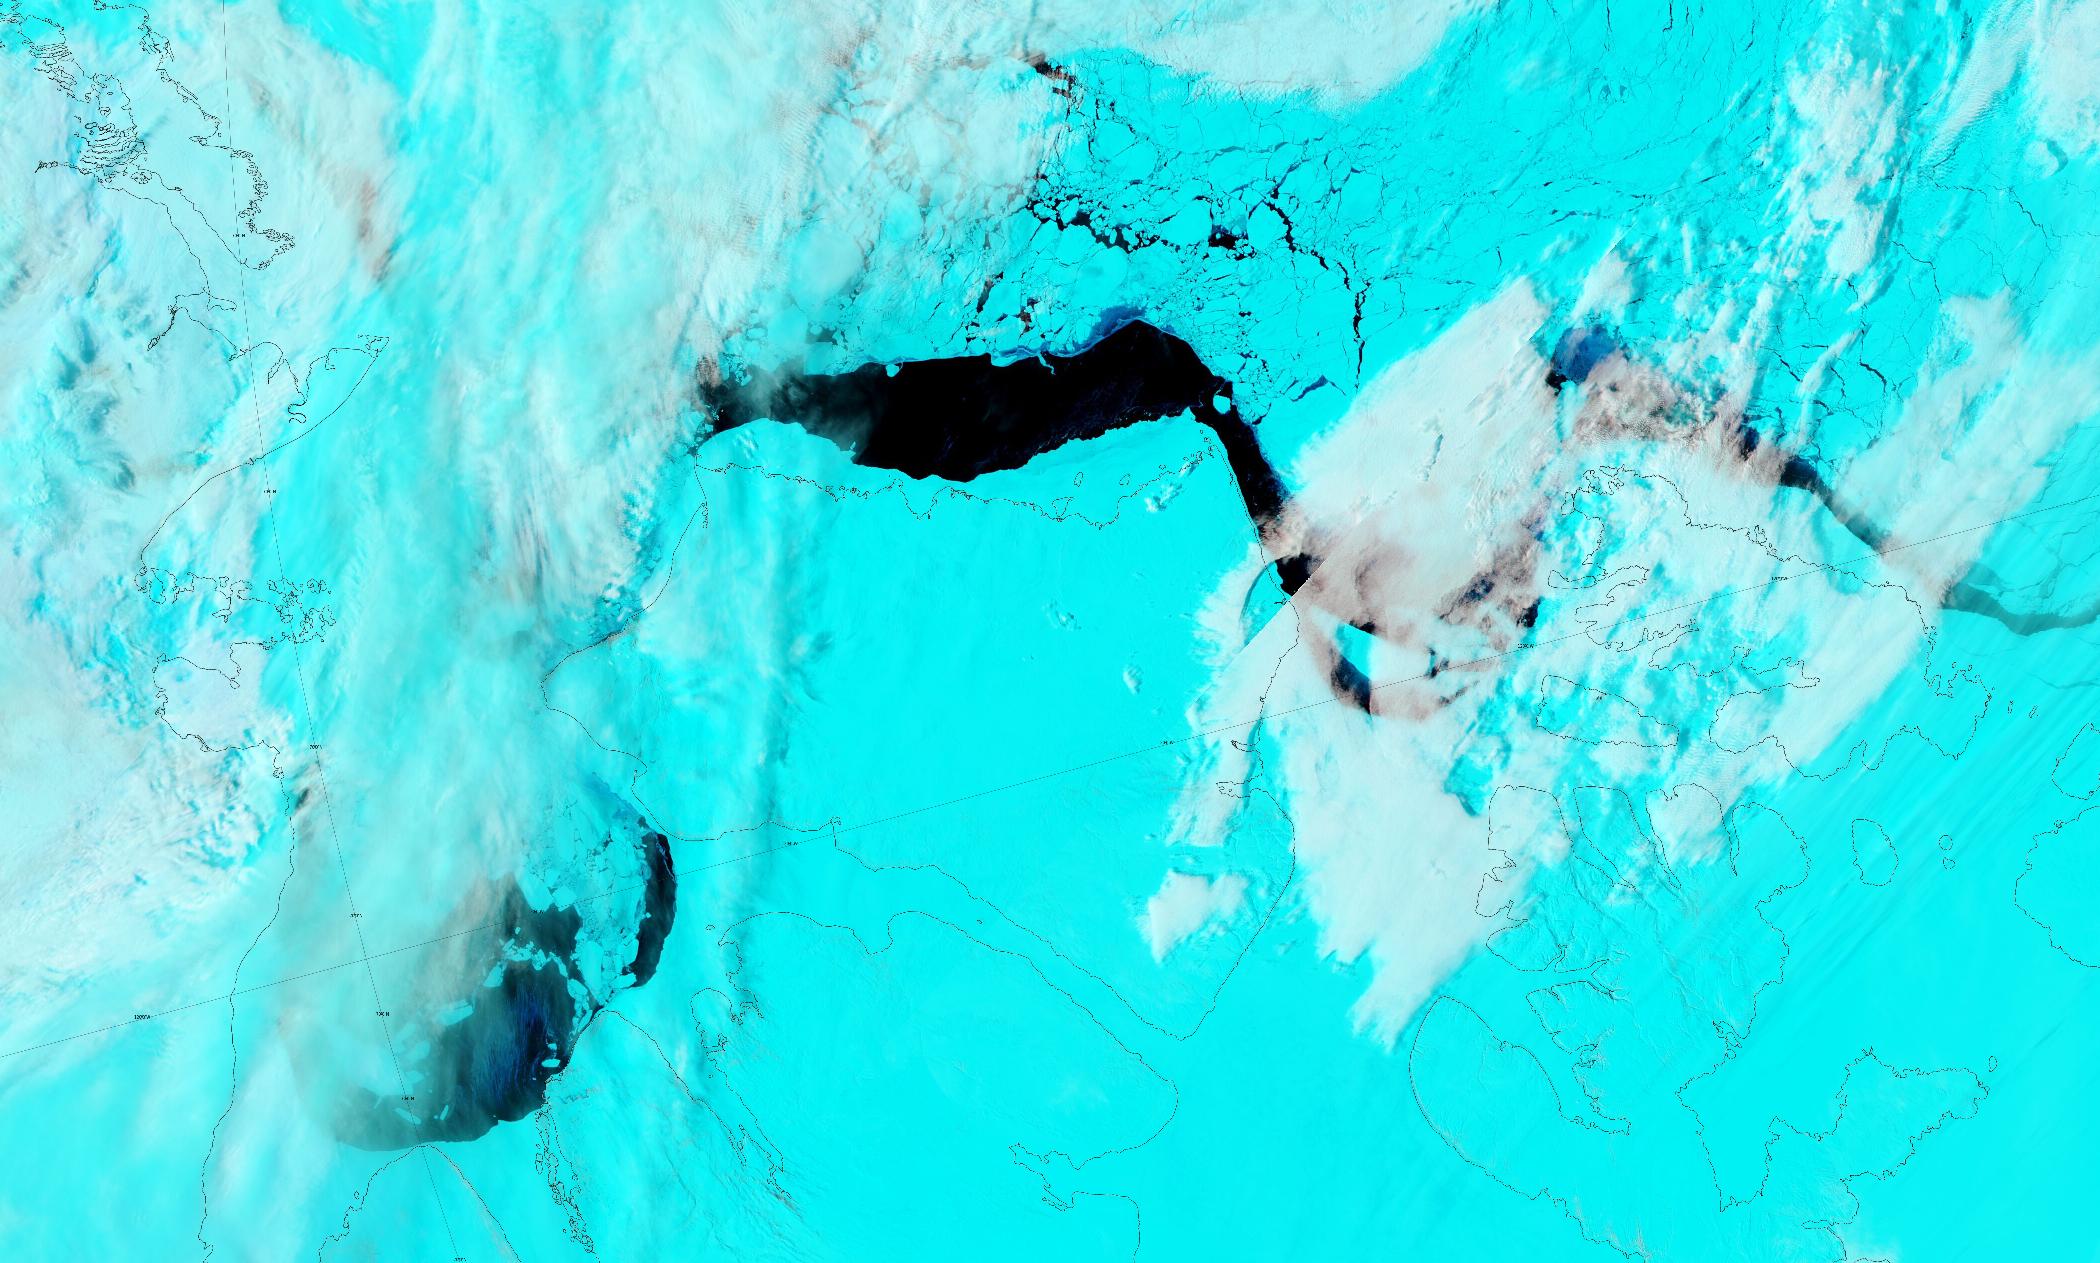
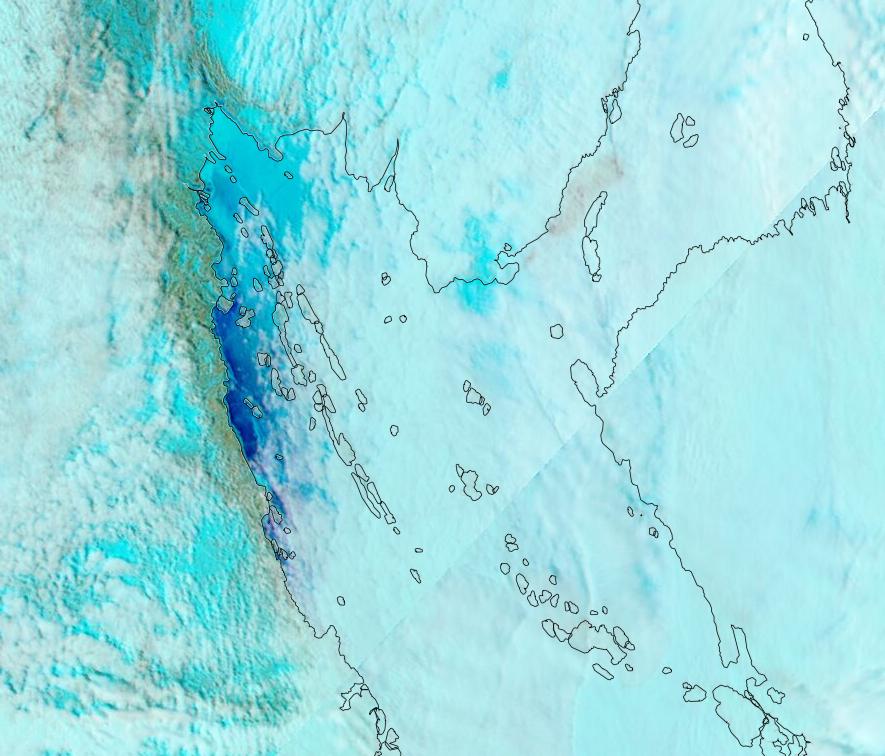
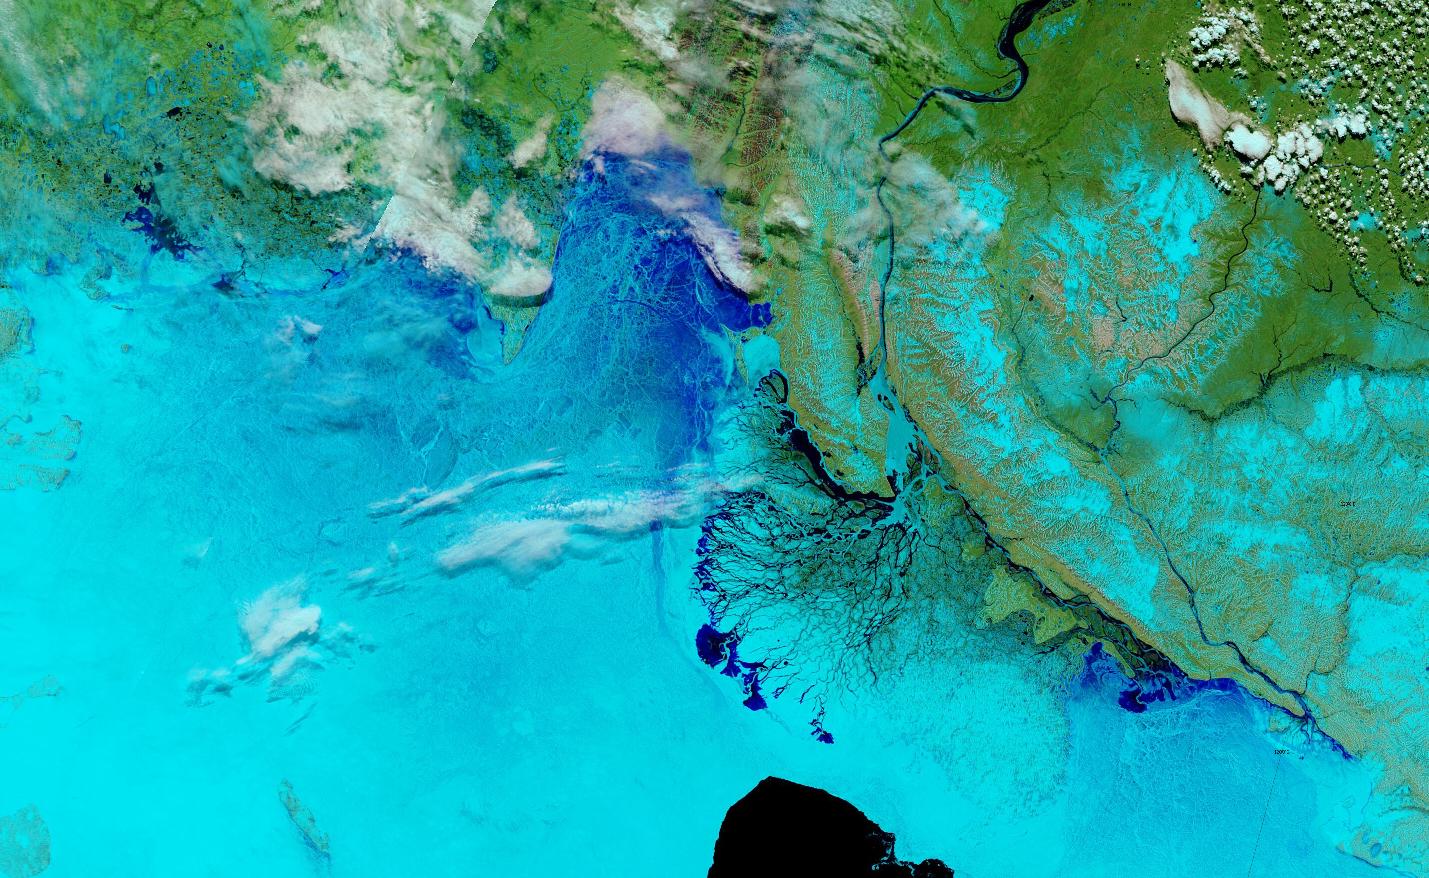
There is now significant open water in the eastern Beaufort Sea and Amundsen Gulf:
The first signs of surface melt are now apparent in the Coronation Gulf:
The sea ice in Hudson Bay is breaking up slightly earlier then usual:

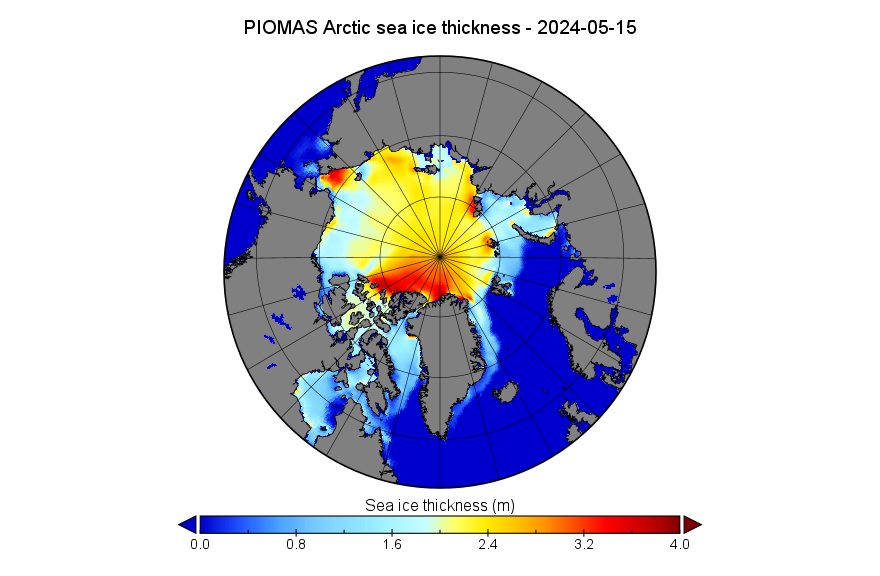
The mid month PIOMAS gridded thickness data has been published, so here is the PIOMAS thickness map for May 15th 2024:
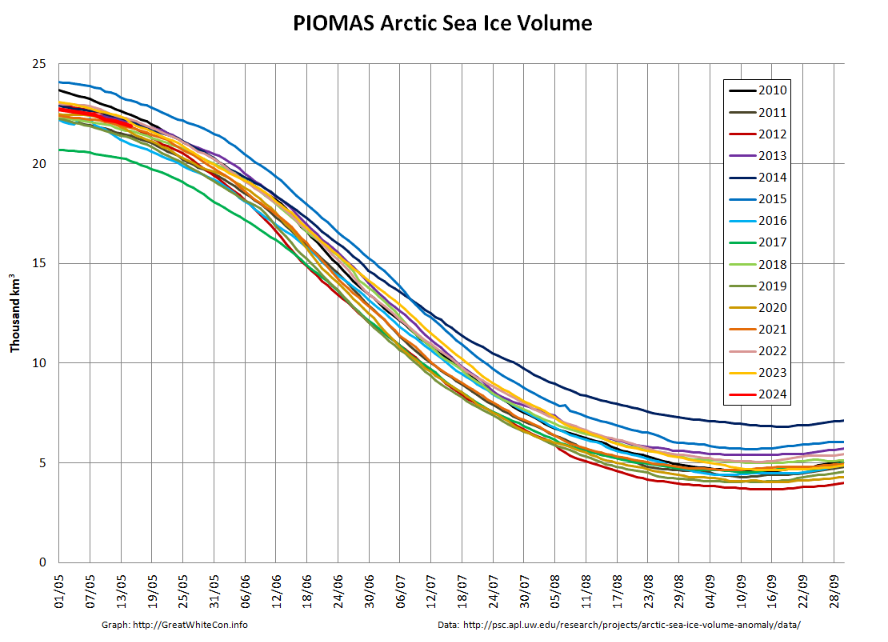
Here too is the mid month volume graph, now looking forward to the summer minimum:
Water is starting to appear on the fast ice off the Mackenzie Delta:
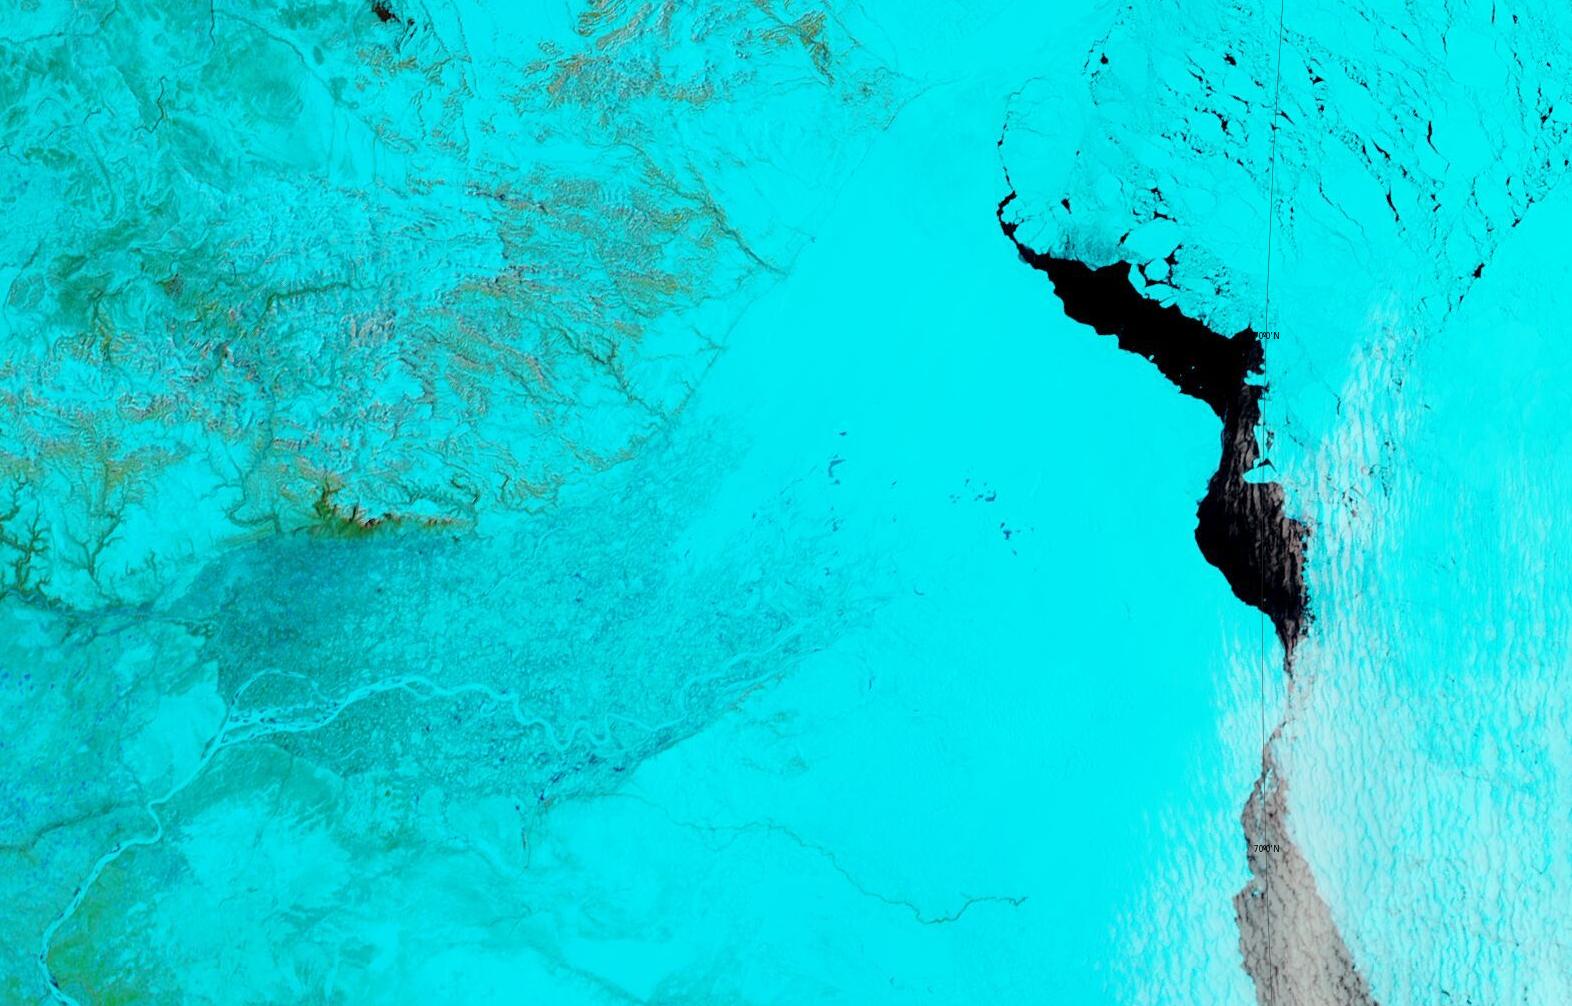
There is also now a clearer view of the surface melt on the sea ice in the Coronation Gulf:
As an extra special treat for our loyal reader(s), “Snow” and I got brassed of with YouTube’s refusal to let “us” post links to authoritative Arctic sources in comments. Hence “we” hastily produced this video:
Your feedback is most welcome, but note that it is already apparent that:
1) I evidently need a new microphone!
2) John Robson’s words and deeds seem to gradually get out of sync, but I haven’t got time to fix that at the moment.
[Update – May 30th]I’ve been out on the road for a week, with no time to make my usual regular inspections of Worldview. On my return I note that, amongst other things, the Lena Delta has turned to liquid and much of the fast ice in the Laptev Sea is covered in melt ponds:
The conversation continues over on the June open thread.
It’ll be an exciting month!
PS: Jaxa changed their stuff, so a lot of folks lost their extent feeds. New address(es) are (for North (Arctic) and South (antarctic) respectively:
regular domain /vishop/data/SeaIceExtentGraph/seasonal_n.csv
regular domain /vishop/data/SeaIceExtentGraph/seasonal_s.csv
April 2024 adds another month to the record of CS2 data which now spans 13 years. Neither CS2 nor PIOMAS show any discernible trend over that time period underlining the importance of internal variability at decadal timescales.
see Fig. 8 and Fig. 11
so you think the “Arctic Death Spiral” graph is a lie? hahahaha
Death Spiral is not a lie, but like some stories, it begins dramatically and winds up pretty boring. The last 10 years or so, for example…
The story is not over yet Taylor.
No Jim, the ‘story is not over yet’, but the panic about the end of Arctic sea ice and the mass extinction of polar bears (so helpful to fund-raising in certain quarters) should be…
The only polar bears that get a mention in here are the surfing sort:
And the ones that try to eat Arctic buoys:
The last ten years or so mean nothing,… as you well know!
Can we also assume that 1980 to 1990 meant nothing as well?
I think it best to reserve judgment on the current slowdown (dare I say ‘pause’) SpeakMyLanguage, if that IS your name…
The latest Arctic extent showing no significant trend from about 2011.
How about the long term trend Peter?
-11.8% per
yeardecade in September, according to your graph.Per decade… But still, take out a couple of real outliers, 2007, 2012.. there’s still a gradual downward trend.
Let’s hope we don’t get 2007 like conditions this year!
More haste less speed! Now fixed.
Matt and similarly “skeptical” sorts don’t much care for “removing outliers” Tom!
7 days til the june cliff…
Extent and Volume are parting ways,… it looks to be a trend, does it not?
Not sure what you mean by “extent and volume are parting ways…”. PIOMAS is now out for May, showing another unremarkable year with a continuing pattern of ‘no trend’ for 13 years, and extent is similarly unremarkable for May, per NSIDC. Please elaborate…
To some extent (pun intended) it depends on which volume graph you look at.
Here’s the final “reanalysed” CryoSat-2/SMOS data for mid April:
Compare/contrast with the PIOMAS equivalent:
And Tony Heller’s recent favourite from DMI:
Taylor, you sound like one of those Apple young persons asking if their customers lie to Google ! (You know when they show you up for a supposed fool in a group setting on how to use the product you bought off them for good money.)
…Why are those Apple young persons so strident in their accusations towards paying customers in group settings?