At the beginning of July the JAXA/ViSHOP web site is undergoing maintenance yet again! Here here is how their 2 day average extent graph looked for July 1st:
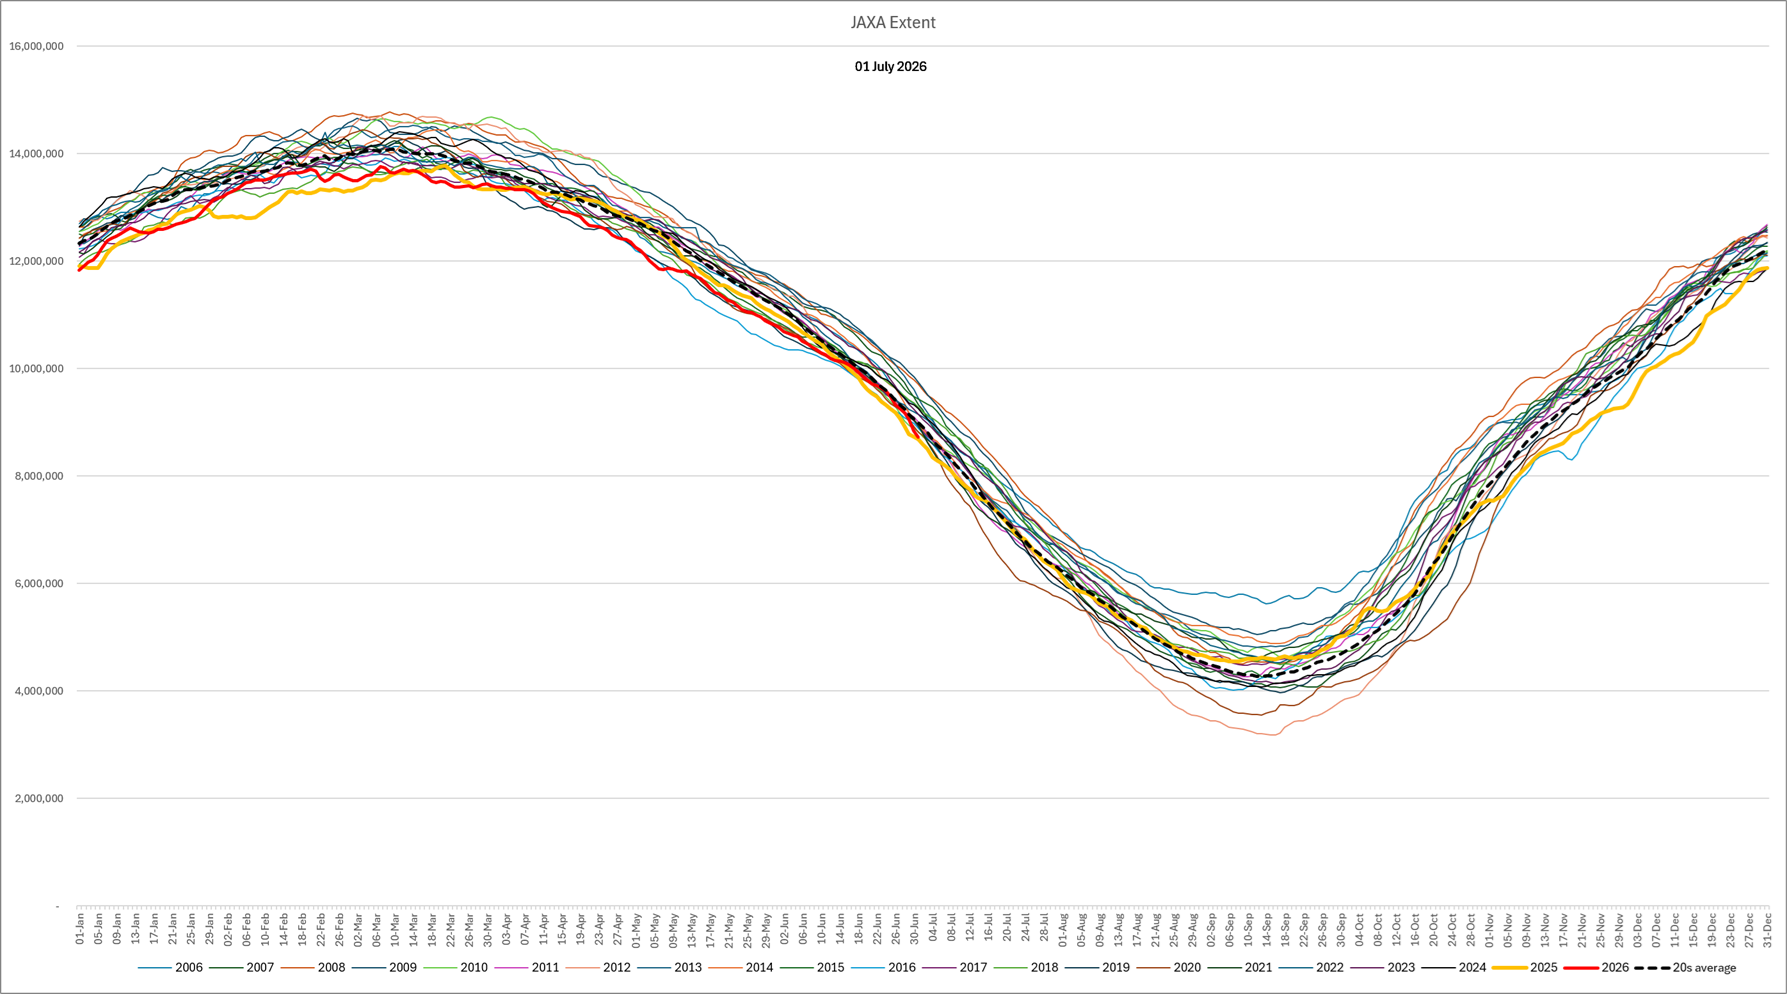
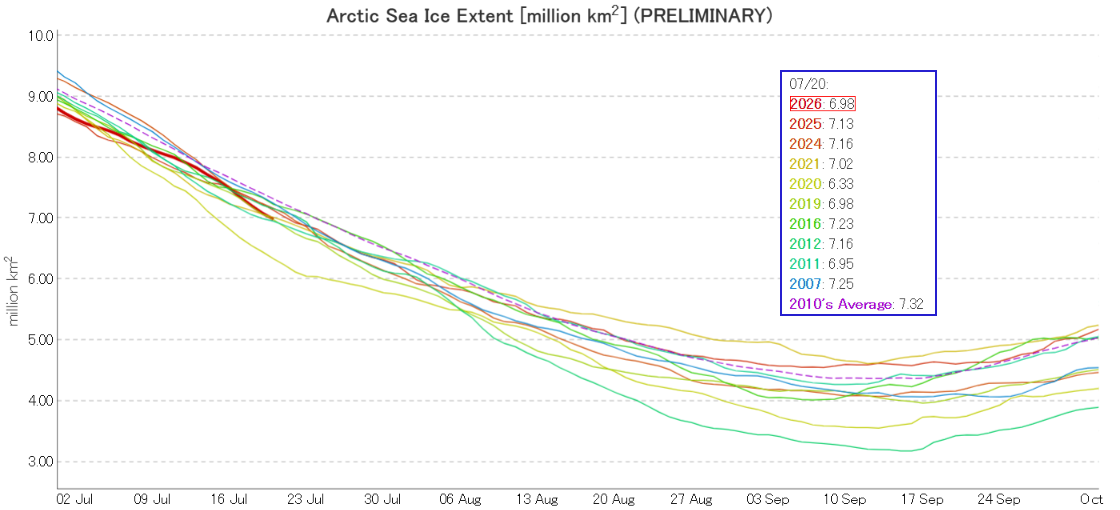
Extent is currently second lowest for the date, above 2025 by a whisker.
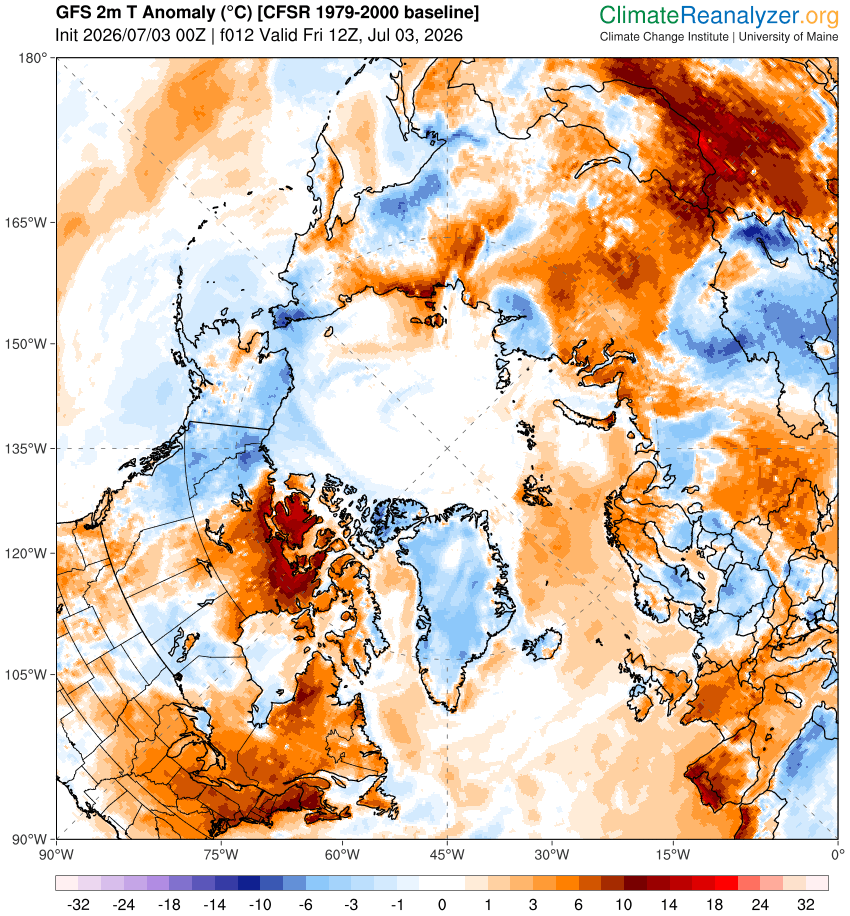
Looking next at temperature anomalies across the Arctic, the Beaufort and Chukchi Seas are slightly cooler than the 1979-2000 climatology. However, the East Siberian Sea and particularly the Canadian Arctic Archipelago are well above what used to be considered “normal”:
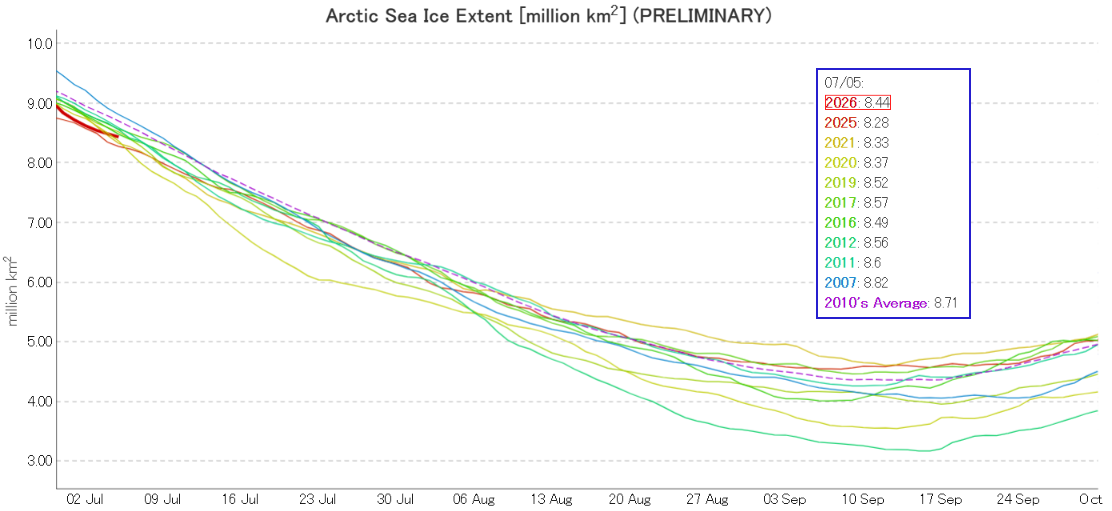
The JAXA website is online once again, with extent now 3rd lowest for the date:
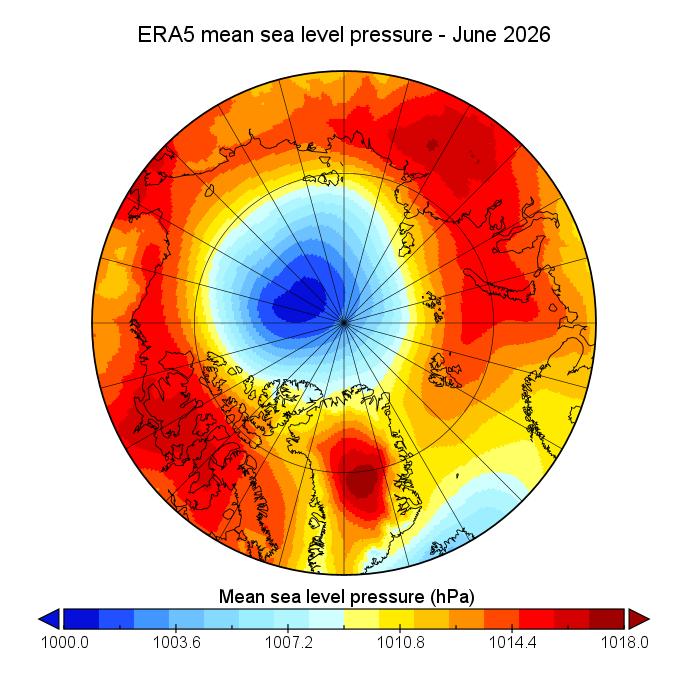
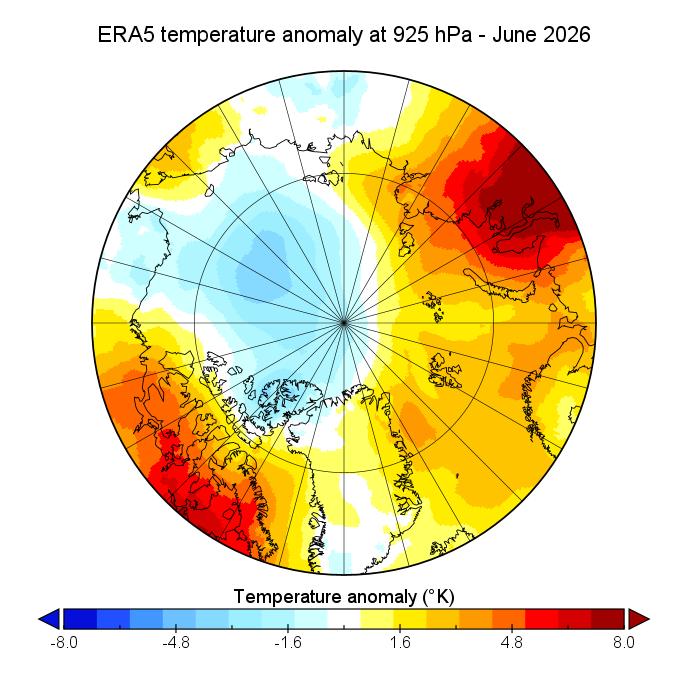
Atmospheric conditions over the Arctic have reversed from last month. Low pressure accompanied by cooler conditions in the central Arctic, with above average temperatures around most of the periphery.
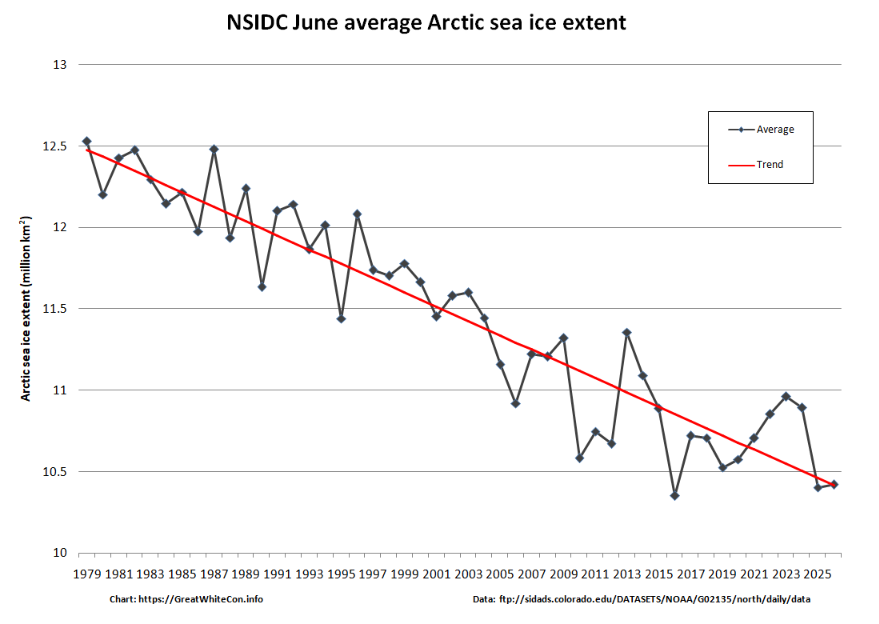
The NSIDC monthly average extent graph for June shows 2026 close to all time lows, this time in 3rd place behind 2016 and 2025:
There are some interesting goings on in the icy seas off North East Greenland!
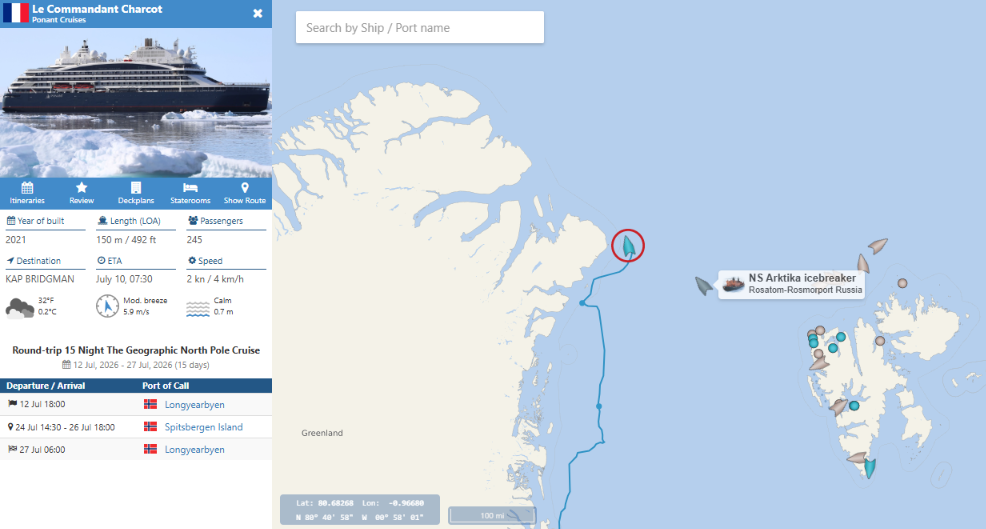
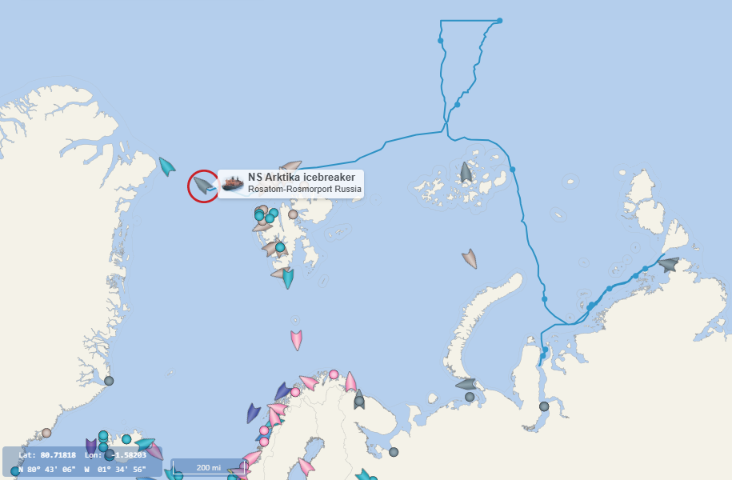
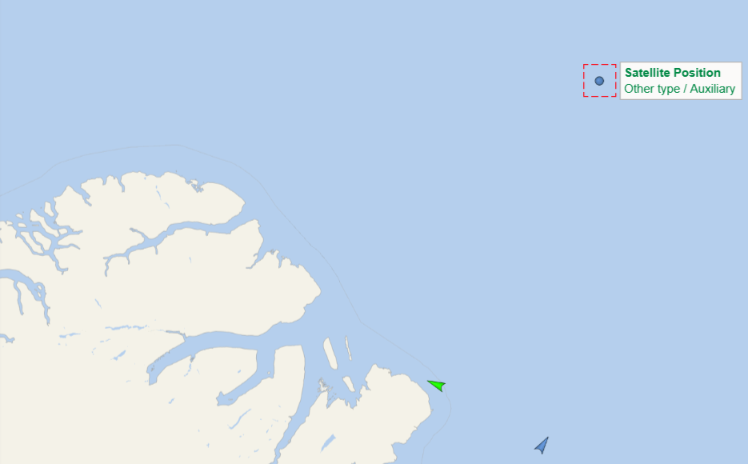
The ice strengthened passenger ship Le Commandant Charcot has rounded Nordostrundingen, en route to the North Pole via Kap Bridgman. Nearby is the Russian nuclear icebreaker Arktika, which has recently been to the North Pole. Further north can be found the Russian “research vessel” Severniy Polus, which translates to “North Pole” in English.
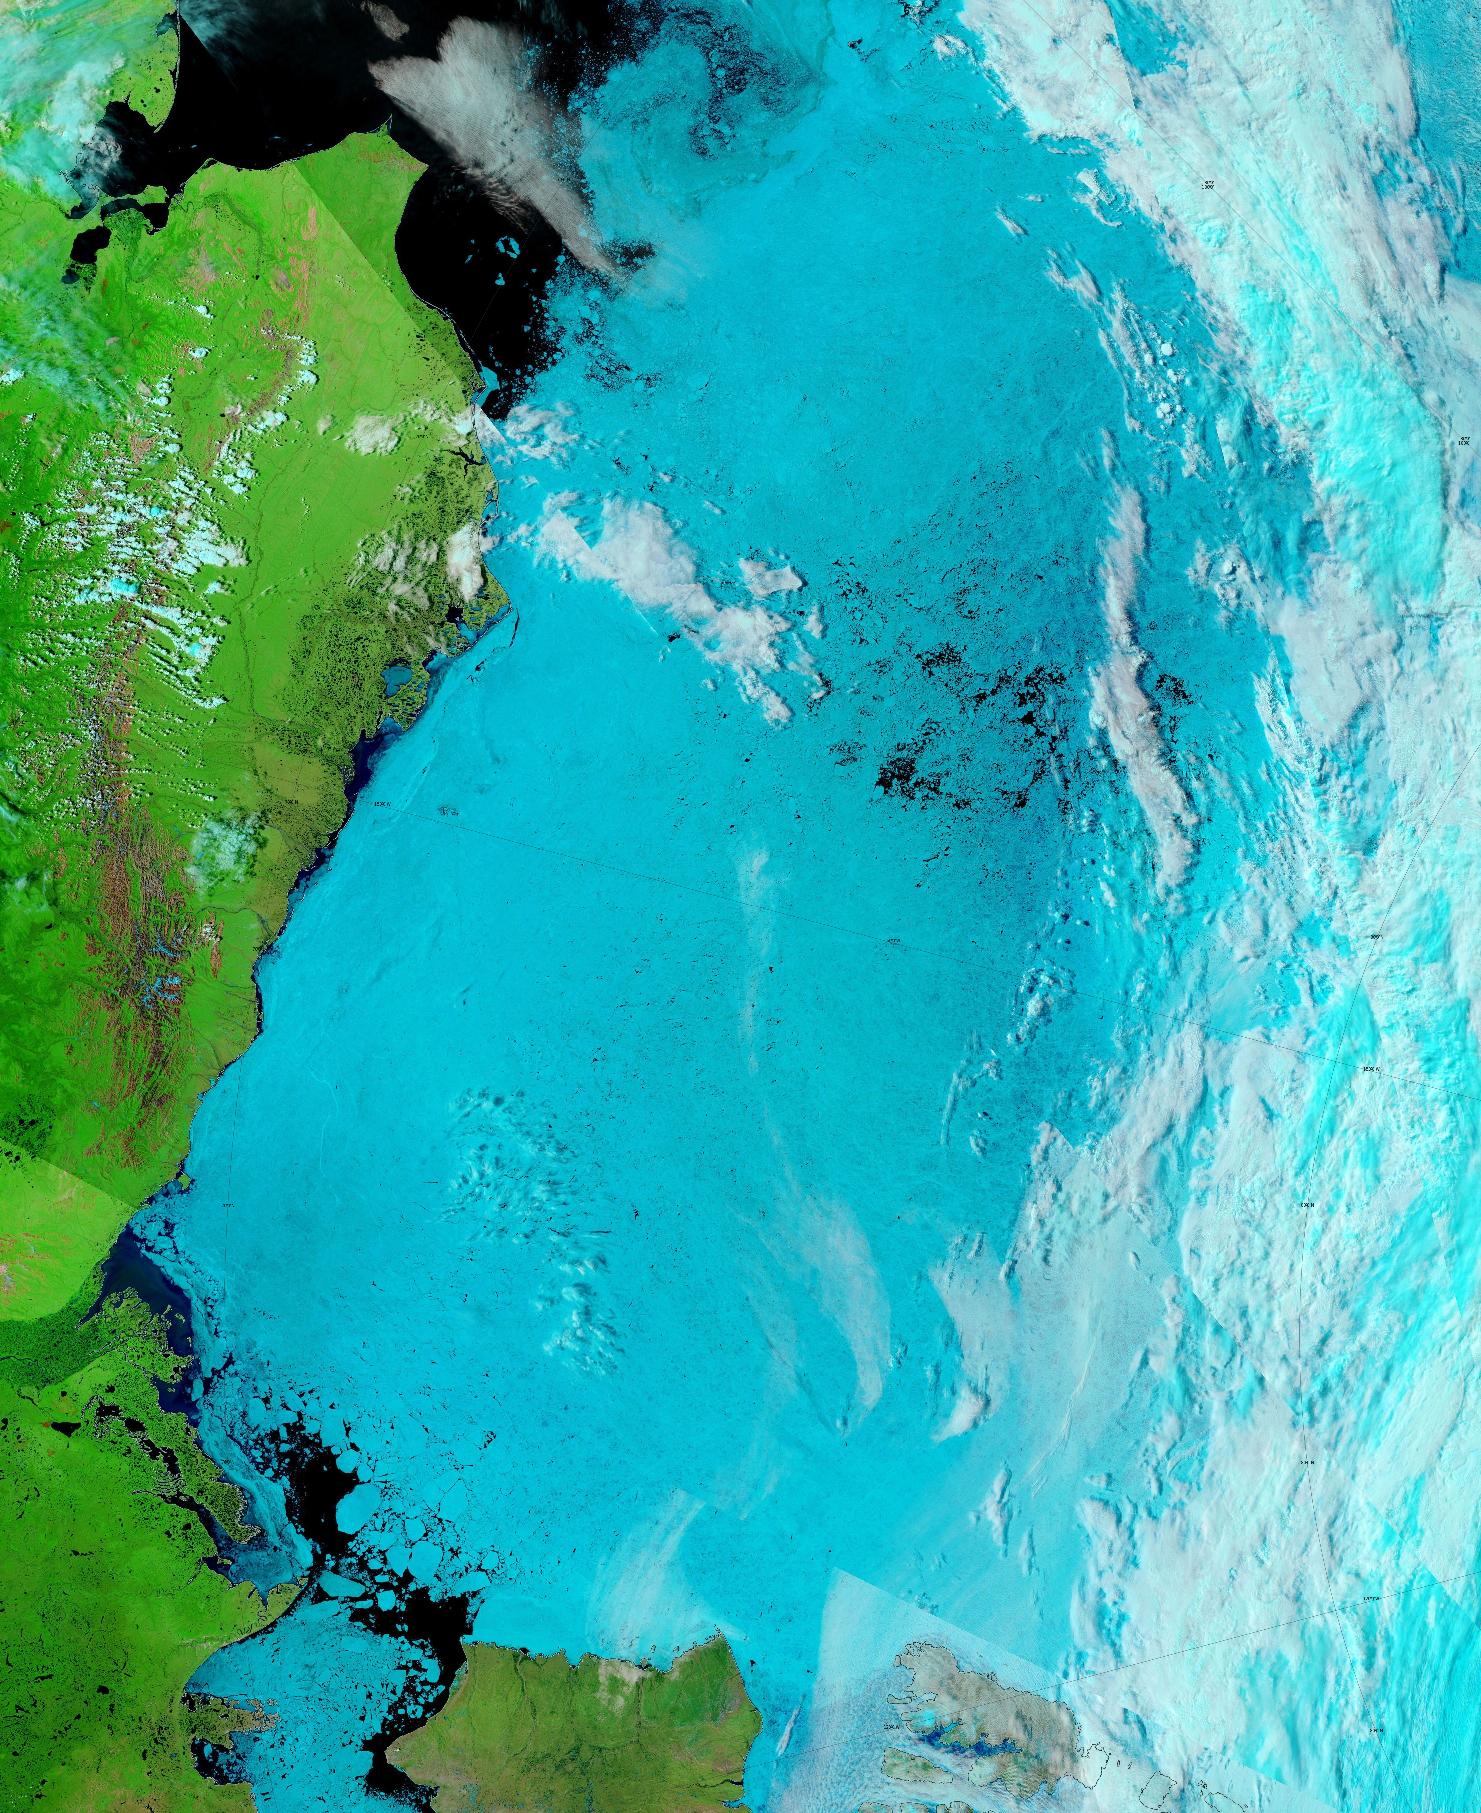
Here’s a fairly clear view of the Beaufort Sea from on high, revealing a large area of low concentration ice north of Utqiagvik:
After sluggish melt at the beginning of July, JAXA extent has been declining more rapidly over the last week:
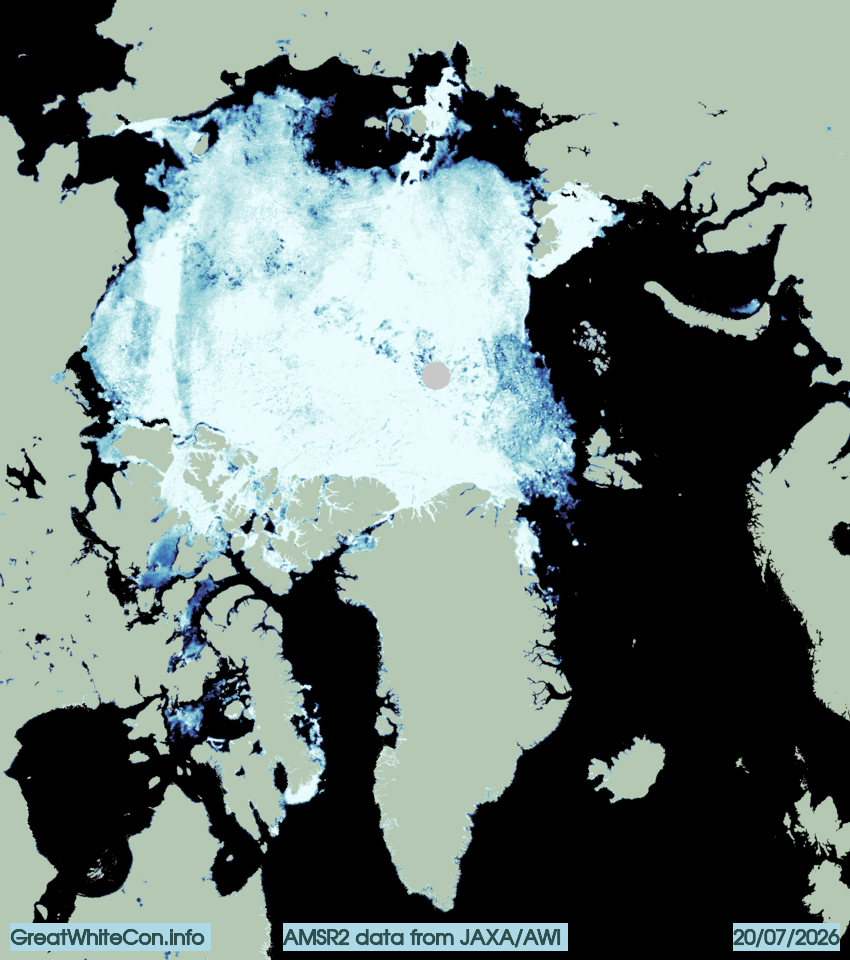
The latest AMSR2 concentration map shows an area of low concentration ice bisecting the Arctic from the Chukchi Sea to Svalbard:
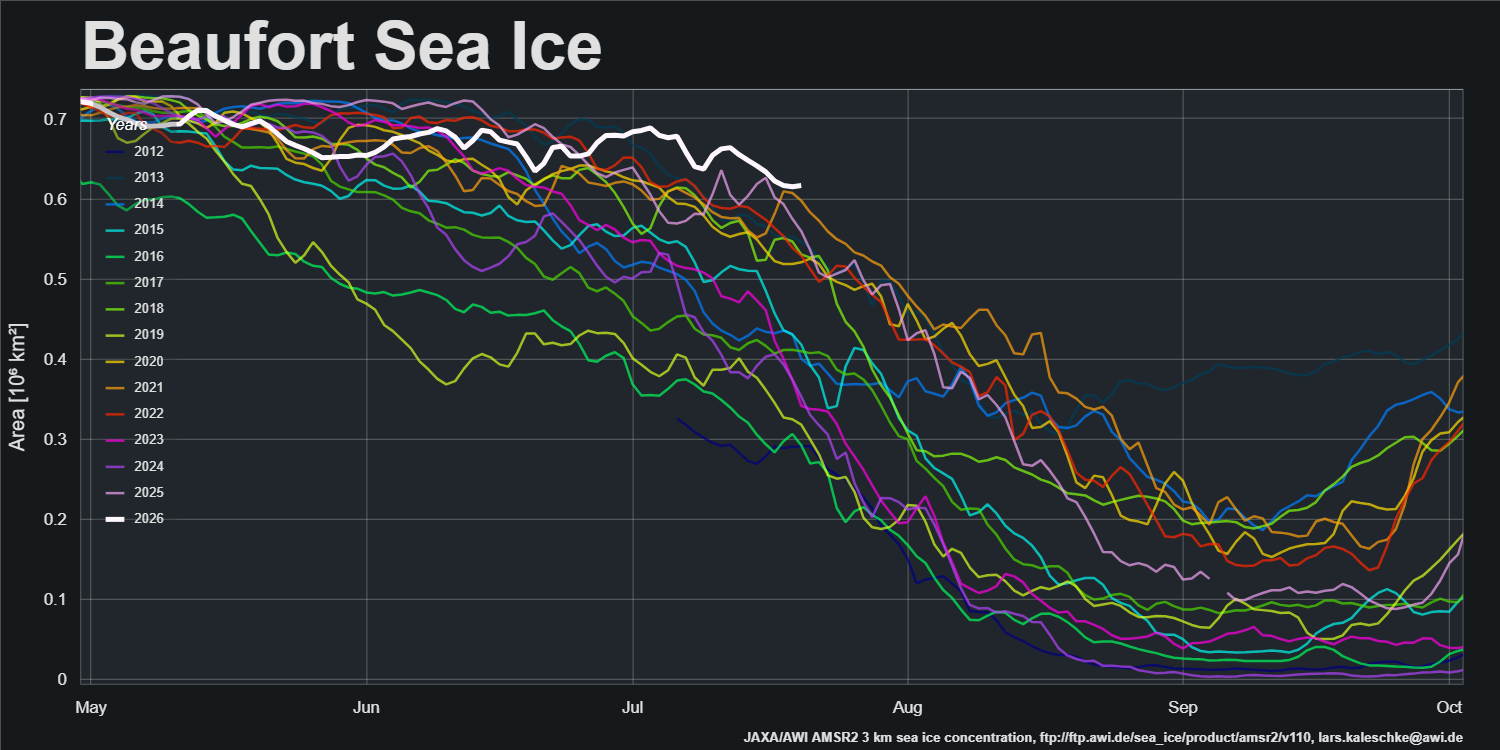
Sea ice area in the Beaufort Sea is at a maximum for the date in the AMSR2 era:
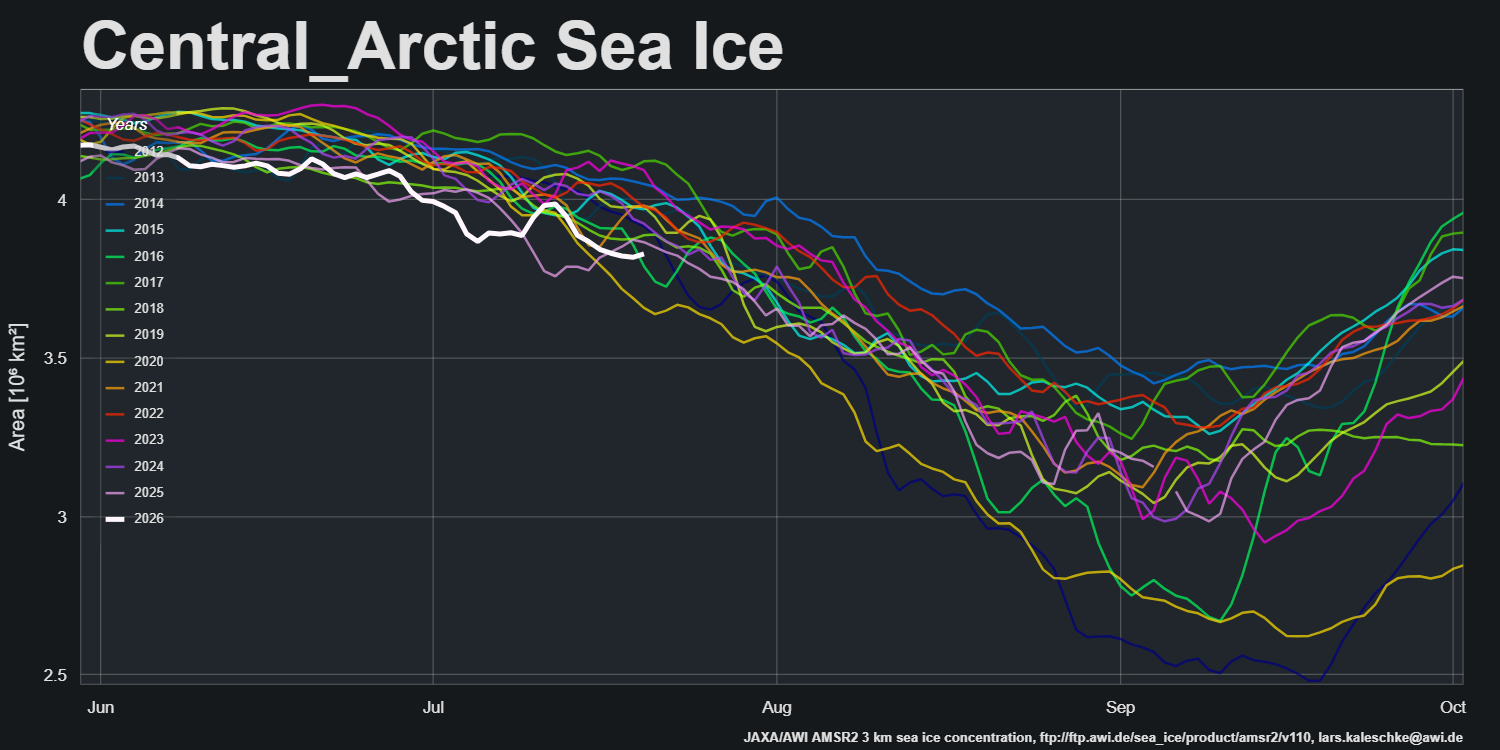
However, there is a large area of dispersed ice and open water on the Atlantic side of the Central Arctic Basin:
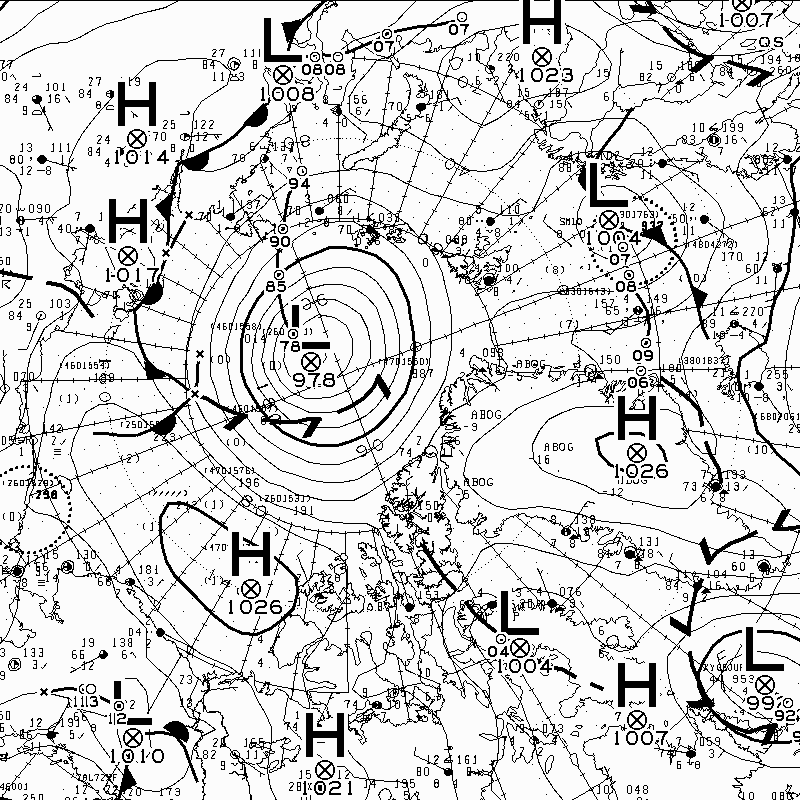
The latest in the sequence of Arctic cyclones bottomed out at 978 hPa near the North Pole earlier this morning. This is the Canadian Meteorological Centre‘s 06Z chart:
Here’s a satellite image of the current cyclone, spinning over the North Pole yesterday:
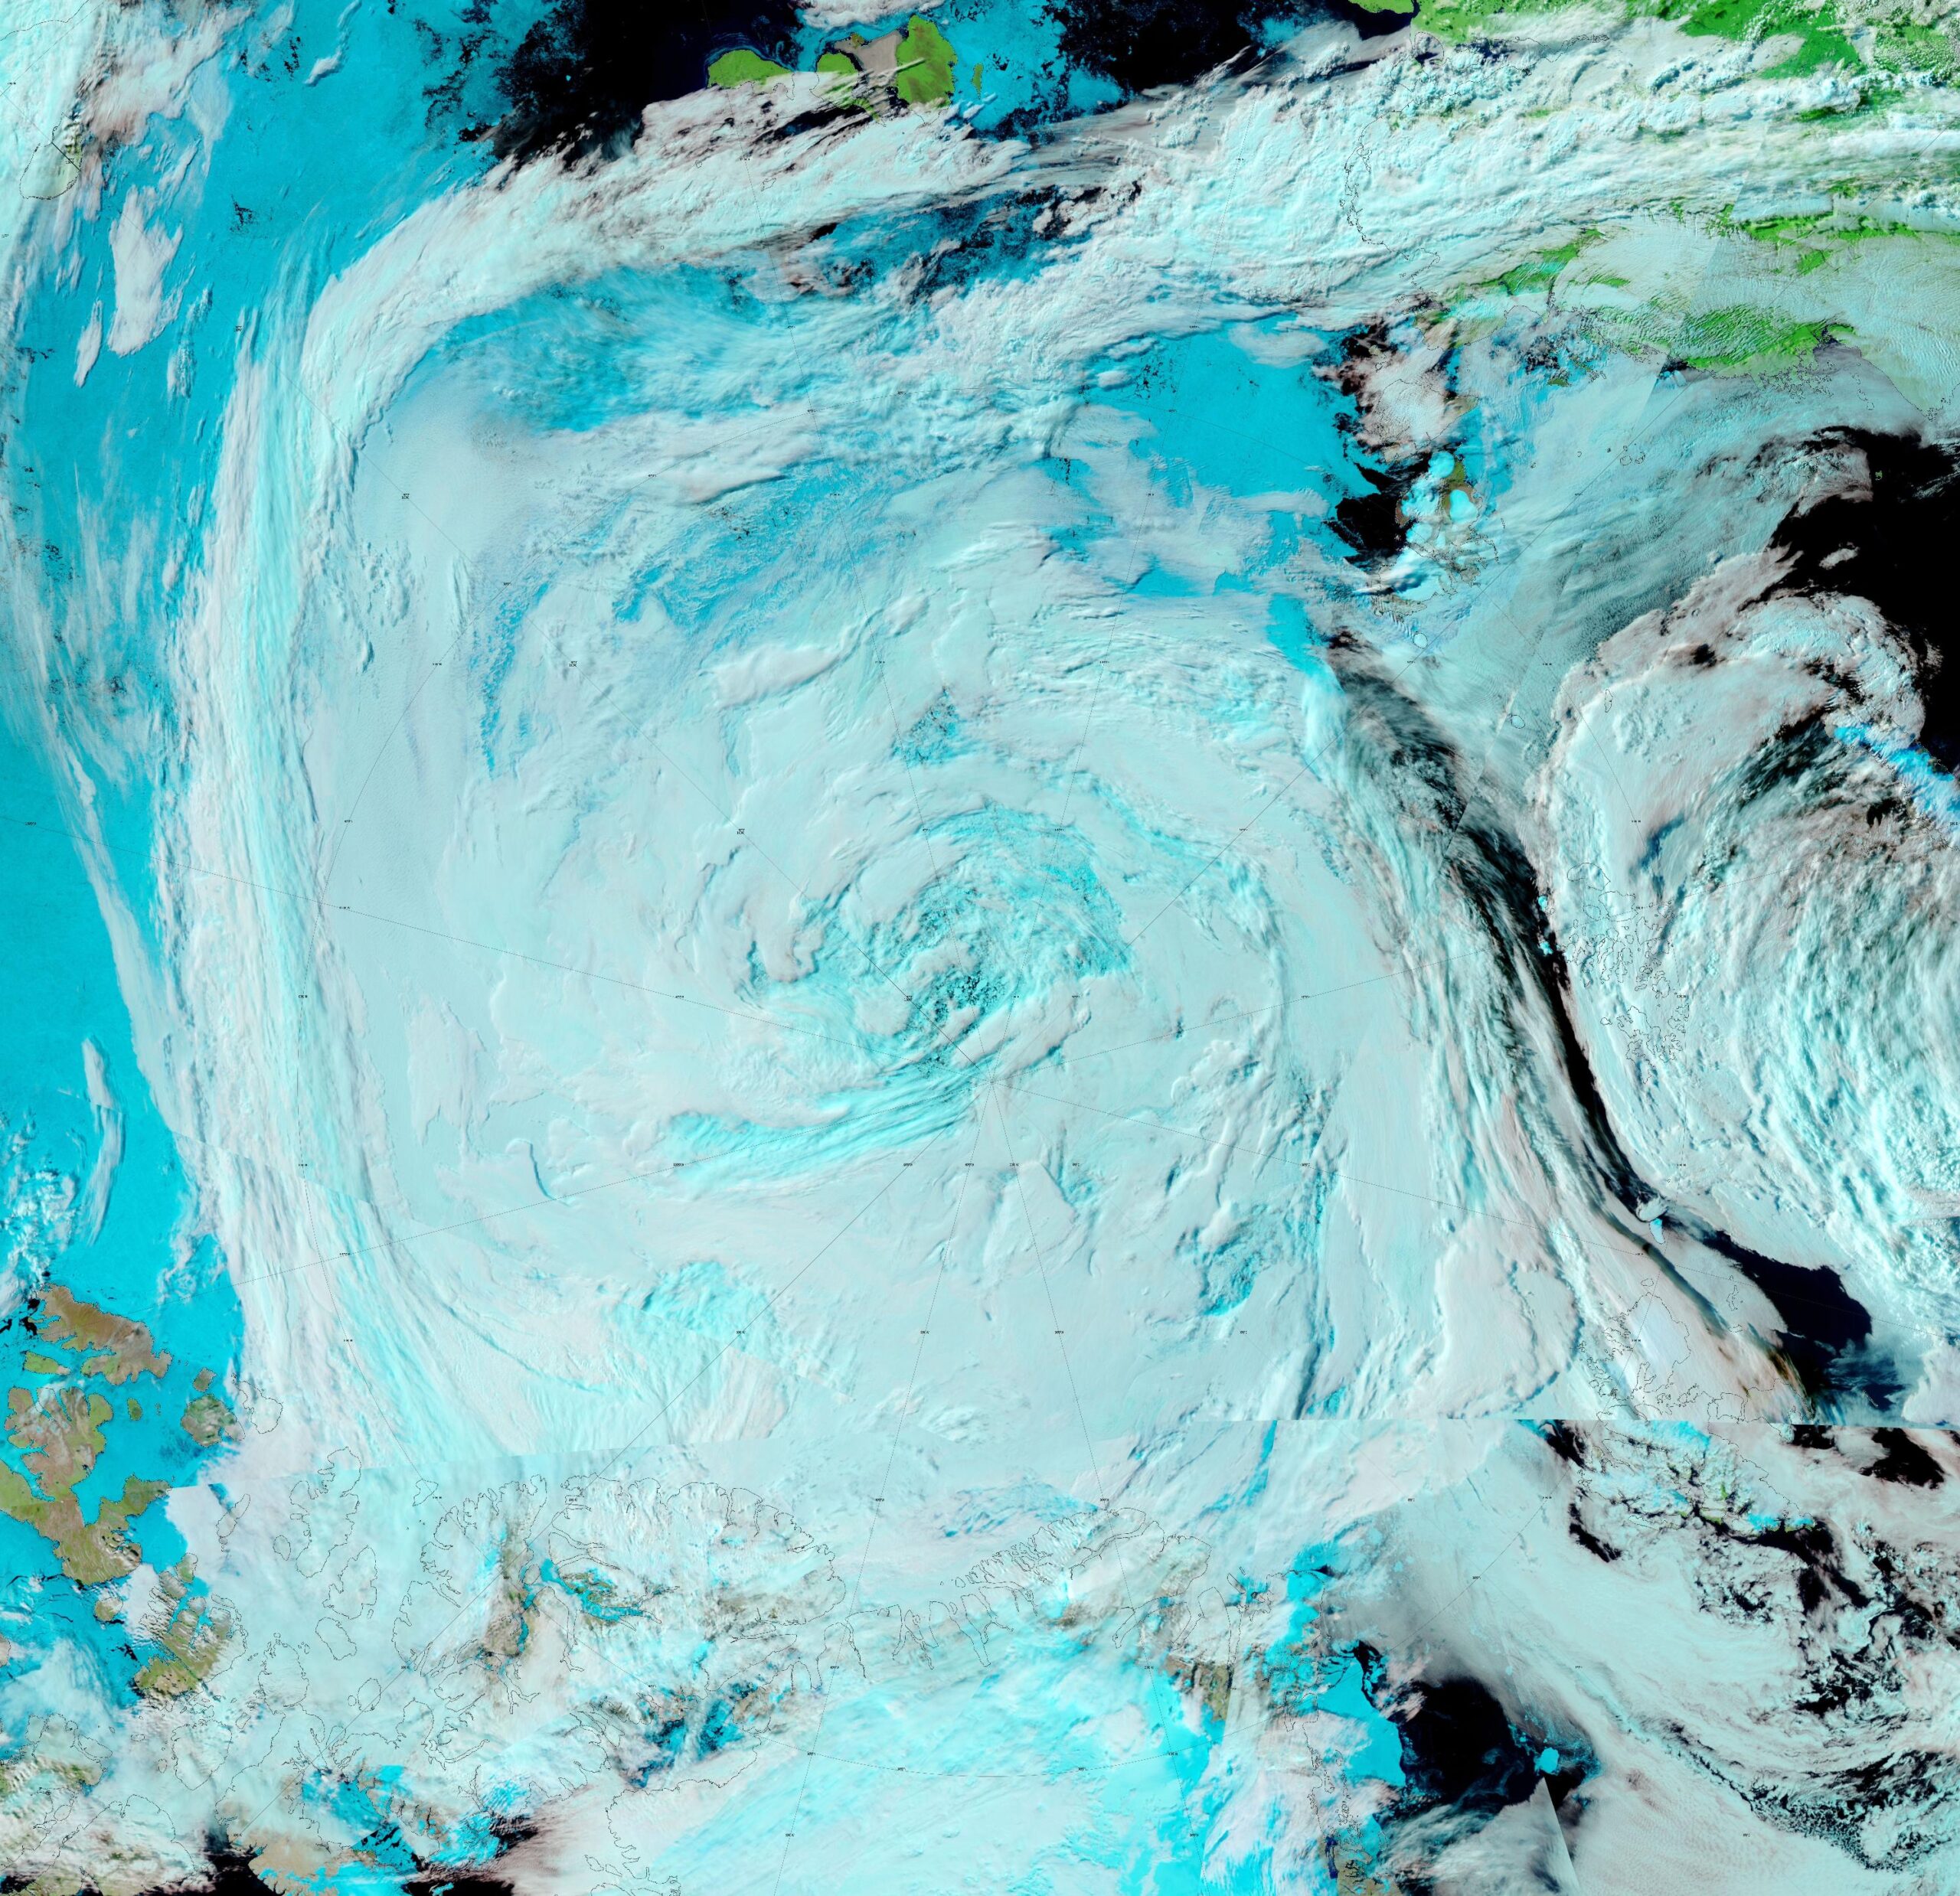
Through the clouds you can discern an area of dispersed ice near the North Pole, also visible on the AMSR2 concentration map above.
The conversation continues over on the August open thread.
Hi there, Jim!
Any wind of some interesting firsts, polar expeditions or other this summer?
Well, Hubert Sagnières et al. completed their trek across the fast ice in McClure Strait to Mercy Bay, but not back:
https://www.routesnouvelles.com/en/expedition-1853-2026
And of course Ella Hibbert and Yeva are attempting the Northern Sea Route from east to west, currently planning on setting off in early August.
No doubt a variety of “small vessels” will be attempting the Northwest Passage this summer.
Beyond that I have to admit that I haven’t done a lot of research as yet.
I liked the guys on the catamaran a few years ago, liveblogging & GPS tracking and whatnot, I believe also photoblogging?
Too bad they had to end their attempt. They weirdly didnt meet a single polar beer, so I think they were iced in and thus had to throw in their towel.
Is there perhaps a place where you follow, i.e. an expert space where experts themselves go to see what attempts are being made?
A virtual Explorers’ Club for big ambitions?
Sébastien Roubinet’s Nagalaqa Expedition?
https://GreatWhiteCon.info/2022/08/the-nagalaqa-expedition/
I’m not aware of a central repository of polar expeditions. I just Google “polar expedition” and similar phrases occasionally!
There was talk of the Artur Chilingarov Ice Camp during the winter, but it now seems that it won’t be built until next year:
https://tass.com/economy/2080357
Thanks a bunch, Jim. You’re the best
DMI shows Artic temperatures only just risen above zero
https://ocean.dmi.dk/arctic/meant80n.uk.php
Is this a bit unusual, Jim?
Long time no see Neil!
Yes, it is a bit unusual in this day and age. However, it doesn’t mean much.
See the fragmented ice near the North Pole last month:
The freezing point of sea water is approximately -1.8 °C.
Thanks very much for the response Jim.
I don’t post very often but I do visit frequently.
I checked back through every year to 1958.
The only years showing similar charts are 2013 and 2014.
It will be interesting to see how many days the temperature rises above zero
The melt season is usually very short north of 80°, but in by September, that’s exactly where the remaining ice is to be found. In my opinion the slow start in the Beaufort will have more impact on the final extent.
Hi Jim,
Here’s the latest from the University of Bremen showing no statistically significant trend from 1972 for the Antarctic and 2007 for the Arctic.
Cheers,
Peter
Hello again Peter,
Long time no see!
Your image shows no trend lines, nor any sort of statistical analysis. Are you by any chance relying solely on your Mark 1 eyeballs for your alleged “analysis”?
I also refer you yet again to Bitz & Roe (2004):
https://GreatWhiteCon.info/2022/02/facts-about-the-arctic-in-february-2022/#comment-544708
Hello Jim,
Having spent nearly my entire working career involved with instrumentation and measurement, I think I can confidently “eyeball” the university the university of Bremen time series and state that Antarctic sea ice extent from 1972 and Arctic sea ice extent from 2007 show no signifiant trends.
I don’t have the time to download the data and trend it so I asked AI…
[AI screenshot redacted – Mod]
Unlike models, assumptions and opinions, which you refer me to, I prefer to stick with the data.
Cheers,
Peter
Hello Peter,
In actual fact I refer you to physics.
I also refer you to a previous conversation in here about the pros and cons of so called “artificial intelligence”.
If you want to quote AI in here then at the very least you need to include your prompts. Linking to the alleged “thinking” of the LLM involved instead of screenshots is also recommended.
Please include sufficient information to allow reproduction (or otherwise!) of your results, or your artificially “intelligent” commentary will be deleted.
Thank you for your attention to this matter.
I usually check this every morning. There’s a slow, steady trend in there alright.
Best of luck against Argentina tonight, Jim!
On the ice: Do we have any idea how the sea ice is doing this summer, volume wise? Seems Piomas lost all their marbles and/or all interest in keeping score. And further, CryoSat is keeping its AI reading of volume from satellites under wraps, for scientists only, so no share with the public. Leaving the DMI, who also won’t share volume numbers, only (dubious) graphs.
Who had a complete data drought in their bingo cards for 2026?!
Thanks for your good wishes GS. Sadly they fell on stony ground.
I also don’t have much confidence in DMI’s “dubious” thickness maps and volume graphs.
However, in the absence of any other such data here are the current editions:
It’s a pity about PIOMAS, remember both last years minimum and this year’s maximum were bordering on record lows, with no more than average weather.
And not to forget, its full-year average was actually lowest on record.
Jim, I find it interesting that the much criticised DMI, who won’t ever provide the raw numbers graphed to the public, and who will just ignore every year before 2022 even when it has less ice than the current year, picks the first summer melt season in at least a decade with no daily/monthly ice volume figures from any source globally, for their first deviation from the “current year always lowest” rule of thumb, in their number-free graphing of current sea ice volume. Thusly, they now show 2026 having more sea ice than 2025, and even than 2024, as of July 23rd.
Could it be that they are actually listening to critics who say it’s not credible and most likely fraud when the DMI says sea ice volume is always lowest ever, all year every year? If so, it would amount to what’s called a charm offensive in my Nordic tongue.
DMI, you’re very welcome to charm us even more, namely by releasing the daily (estimated) sea ice volume figures.
New expedition, Jim, this one for the North Pole this Aug-Sep from Svalbard:
“Around 30 researchers and 20 crew members will spend the next 50 days sailing toward the North Pole as part of the Polhavet 2050 research program.”
No idea if this will work, but the Norwegians have decided to isolate themselves from the world, here:
Their final tweet is archived here:
https://twitter.com/oceanseaicenpi/status/1870427639560712618
On the North Pole.