There’s lots of coverage specifically about assorted Arctic sea ice extent metrics over on the “2023 Minimum Extent” thread. However we’ll start the September open thread ball rolling with a couple of cross posted images.
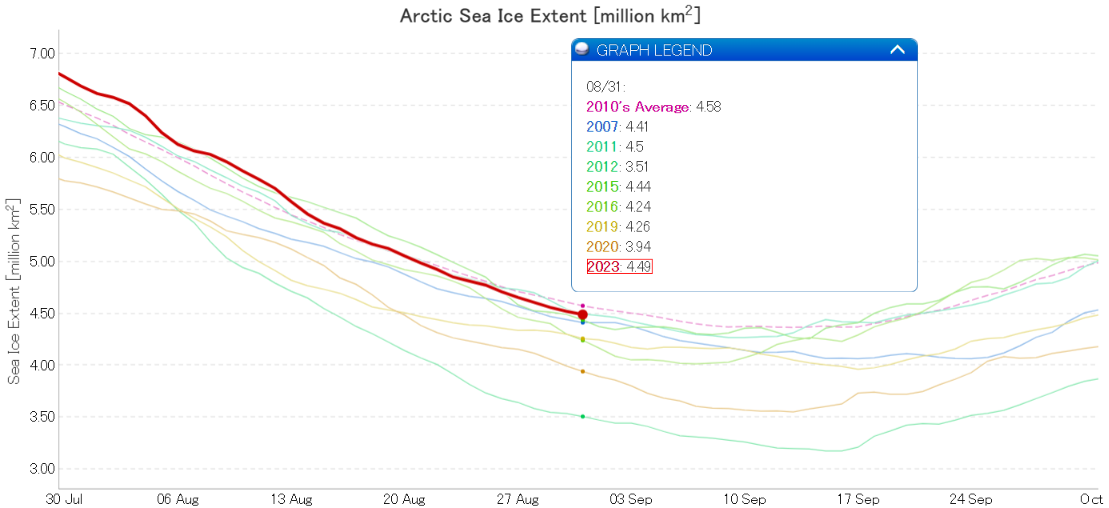
At the end of August JAXA daily extent was 7th lowest for the date, at 4.49 million km² :
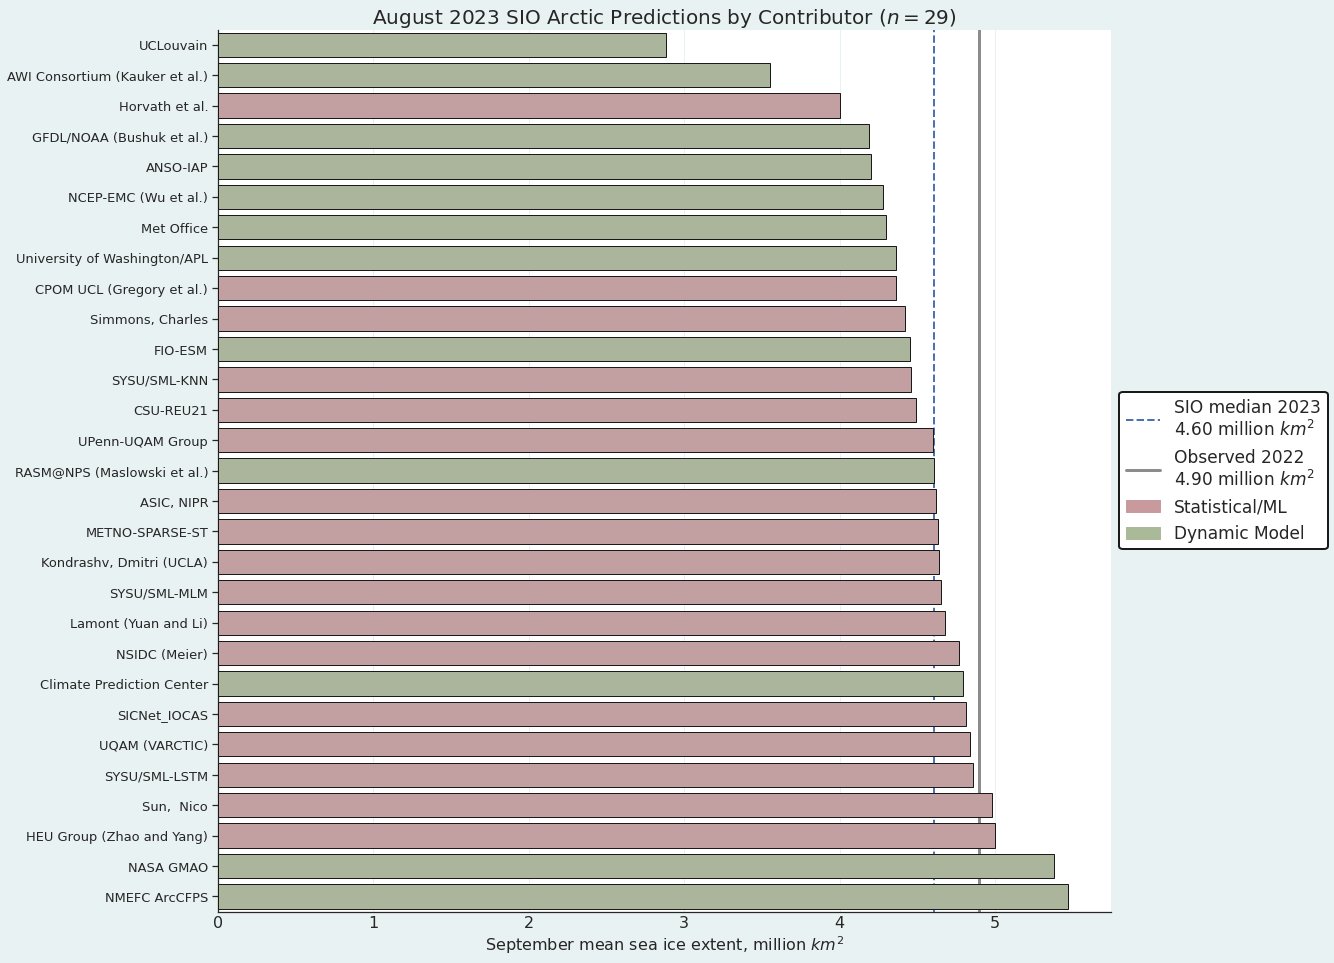
The median prediction of the contributors to the August call by the Sea Ice Prediction Network for the September monthly average extent is 4.6 million km² :
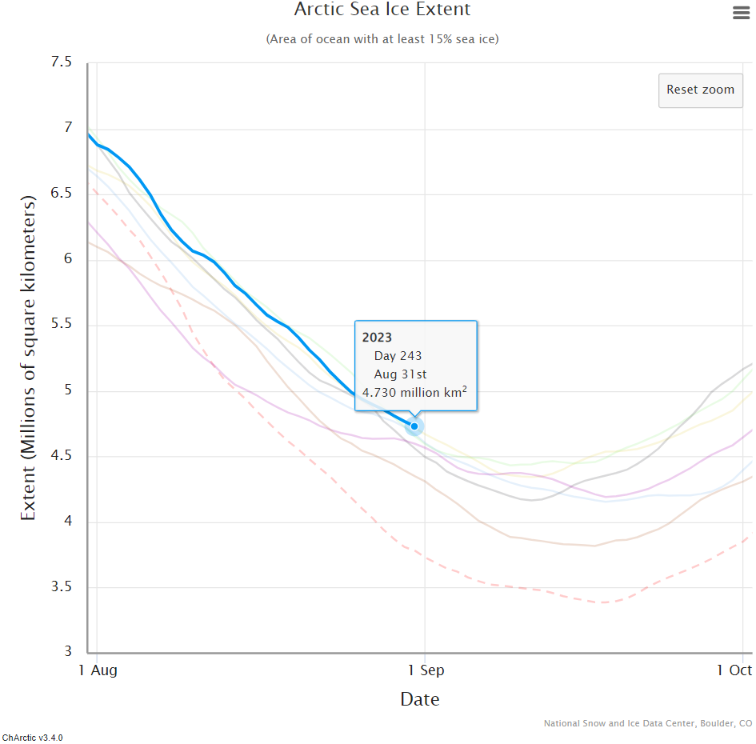
That is of course based on the NSIDC’s extent metric, which currently looks like this:
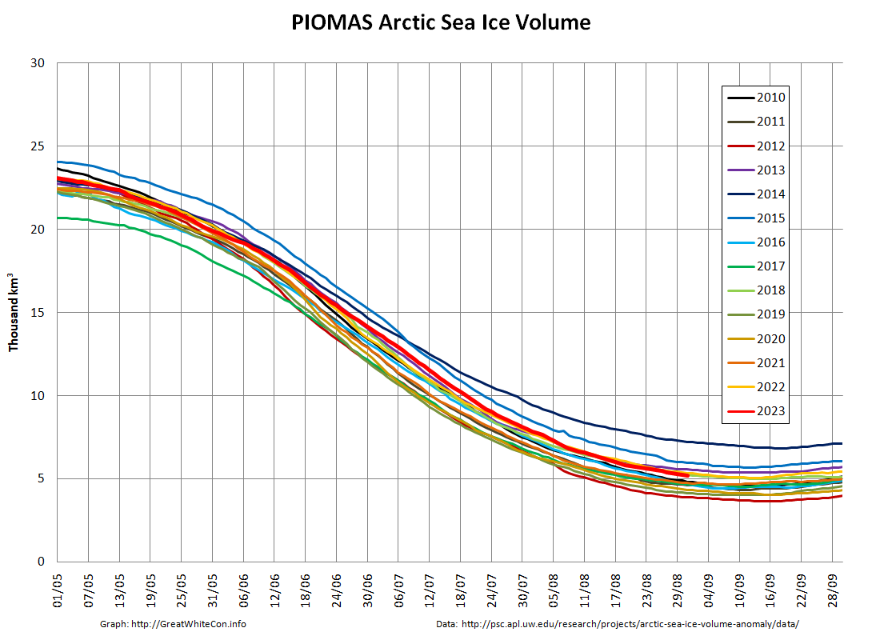
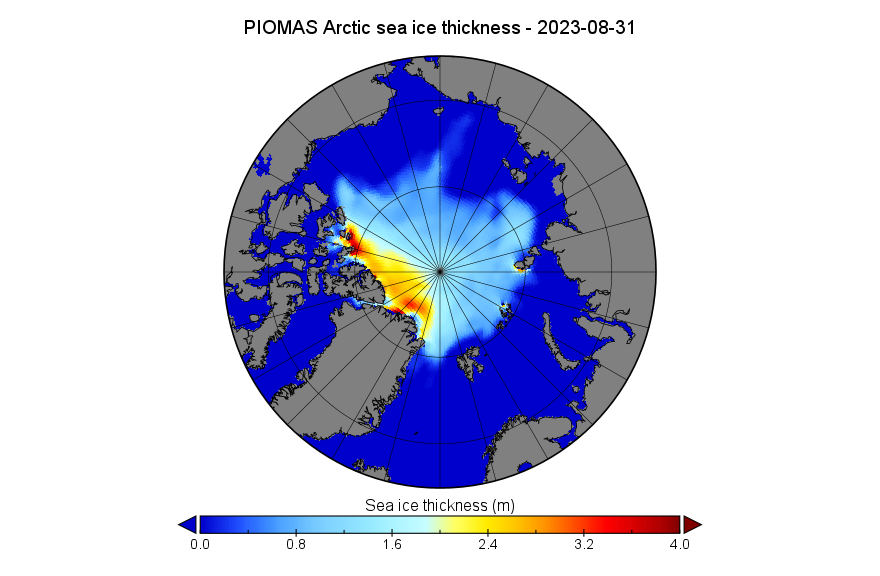
The end of August PIOMAS gridded thickness data has been released. Modelled Arctic sea ice volume on August 31st was 5.18 thousand km³, 9th lowest in the PIOMAS record:
Here too is the modelled Arctic sea ice thickness map for August 31st :
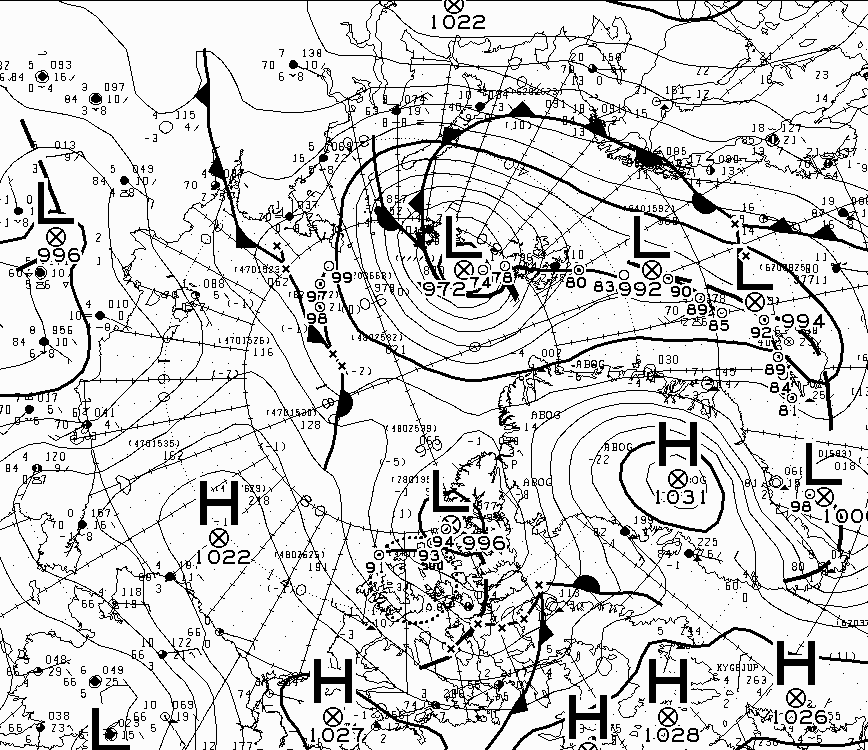
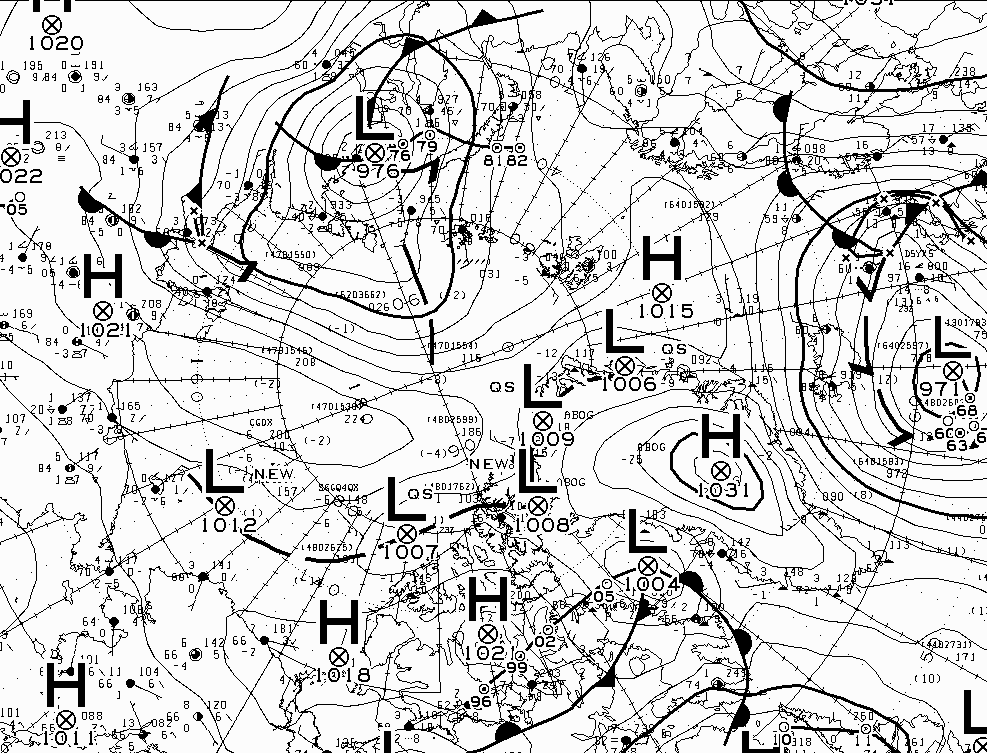
According to the Canadian Meteorological Centre the cyclone on the Atlantic side of the Arctic bottomed out with an MSLP of 972 hPa yesterday:
It will be interesting to see what effect the cyclone has on the area/extent numbers over the next few days.
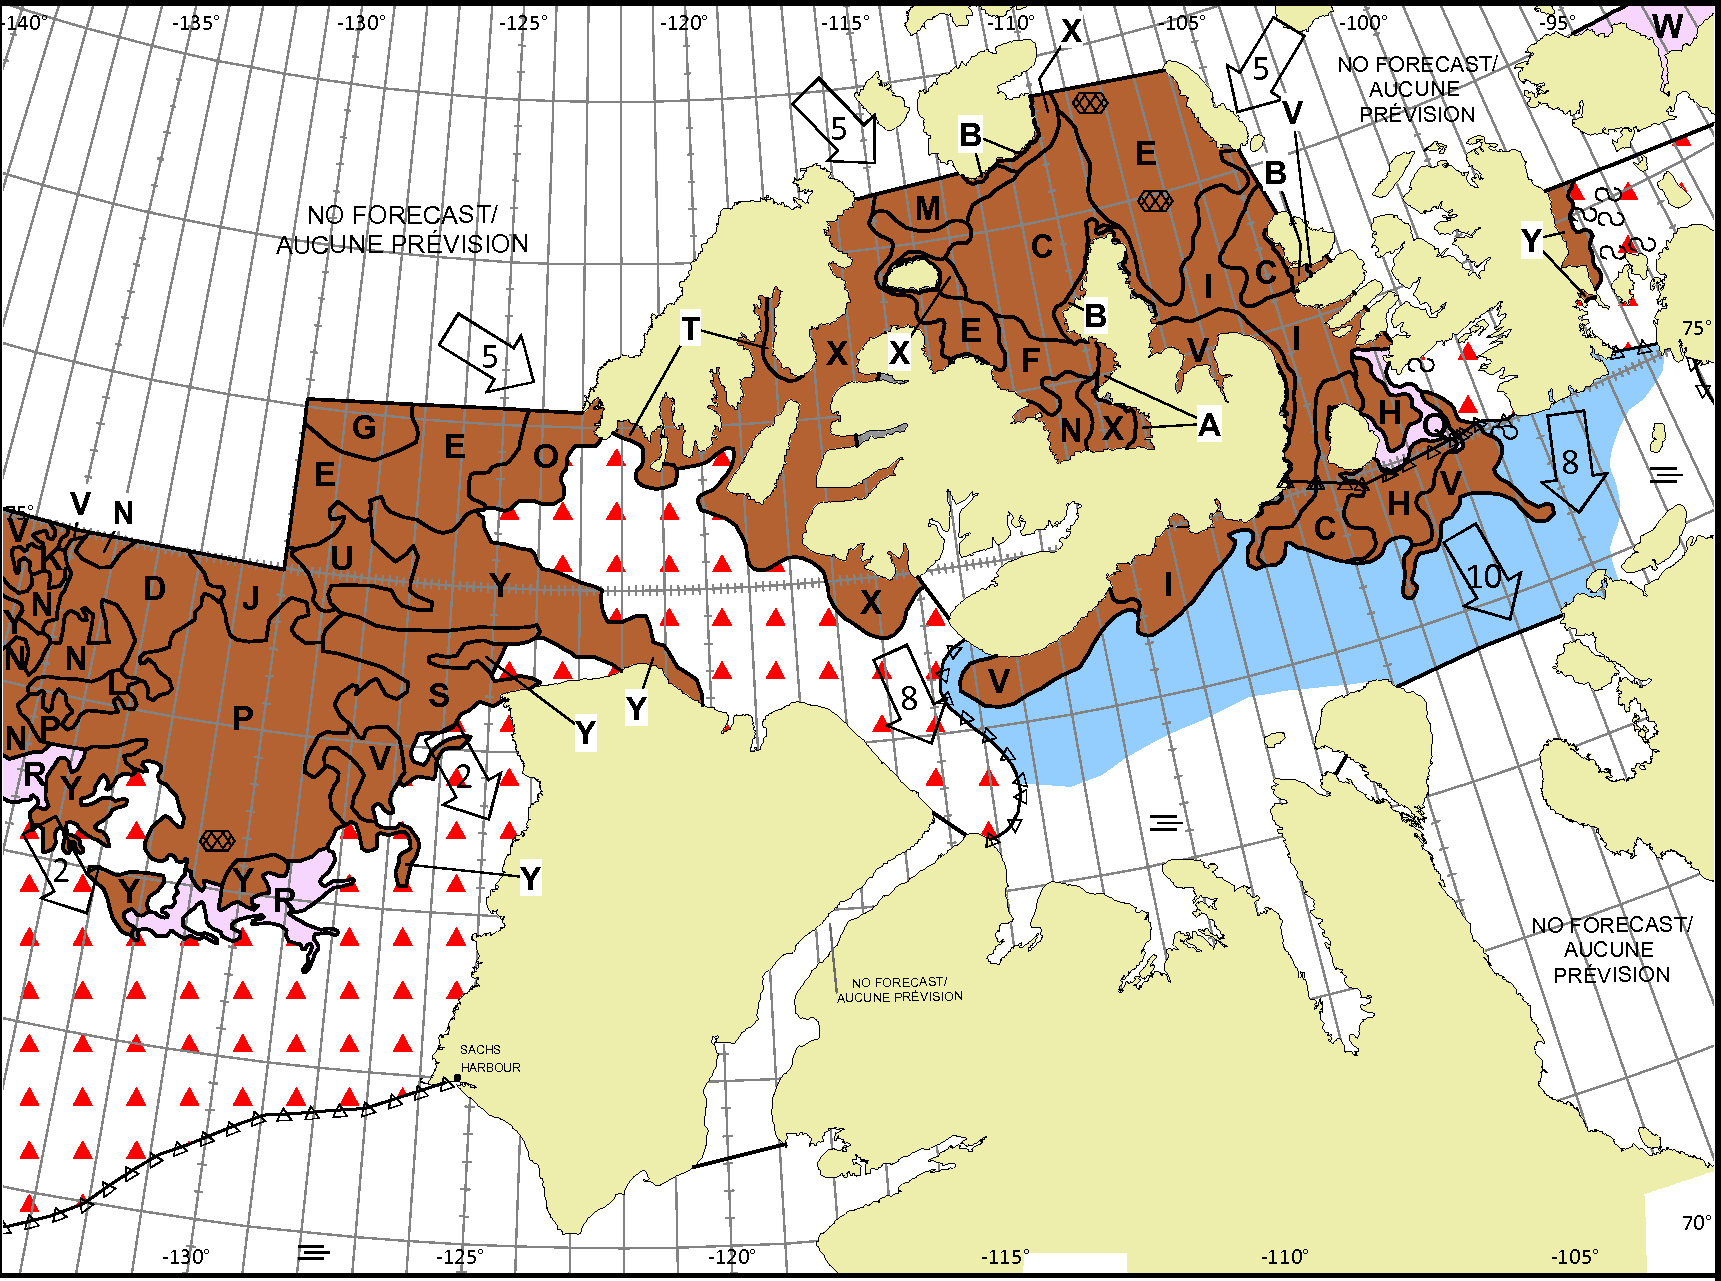
[Edit – September 12th]Areas of new ice (coloured pink) are starting to appear in the nooks and crannies of the Canadian Ice Service charts of the Canadian Arctic Archipelago:
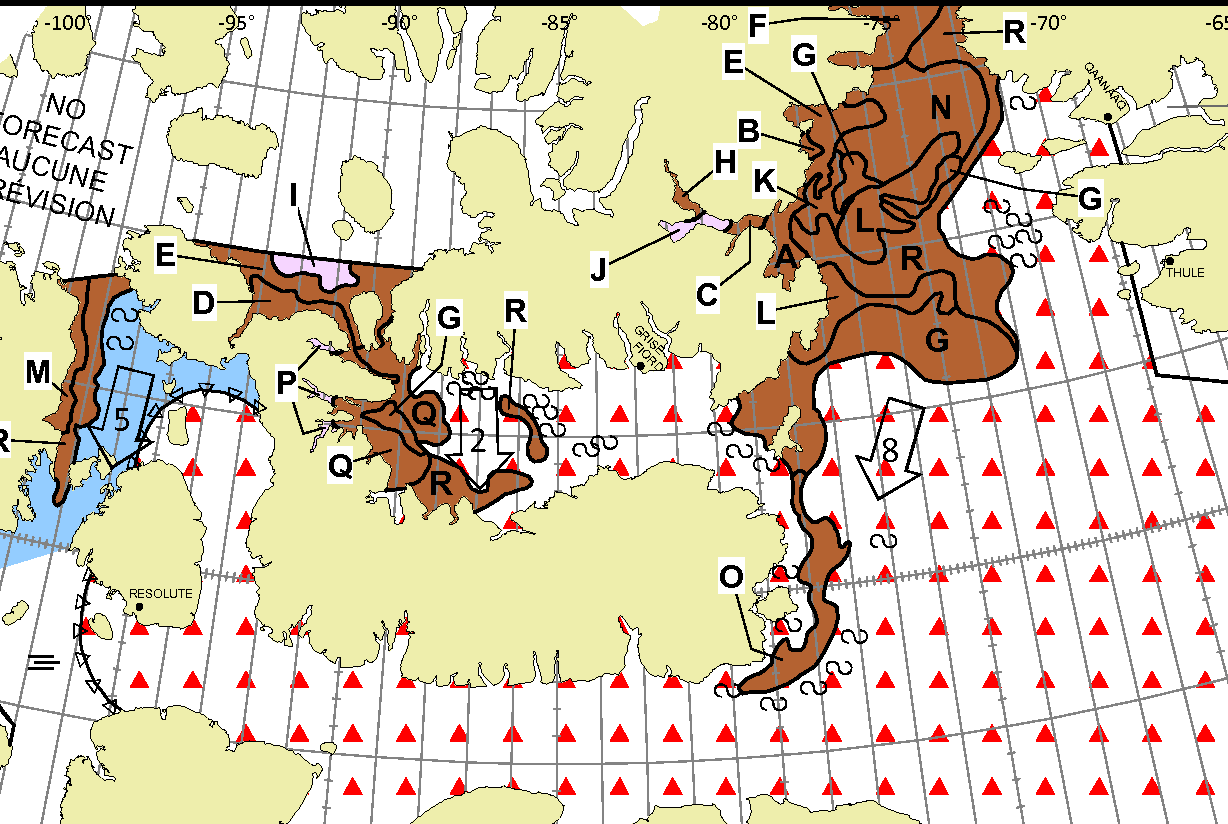
The CIS has suddenly restarted daily coverage of McClure Strait, presumably for the benefit of Le Commandant Charcot. This evening’s chart reveals some new ice forming in the Beaufort Sea:
In other news, the latest Arctic cyclone bottomed out with an MSLP of 976 hPa at 00:00 UTC this morning:
Watch this space!
PIOMAS again confesses that there has been no volume trend for 12 years for August, as it has for the previous months. They keep mentioning the importance of ‘longer term’ data. When do you think they will start talking about/analyzing this current ‘pause’?
There are lots of reasons we can speculate on, I just spotted two graphs posted by Bintho on Arctic sea ice forum, freeform chatter.
One charts the annual Piomas melt, the other the winter refreeze
Funnily enough, both are slowly but steadily rising over the course of the satellite record,
Indeed the refreeze had risen sharply around 2007, no doubt due to more ice free sea in September since then.
I don’t know how to share it here unfortunately
You should be able to download images from the ASIF to your own device, then attach them to a comment here.
These are the ones I assume you’re referring to:
I read somewhere, that there’s a limit to how thick ice can grow before it will insulate the ocean below against further heat loss, 2m I believe. Any thicker ice tends to form where ocean currents tend to compact, or stack the ice against land masses, typically Greenland or the Canadian Arctic.
This might tell us that the gradual increase in summer melt indicated by Piomas will eventually overwhelm the capacity for refreeze in the winter…
Not to mention the rise in ocean temperature.
2m is a figure often bandied about for typical “thermodynamic” thickness at the end of the freezing season, but (needless to say!) things are more complicated. Here’s an extract from Bilello (1961):
Here too is the high Arctic FDD graph for recent years:
Here is the PIOMAS Arctic volume showing no decrease since about 2011.
Hello again Peter,
Please bear in mind that you’re still “on moderation” here, so multiple comments aren’t necessary.
Here’s Taylor’s favourite PSC quote once again:
Here’s the scientific explanation for the umpteenth time:
https://GreatWhiteCon.info/2023/04/facts-about-the-arctic-in-april-2023/#comment-677629
So you need a longer fine series? How about MASIE, it’s been operating since 2006 and has trended about the same since it started. It measures ice area to a 16km2 accuracy. Is that a long enough time series to say that Arctic ice is not shrinking?
Seems to me that Arctic ice closely follows the AMO and will soon start trending up again.
Haven’t we been over this already Peter? More than once?
Please see:
https://GreatWhiteCon.info/2016/02/dmi-masie-and-the-sea-ice-index-an-interview-with-walt-meier/
So for long term trends stick to the NSIDC’s Sea Ice Index. Here yet again is a graph prepared by the NSIDC’s Walt Meier using SII data:
Here once again is a graph of Arctic sea ice age from the NSIDC’s Arctic Sea Ice News:
Assorted people have been saying for years things like “Arctic ice closely follows the AMO and will soon start trending up again”. It hasn’t happened yet!
The analysts of Masie draw the ice edge by hand…
Doesn’t sound like a very scientific method of measuring extent!