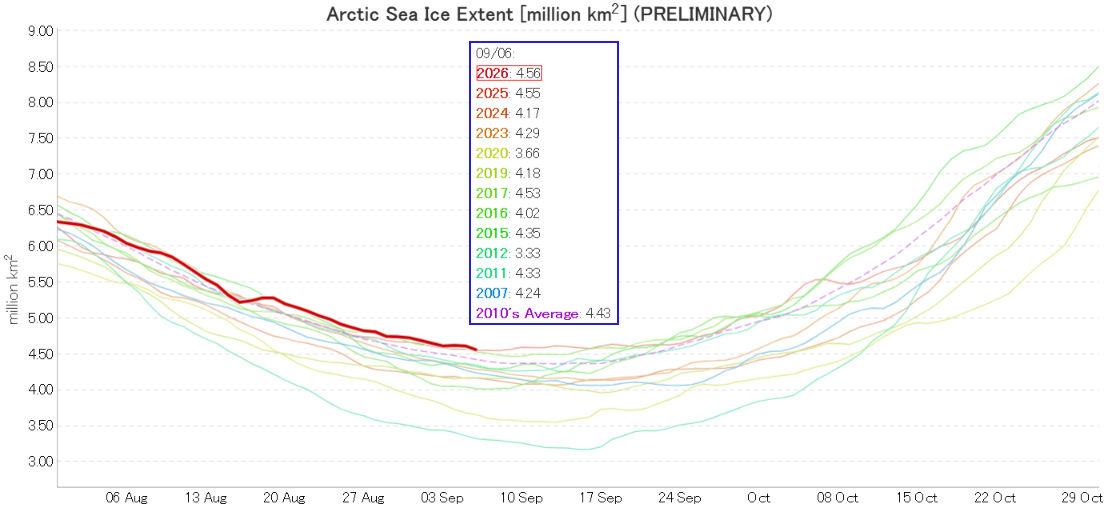
With the 2026 minimum extent rapidly approaching, JAXA/ViSHOP extent is currently 12th lowest for the date in the satellite era:
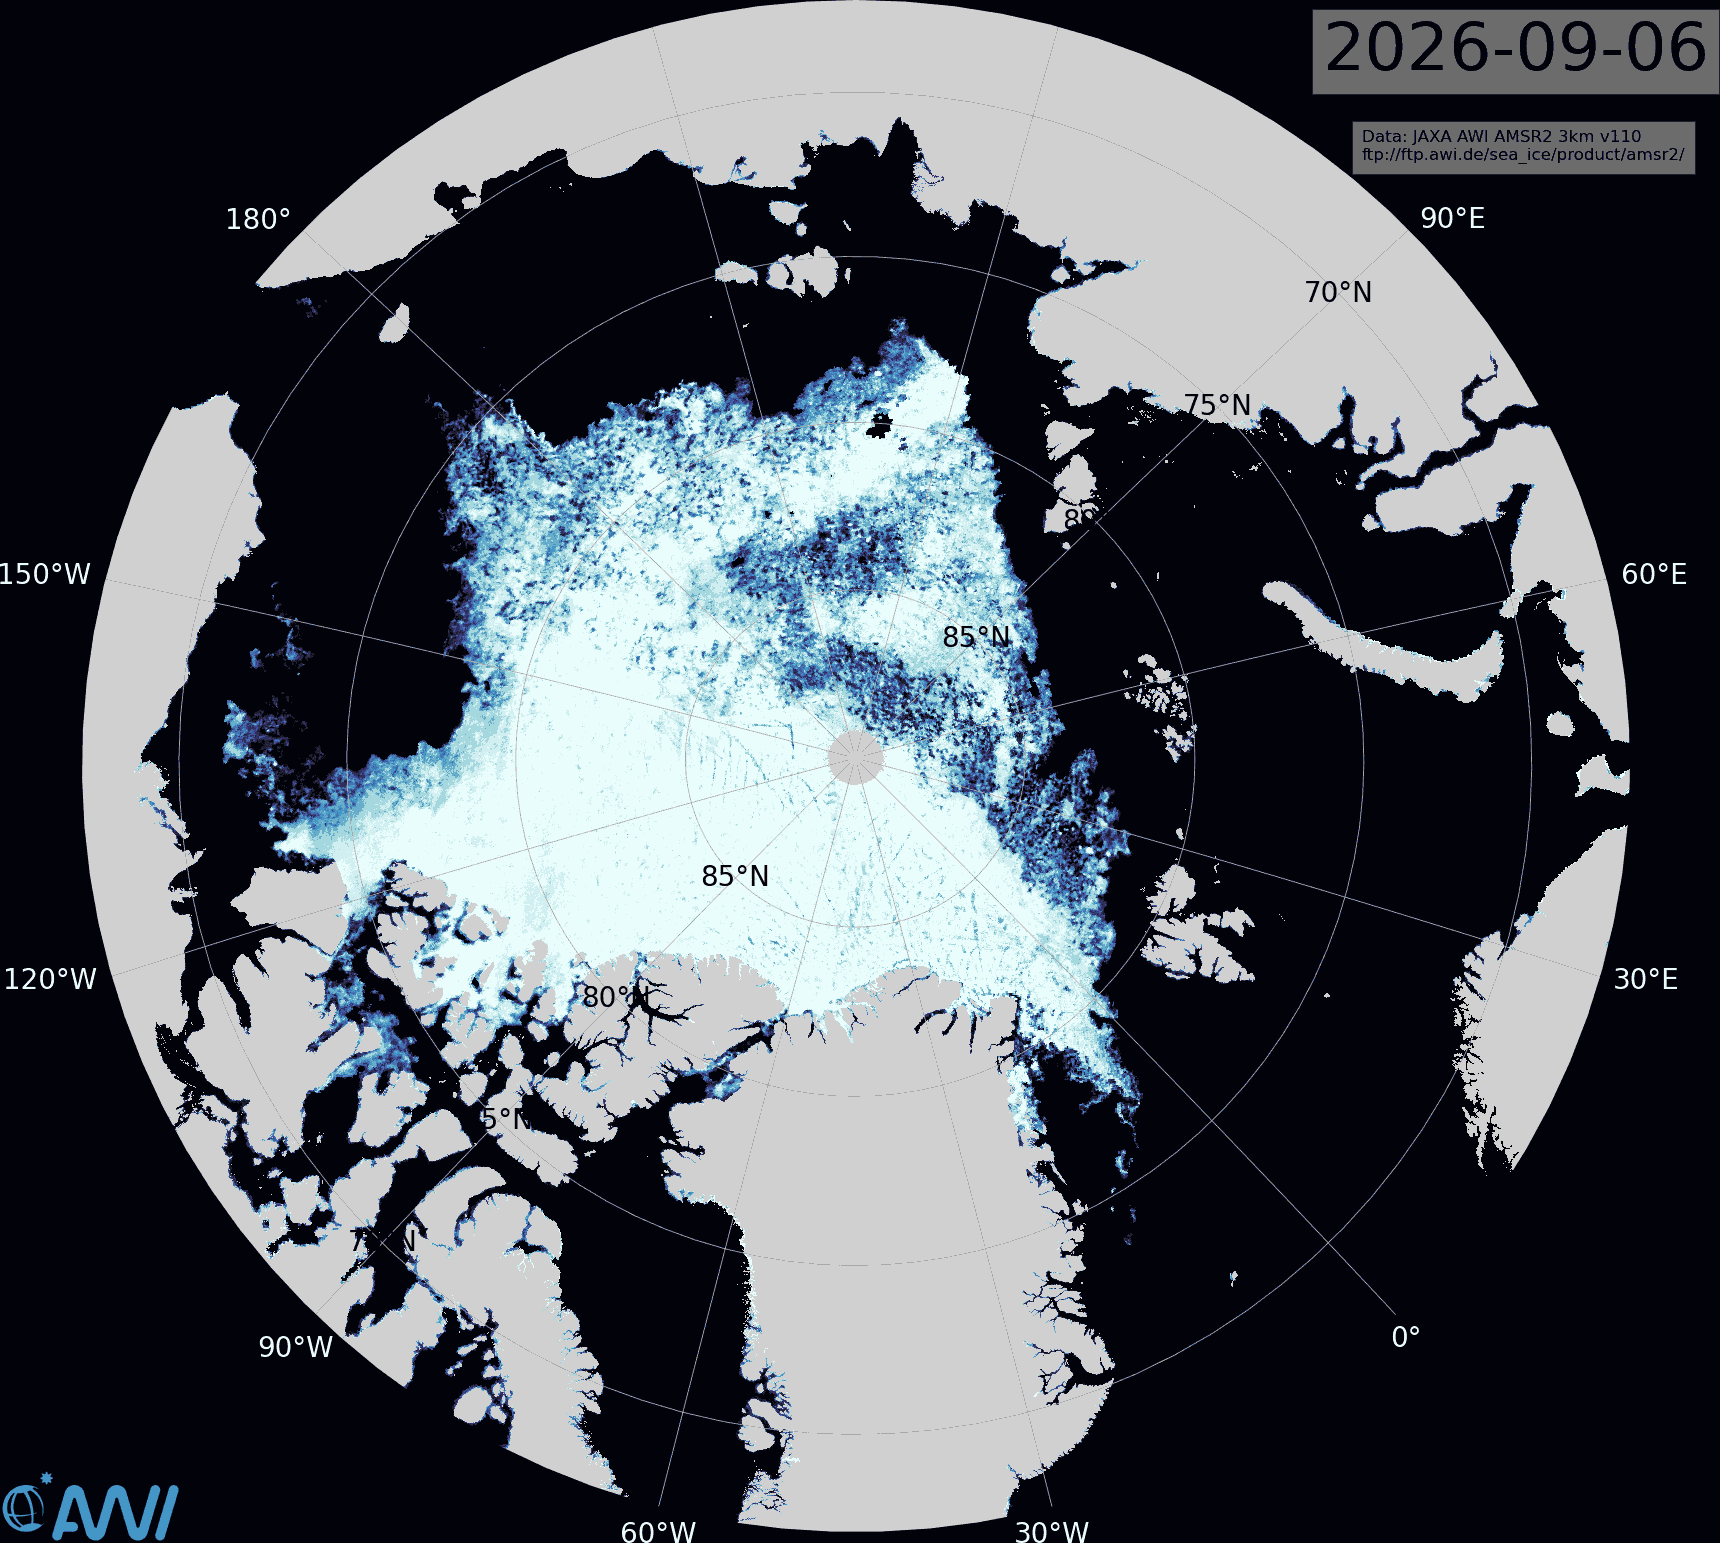
Despite the falling air temperatures, the AWI concentration map is still showing plenty of open water near the North Pole:
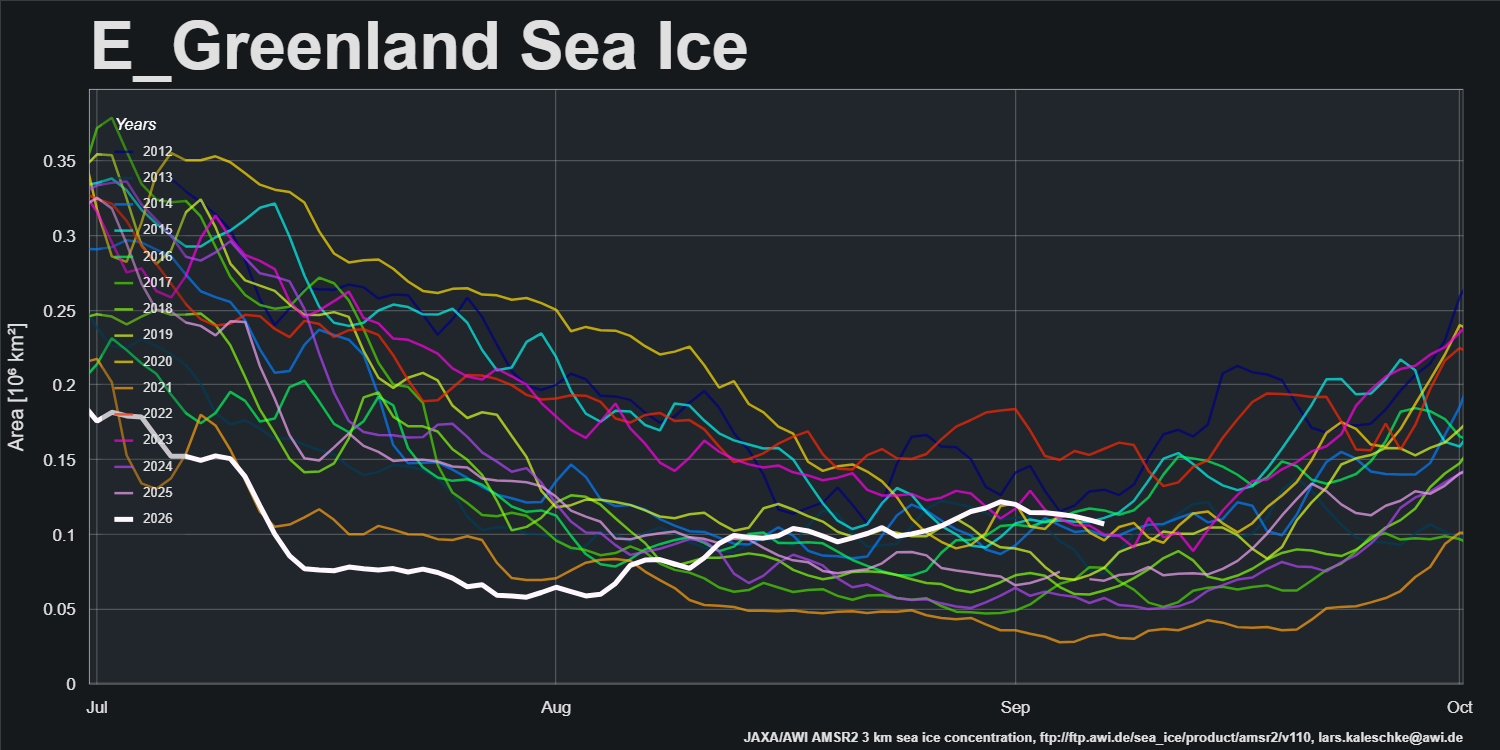
Note also the recent increase in the area of old ice heading for oblivion via the Fram Strait:
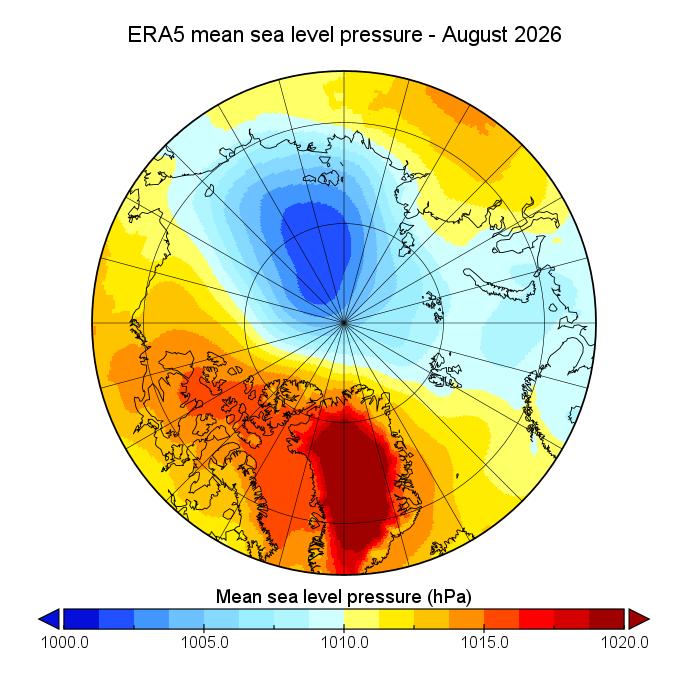
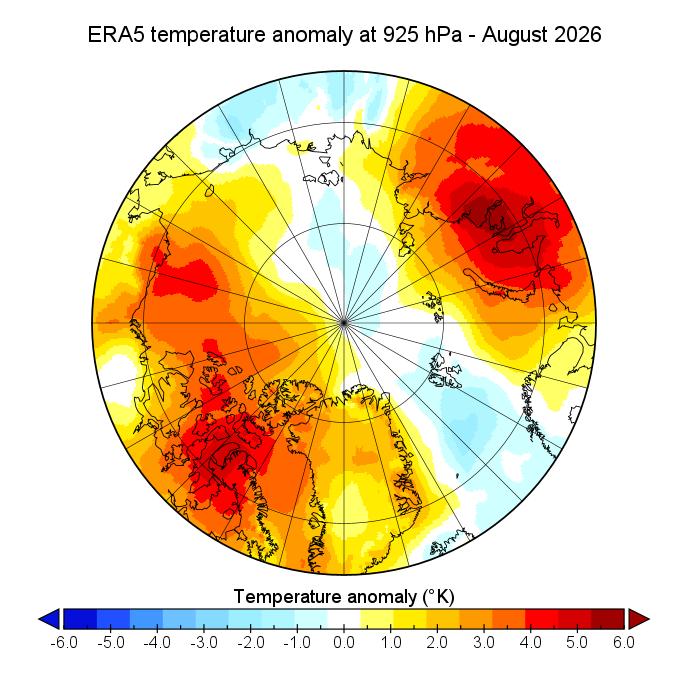
Atmospheric conditions over the Arctic in August were once again dominated by low pressure over the Central Arctic Basin, this time offset from the Pole towards Siberia. Temperatures at the 925 hPa pressure level were anomalously high across most of the Arctic, in particular over the Kara Sea and the Canadian Arctic Archipelago:
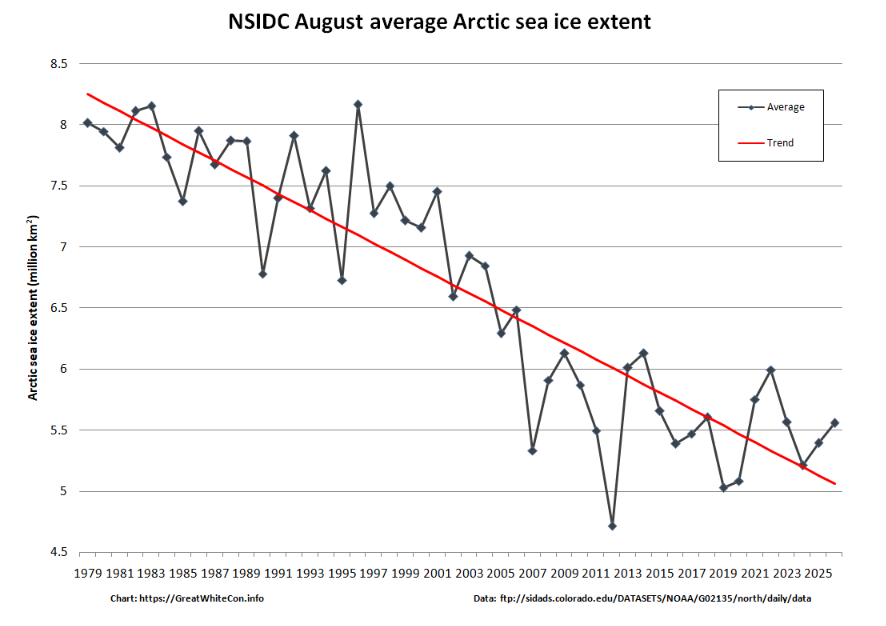
The NSIDC monthly average extent graph for August shows 2026 well above the linear trend line, and 10th lowest overall:
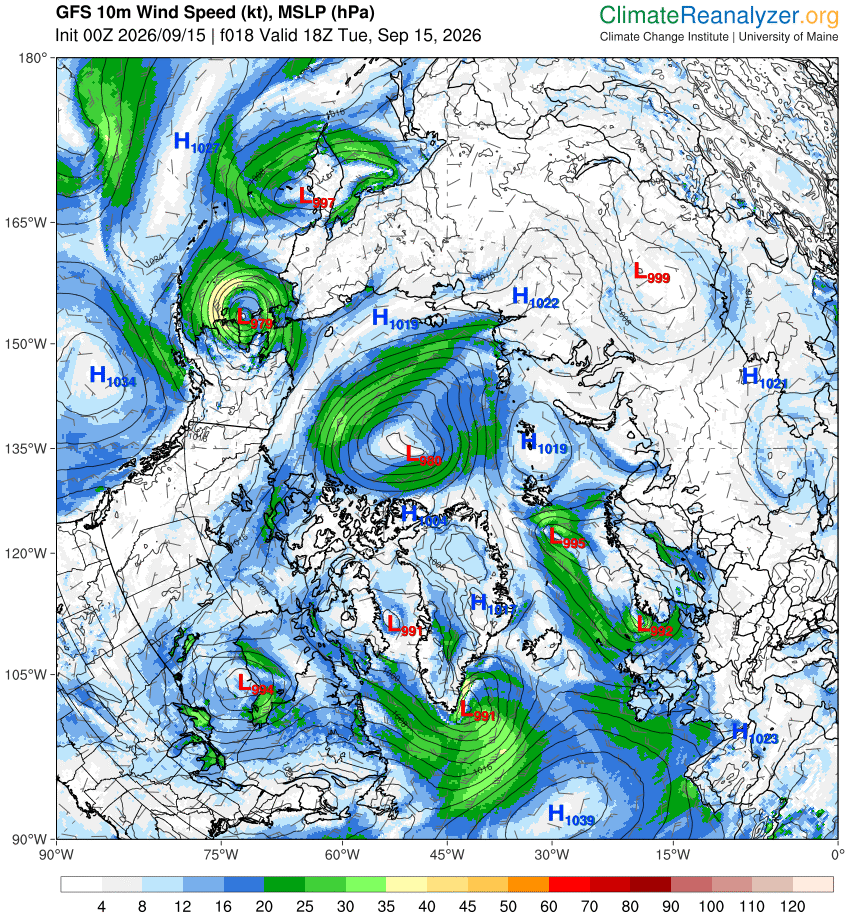
A slight uptick in NSIDC extent yesterday has been followed by an uptick in JAXA extent today. Whilst it is possible that the 2026 minimum has already been reached there is a large fly in the Arctic ointment. The latest central Arctic cyclone is forecast by GFS to bottom out at 980 hPa later today:
The (extremely!) provisional numbers are 4.598 million km² on September 12th for the NSIDC 5 day average and 4.459 million km² on September 13th for the JAXA “provisional” extent.
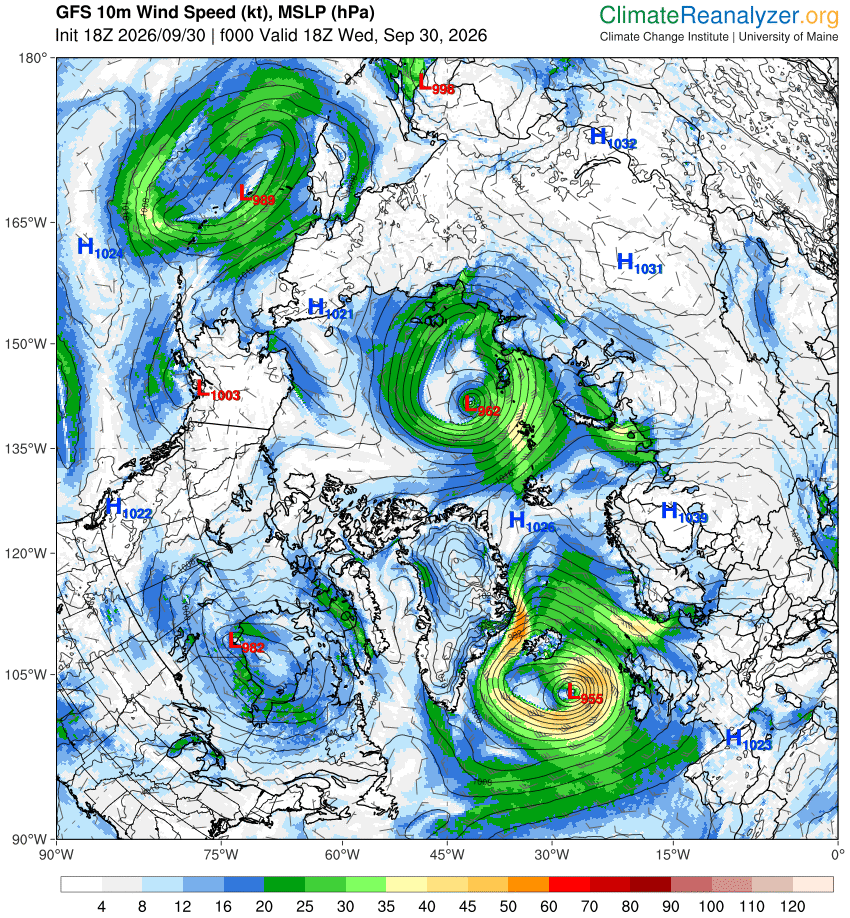
[Update – September 30th]According to GFS the latest in a long series of Arctic cyclones has bottomed out with a central mean sea level pressure of 962 hPa:
The conversation continues over on the October open thread.
I’ve just discovered that the NSIDC’s Sea Ice Today monthly analysis reports have resumed, although they haven’t included the August ERA5 data in their report. Instead they show these May to July quarterly mean maps.
JAXA extent is down to 4,464k km. Not sure if that’s slightly below 2018s minimum, but if so it would be the 10th lowest extent minimum in the satellite record.
Ore impressively NSIDC area looks to be 4th lowest if I’m not mistaken
JAXA extent hasn’t got 10th lowest locked in yet, albeit by a proverbial whisker.
2018 minimum was 4.457k
4,458k this morning…a whisker indeed!!
Jim,
I’m pretty reaxed. For once.
I’m sure you caught the memo from the UN.
There’s no way we can stop warming. We’d like to.
But there’s just no humanly way we can stop what is happening.
Actually I hadn’t previously read the memo. I assume this is the one you’re referring to?
https://www.unep.org/resources/limiting-overshoot-navigating-exceedance
In other news: Heller is being silly about the North Pole.
https://twitter.com/icegoingsouth/status/2102187400940199940
Tell me about it GS:
Please tell Tony too!
Jim,
whatever his problems are, our problems are PIOMAS’ problems. And don’t just assume it’s down to their recurring choice of representation, as the problem of UW’s loss of interest in sea ice matters precedes the Stable Genius era.
As soon as CryoSat enters the room again in a couple weeks, I shall try and have AI root around the UW’s utter disregard anything ice, and reconstruct the would-be PIOMAS-style ledger. Preferably in such a way that we can get ‘volume from daily extent’ next year.
I used to do this myself 12-13 years ago, but now it’s the Super Whopper Intelligence’s turn to get sweaty!
Jim,
your embedded tweet and blockage by His Perplexity yet again triggered my latest conversation with AI, specifically about applying your great writer George Orwell as a manual for flipping the term ‘Tipping Points’ into something positive & hopeful (the opposite of its legacy sense):
Shock horror!! Still no ice free summer! 10 years on and Wadhams is still wrong.
Matthew,
if you’re truly shocked and in a state of horror, that’s a serious condition, and you should treat it as such and seek appropriate medical help.
I may however be able to help, even though not formally a health care professional. If you assumed one particular citizen’s assumption in itself would remove the ice 100% in the Arctic, this may be a good time to enter into a learning process or scientific research: It turns out sea ice melts or scales back in volume over time due to warming of the ocean and atmosphere, not following tweets by your favourite individual human persons.
This is due to a number of things, among them the ability of ice to meaningfully access digital human Internet communication services, like Twitter and X.
A fair mistake, but knowing more about the system at hand will at least save you from emotional health effects like shock and horror.
Very well articulated. I appreciate your sentiment. However, it is not needed.
At over 1.5m km² more ice extent than 14 years ago I’m sure my “shock and horror” will pass.
So you’ll finally commit to a voluntary learning process?!
Excellent, Matthew
My life & days have not been in vain.
At exactly the same day Antarctica’s sea ice extent has hit a record low incidentally.
Combined Arctic and Antarctica sea ice trends are down, such that the lowest 8-9 years happened in the last 10 years,
I note this trend seems to hold for every month of the year
I know, eight!
The Arctic is down a couple places, but Antarctica has been lowest on record for, like, 4 days. 5 days at 2nd lowes before that.
Right, not 8.
I wouldn’t worry about Antarctica. The highest recorded sea ice extent was in 2014. Minima quite consistent throughout.
Now that was a meaningless word salad worthy of Kamala Harris.
Hi Jim,
The September 2026 Arctic sea ice extent trend since 2007 is now slightly positive. Washington university identified 2007 as a regime change point, so there should be 2 linear trends, one from 1979 to 2007;and another from 2007 to present.
Or better still, a running time weighted trend of about 2 years.
Hi, Peter!
Please prove by scientific peer-reviewed papers how including thickness/volume may harm our understanding of sea ice dynamics, as well as why you believe the Universe started in 2007.
If 2007 was the first year in existence, why’s it called 2007 for a start? Wouldn’t Year 1 or Year 0 be a better name, at least if you want to shut up skeptics to your ideology/cult narrative?
Any trend is just an artifact of the start date.
If hypothetically Arctic ice extent recording had started 1000 years ago during the MWP the full trend would show a dramatic increase.
If recording had started during the height of the LIA in 1700, it would show a dramatic decrease.
If recording had started in 1940 it would show no overall trend.
For most of the last 500,000 years our planet has been in ice ages and warm weather like tiday is rare. We should be celebrating this weather, not demonising it.
“If hypothetically Arctic ice extent recording had started 1000 years ago” here’s the trend, courtesy of Kinnard et al. (2011):
What was the population of New York, London, Dhaka etc. “for most of the last 500,000 years”?
And here is the entire MASIE record showing no trend since 2006.
At the risk of (repeating Walt)^n:
https://GreatWhiteCon.info/2016/02/dmi-masie-and-the-sea-ice-index-an-interview-with-walt-meier/
MASIE is an embarrassment to NSIDC who fund it and store the data because it shows unambiguously throughout its entire record that Arctic ice extent hasn’t trended since 2006.
NSIDC do not include a time series trend of MASIE anywhere on their website and you have to download the data yourself to trend it.
They also do not show a graph of the full SII trend.
Exeter university says no trend since 2005 and Washington university says there was a regime change in 2007.
Arctic ice extent correlates well with the AMOC and history shows us that the cooling phase will return within 5-10 years.
Cheers Jim
Do you not understand plain English Peter?
“NSIDC do not include a time series trend of MASIE” because “trend estimates will be more accurate in the passive microwave data than in MASIE”