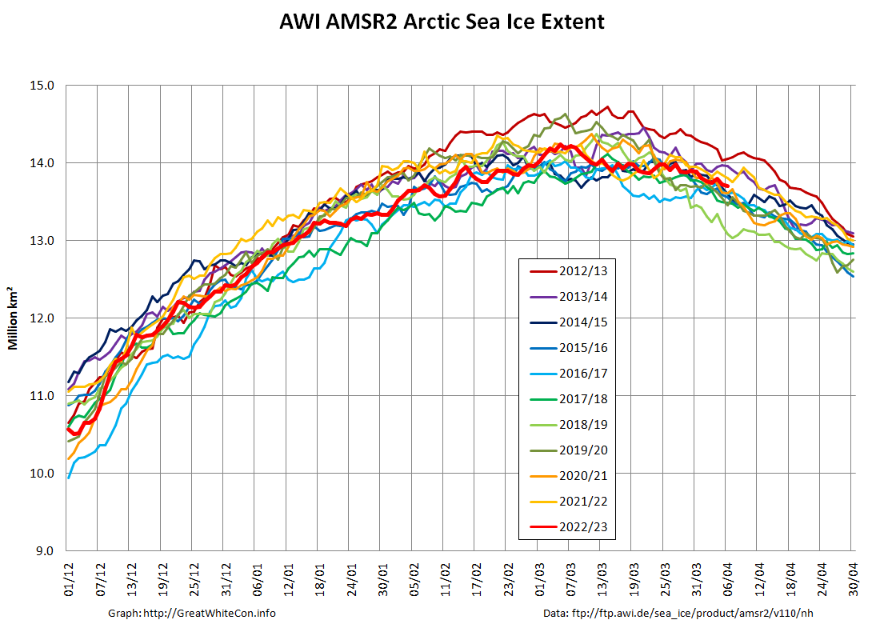
Arctic sea ice extent in early April is singularly unexceptional. Here’s the AWI AMSR2 version:
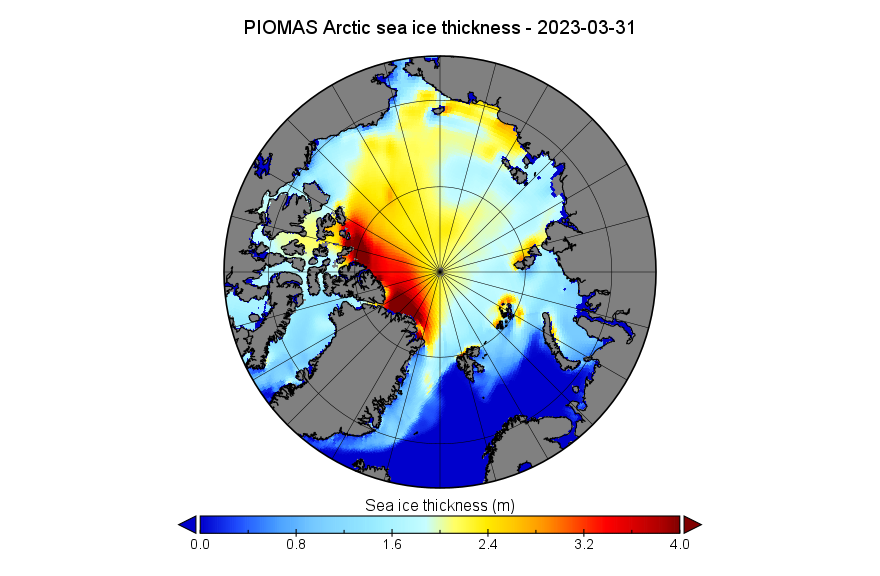
Things start to become more interesting when looking at the third dimension. Here’s the PIOMAS gridded thickness map for March 31st:
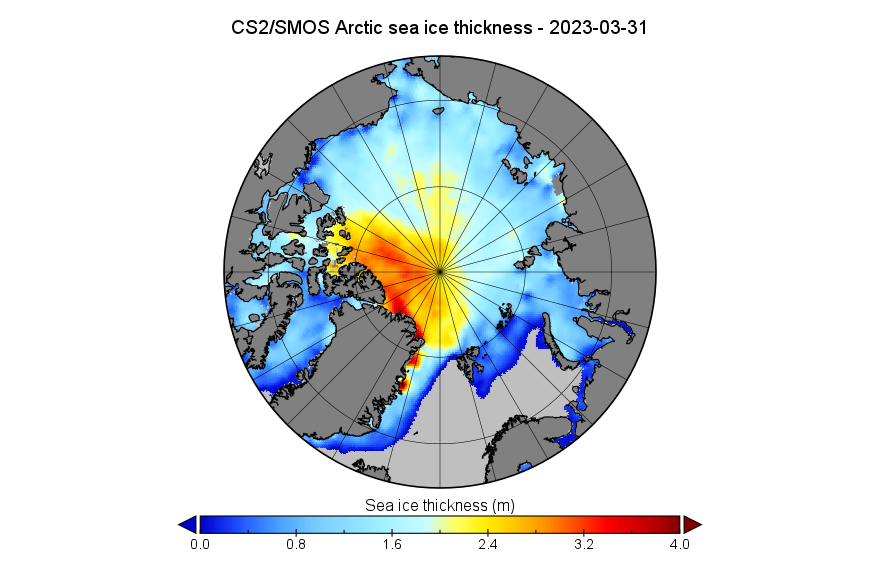
and the CryoSat-2/SMOS map for the same date:
Note the differing distribution of thick ice north of Greenland and the Canadian Arctic Archipelago between the two maps. Note also the area of thinner ice along the coast of the Beaufort Sea visible on the CS2/SMOS map.
By way of explanation for that phenomenon see the March sea level pressure map from the latest edition of the NSIDC’s Arctic Sea Ice News:
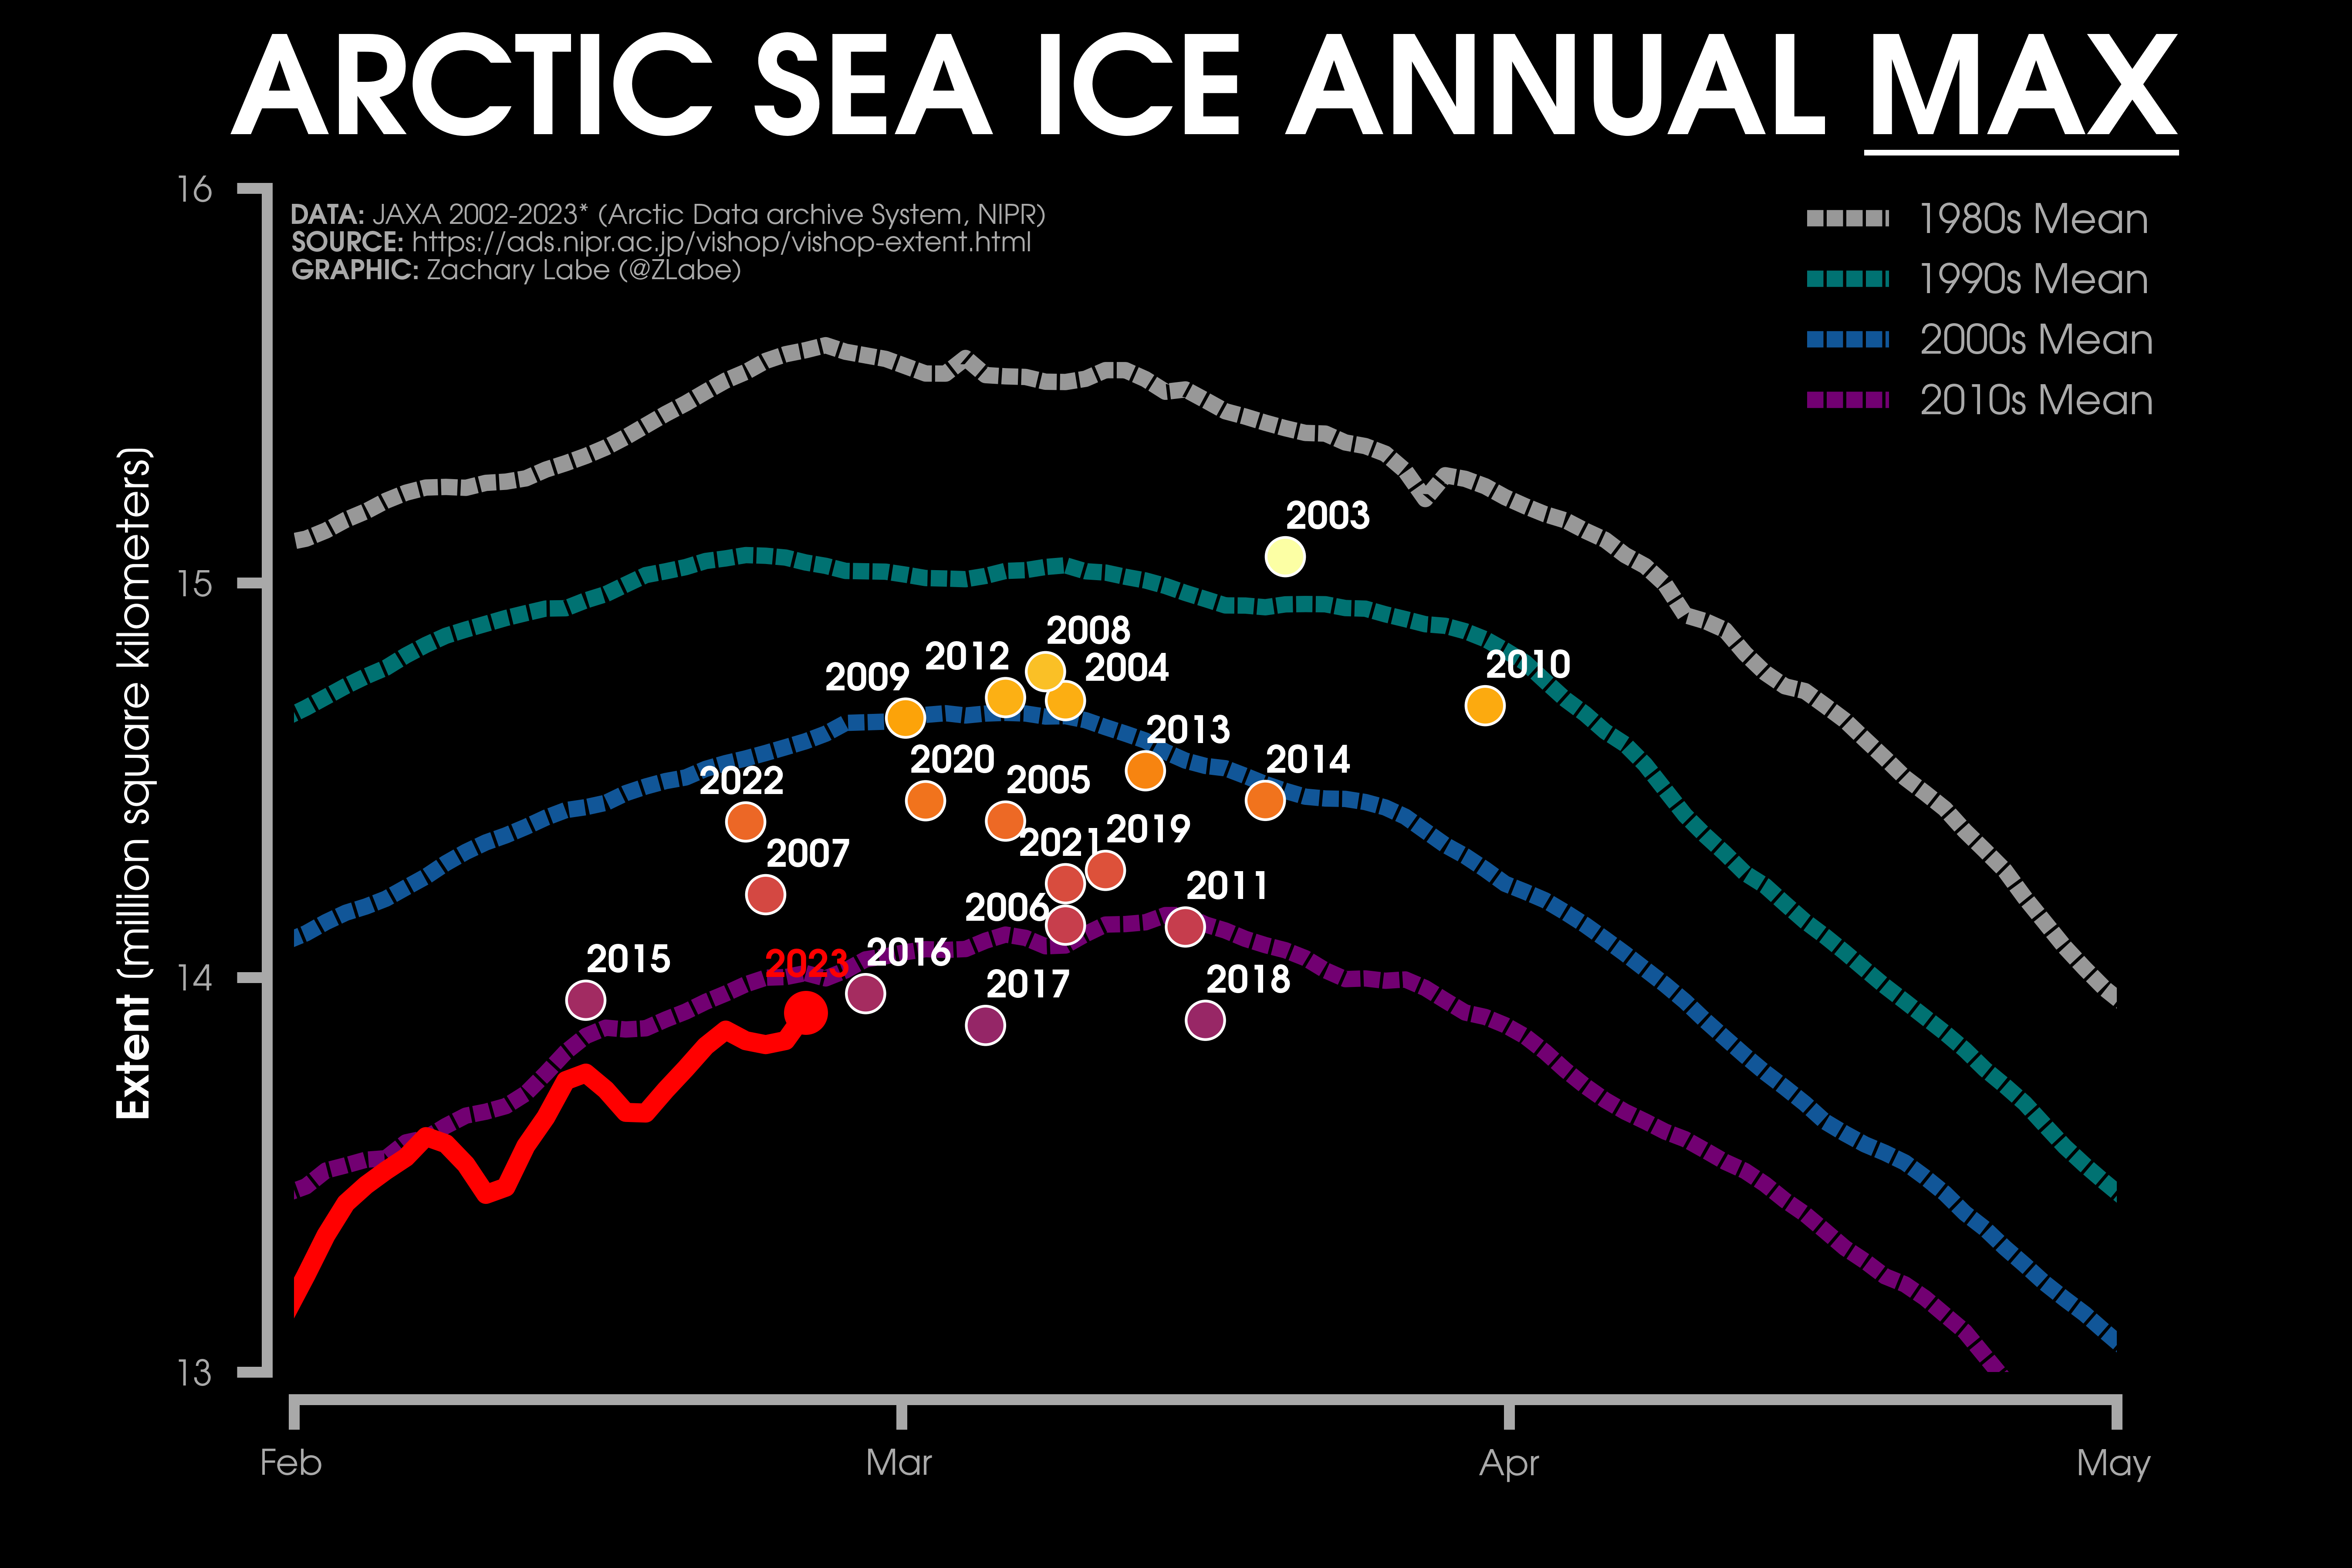
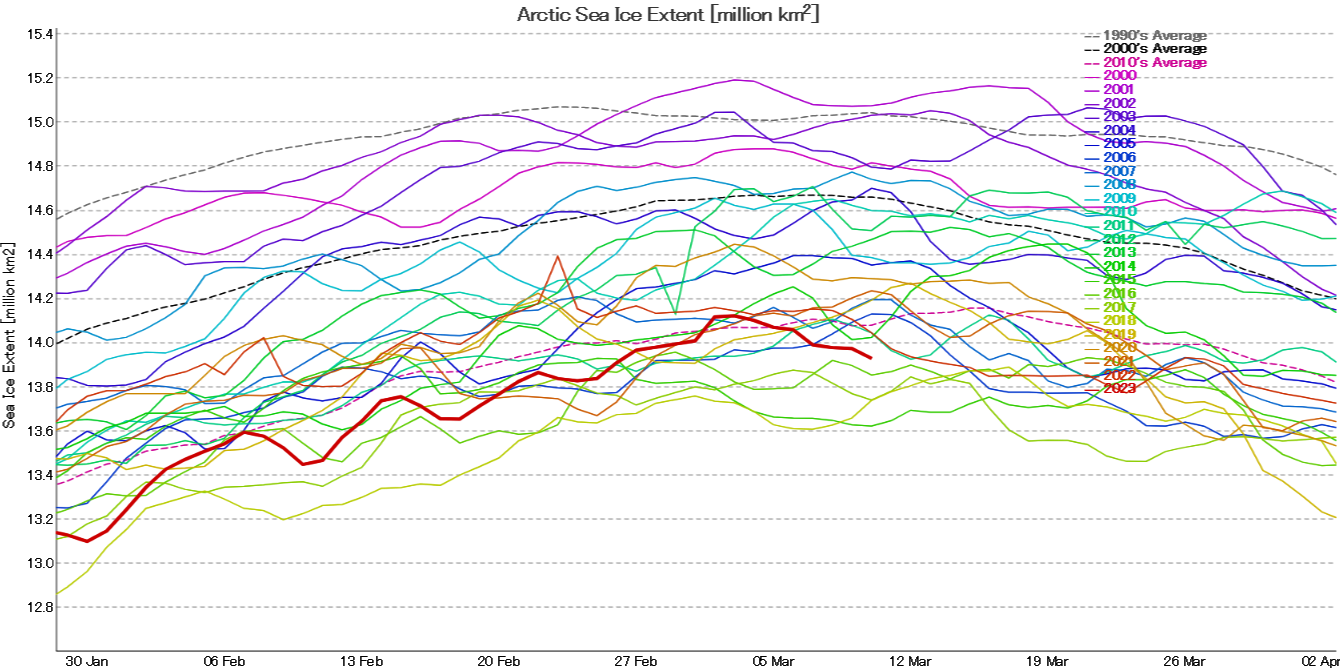
Zack’s graph displays the JAXA/ViSHOP version of Arctic extent, so here too is JAXA’s own graph of the current sea ice extent:
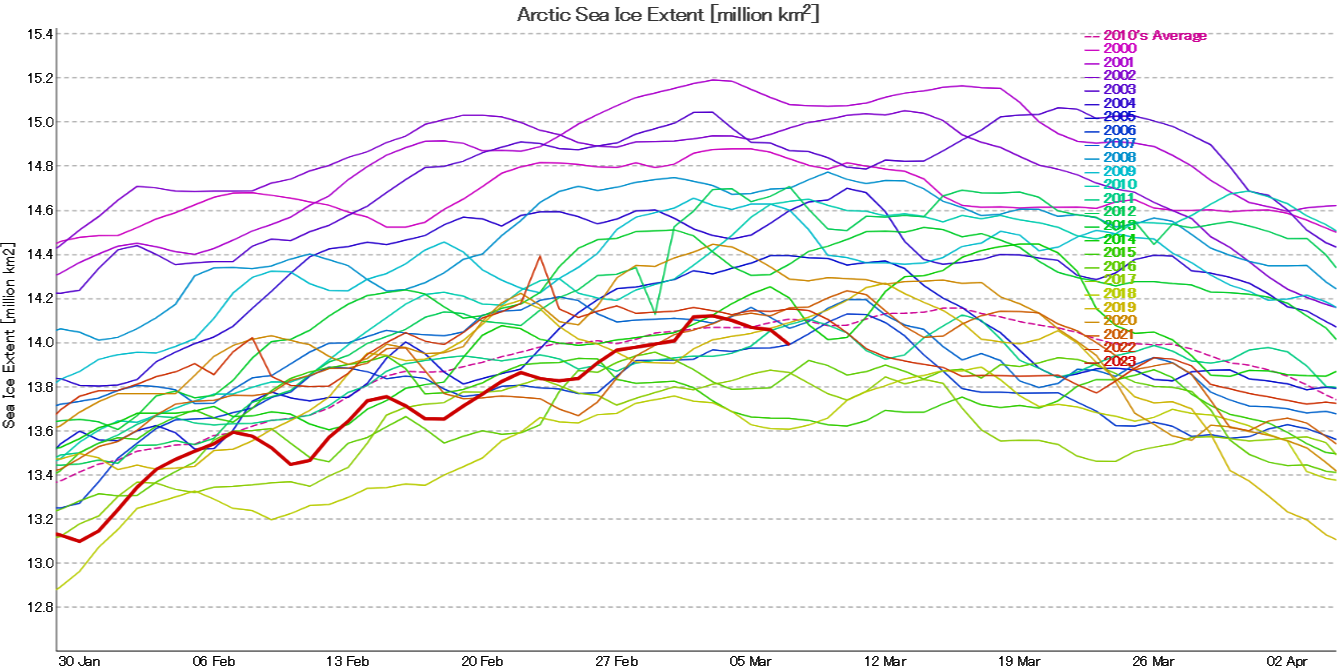
It doesn’t look as though the 2023 maximum has been achieved yet, but extent on March 1st was 14.01 million km². That is evidently not going to be the lowest in the satellite era!
[Edit – March 8th]
As Tom has already mentioned below, JAXA extent has declined significantly since the (so far!) peak extent of 14.12 million km² on both the 2nd and 3rd of March:
It’s too soon to be certain of course, but we certainly now have a good candidate for the 2023 maximum JAXA extent.
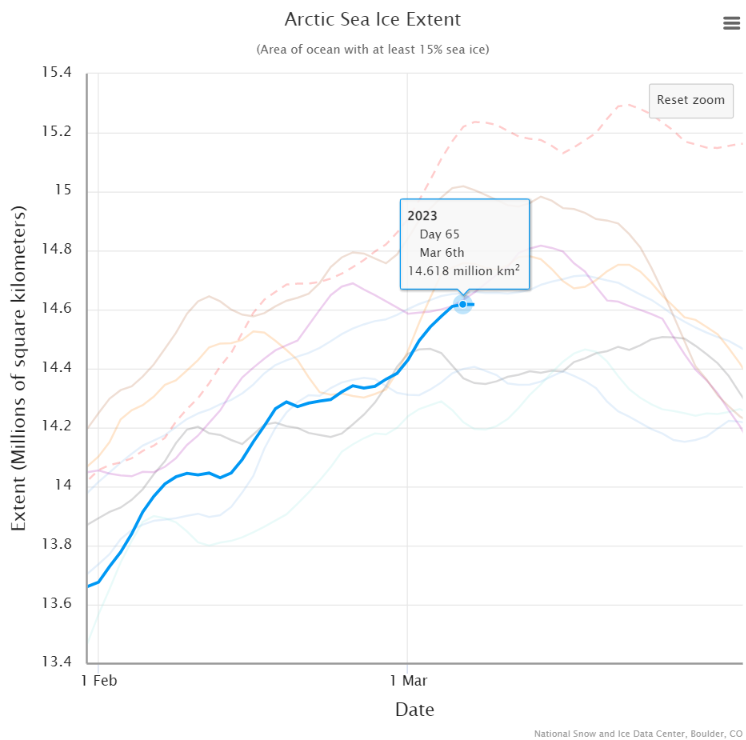
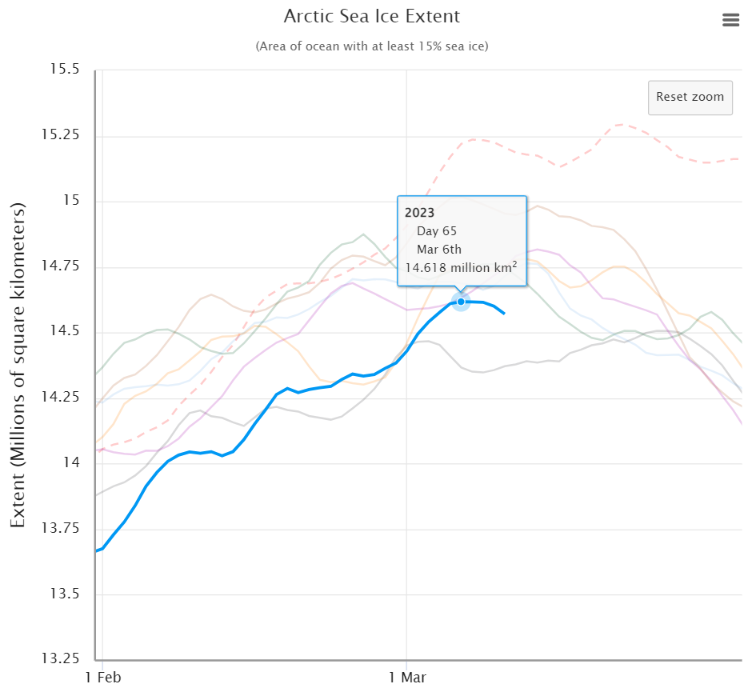
NSIDC 5 day averaged extent is still increasing, but let’s see what this afternoon’s update (UTC) reveals…
Which is a decrease of 0.001 million km² from March 6th, leaving a current NSIDC maximum extent of 14.62 million km²!
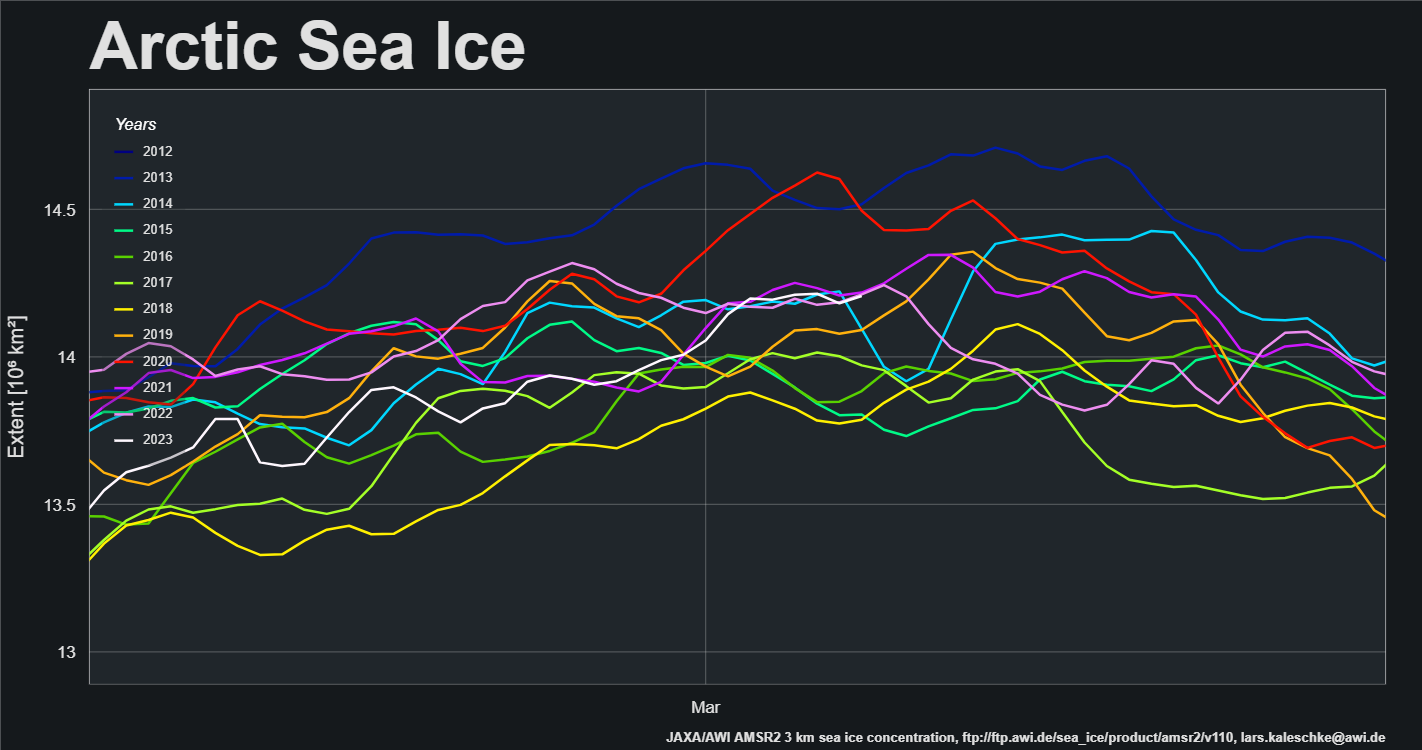
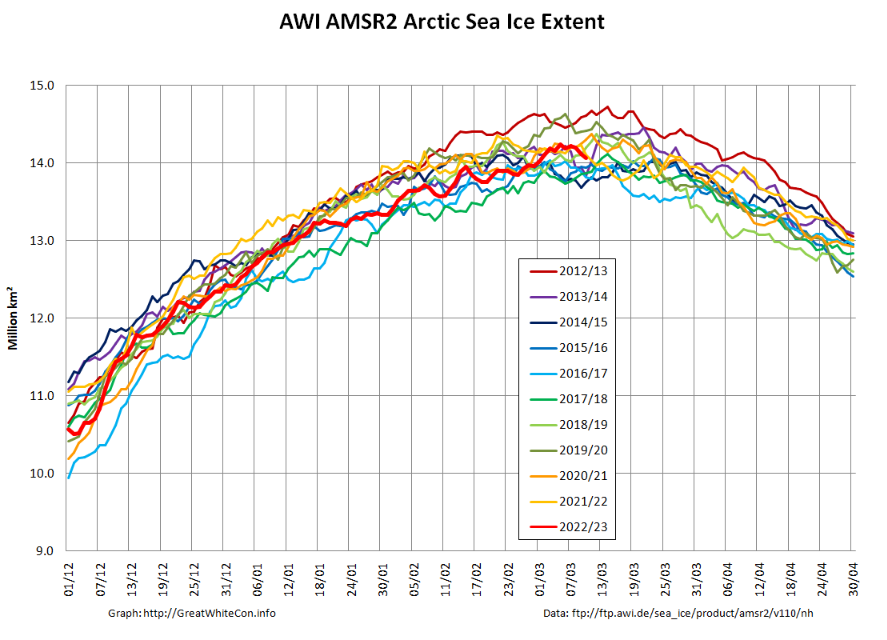
Finally, for the moment at least, AWI’s “high resolution” AMSR2 extent looks a lot less convincing than JAXA’s:
[Edit – March 11th]
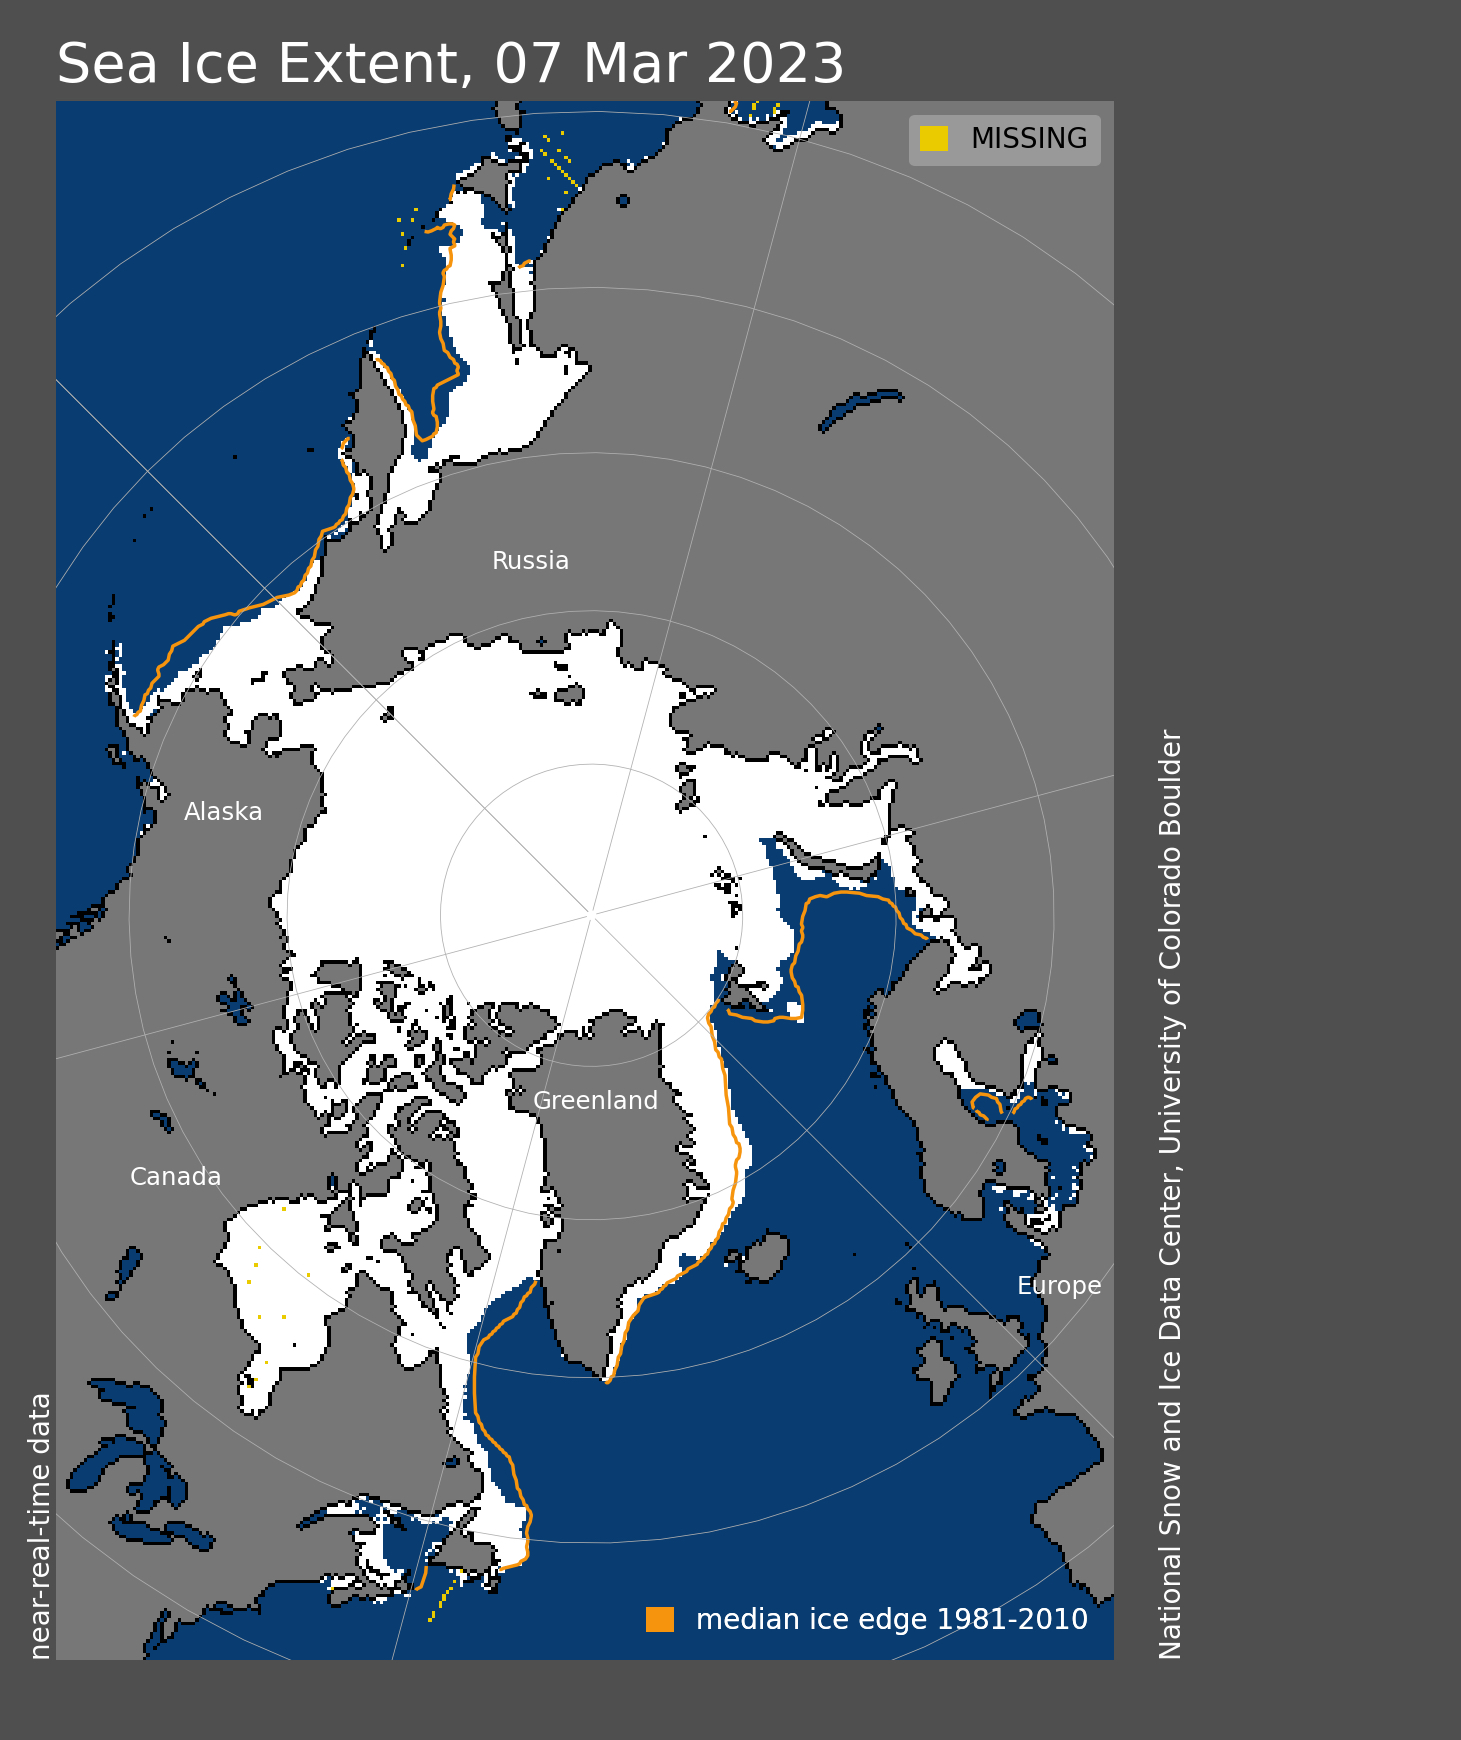
NSIDC Arctic sea ice extent took a tumble yesterday, so with only mild trepidation I’m calling the 2023 maximum extent. In the case of the NSIDC’s 5 day average metric that’s still a rounded up 14.62 million km² on March 6th:
The JAXA/ViSHOP maximum extent remains at 14.12 million km² on March 2nd:
The “high resolution” AMSR2 based metric from AWI peaked at 14.24 million km² on March 5th:
[Edit – March 16th]
They are of course a bit late with the news, but the NSIDC have now called the 2023 maximum Arctic sea ice extent:
Arctic sea ice has likely reached its maximum extent for the year, at 14.62 million square kilometers (5.64 million square miles) on March 6. The 2023 maximum is the fifth lowest in the 45-year satellite record. NSIDC scientists will present a detailed analysis of the 2022 to 2023 winter sea ice conditions in the regular monthly post in early April:
The date of the maximum this year, March 6, was six days earlier than the 1981 to 2010 average date of March 12…
The ice growth season ended with below average sea ice extent in the Bering Sea, Sea of Okhotsk, Barents Sea, and Labrador Sea. Above average extent was in the Greenland Sea. Extent was well below average in the Gulf of St. Lawrence for a second year in row.
I should of course add “in the satellite era”, but the title is pretty unwieldy as it is!
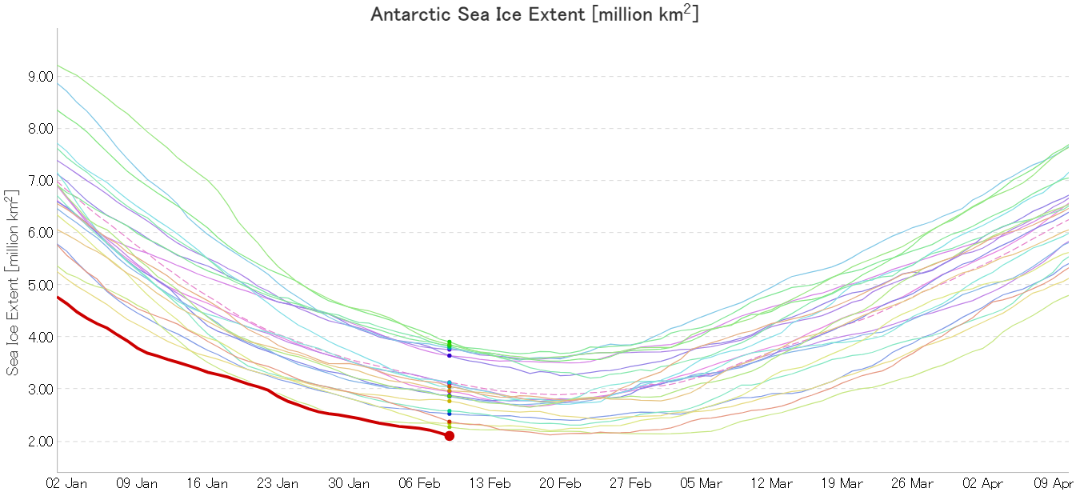
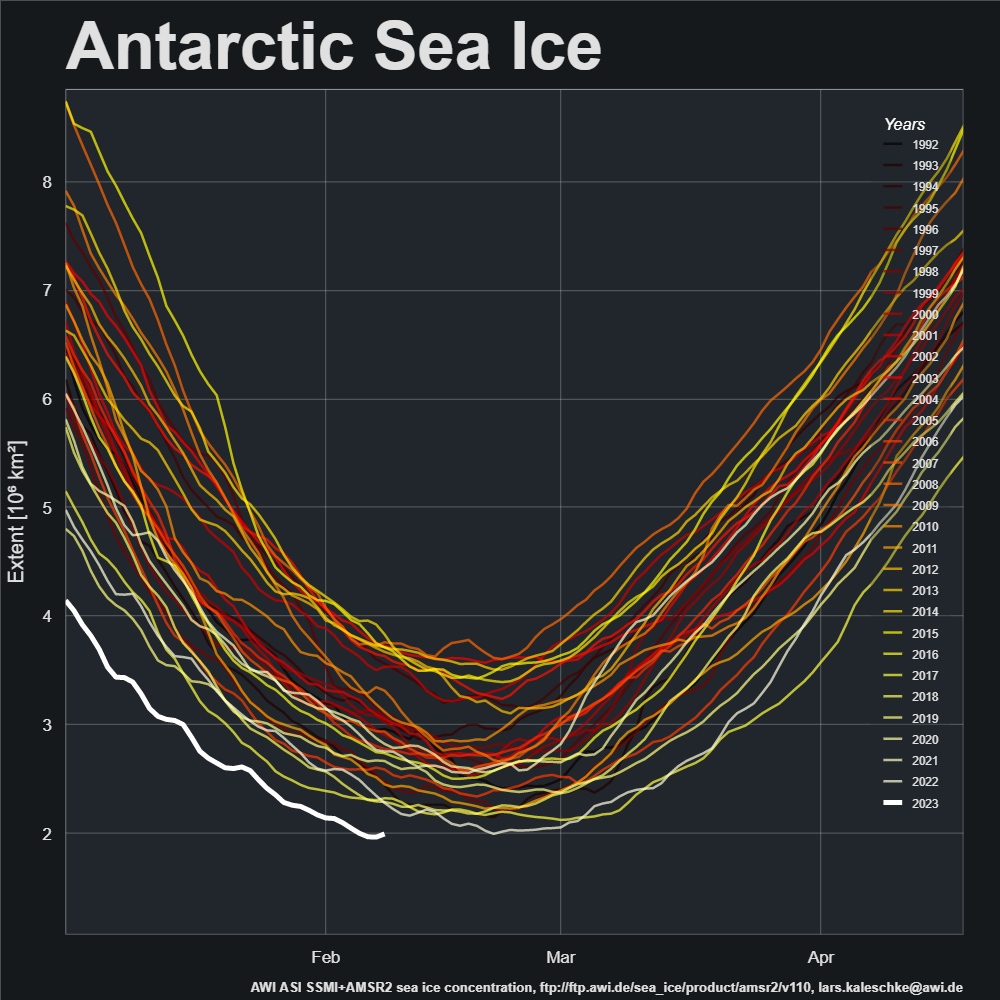
I was up early (UTC) to check the latest JAXA data, and sure enough that confirmed a new record minimum Antarctic sea ice extent of 2.11 million km² was reached yesterday:
Having added a note to that effect the Arctic open thread, Lars Kaleschke from the Alfred Wegener Institute pointed out over on Mastodon that the AWI had published a press release about the event this morning:
Let’s take a closer look at what the AWI had to say:
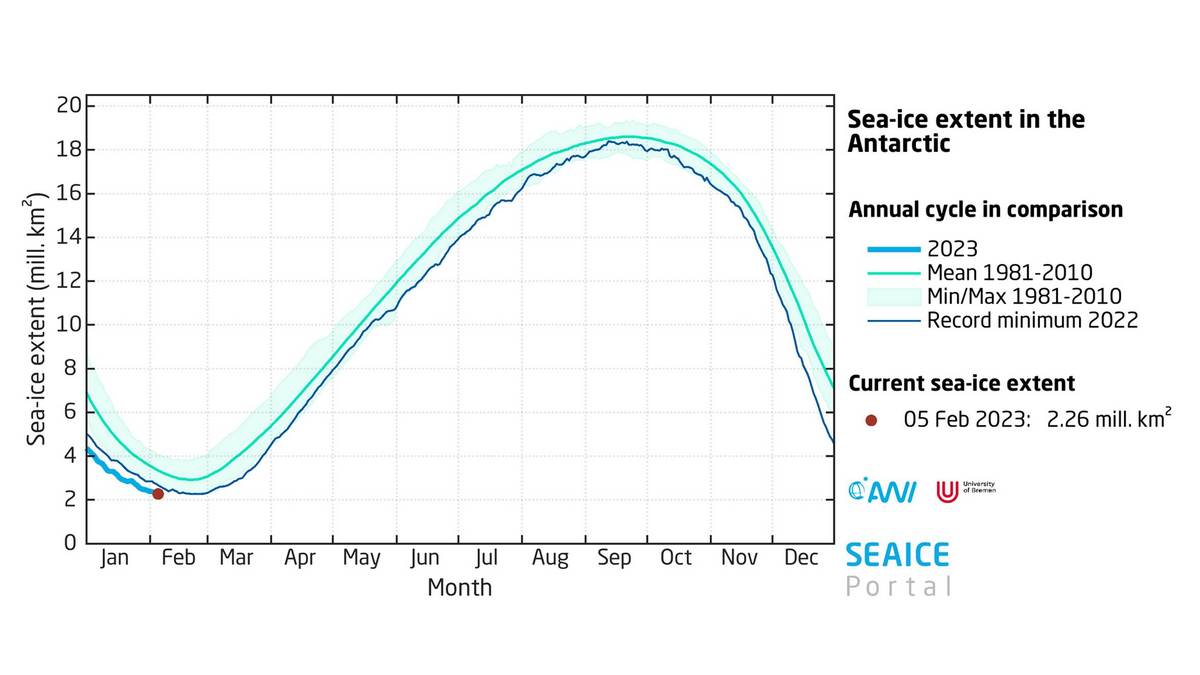
On 8 February 2023, at 2.20 million square kilometres, the Antarctic sea ice extent had already dropped below the previous record minimum from 2022 (2.27 million square kilometres on 24 February 2022). Since the sea ice melting in the Antarctic will most likely continue in the second half of the month, we can’t say yet when the record low will be reached or how much more sea ice will melt between now and then,” says Prof Christian Haas, Head of the Sea Ice Physics Section at the Alfred Wegener Institute, Helmholtz Centre for Polar and Marine Research (AWI), with regard to the current developments in the Antarctic. “The rapid decline in sea ice over the past six years is quite remarkable, since the ice cover hardly changed at all in the thirty-five years before. It is still unclear whether what we are seeing is the beginning of a rapid end to summer sea ice in the Antarctic, or if it is merely the beginning of a new phase characterised by low but still stable sea ice cover in the summer.”
Here’s how that news looks in the AWI’s official press release:
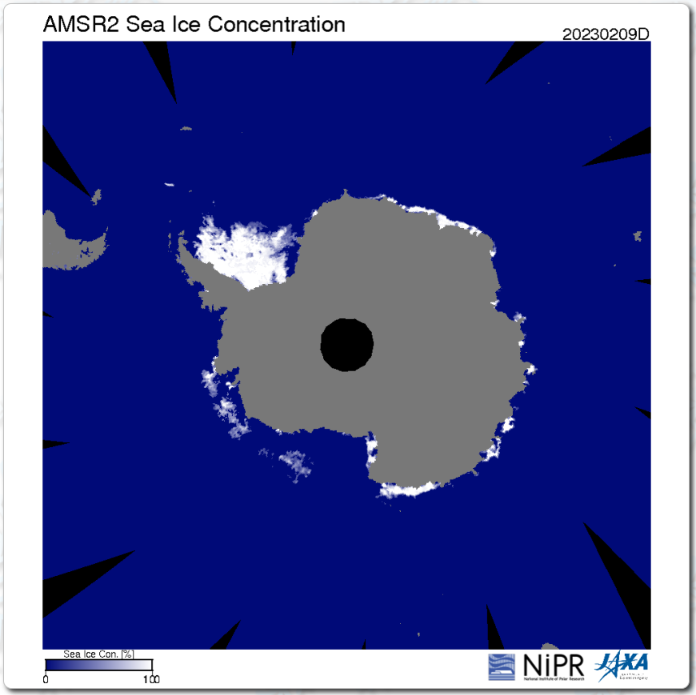
By way of prognostication here too is the current JAXA AMSR2 concentration map:
There are some low concentration areas which suggest further extent reductions still to come, despite the recent uptick in the high resolution graph.
Getting back to the AWI’s text:
The melting has progressed since December 2022, especially in the Bellingshausen and Amundsen Seas in the West Antarctic; the former is virtually ice-free. That is also where the research vessel Polarstern currently is, exploring the evidence left behind of past glacials and interglacials. According to expedition leader and AWI geophysicist Prof Karsten Gohl, who is now in the region for the seventh time, having first come in 1994: “I have never seen such an extreme, ice-free situation here before. The continental shelf, an area the size of Germany, is now completely ice-free. Though these conditions are advantageous for our vessel-based fieldwork, it is still troubling to consider how quickly this change has taken place.”
Polarstern in ice free Bellingshausen Sea, West Antarctica, in January 2023. (Photo: Daniela Röhnert)
Analyses of the current sea ice extent, conducted by the Sea Ice Portal team, show that, for the entire month of January 2023, the ice was at its lowest-ever extent recorded for the time of year since the beginning of record-keeping in 1979. The monthly mean value was 3.22 million square kilometres, ca. 478,000 square kilometres (an area roughly the size of Sweden) below the previous minimum from 2017. With regard to its long-term development, the Antarctic sea ice shows a declining trend of 2.6 percent per decade. This is the eighth consecutive year in which the mean sea-ice extent in January has been below the long-term trend.
But what has caused the current lack of Antipodean sea ice? The press release continues:
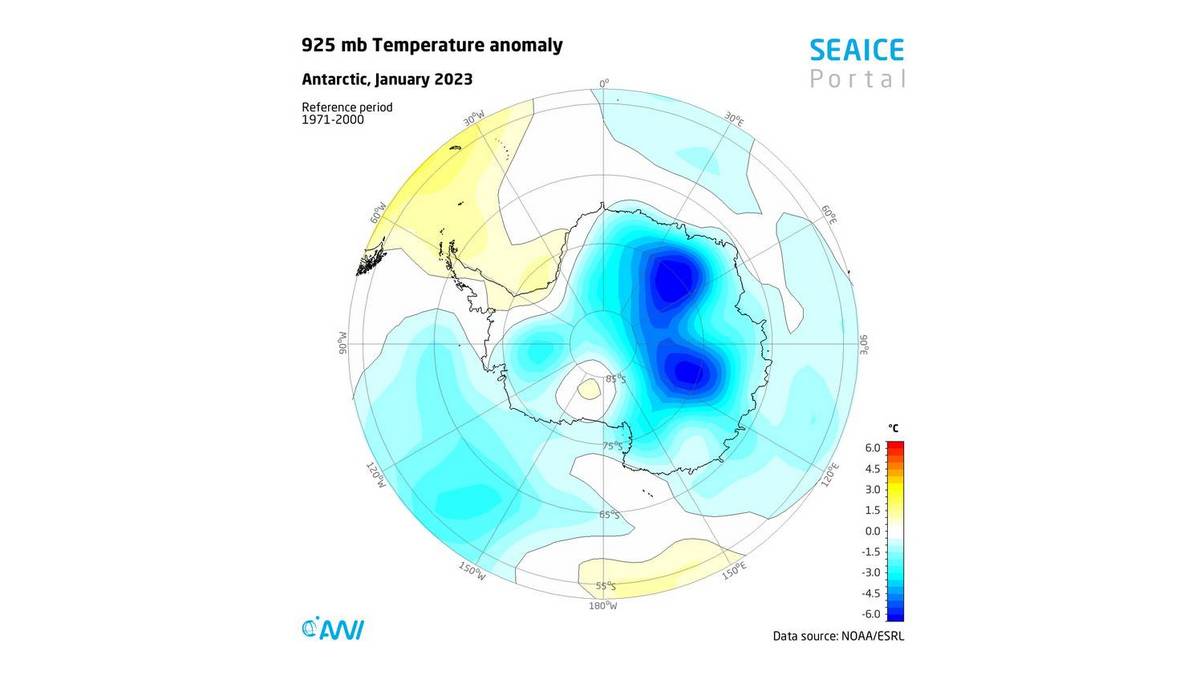
This intense melting could be due to unusually high air temperatures to the west and east of the Antarctic Peninsula, which were ca. 1.5 °C above the long-term average. In addition, the Southern Annular Mode (SAM) is in a strongly positive phase, which influences the prevailing wind circulation in the Antarctic. In a positive SAM phase (like today), a low-pressure anomaly forms over the Antarctic, while a high-pressure anomaly develops over the middle latitudes. This intensifies the westerly winds and causes them to contract toward the Antarctic. As a result, upwelling of circumpolar deep water on the continental shelf intensifies in the Antarctic, promoting sea-ice retreat. More importantly, it also intensifies the melting of ice shelves, an essential aspect for future global sea-level rise.
Air temperature anomalies in °C at 925 hPa pressure level in Antarctica in January 2023 compared to the long-term mean 1971-2000. (Graphic: meereisportal.de)
The press release concludes:
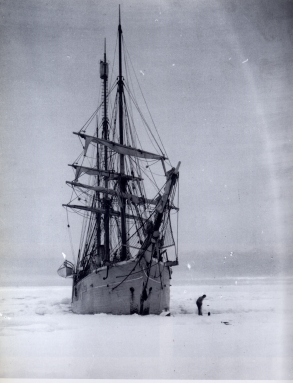
Historical records also reflect the tremendous changes. For example, in the Antarctic summer 125 years ago, the Belgian research vessel Belgica was trapped in the massive pack ice for more than a year – in exactly the same region where the Polarstern can now operate in completely ice-free waters. The photographs and diaries of the Belgica’s crew offer a unique chronicle of the ice conditions in the Bellingshausen Sea at the dawn of the industrial age, which climate researchers often use as a benchmark for comparison with today’s climate change.
Belgica became ice bound near Peter I island on February 28th 1898. On board was second officer Roald Amundsen. The leader of the expedition, Adrien de Gerlache, published a French language book about the voyage in 1902: “Quinze mois en Antarctique“.
Belgica ice bound in the Bellingshausen Sea
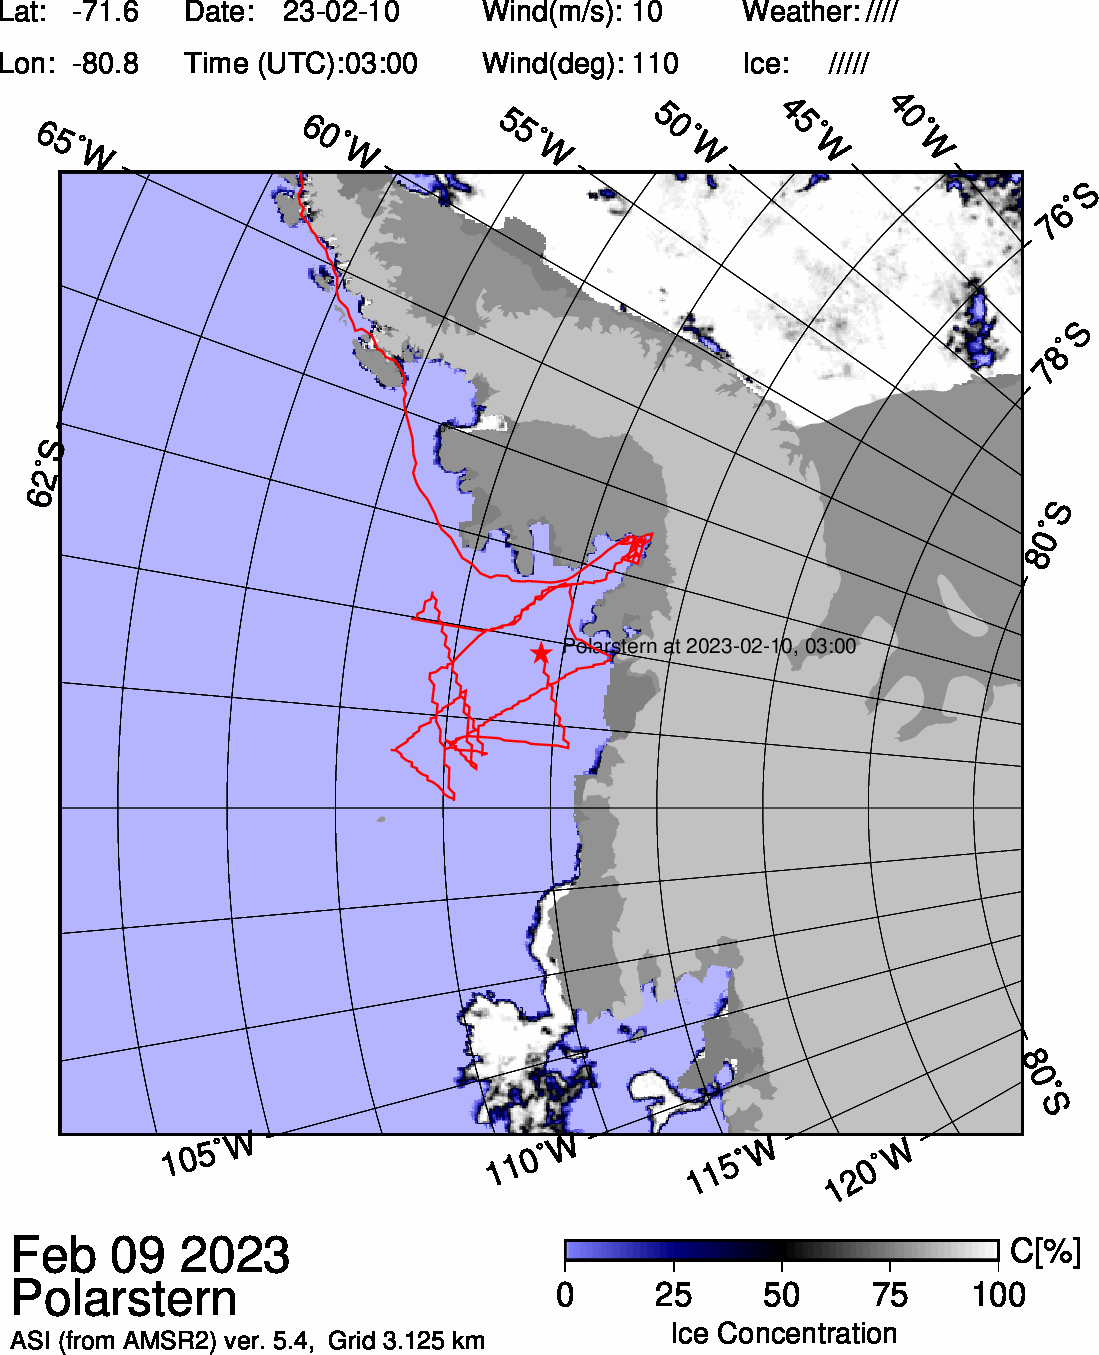
Finally, for the moment at least, here is the University of Bremen’s map of Polarstern’s current location and the sea ice concentration in the vicinity thereof:
[Edit – February 11th]
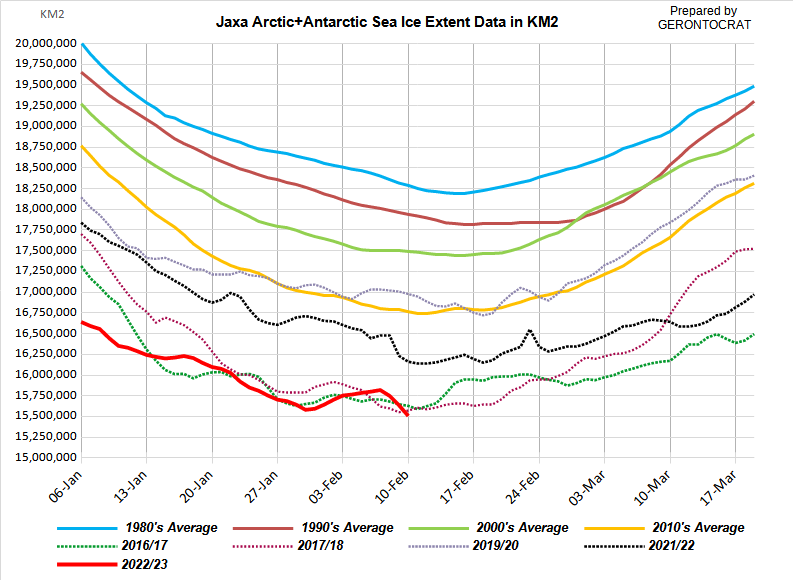
JAXA Antarctic sea ice extent is now down to 2.06 million km². Accompanied by a significant fall in Arctic extent, JAXA’s flavour of global sea ice extent has now also reached the lowest level ever recorded in the satellite era, at 15.51 million km² :
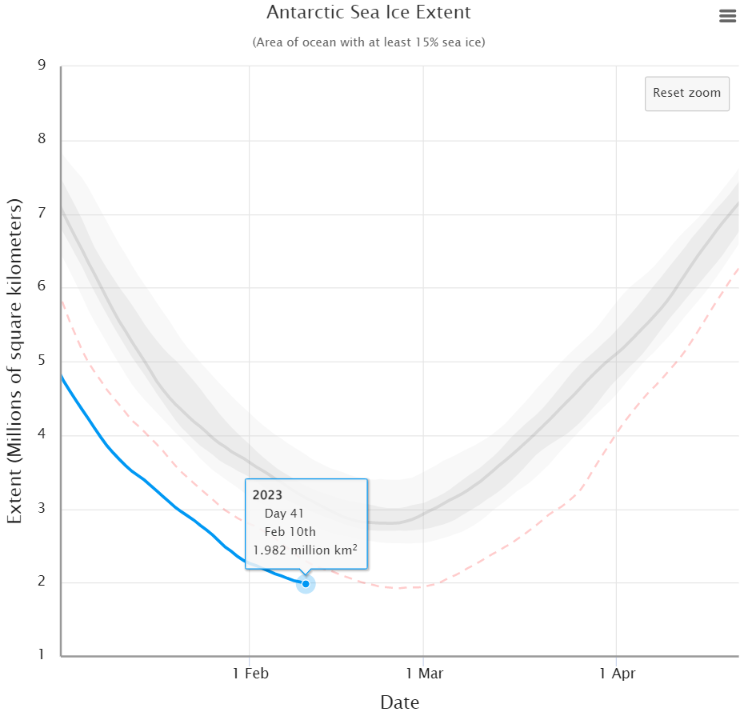
P.S. The NSIDC’s 5 day averaged extent hasn’t quite reached a record minimum yet:
However their daily extent has reached a new satellite era record minimum:
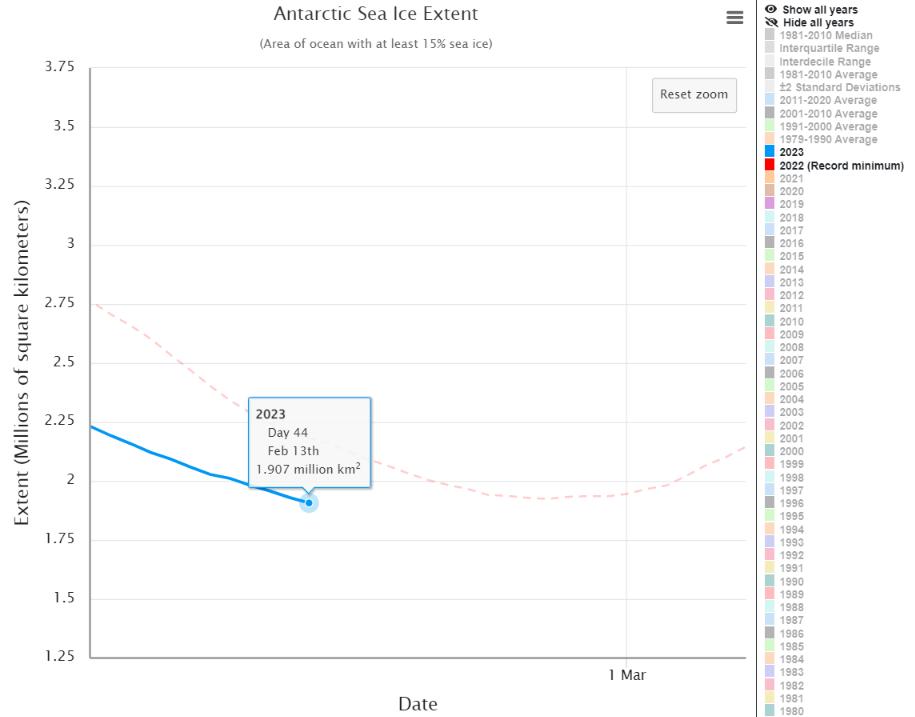
The reality is that @NSIDC daily #Antarctic#SeaIce extent for February 10th is 1.90 million km².
The NSIDC’s 5 day average Antarctic sea ice extent metric has duly reached a new record low level of 1.91 million km² :
P.S. The NSIDC has now published itsown article about the record minimum:
With a couple more weeks likely left in the melt season, the extent is expected to drop further before reaching its annual minimum. Much of the Antarctic coast is ice free, exposing the ice shelves that fringe the ice sheet to wave action and warmer conditions…
Extent has tracked well below last year’s melt season levels since mid-December. As noted in our previous post, a positive Southern Annular Mode has led to stronger-than-average westerly winds. Along with a strong Amundsen Sea Low, the weather conditions have brought warm air to the region on both sides of the Antarctic Peninsula. This has largely cleared out the ice cover in the Amundsen and Bellingshausen Seas, and reduced the sea ice extent in the northwestern Weddell Sea. Sea ice is patchy and nearly absent over a long stretch of the Pacific-facing coastline of Antarctica. Earlier studies have linked low sea ice cover with wave-induced stresses on the floating ice shelves that hem the continent, leading to break up of weaker areas.
Antarctic sea ice extent has been highly variable over the last several years. While 2022 and 2023 have had record low minimum extent, four out of the five highest minimums have occurred since 2008. Overall, the trend in Antarctic minimum extent over 1979 to 2023 is near zero. The current downward linear trend in the Antarctic minimum extent from 1979 to 2023 is 2,400 square kilometers per year, or 0.9 percent per decade, which is currently not statistically significant. Nevertheless, the sharp decline in sea ice extent since 2016 has fueled research on potential causes and whether sea ice loss in the Southern Hemisphere is developing a significant downward trend.
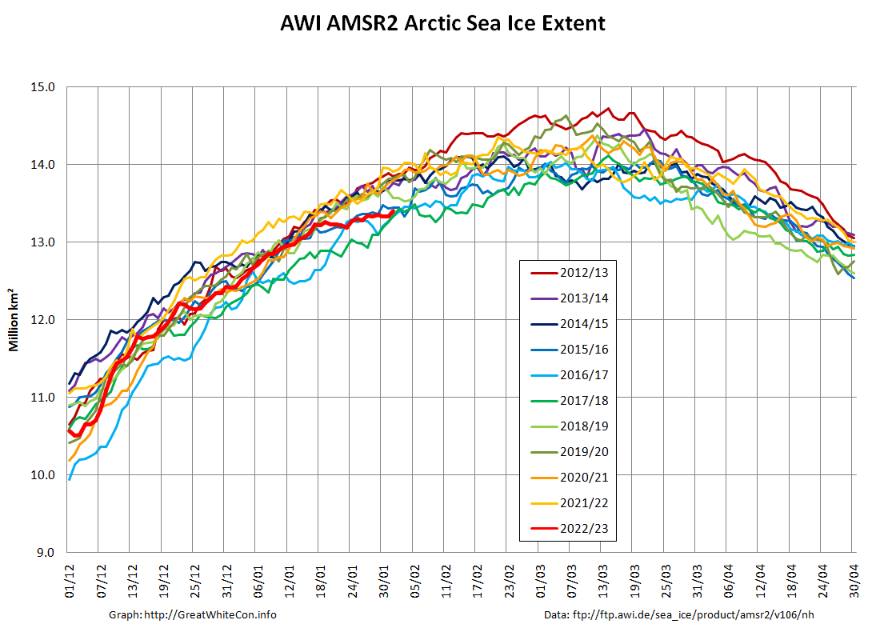
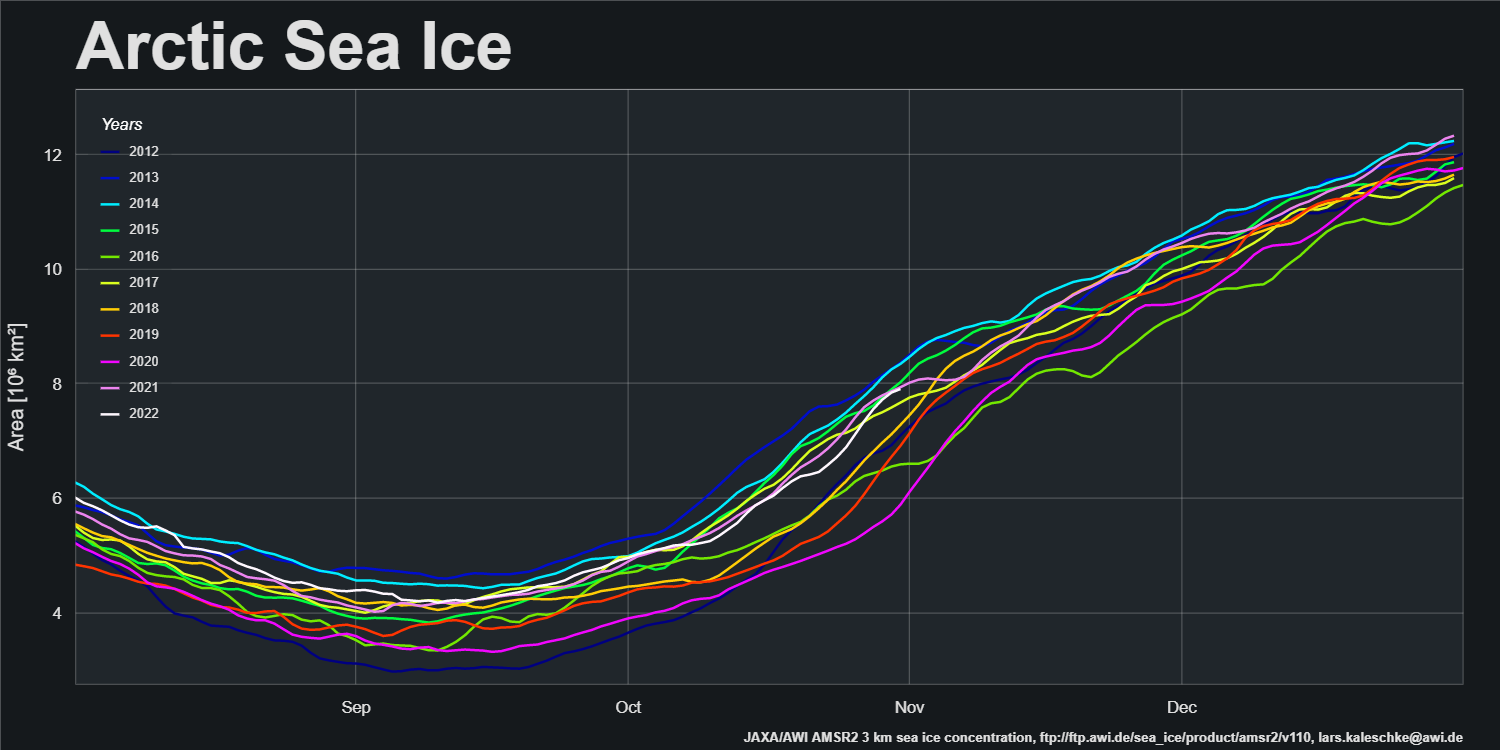
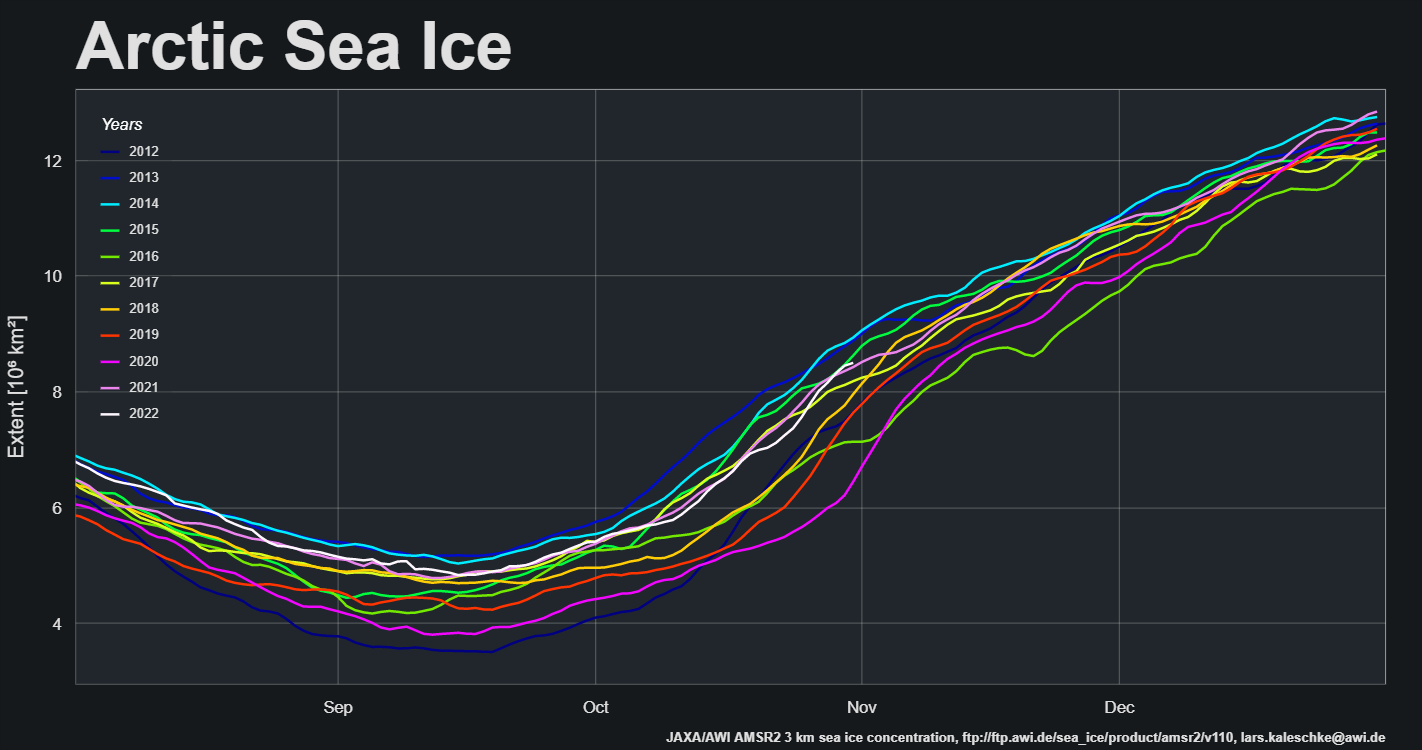
A new month has arrived, and during January several Arctic sea ice metrics have been drifting towards the bottom of their respective decadal ranges. To begin with here is AWI’s high resolution AMSR2 extent graph, which is currently very close to being lowest for the date in the AMSR2 record:
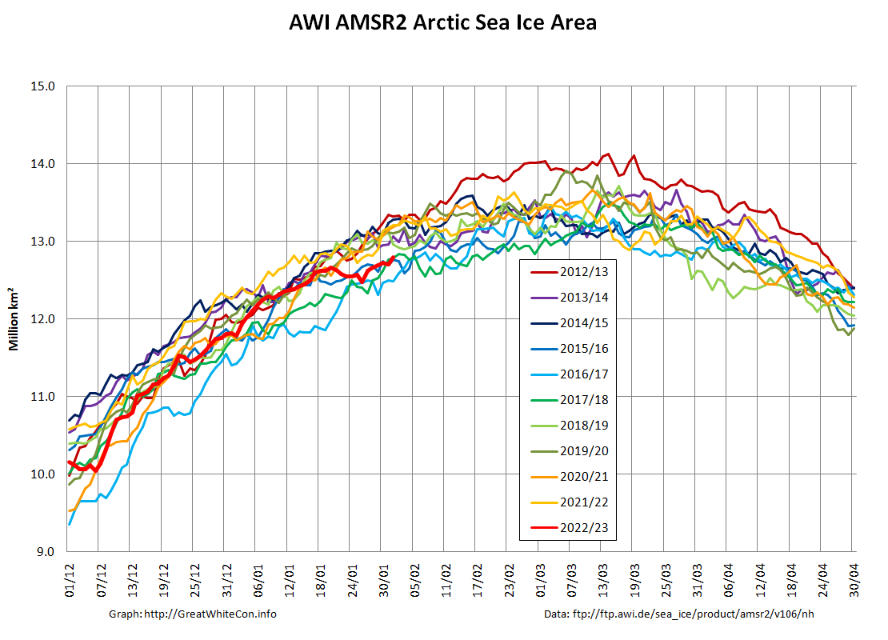
However that is less the case for area:
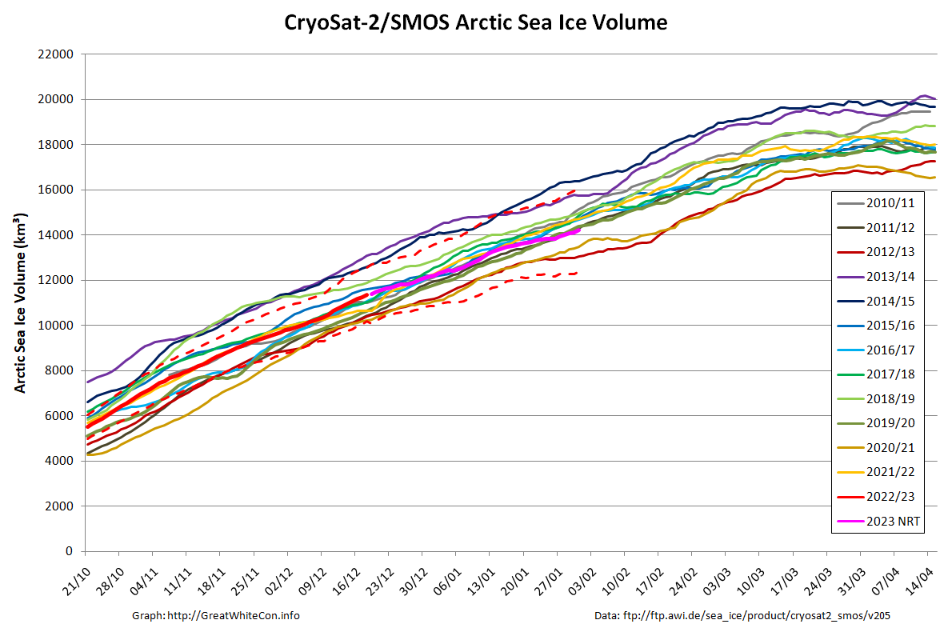
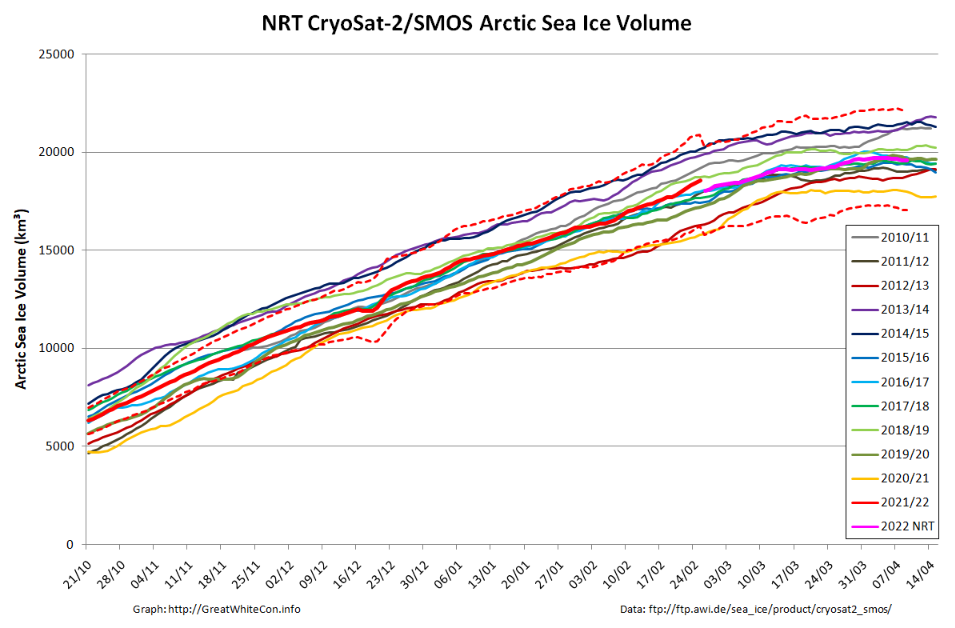
Taylor is keen to see the PIOMAS volume data for January, but whilst we wait for the latest Polar Science Center update here is the CryoSat-2/SMOS volume graph, which now includes a couple of month’s worth of reanalysed results as well as more recent near real time numbers:
Here too is the start of month CS2/SMOS thickness map:
A change is allegedly as good as a rest, so here’s an alternative view of high resolution AMSR2 area and extent created using the experimental tools provided by the AWI’s Lars Kaleschke at: https://sites.google.com/view/sea-ice/
After a brief pause mid-month the refreeze has accelerated again. Both metrics are in the upper half of the decadal range, with extent this year just above 2021 and area just below last year.
Next let’s take a look at sea ice concentration at the end of October:
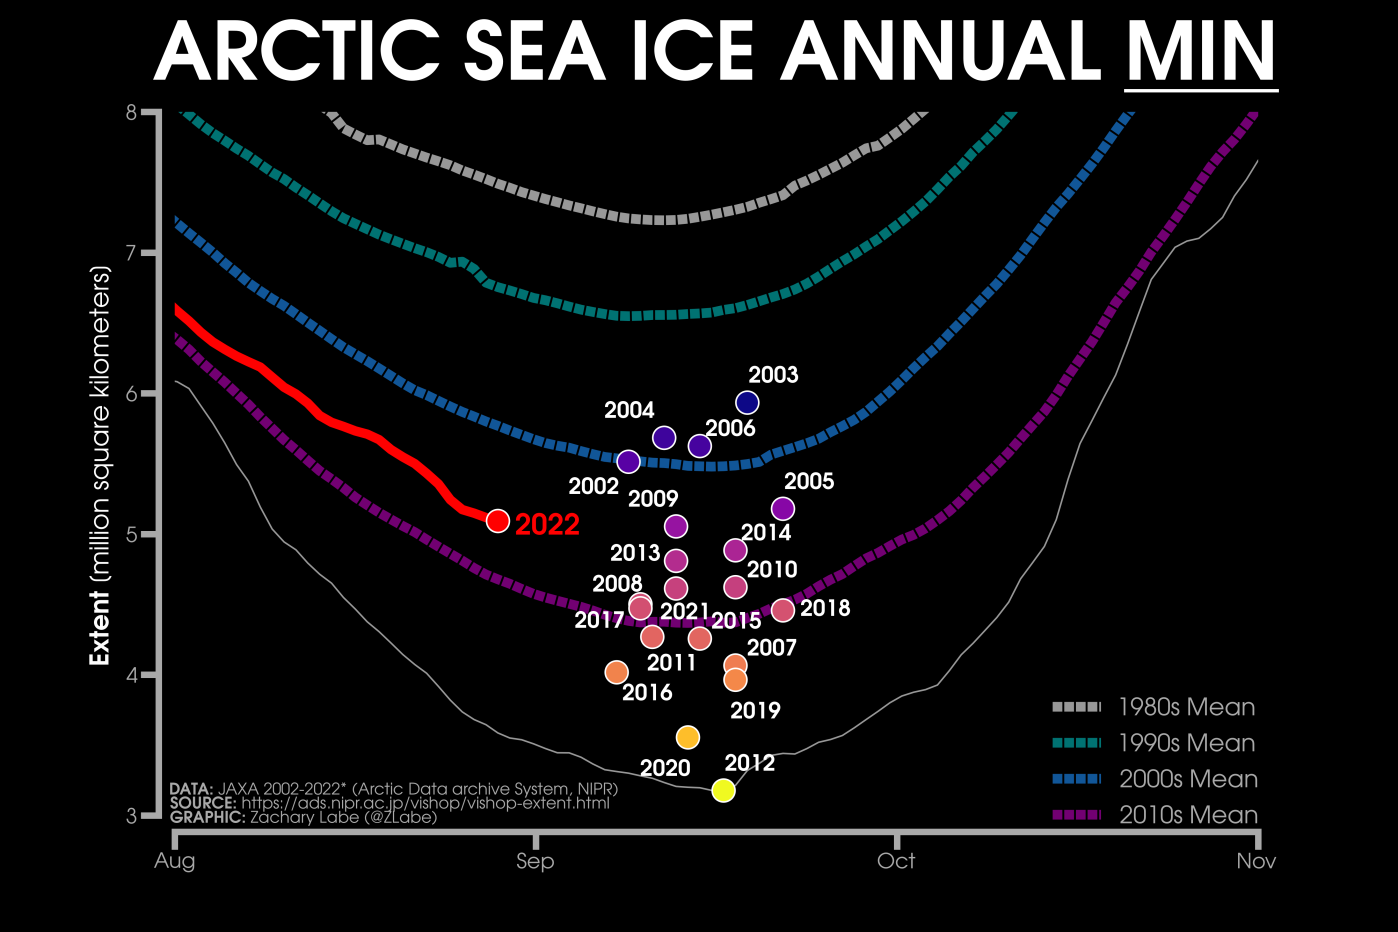
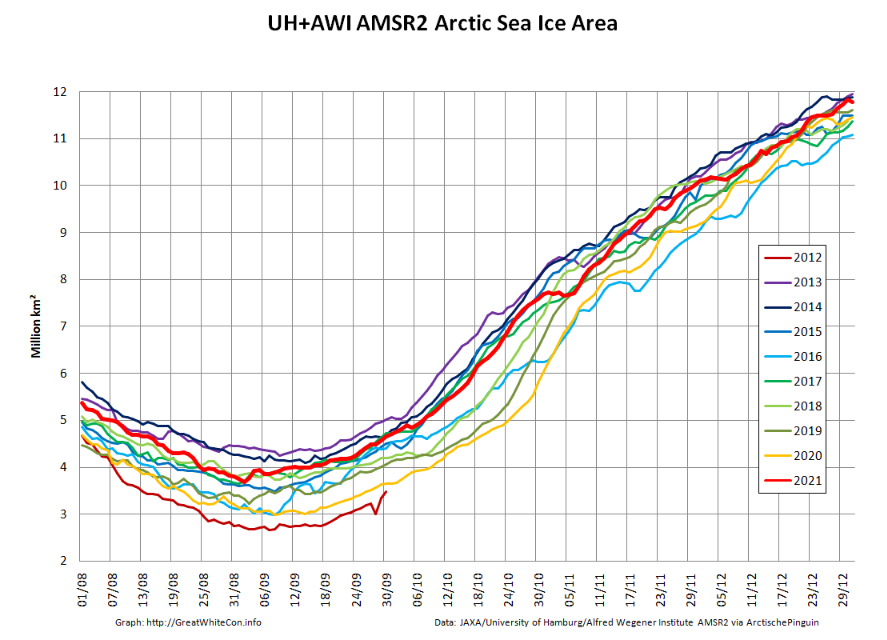
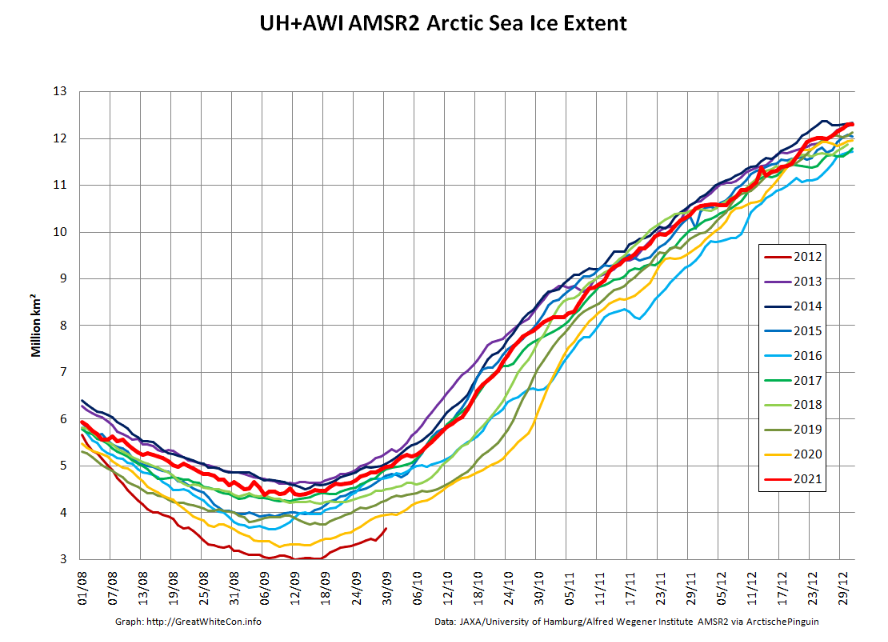
September has arrived and it’s time to start speculating about when and at what level this summer’s minimum Arctic sea ice extent will occur. Here’s a helpful summary of previous years’ JAXA AMSR2/AMSR-E extent minima courtesy of Zack Labe:
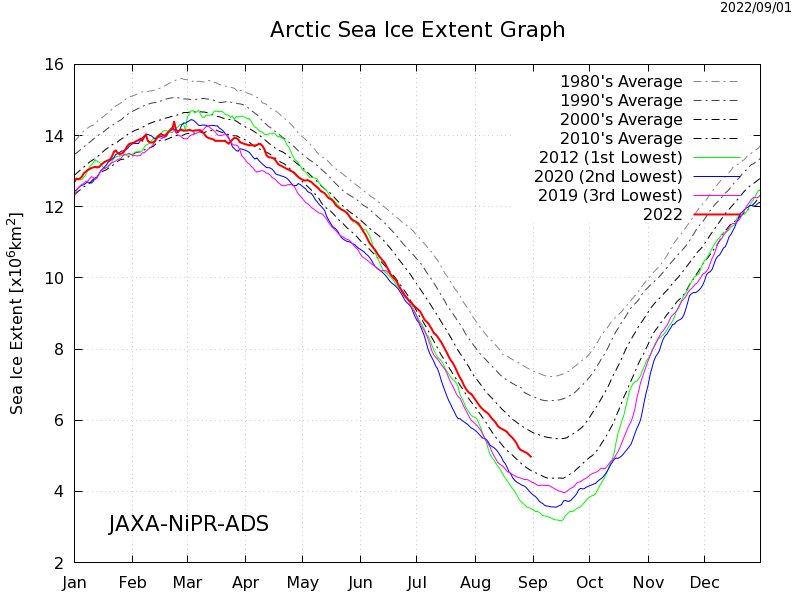
Here too is JAXA’s current graph of extent, including a selection of previous years:
JAXA extent on August 31st was 4.96 million km2, marginally below last year’s value of 4.99 million km2 on the same date.
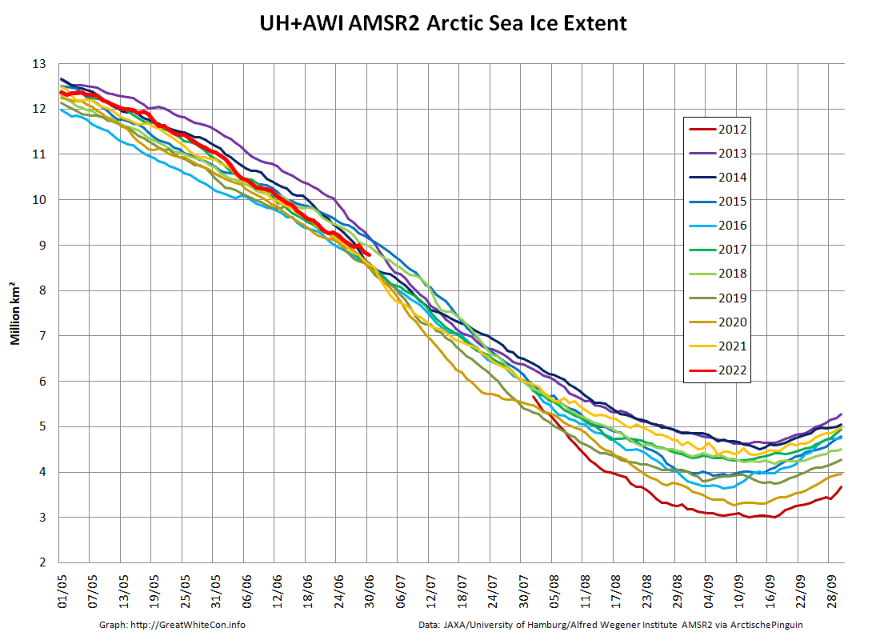
After a relatively rapid decline at the beginning of June Arctic sea extent is now very close to the 2010s average:
Both 2020 and 2021 began relatively rapid declines of their own at the beginning of July, so it will be interesting to see if 2022 follows suit.
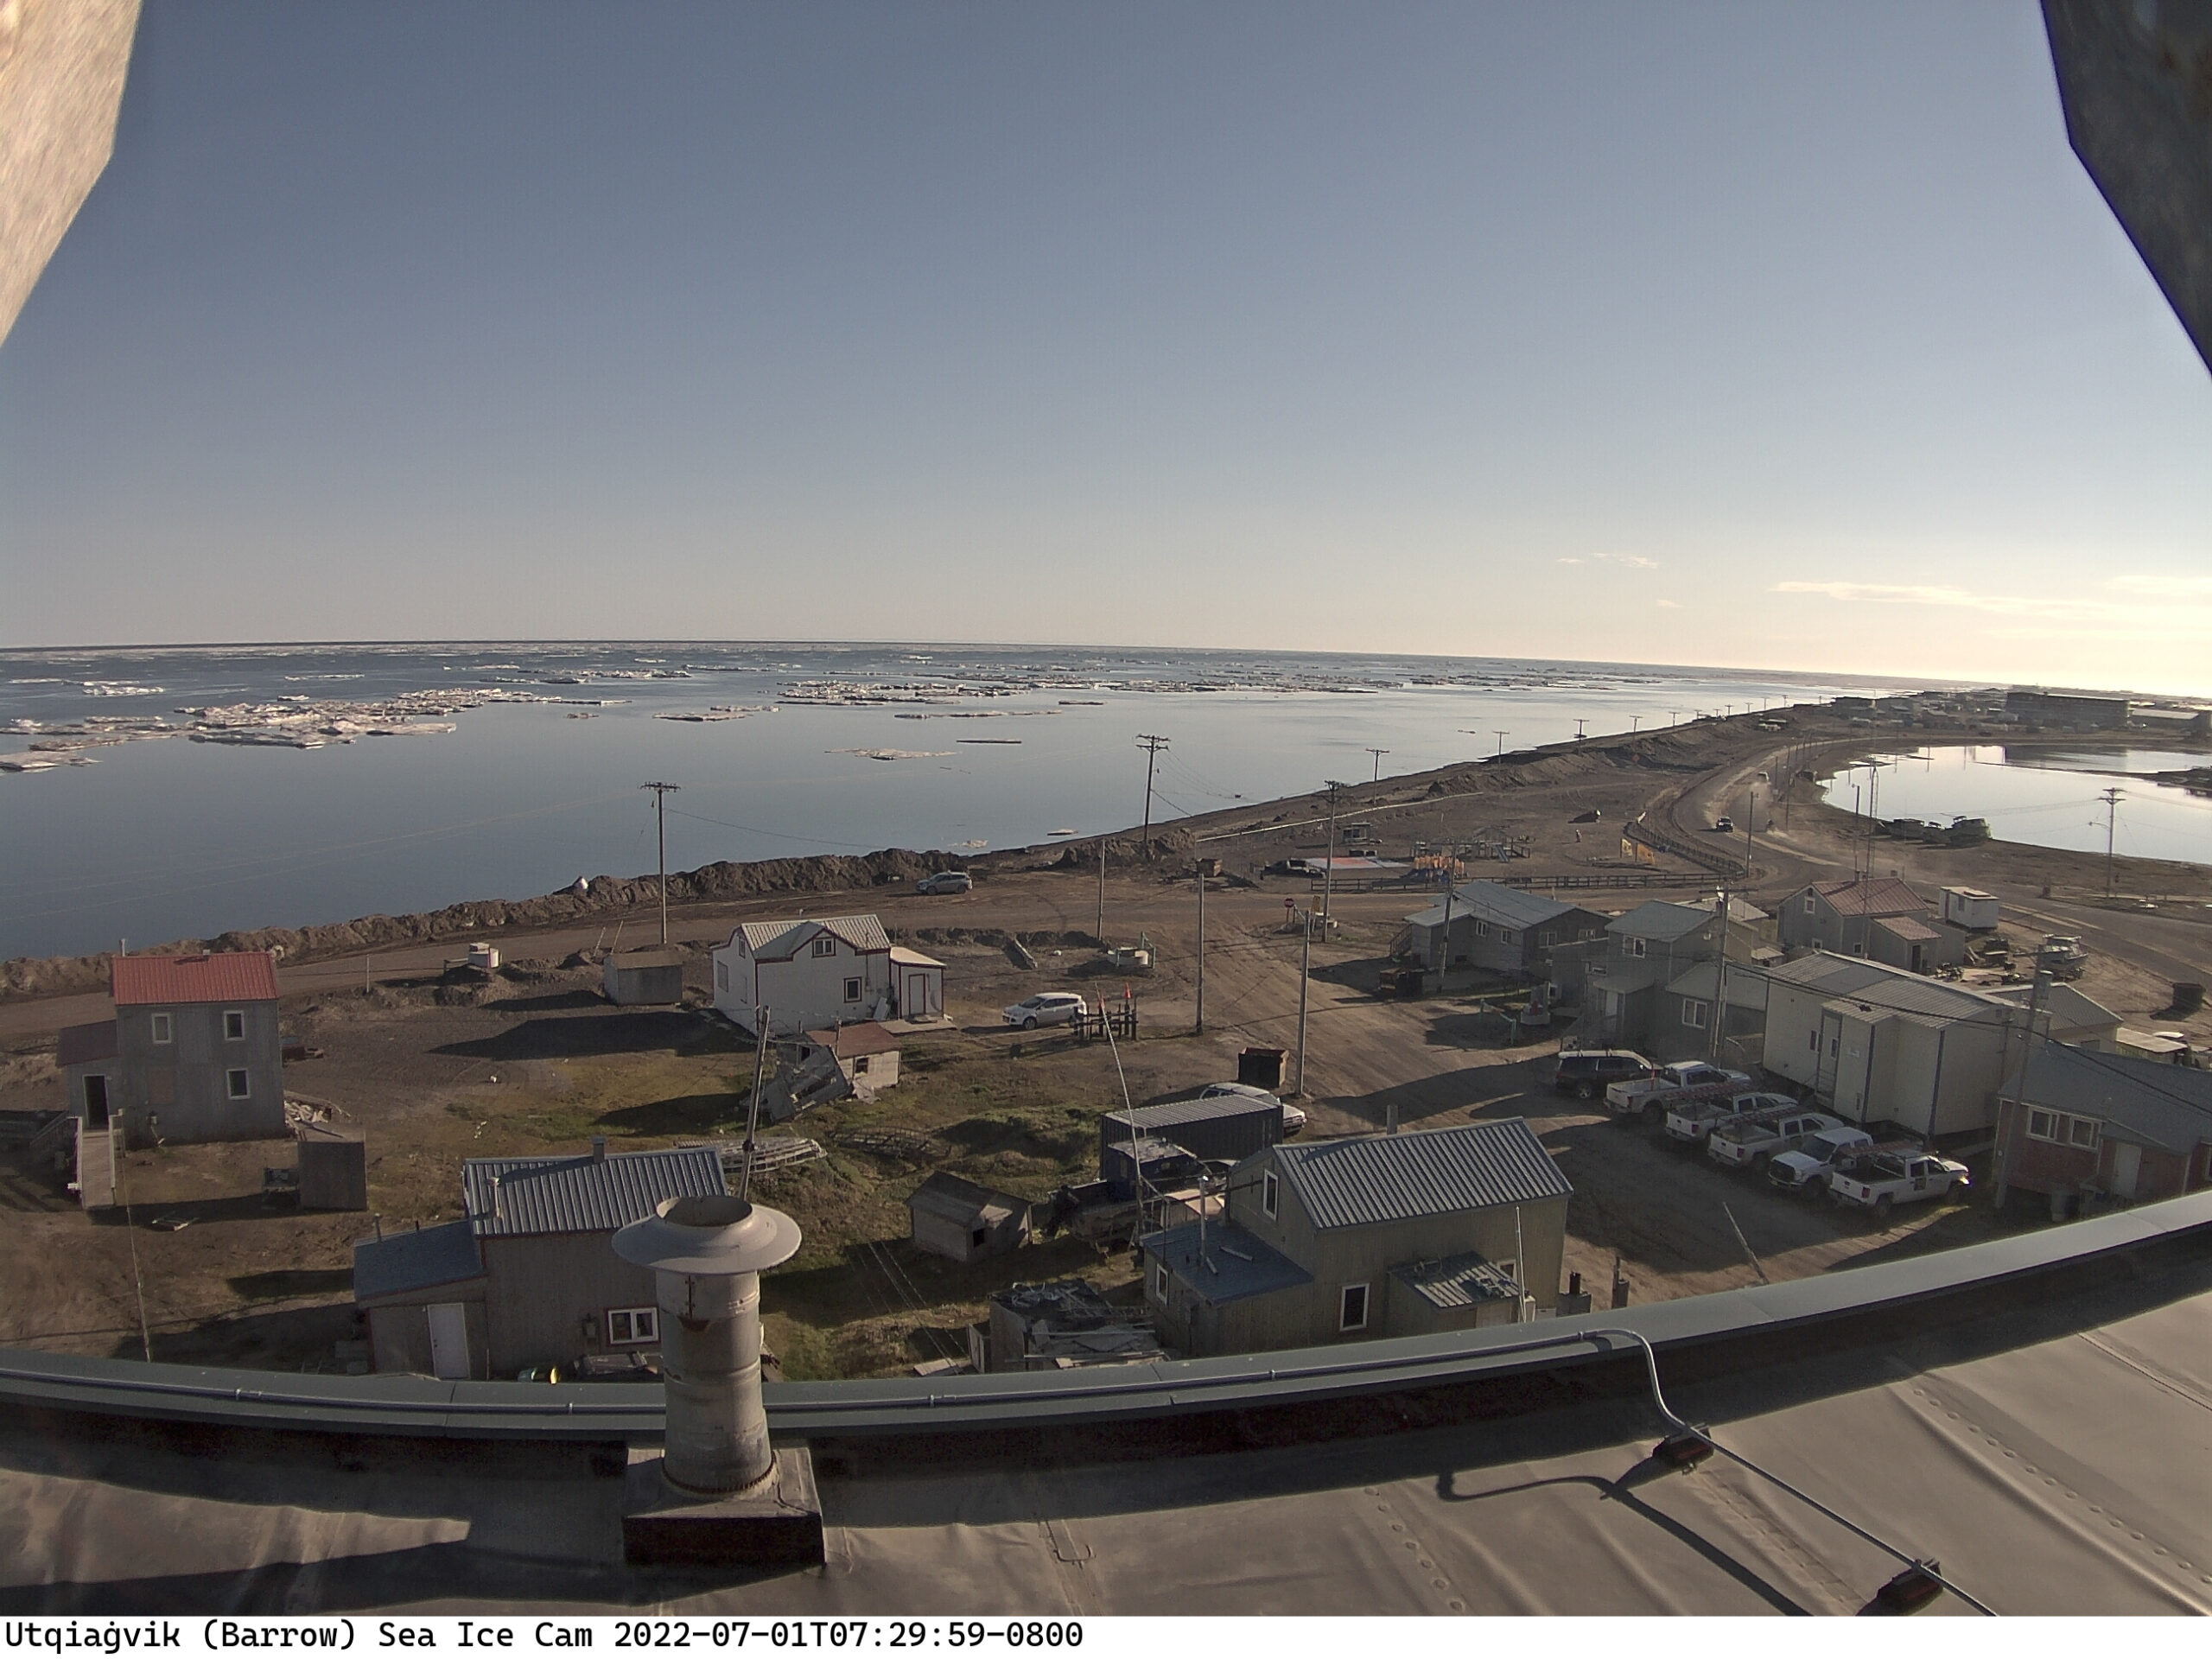
Most of the fast ice off Utqiaġvik has recently disappeared:
Meanwhile further out into the Chukchi Sea the sea ice looks to be in poor shape at the moment, with surface melting apparent across the entire region:
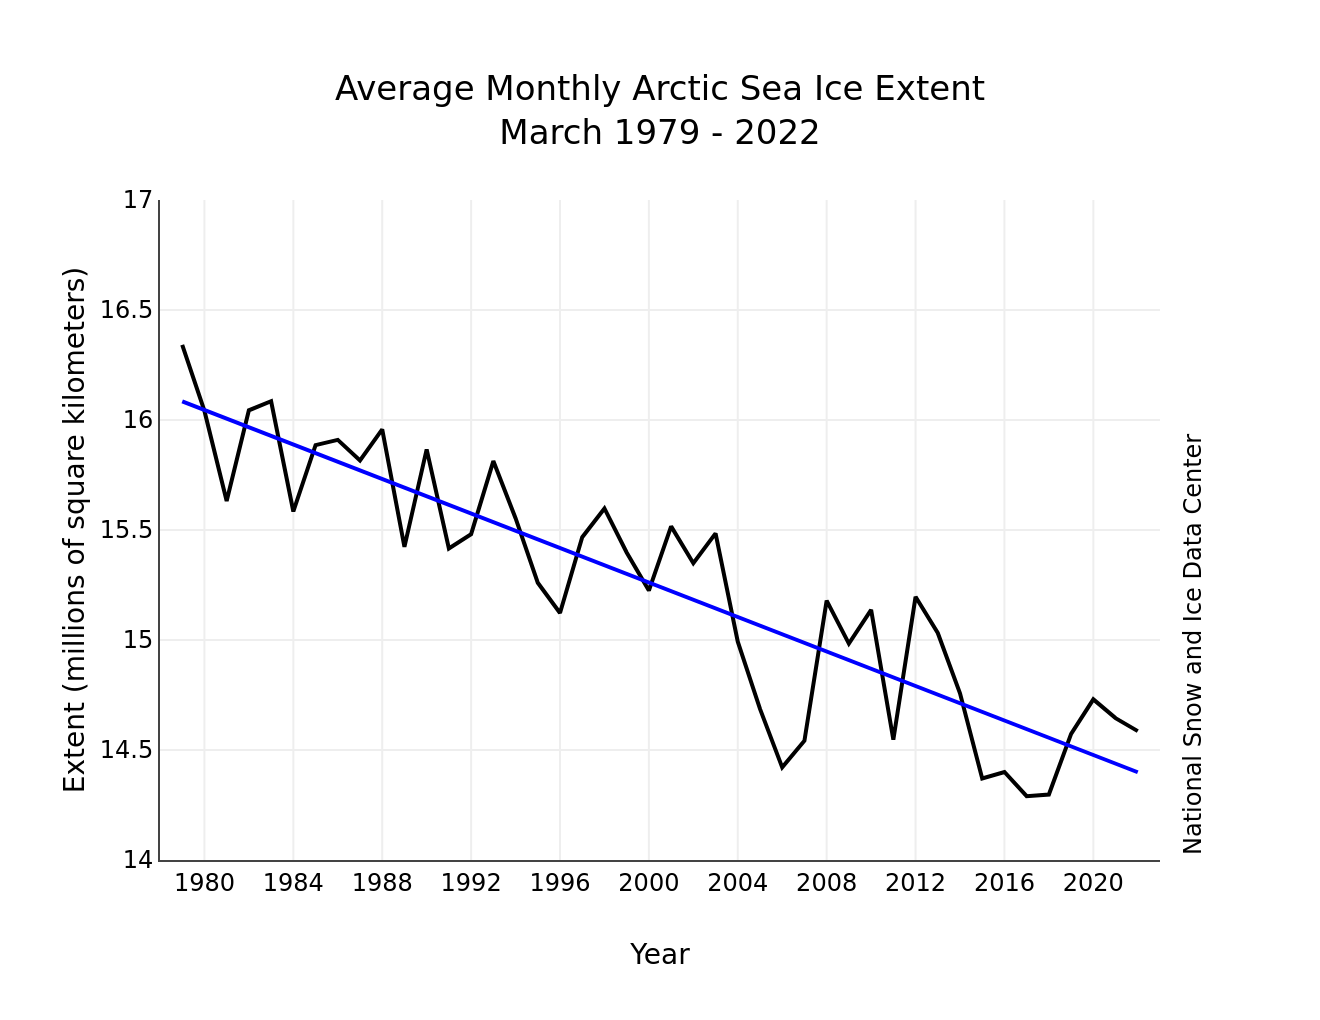
The April edition of the NSIDC’s Arctic Sea Ice News summarises March 2022 as follows:
Average Arctic sea ice extent for March 2022 was 14.59 million square kilometers (5.63 million square miles), ranking ninth lowest in the satellite record…
The total decline, after a series of small ups and downs, was only 250,000 square kilometers (96,500 square miles):
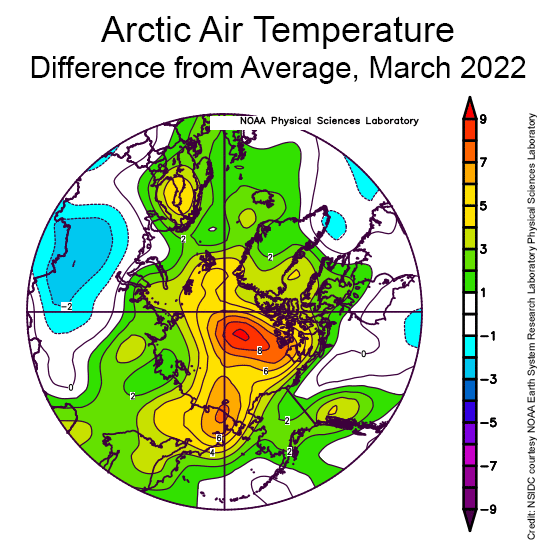
Counter to what might be expected given the very slow rate of sea ice loss over the month as a whole, air temperatures at the 925 millibar level (about 2,500 feet above the surface) were above average over all of the Arctic Ocean:
March temperatures were up to 9 degrees Celsius (16 degrees Fahrenheit) higher than average north of the Canadian Arctic Archipelago, up to 6 degrees Celsius (11 degrees Fahrenheit) above average in the East Siberian Sea, but up to 5 degrees Celsius (9 degrees Fahrenheit) above average over a wide area.
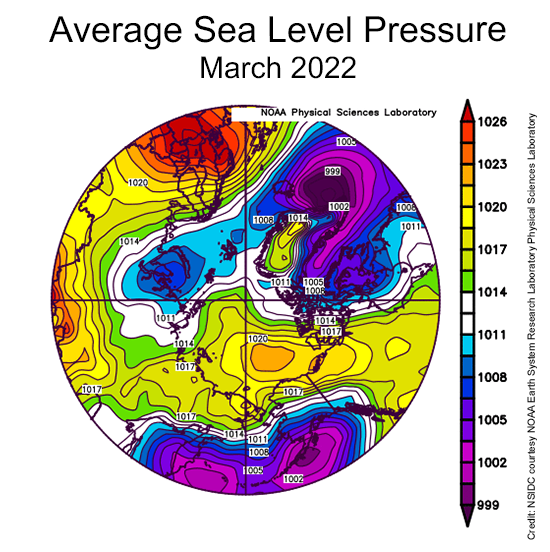
The key features of the sea level pressure pattern were high pressure (an anticyclone) over the central Arctic Ocean, a trough of low pressure extending into the Barents Sea, and an unusually high pressure over Northern Europe:
While having an anticyclone over the central Arctic Ocean is quite typical for this time of year, the combination of the high pressure over northern Europe and the pressure trough to the west led to a strong pressure gradient, leading to strong winds from south through the Norwegian and Barents Seas…
This can be tied to the extreme warm event over the Arctic Ocean seen in the middle of the month, associated with strong water vapor transport and the passage of several strong cyclones.
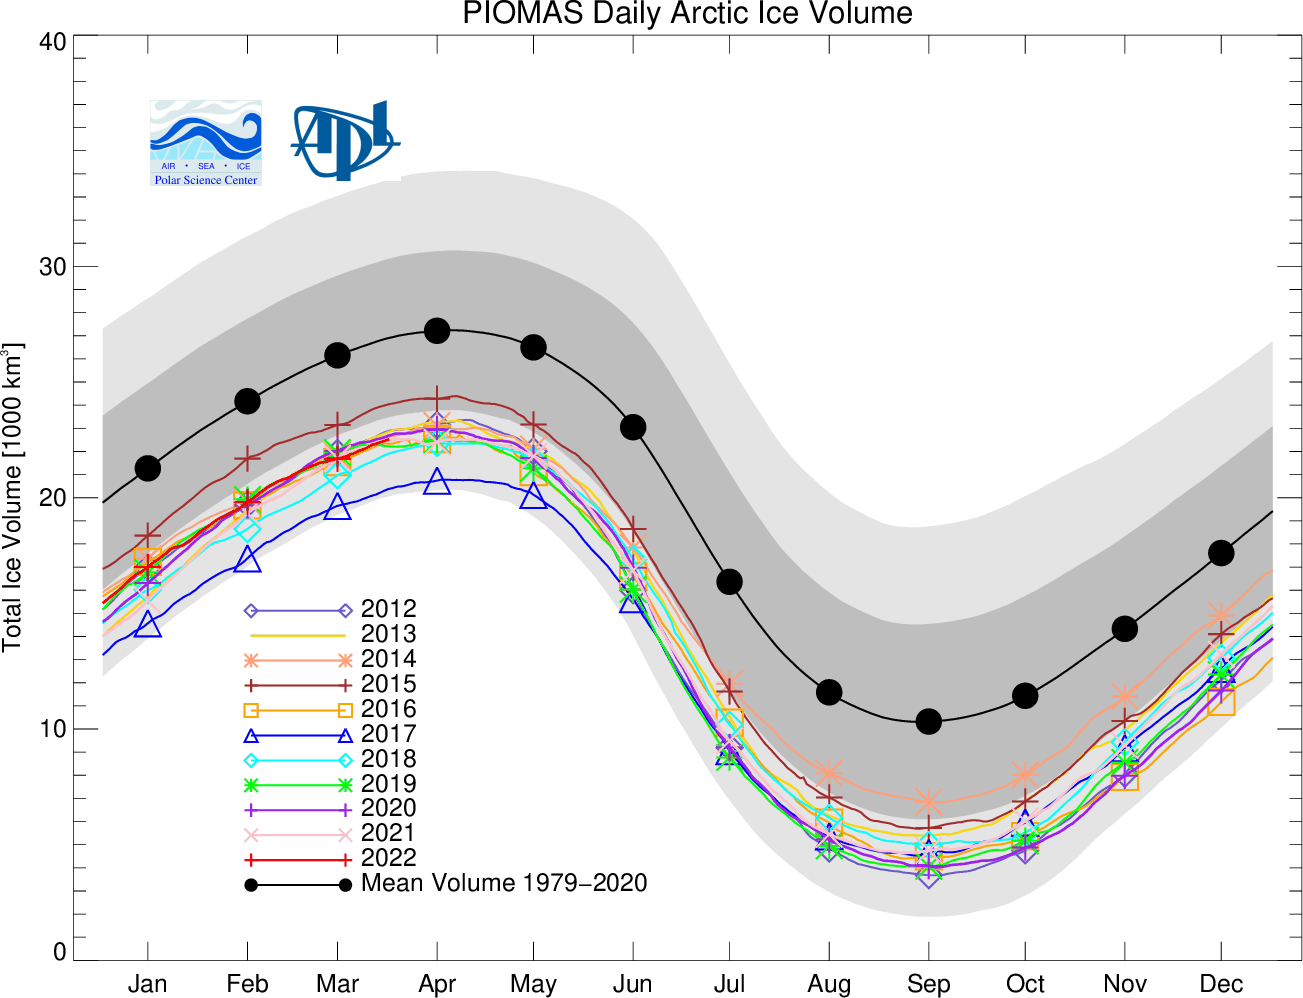
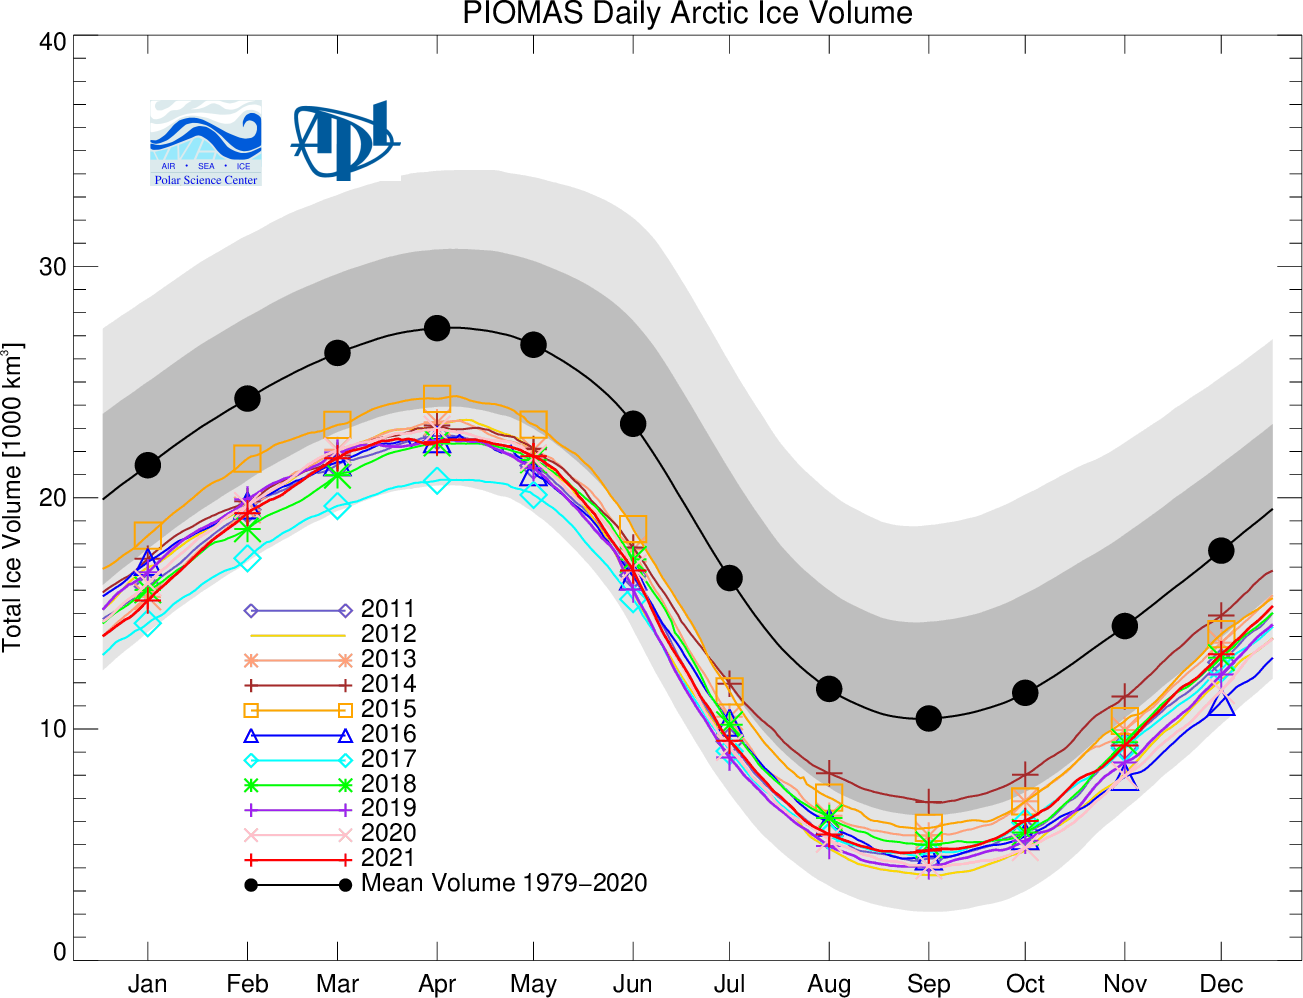
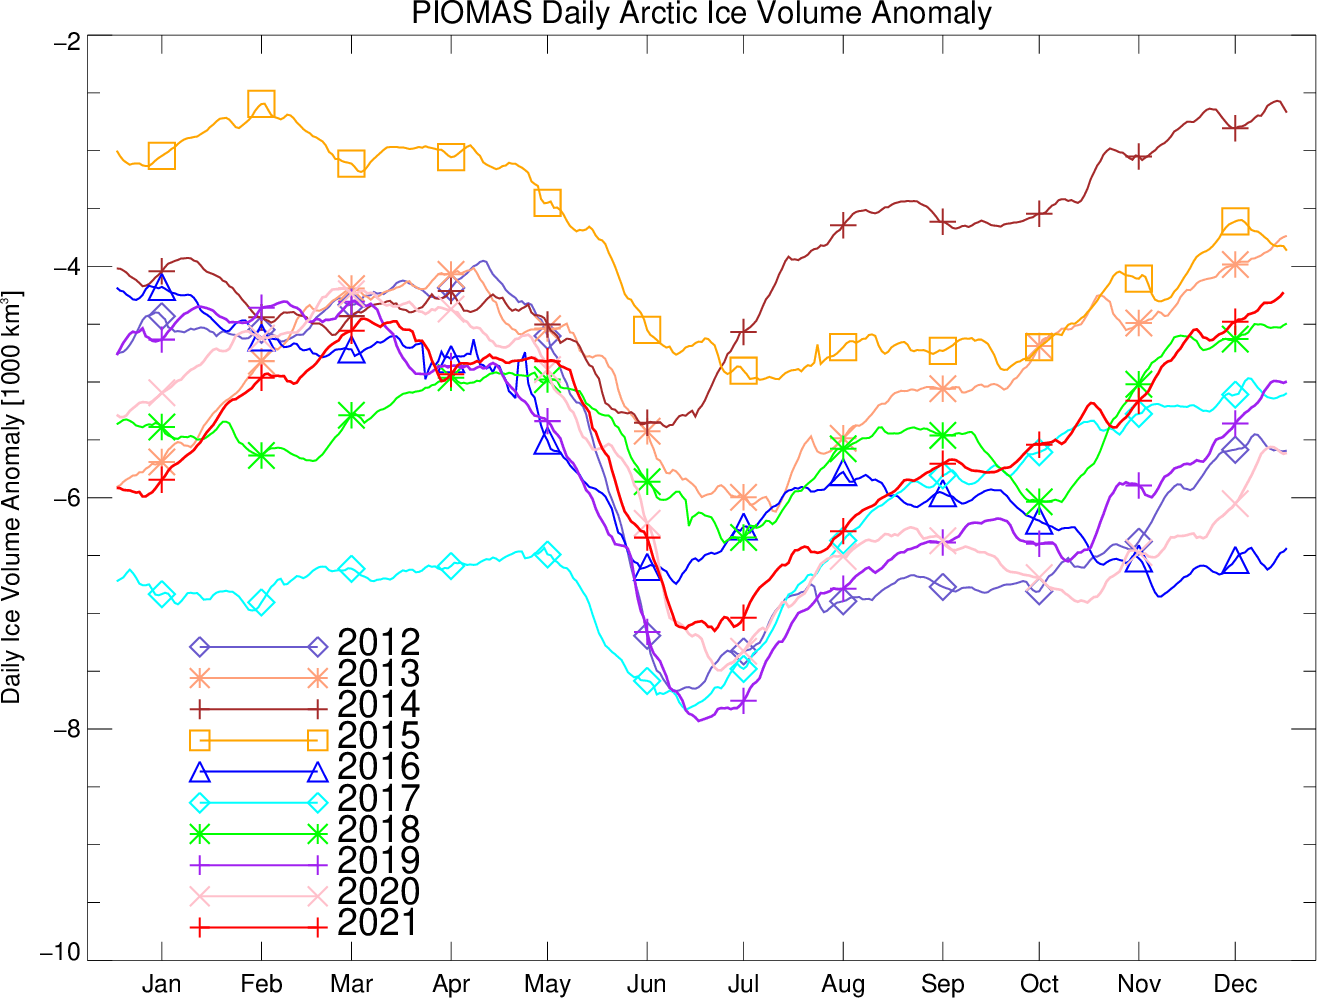
The Polar Science Center at the University of Washington has also released the PIOMAS volume data for March 2022:
Average Arctic sea ice volume in March 2022 was 21,700 km3. This value is the 6th lowest on record for March, about 2,200 km3 above the record set in 2017. Monthly ice volume was 38% below the maximum in 1979 and 25% below the mean value for 1979-2021:
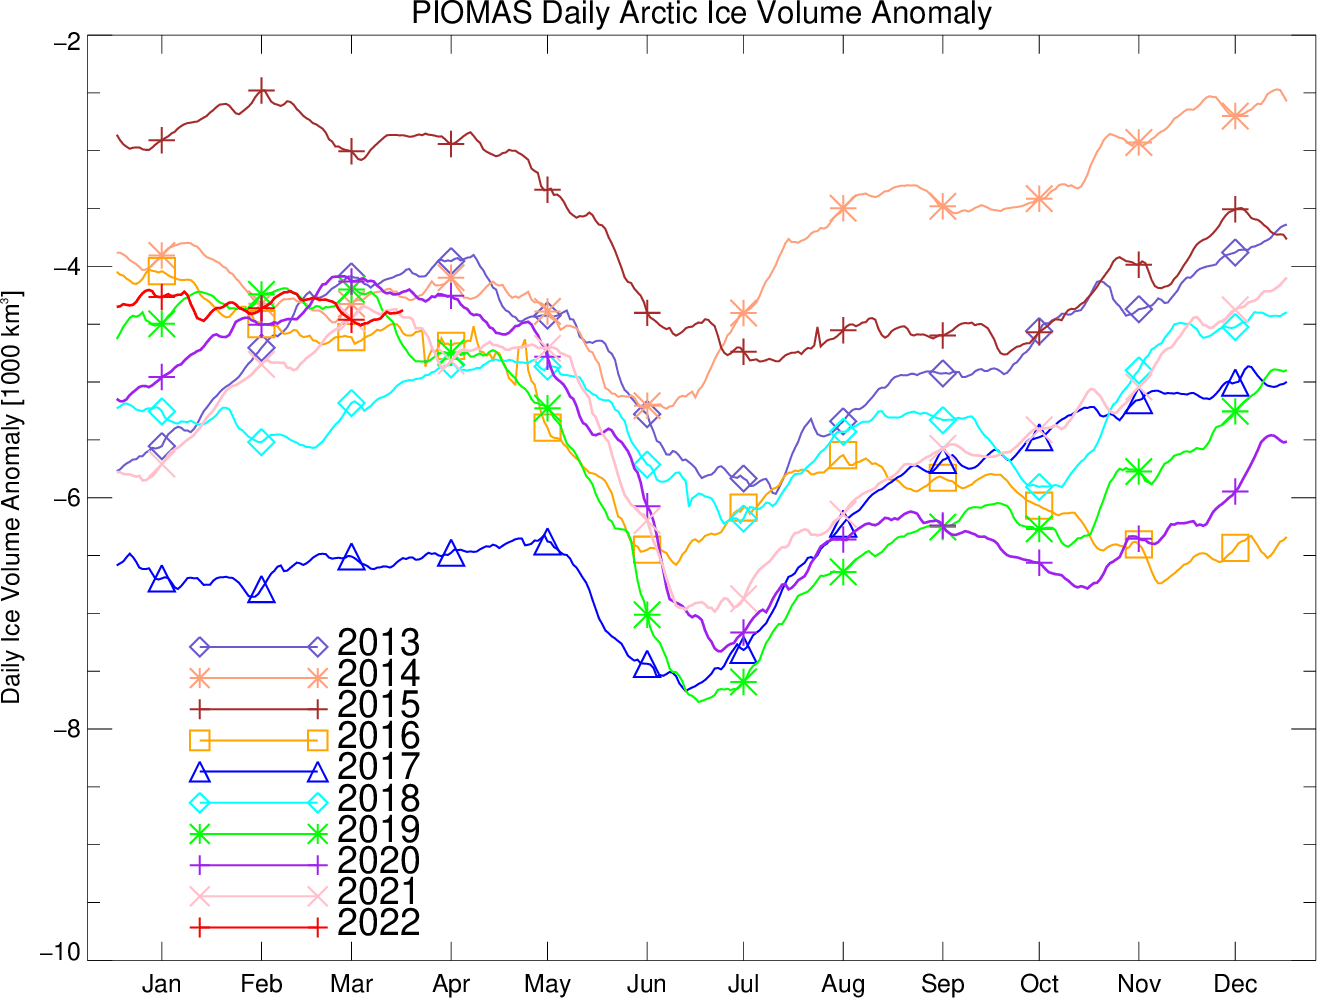
Ice growth anomalies for March 2022 continued to be at the upper end of the most recent decade with a mean ice thickness (above 15 cm thickness) at the middle of recent values:
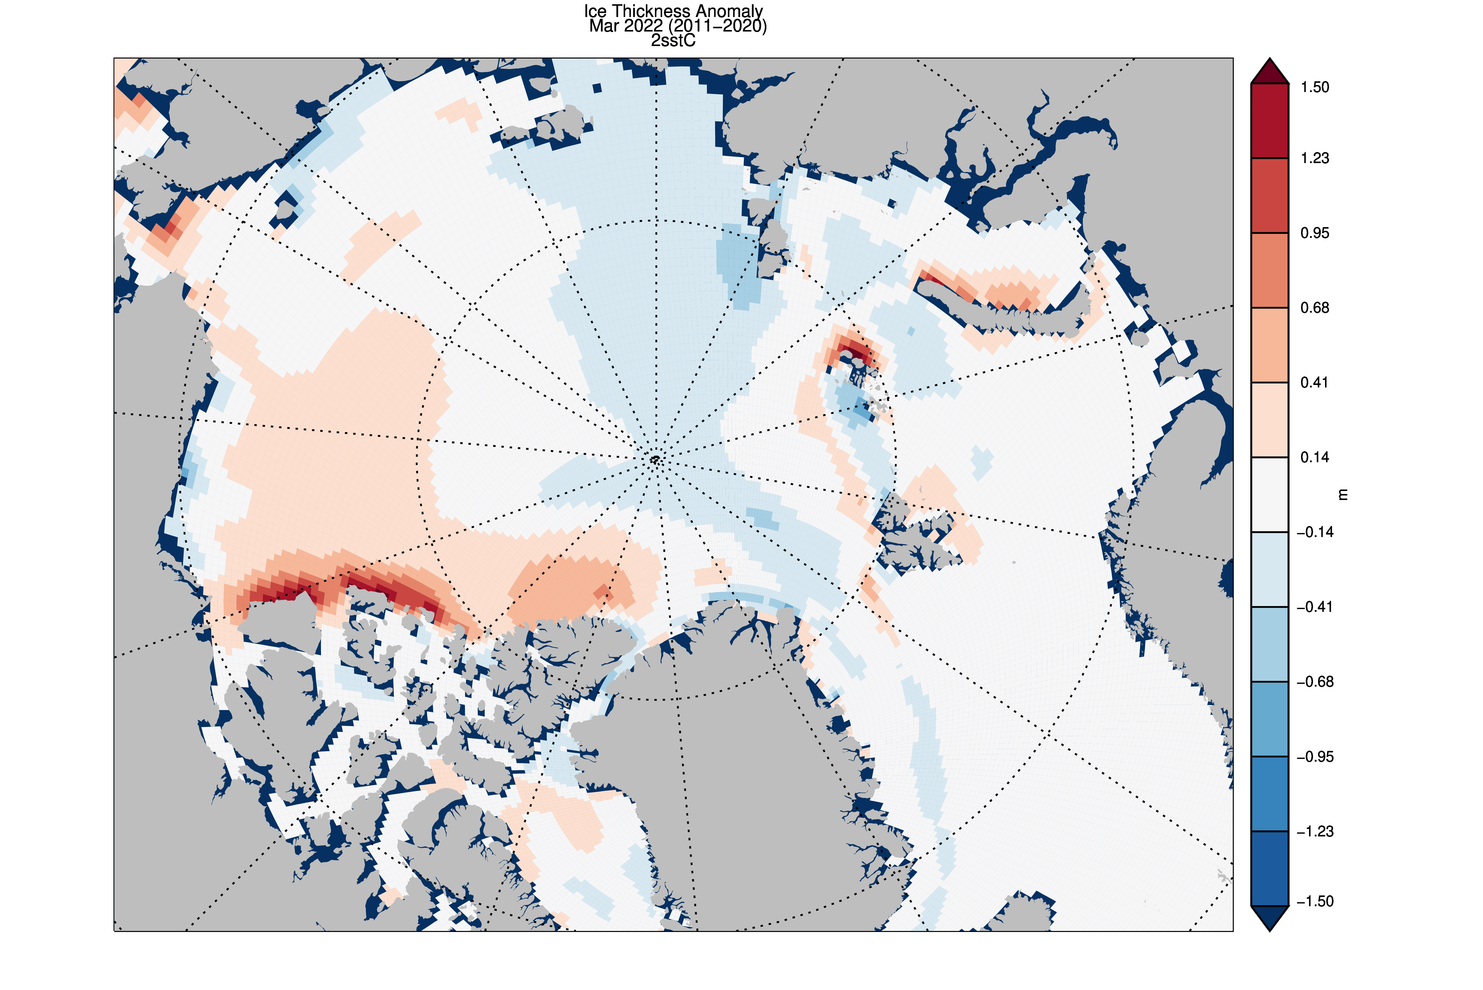
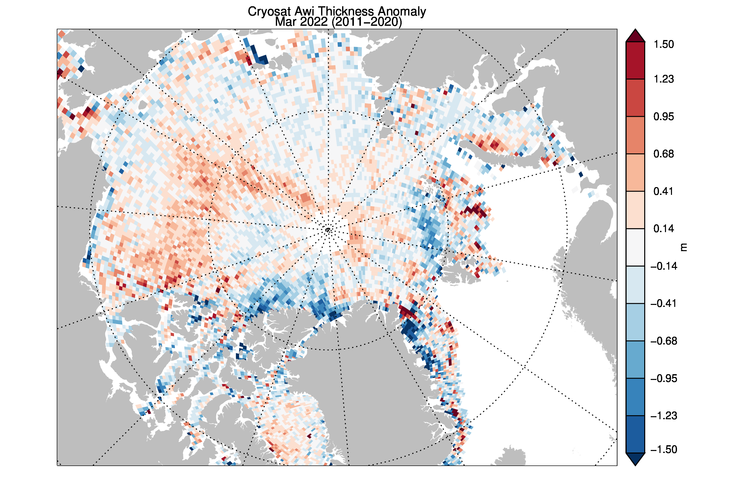
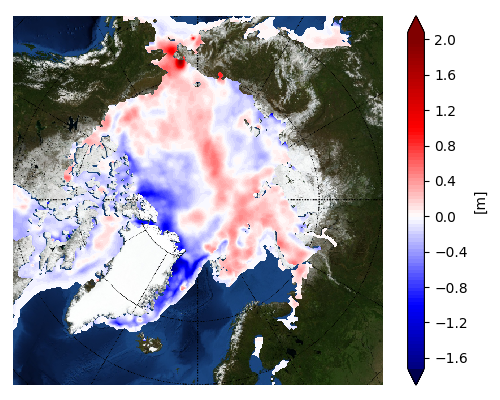
The ice thickness anomaly map for March 2022 relative to 2011-2020 divides the Arctic in two halves with positive anomalies in the “Western Arctic” but negative anomalies in “Eastern Arctic”. A narrow band of negative anomalies remains along the coast of North of Greenland but positive anomaly exists north of Baffin Island.
CryoSat 2 ice thickness shows an similar pattern of sea ice thickness anomalies though the areas North of Greenland and Baffin Bay show substantial differences:
[Edit – April 10th]
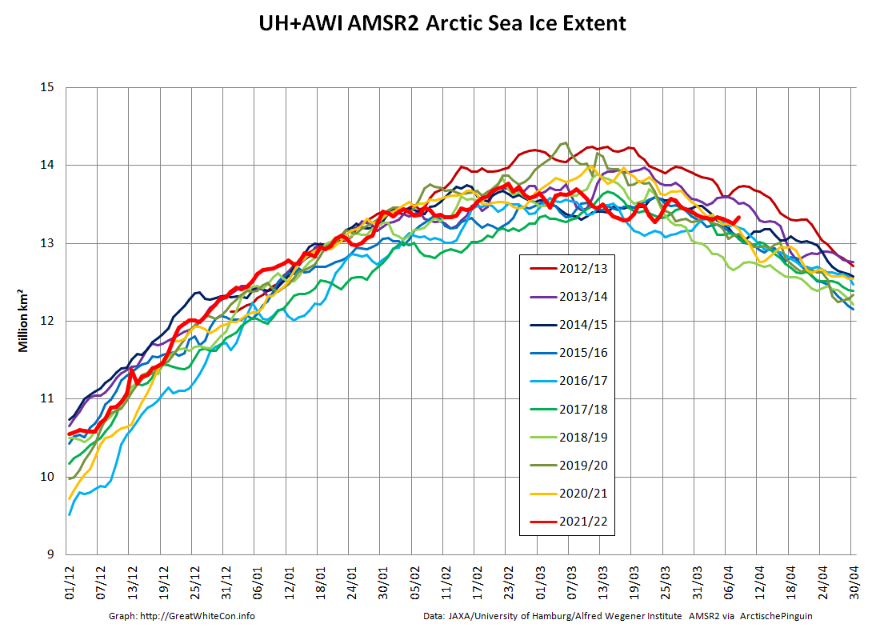
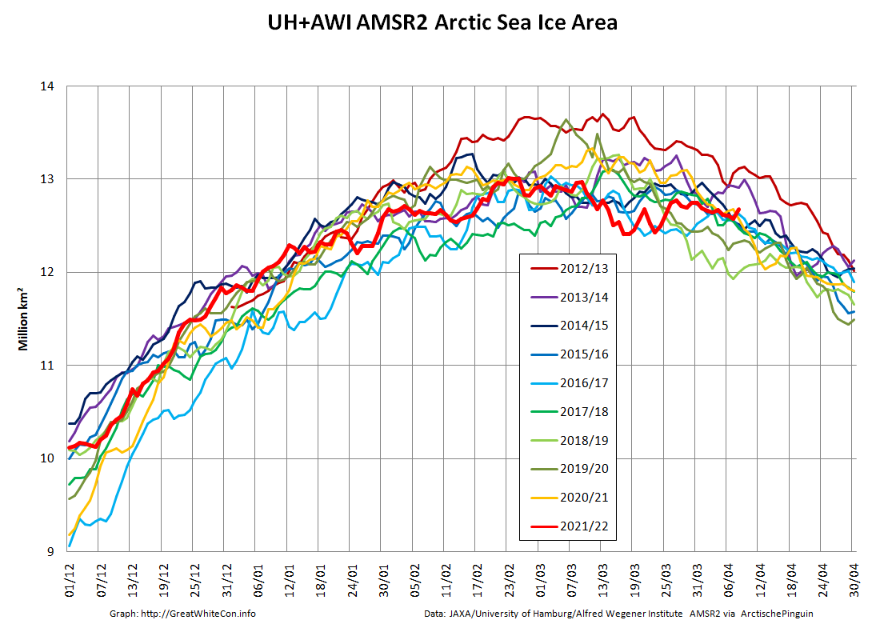
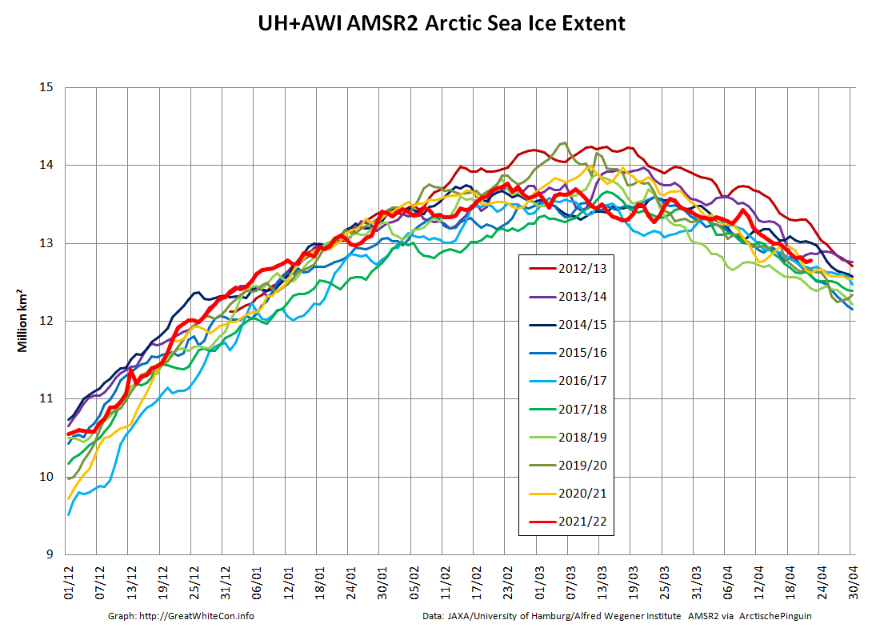
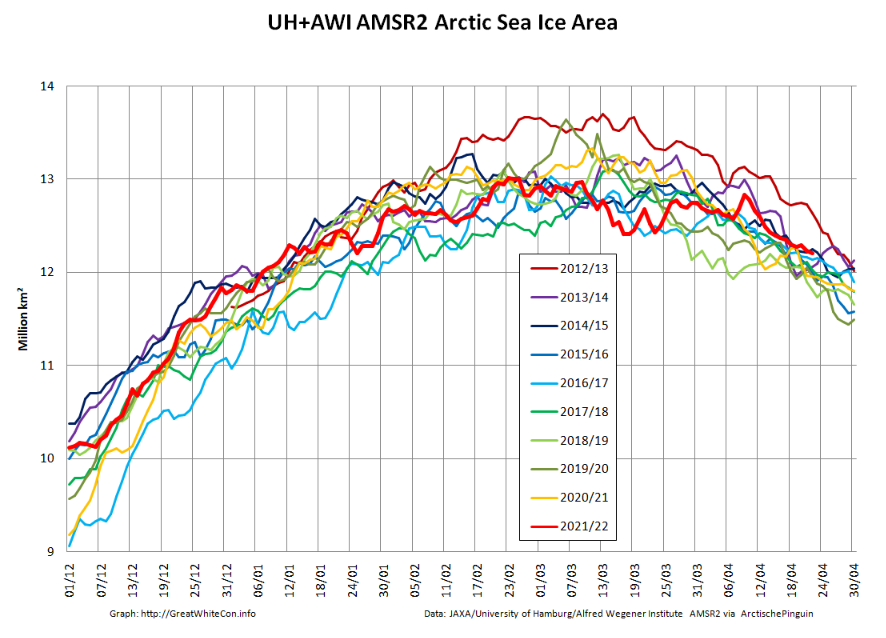
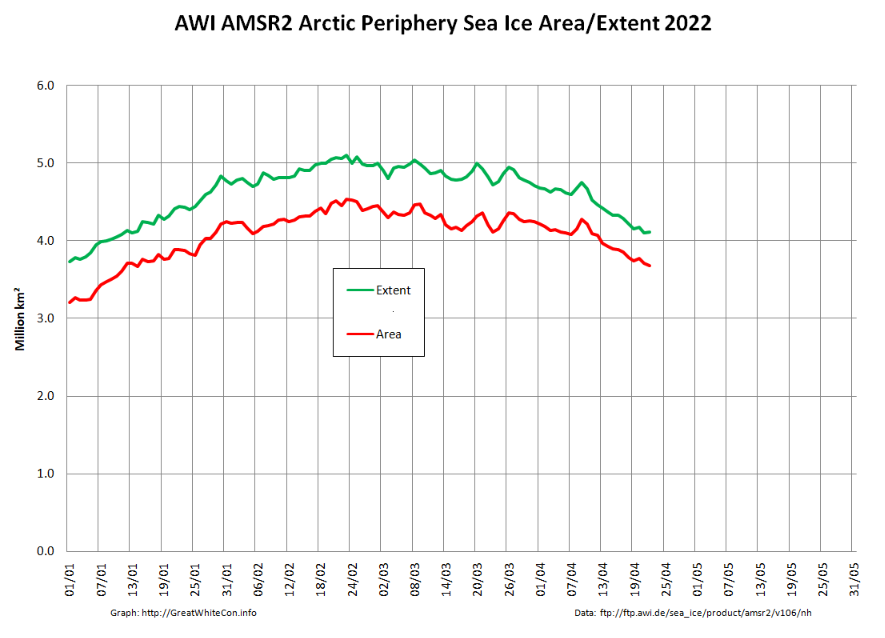
Here are the latest graphs of our favourite “high resolution” AMSR2 metrics, which combine recent data from the Alfred Wegener Institute with historical data from the University of Hamburg:
As you can see, there have indeed been a few ups and downs! Click the image below to see a 10 Mb animation of ice motion over the last few weeks:
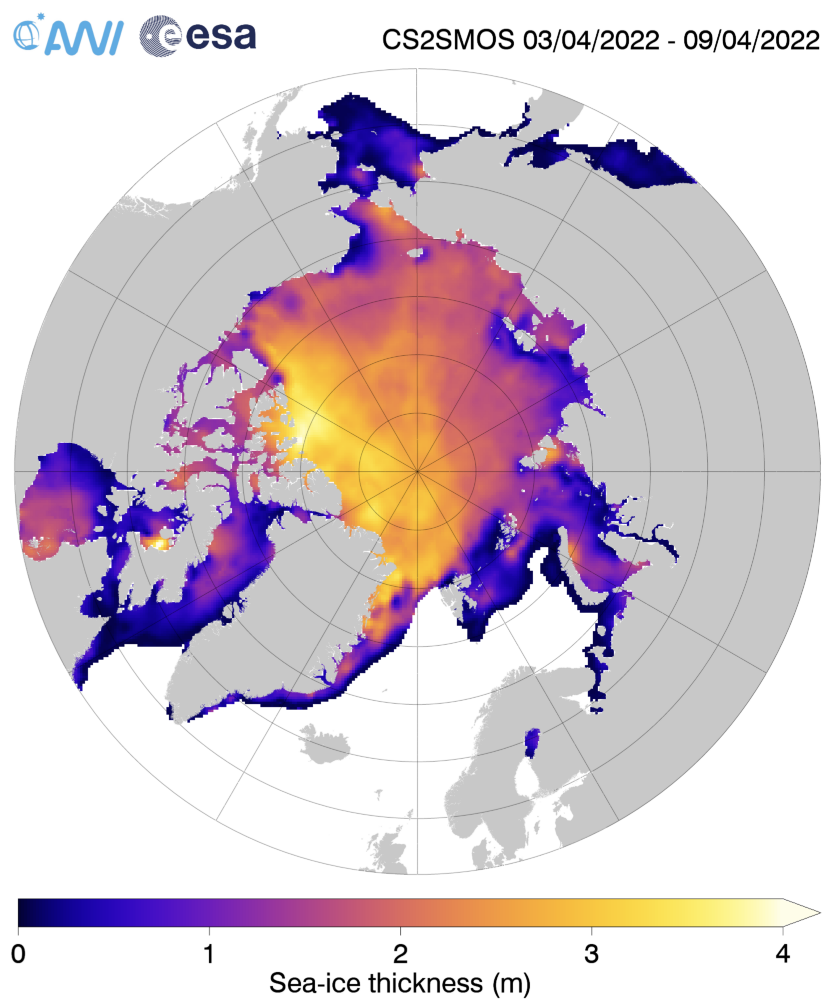
The obvious point to note at the moment is that there are currently long flaw leads on both the Siberian and Canadian sides of the Arctic Ocean. The animation also reveals episodes of open water in the Beaufort and Chukchi Seas, as well as north of Franz Josef Land and Svalbard.
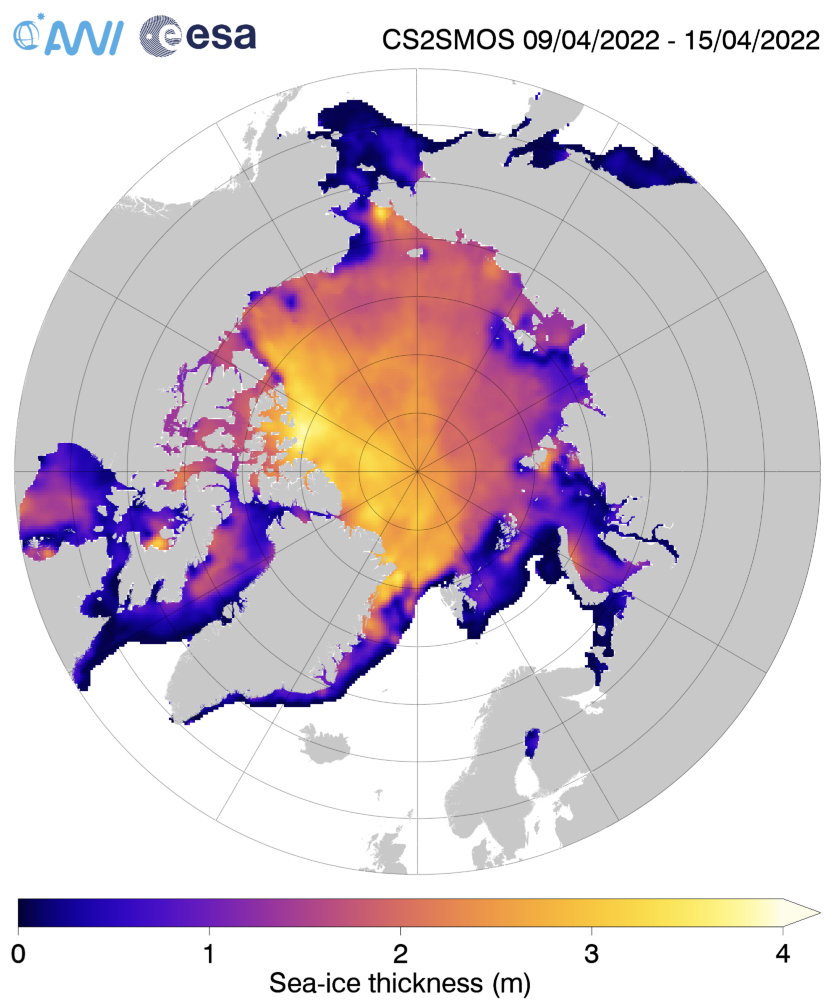
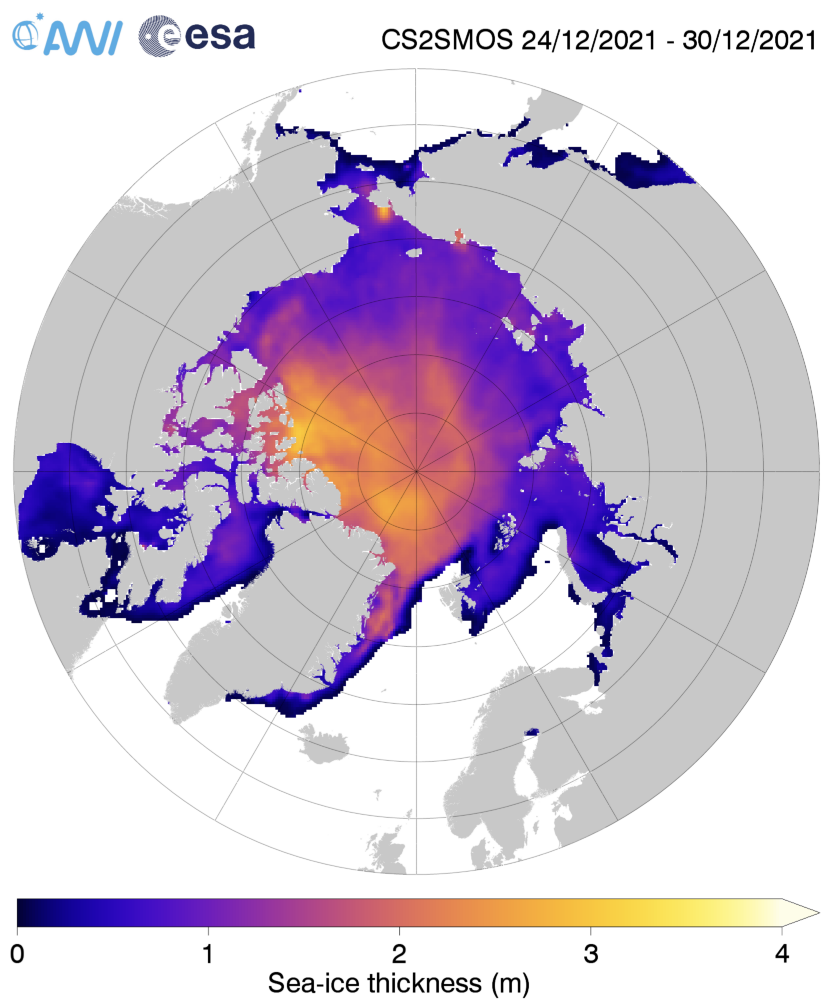
The ice in those areas is still very thin on the latest AWI CryoSat-2/SMOS sea ice thickness map:
[Edit – April 11th]
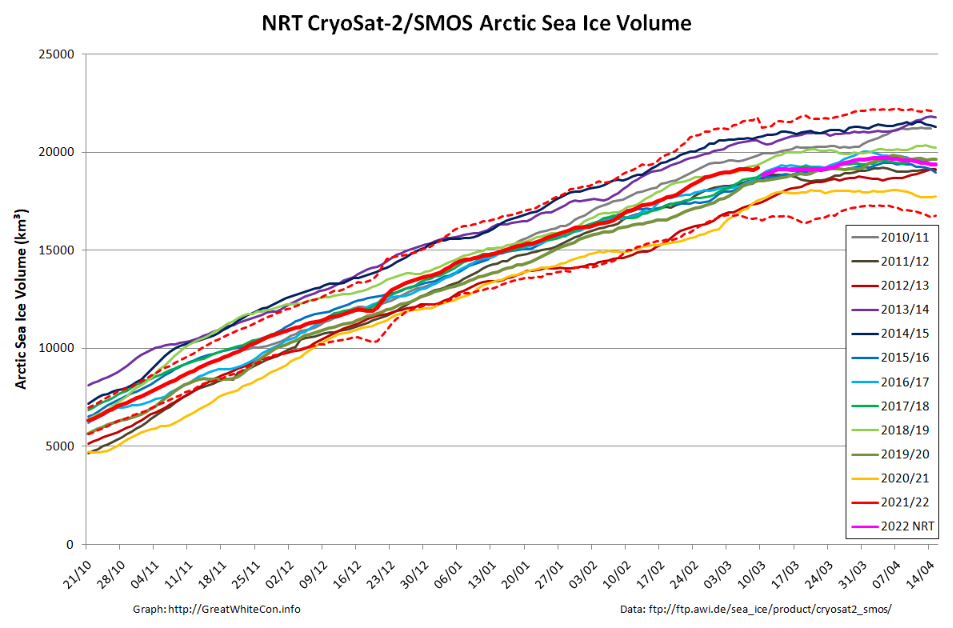
Here too is the latest AWI CryoSat-2/SMOS volume graph:
The reanalysed data is now showing something of a surge towards the end of February.
[Edit – April 23rd]
Here’s the last “near real time” AWI CryoSat-2/SMOS Arctic sea ice thickness map for Spring 2022:
The significantly thinner areas in the Beaufort and Chukchi Seas are even more pronounced than previously. Here also is the associated CS2/SMOS volume graph:
The 2022 maximum volume based on NRT data is 19719 km³ on April 5th. Expect that to be revised upwards when the reanalysed data is ultimately published.
Going back to 2 dimensions, the assorted “ups and downs” now seem to have resolved into the melting season proper:
The peripheral sea have been responsible for most of the recent decline:
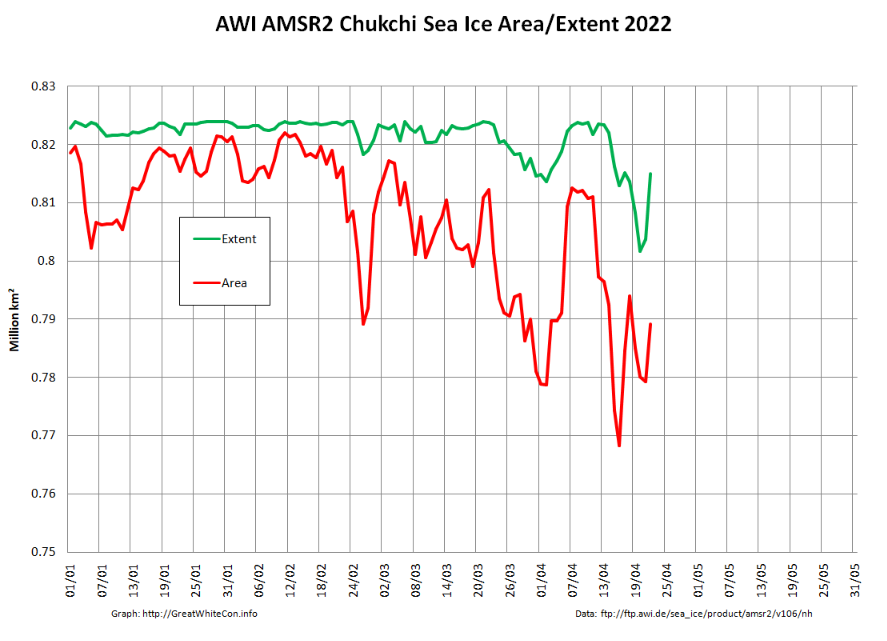
However as mentioned above, the Chukchi Sea has been experiencing some ups and downs of its own. Perhaps the sun is now high enough in the sky for the most recent “down” to stick around for the summer?
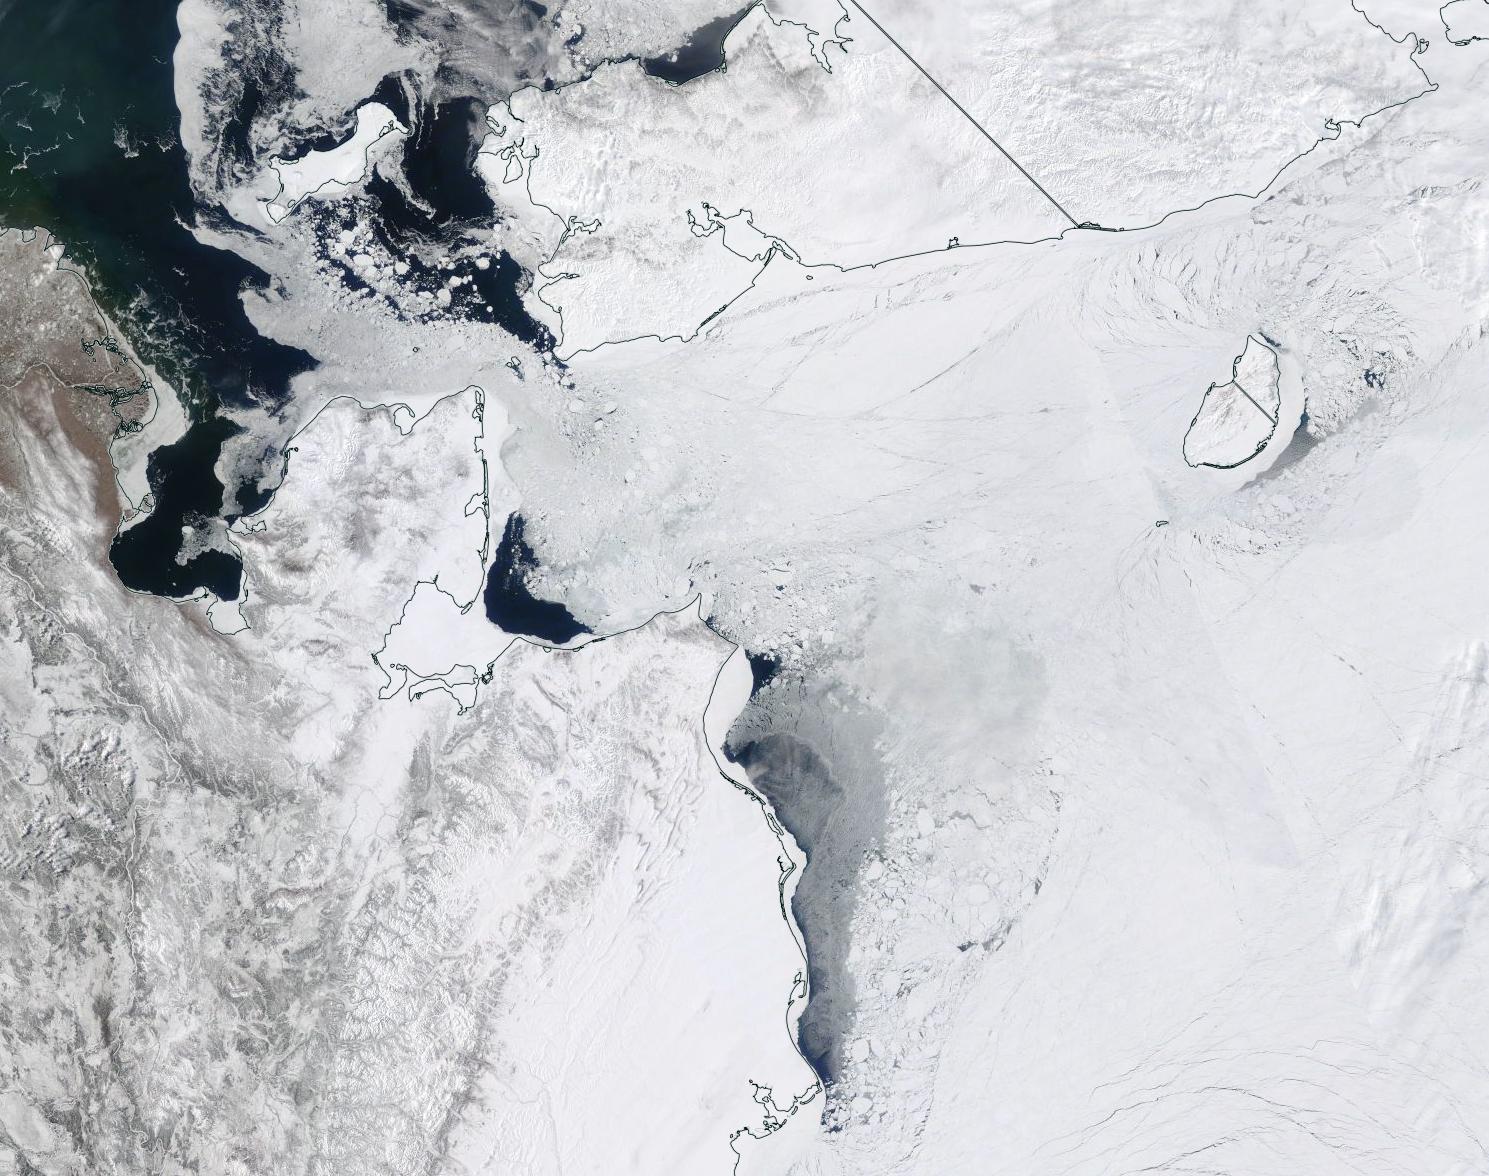
“True colour” image of the Chukchi Sea on April 21st from the MODIS instrument on the Terra satellite[Edit – April 24th]
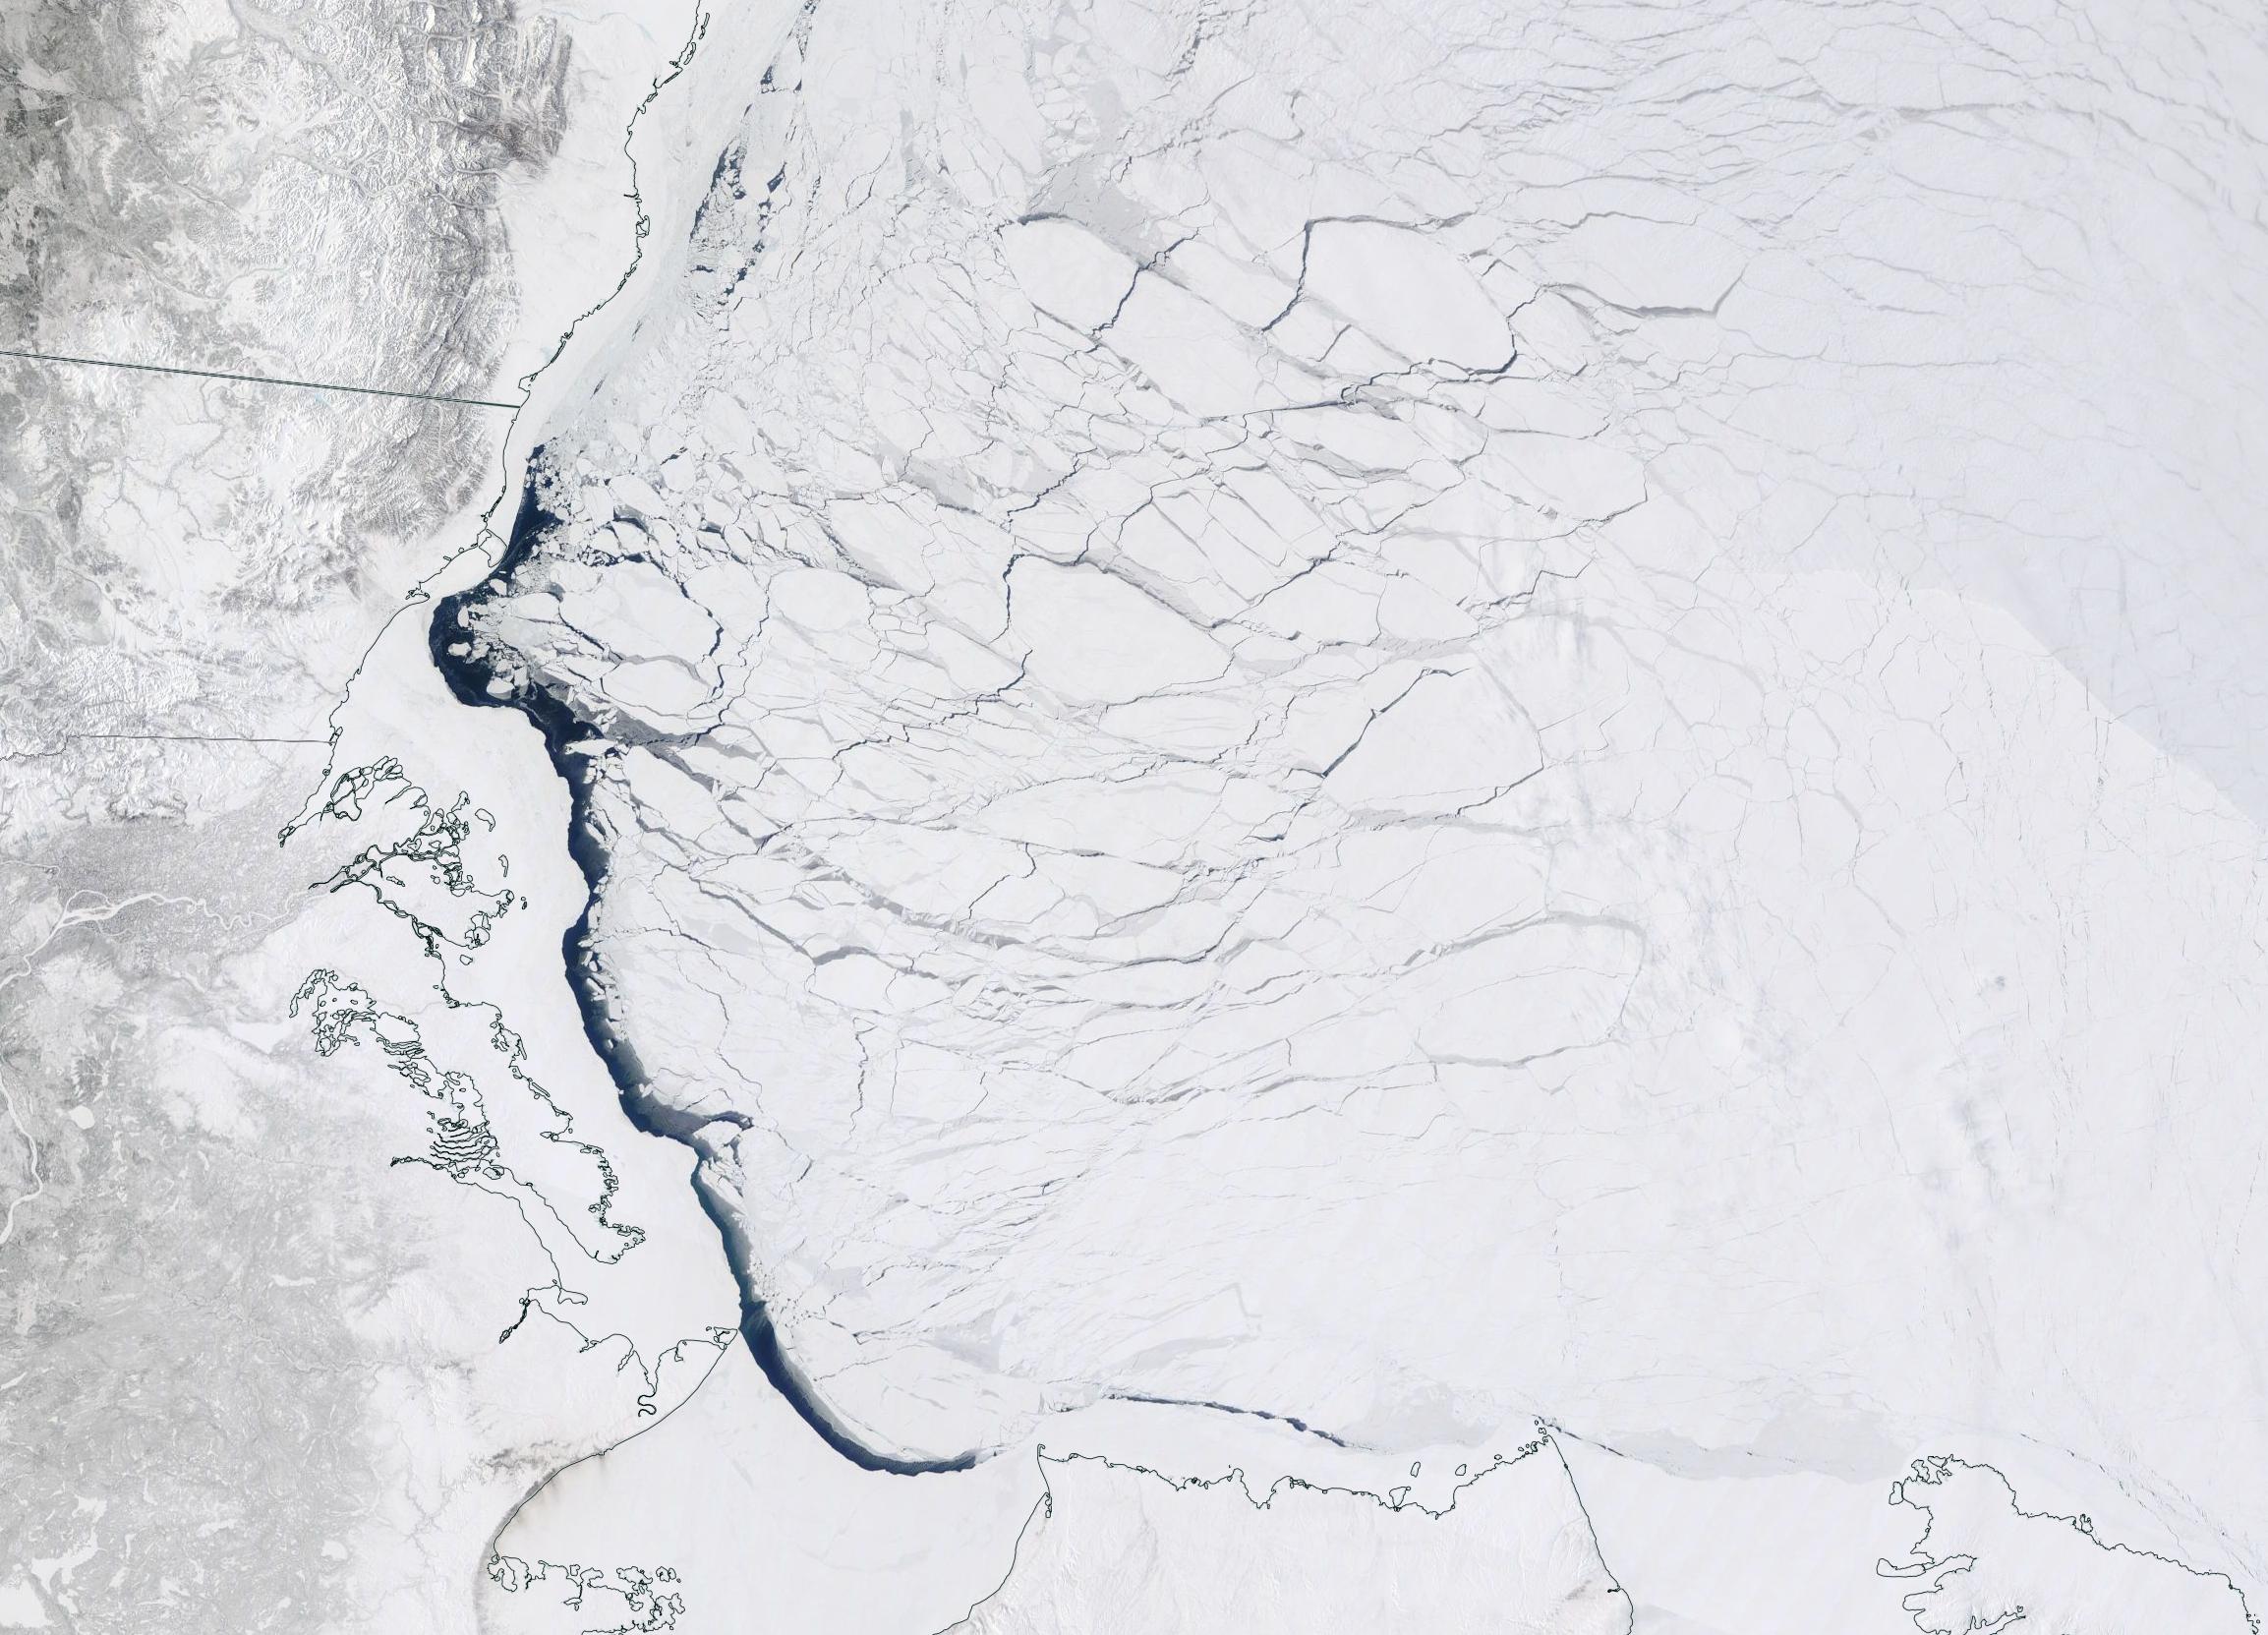
Over the last couple of days some open water has appeared in the Beaufort Sea off the Mackenzie Delta:
“True colour” image of the Beaufort Sea on April 23rd from the MODIS instrument on the Terra satellite [Edit – April 25th]
Especially for Taylor, here’s the GFS Arctic snow depth forecast for 10 days into the future:
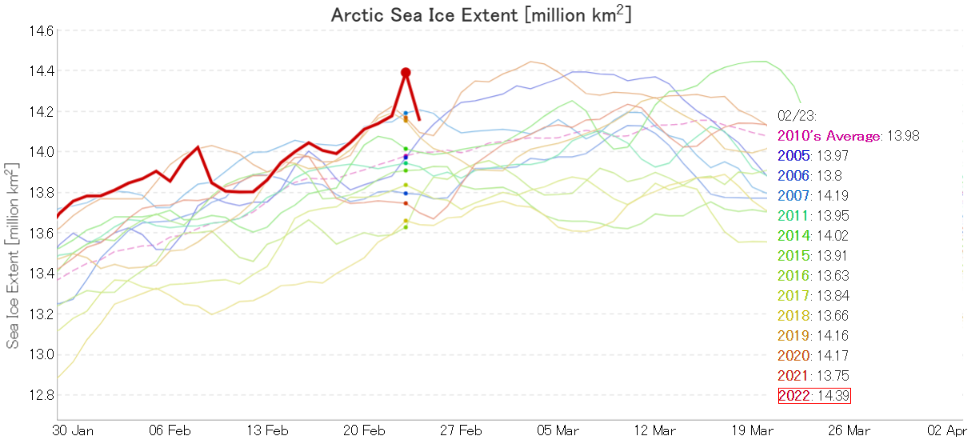
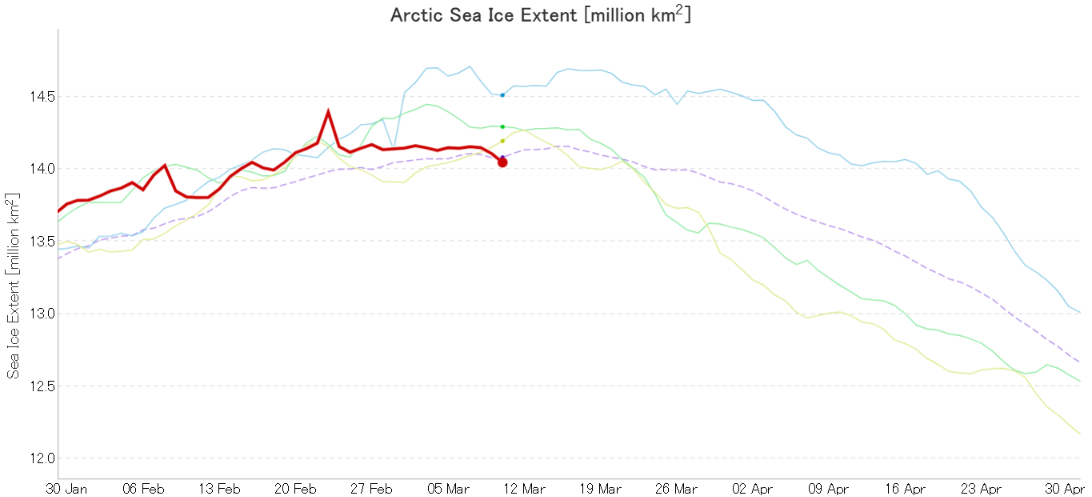
Here’s the latest graph of Arctic sea ice extent from JAXA/ViSHOP, which looks a bit unusual to say the least:
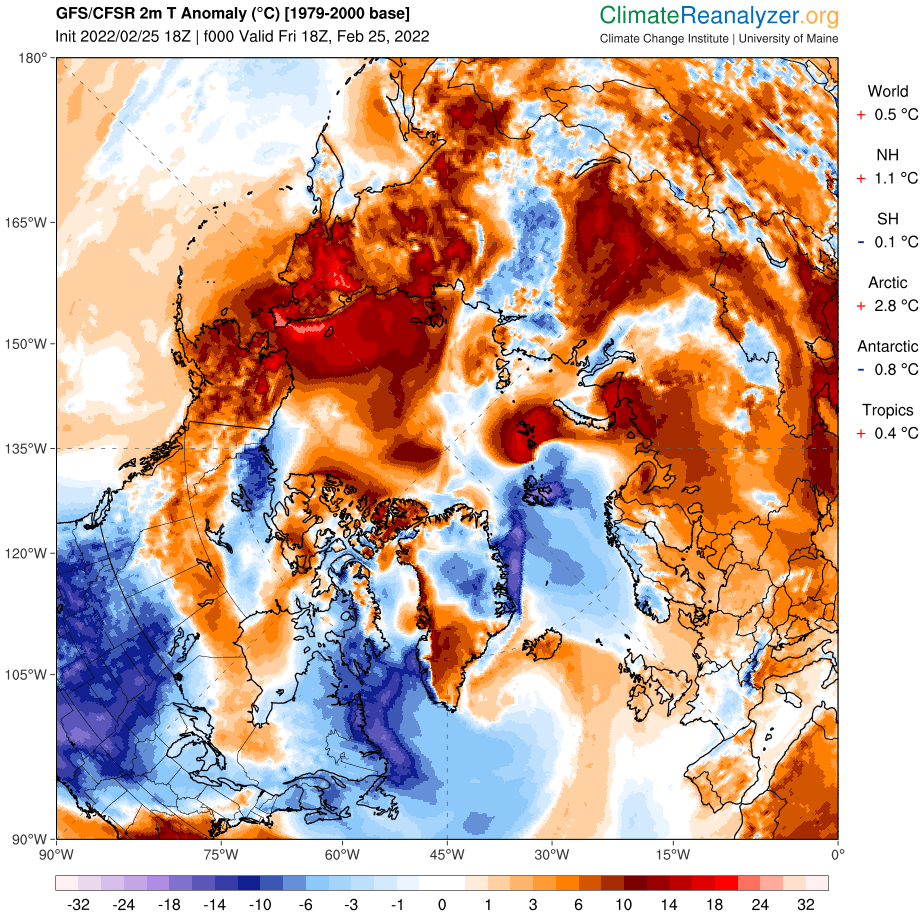
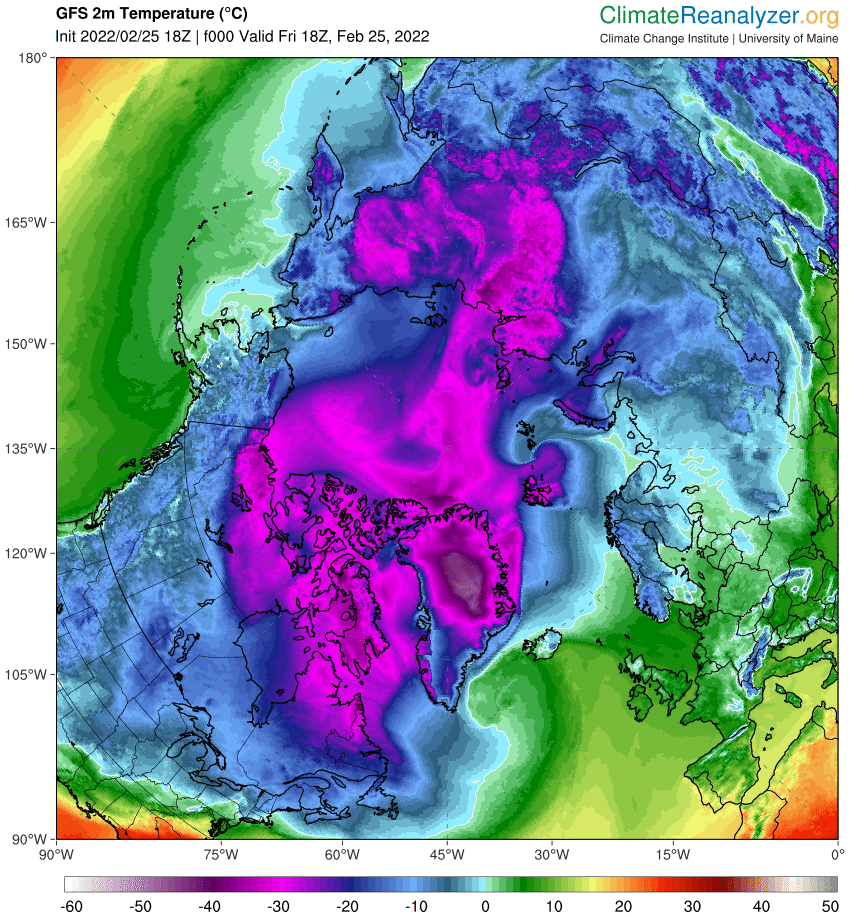
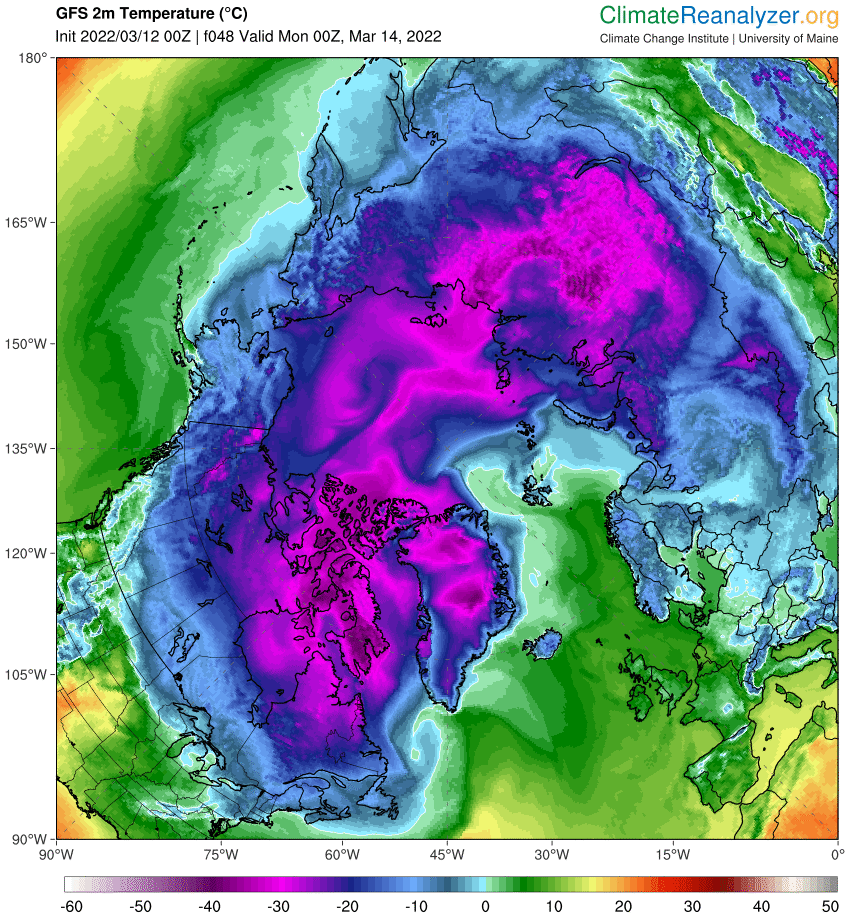
It certainly caught my eye! Could that sudden peak on February 23rd be the maximum extent for the year? To be frank it looks more like an artifact in the underlying gridded AMSR2 concentration data, but it’s not wholly beyond the bounds of possibility. The Pacific side of the Arctic is anomalously warm at the moment:
and parts of the Bering Sea are above freezing point:
For the moment then the (extremely!) provisional JAXA Arctic sea ice maximum extent for 2022 is 14.39 million km².
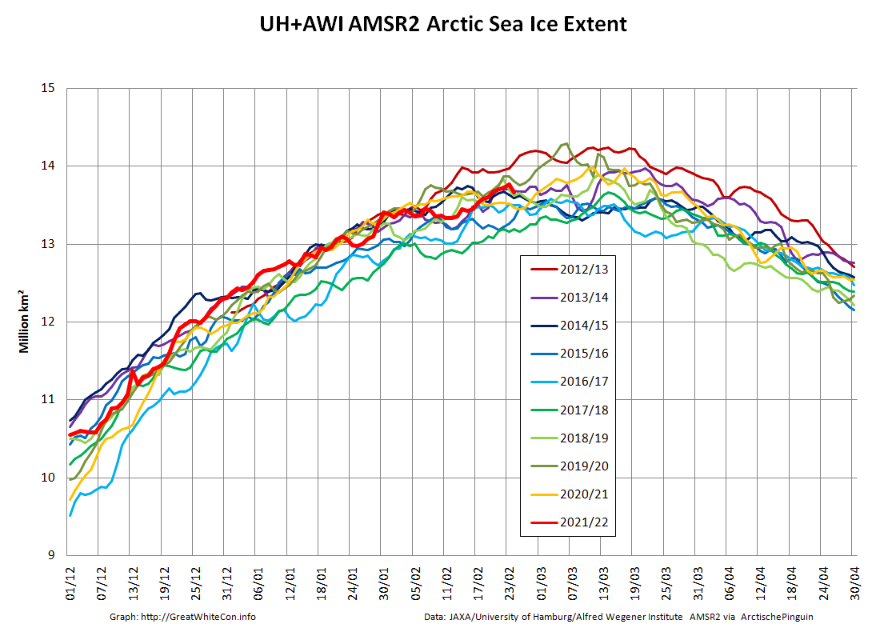
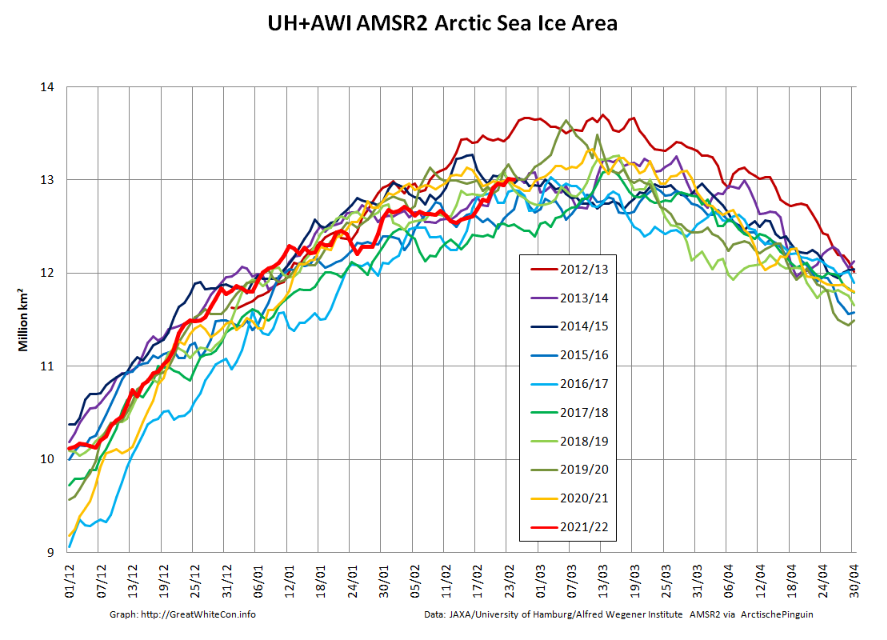
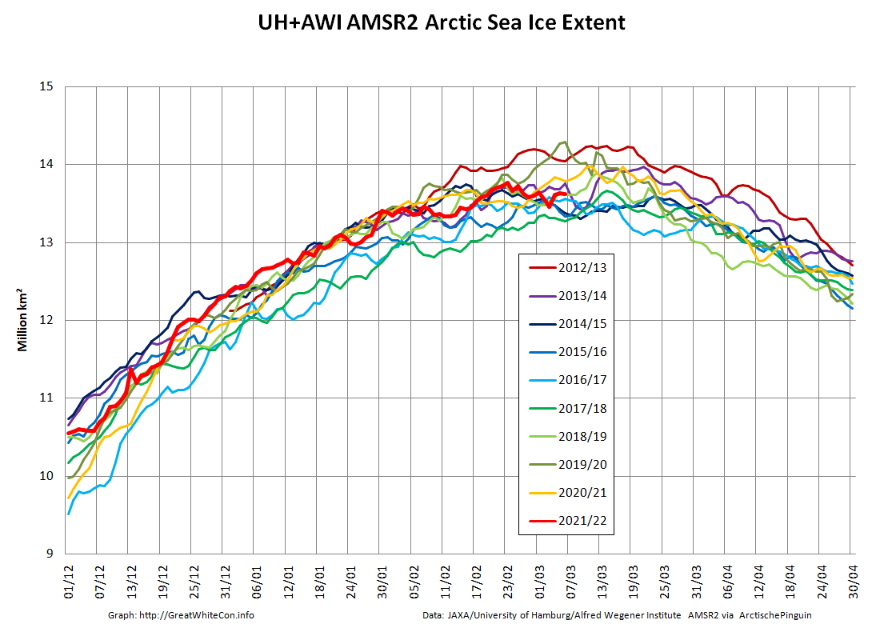
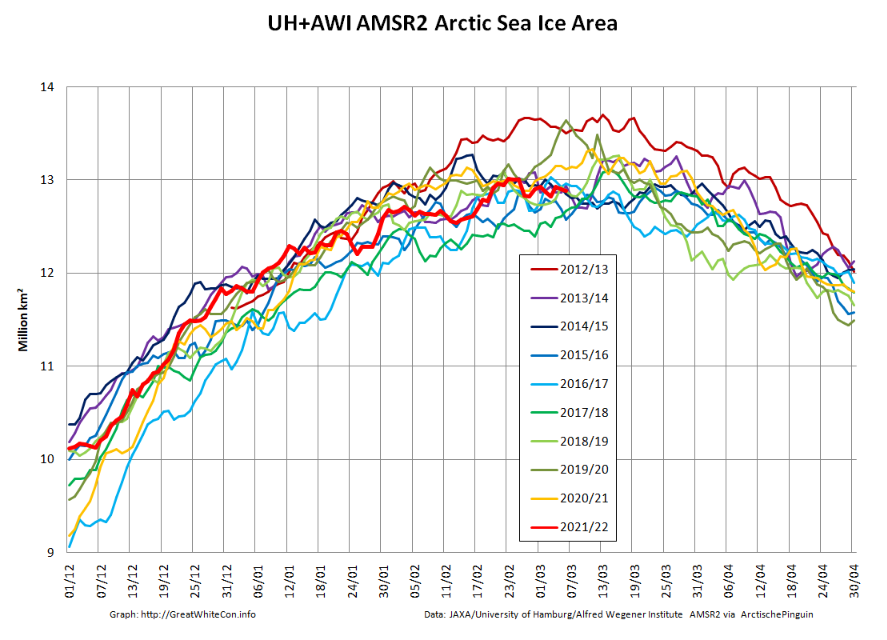
By way of an AMSR2 second opinion let’s also take a look at our favourite “high resolution” AMSR2 metrics, which combine recent data from the Alfred Wegener Institute with historical data from the University of Hamburg:
The extent peak on the 23rd is of much smaller magnitude, and it’s almost non existent on the area graph.
Curiouser and curiouser.
[Edit – March 1st]
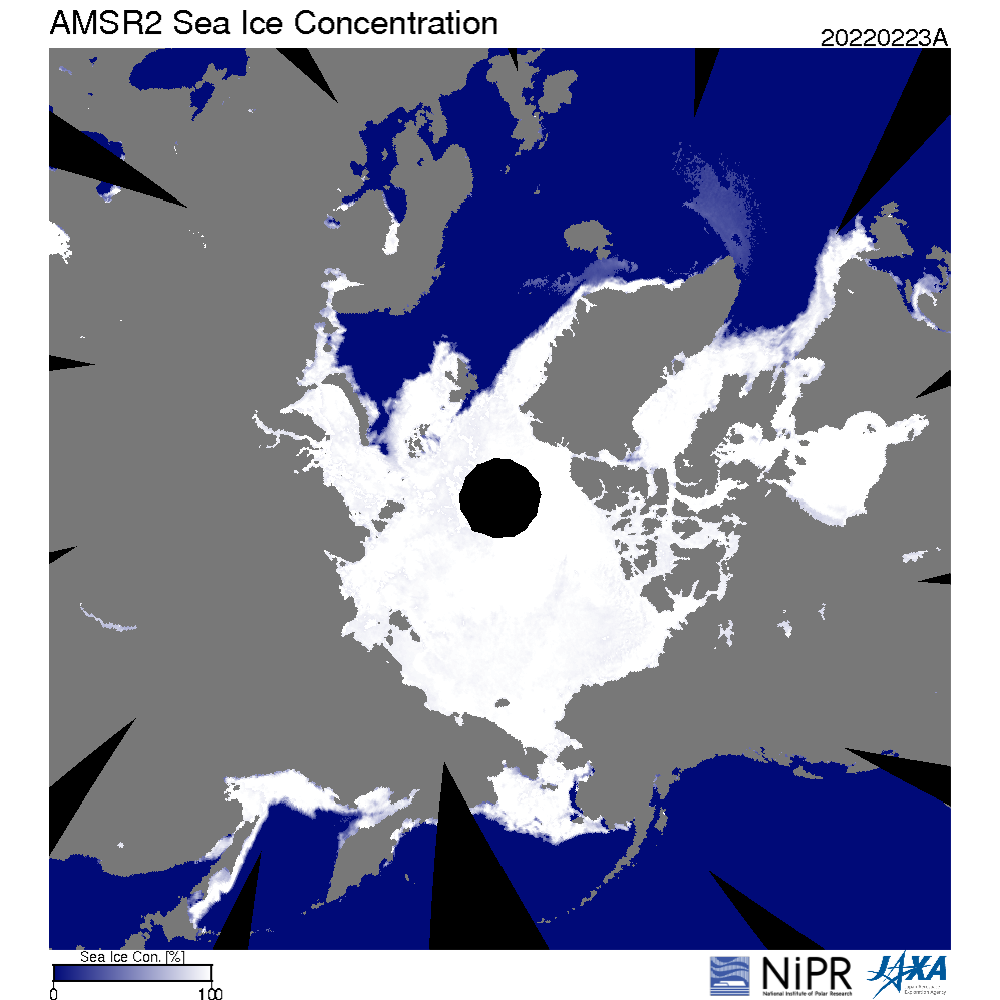
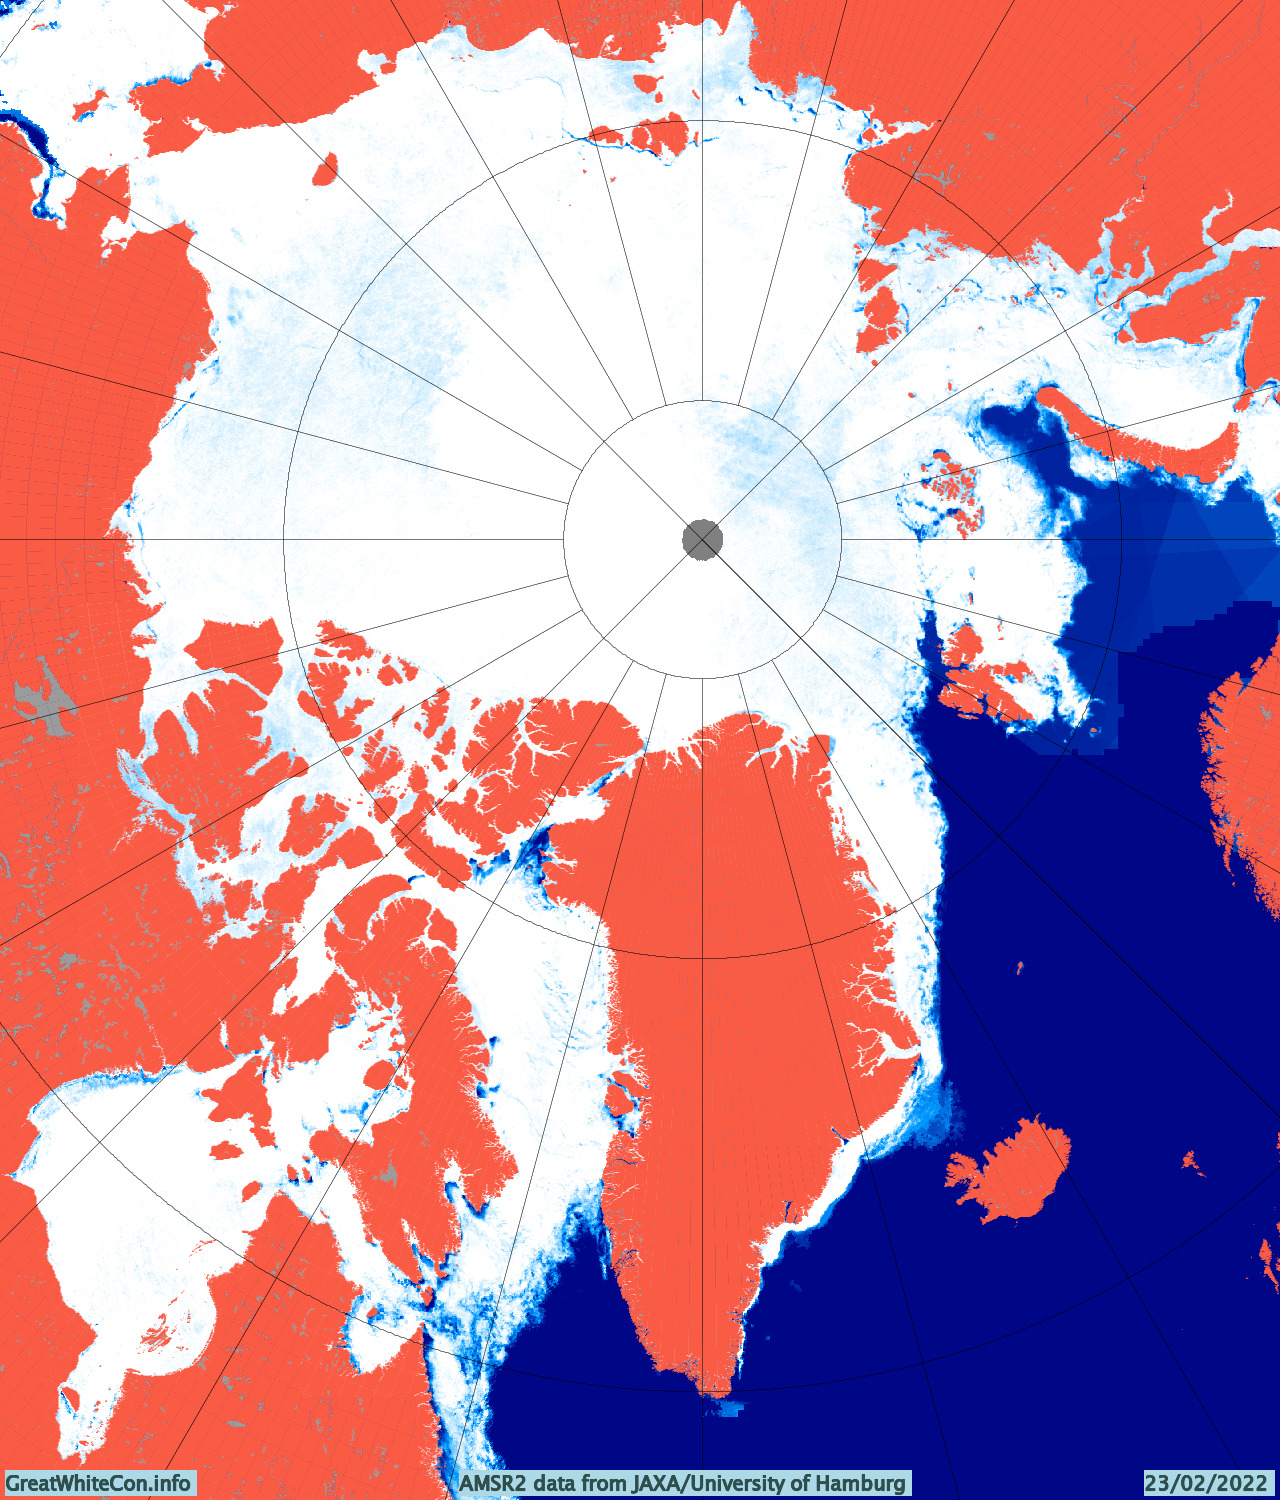
The JAXA maximum on February 23rd is definitely an artifact of dodgy AMSR2 data. Take a look at the Denmark Strait between Greenland and Iceland in particular:
The University of Hamburg version also shows an anomaly in the Barents Sea:
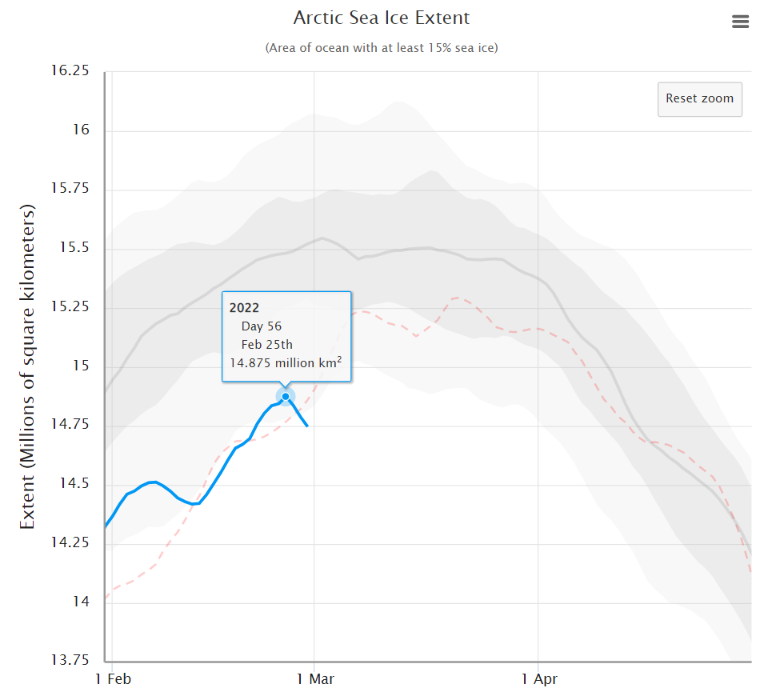
However the 5 day averaged NSIDC extent graph now shows a significant peak on February 25th:
Is anybody willing to put money on 14.875 million km² just yet?
[Edit – March 7th]
Here are the latest “high resolution” AMSR2 graphs:
The February 23rd maximum holds, for the moment at least.
[Edit – March 11th]
Here’s the latest JAXA Arctic sea ice extent graph:
A late surge is now looking exceedingly unlikely. However given that the maximum seems to have occurred during the brief period of dodgy data around February 23rd, what magnitude and date should be assigned to the 2022 maximum?
Whilst I ponder that thorny problem…
[Edit – March 12th]
Now I’ve really gone and done it! Started the “2022 melting season” thread on the Arctic Sea Ice Forum that is:
Arctic sea ice has likely reached its maximum extent for the year, at 14.88 million square kilometers (5.75 million square miles) on February 25. The 2022 maximum is the tenth lowest in the 44-year satellite record. On the same day, on the other pole, Antarctic sea ice reached a record minimum extent, at 1.92 million square kilometers (741,000 square miles).
The date of the maximum this year, February 25, was fifteen days earlier than the 1981 to 2010 average date of March 12. Only two years had an earlier maximum, 1987 and 1996, both on February 24. This year is the second earliest date on the satellite record, tying with 2015, which also reached its maximum extent on February 25.
2021 has been and gone, so first of all may I wish all our readers a very Happy New Year.
Sadly it’s not been a happy start to 2022 for the inhabitants of Boulder, Colorado, home of the National Snow and Ice Data Center. According to the Denver Post:
The Marshall fire destroyed an estimated 991 homes in Boulder County, damaged 127 more and may have killed three people, Sheriff Joe Pelle said Saturday afternoon.
Pelle added that the cause of the fire — the most damaging in Colorado history — remains under investigation, and confirmed that sheriff’s officials have served a search warrant on at least one property based on a tip.
Currently, two people are missing in Superior and another is missing in the Marshall area, Pelle said. All three are feared dead as each of their homes was lost to the fire, the sheriff said…
So far, officials say Thursday’s wildfire — exacerbated by 100-mph winds — burned more than 6,000 acres across Boulder County.
The fire destroyed 553 homes in Louisville, damaging 45, Pelle said Saturday. It also destroyed 332 homes in Superior, damaging 60 in that town, and destroyed 106 homes in unincorporated Boulder County, damaging 22…
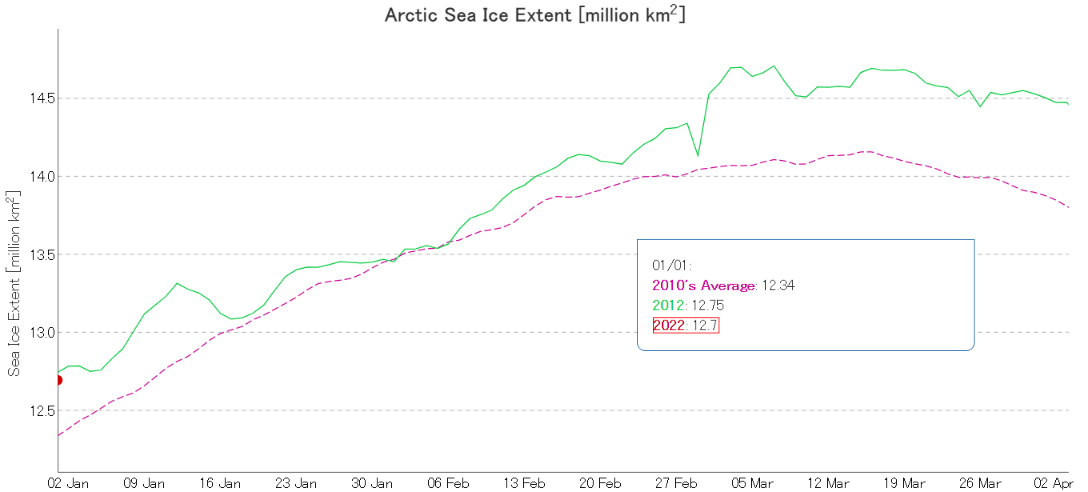
Moving north to examine snow and ice data from the Arctic, let’s start 2022 in traditional fashion with a look at high resolution AMSR2 area and extent:
Both metrics are now near the upper boundary of the last 10 years’ range. The AMSR2 instrument wasn’t launched into orbit until summer 2012, but according to both JAXA and NSIDC data extent on January 1st 2022 is almost identical to the same date in 2012. Regular readers will recall that year went on to produce the lowest annual minimum extent in the satellite era despite recording the highest annual maximum in the decade of the 2010s:
Note that sea ice volume tells a rather different story. Here’s the latest AWI CryoSat-2/SMOS volume graph:
The current near real time data is likely to be revised upwards slightly when the final reanalysis is complete, but even so volume seems likely to remain in the lower half of the recent range at the end of 2021.
Once again the ice in the so called “last ice area” north of Greenland and Ellesmere Island is thinner than usual, as is the ice in the Fram Strait and East Greenland Sea.
[Edit – January 11th]
As has been pointed out below, the Polar Science Center has now released the PIOMAS volume data for December 2021:
Average Arctic sea ice volume in December 2021 was 13,300 km3. This value is the 9th lowest on record for December, about 2100 km3 above the record set in 2016. Monthly ice volume was 51% below the maximum in 1979 and 37% below the mean value for 1979-2020. Average December 2021 ice volume was 1.2 standard deviations above the 1979-2020 trend line.
November and December of 2021 saw relative rapid ice growth for recent years, bringing the mean ice thickness (above 15 cm thickness) towards the thicker end of the recent values.
The ice thickness anomaly map for December 2021 relative to 2011-2020 continues to show anomalies divided into positive and a negative halves with areas of positive anomalies increasing since the two prior months and stretching from the Beaufort, over the pole and into the Barents. Negative anomalies stretching from Fram Strait, North of Greenland and along the Canadian Archipelago. Areas North of Greenland again feature low ice thickness as in prior years.
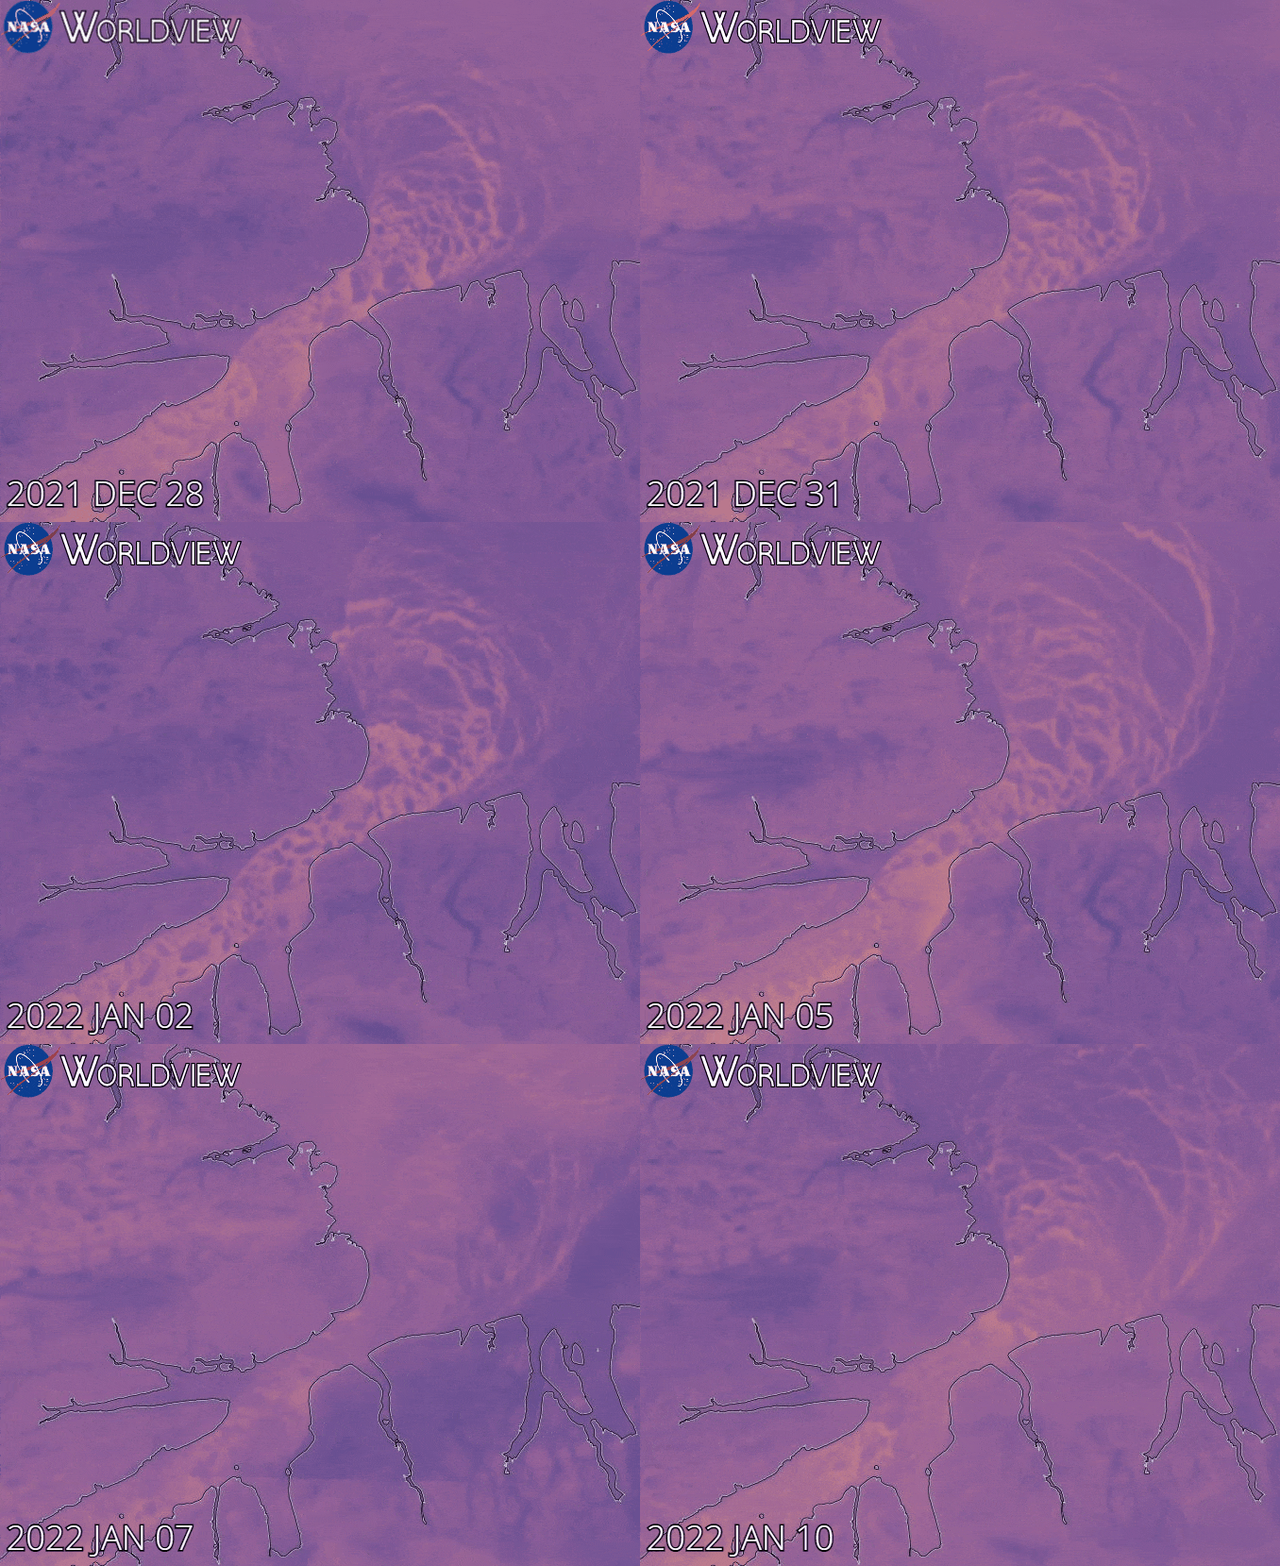
Note that as revealed by this animation from NASA Worldview the sea ice in the Lincoln Sea is currently still breaking up and being exported from the Central Arctic via the Nares Strait:
[Edit – January 25th]
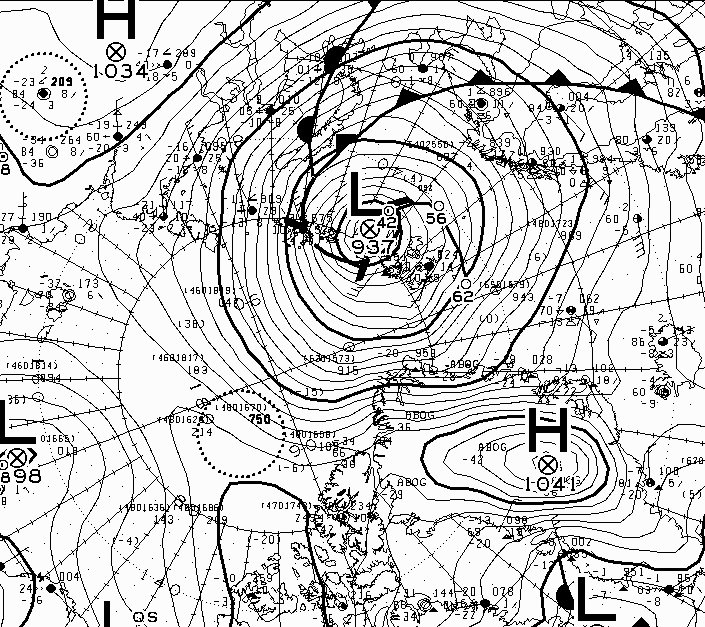
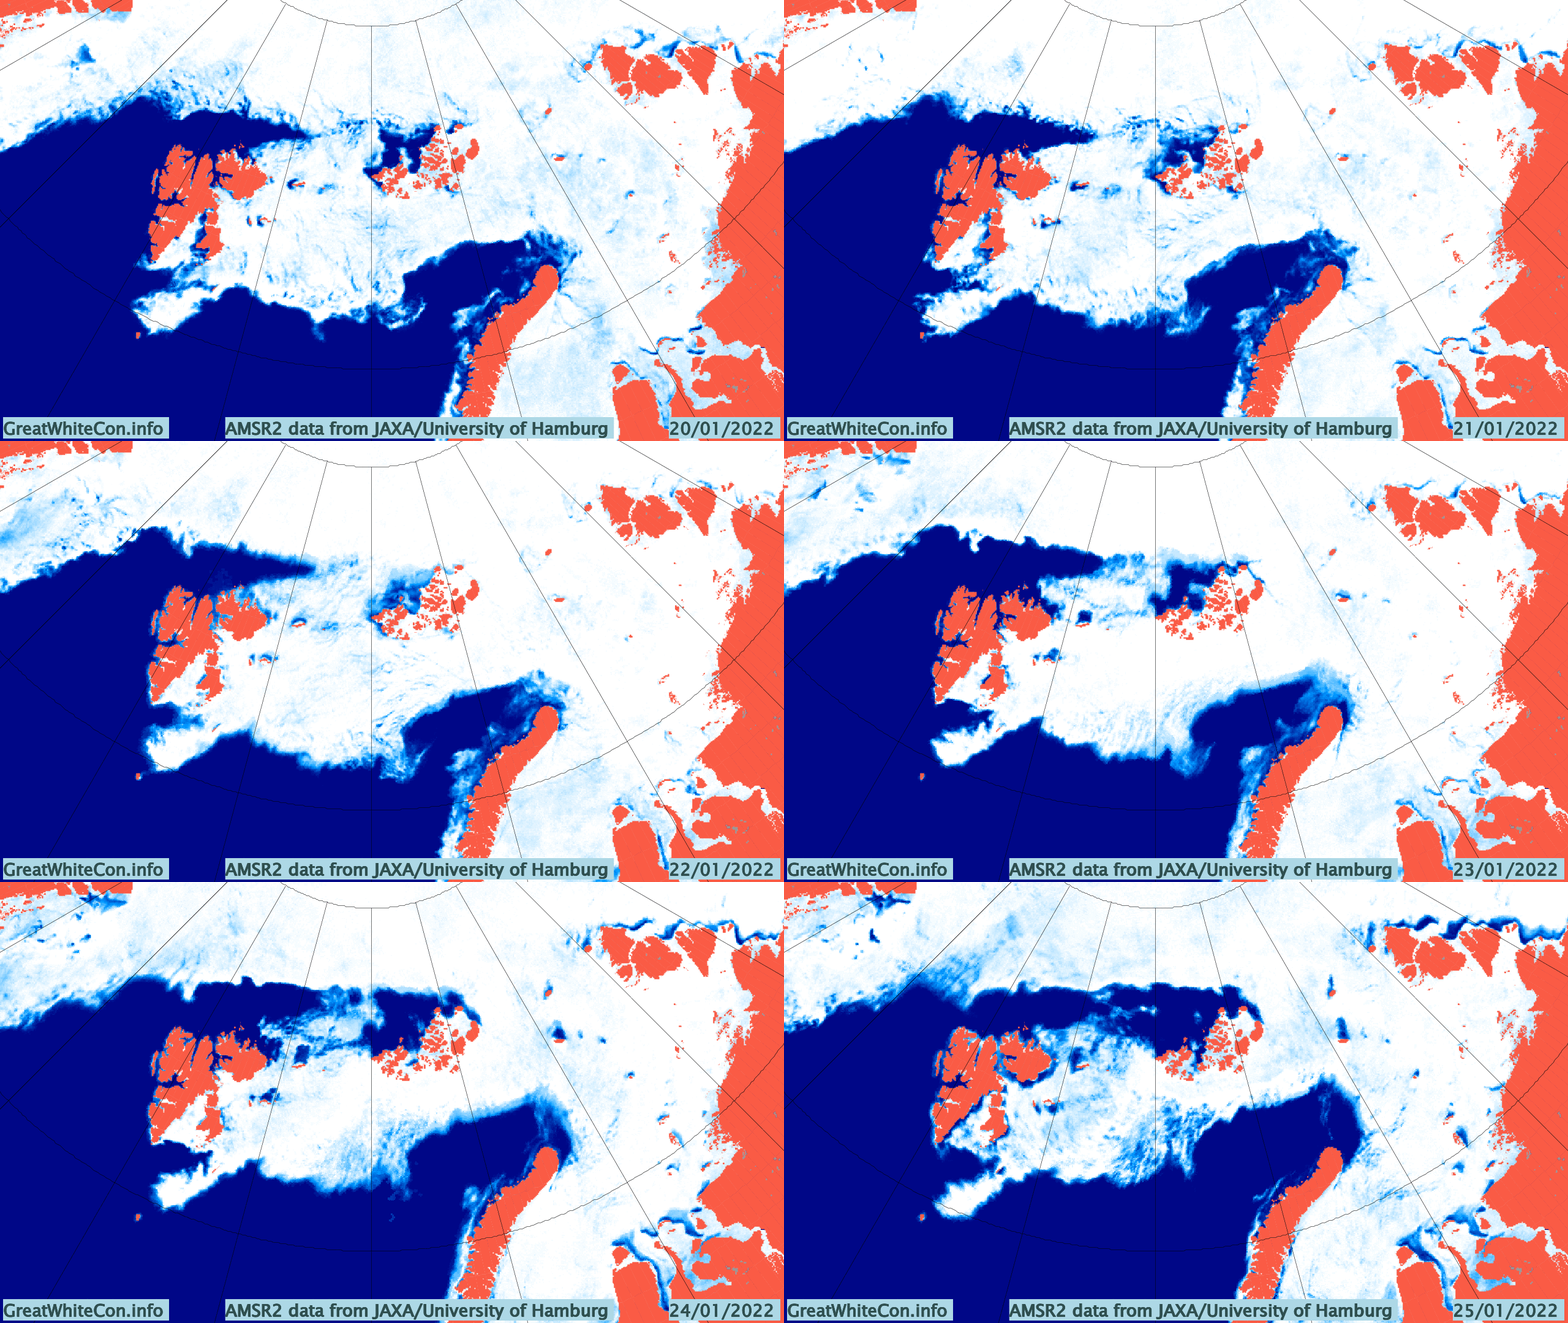
The Atlantic side of the Arctic Ocean has been taking a bit of a battering from what I shall henceforth refer to as the Great Arctic Winter Cyclone of 2022, or GAWC 2022 for short. Unless there’s an even deeper one later in the year of course!
According to the Canadian Meteorological Centre the storm achieved a minimum Mean Sea Level Pressure of 937 hPa at 12 noon UTC yesterday:
Here are the visible effects of the storm on the sea ice in the area so far, now updated to January 25th:
Watch this space!
This website uses cookies to improve your experience. We'll assume you're ok with this, but you can opt-out if you wish. Cookie settingsACCEPT
Privacy & Cookies Policy
Privacy Overview
This website uses cookies to improve your experience while you navigate through the website. Out of these, the cookies that are categorized as necessary are stored on your browser as they are essential for the working of basic functionalities of the website. We also use third-party cookies that help us analyze and understand how you use this website. These cookies will be stored in your browser only with your consent. You also have the option to opt-out of these cookies. But opting out of some of these cookies may affect your browsing experience.
Necessary cookies are absolutely essential for the website to function properly. This category only includes cookies that ensures basic functionalities and security features of the website. These cookies do not store any personal information.
Any cookies that may not be particularly necessary for the website to function and is used specifically to collect user personal data via analytics, ads, other embedded contents are termed as non-necessary cookies. It is mandatory to procure user consent prior to running these cookies on your website.