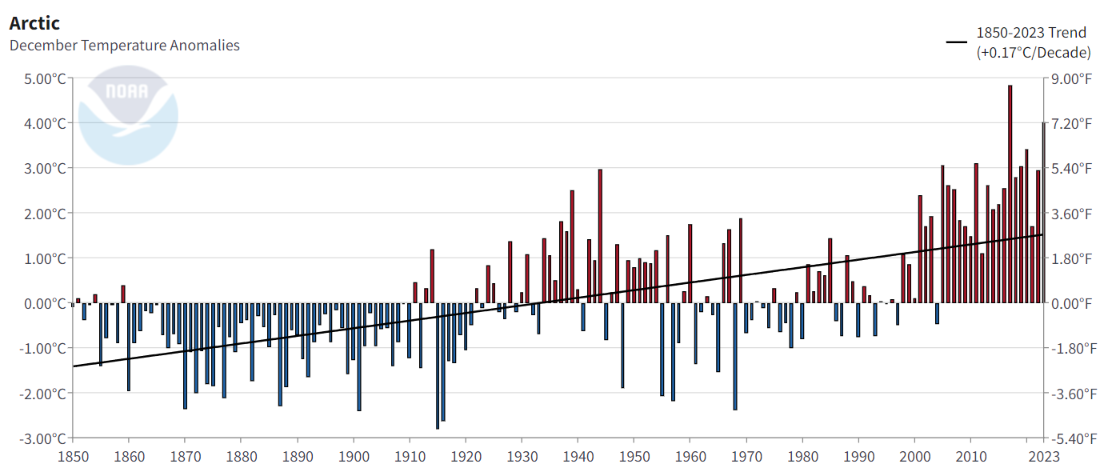
I was mildly surprised when a somewhat “skeptical” interlocutor of my Arctic alter ego linked to “Climate at a Glance” in the course of our alleged “debate”. I was even more surprised to discover that the far end of the suggested link was not NOAA’s familiar overview of the Arctic temperature trend:
but instead a similarly named web site proudly sponsored by the Heartland Institute:
The “Climate at a Glance” home page currently features the Arctic at the top, and it probably won’t surprise you to learn that the linked article is full of half truths and untruths about “Snow White’s” favourite topic? Here are the Heartland Institute’s key Arctic takeaways:
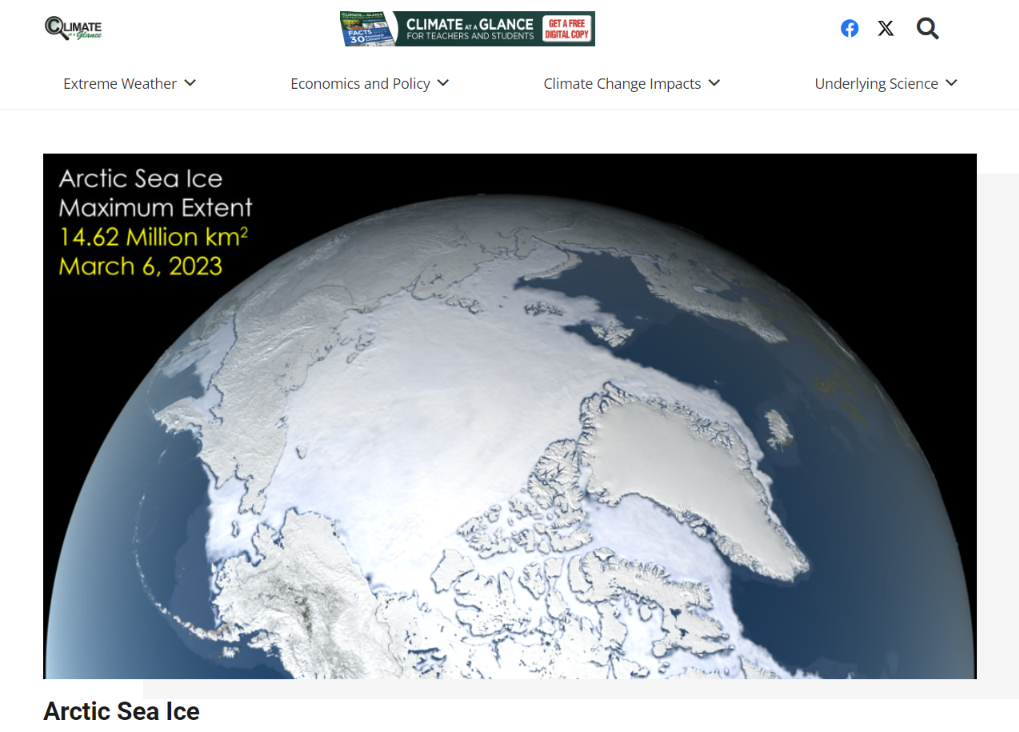
- Arctic sea ice melts and refreezes every year, typically peaking in March, while the summer minimum typically occurs in September.
- Many scientists, politicians, and media sources wrongly predicted Arctic sea ice would disappear in the summer.
- Satellite data show the summer minimum sea ice has not decreased at all since 2007, and instead has formed a stable level after a temporary low in 2012.
Snow cannot argue with number one, but the evidence provided for number 2 includes a blatant untruth. Allegedly:
In 2008 NSIDC scientist Mark Serreze told ABC News that the Arctic could be “ice free” that summer.
However the linked ABC News article actually states that Mark said:
There is this thin first-year ice even at the North Pole at the moment. This raises the spectre – the possibility that you could become ice free at the North Pole this year.
It even goes on to clarify that:
Despite its news value in the media, the North Pole being ice free is not in itself significant. To scientists, Serreze points out, “this is just another point on the globe”.
However evidently for the Heartland Institute’s learned author the “North Pole” is synonymous with “the Arctic”! Equally evidently the Heartland Institute haven’t actually spoken to Mark Serreze about their scurrilous assertion. When I interviewed him in 2014 concerning the matter:
Mark confirmed to me that he still stood by his 2030 estimate for the onset of a seasonally ice free Arctic, although “most models say more like 2050”.
Moving on to takeaway number 3, the “Climate at a Glance” article on the “Underlying Science” of “Arctic Sea Ice” also links to a recent academic article, and needless to say mispresents its findings. According to the Heartland Institute:
The sea ice minimum in September 2023 was essentially the same as it was in 2007, when all the predictions of “ice free summers” began. Moreover, data from 2007 to 2023 show a zero net-change over the past 17 years. The flat trend from 2007 to 2023 suggest a regime shift in the Arctic sea ice system to a new stable level.
The “regime shift” in Arctic sea ice age and thickness should come as no surprise to our regular readers, but the “new stable level” assertion will come as a big surprise to the authors of the paper in question. They state that in their discussion that:
Our analysis demonstrates the long-lasting impact of climate change on Arctic sea ice through reduced residence time, suggesting an irreversible response of Arctic sea ice thickness connected to an increase of ocean heat content in areas of ice formation…
Impacts of this regime shift in Arctic sea ice on the pan-Arctic environment are extensive and require further investigation.
To be continued…
Jim,
Comparing your Arctic temperature chart with the AMO over the same period.
I notice the AMO peaked back in 1945 and has been at its current zenith from 2010 to 2023.
It dropped down to its minimum in 1910 and again in 1970.
Unfortunately data for the AMO is not currently available.
If data becomes available will we see another minimum by the end of the decade?
I might note, that the peak on Jim’s graph for the current decade is higher than in the 1940s. Neither is there a corresponding peak during the 1800s , say around 1850-1860.
Having said that, maybe both AGW and the AMDO are both genuinely affecting the climate and of course the Arctic!
Hi Neil,
My Arctic alter ego was recently discussing the supposed “correlation” between Arctic sea ice extent and the AMO with Jim Steele over at Watts Up With That:
https://GreatWhiteCon.info/2024/01/jim-steele-and-anthony-watts-embrace-bad-arctic-science/
Would it surprise you to learn that Jim S. ran away to hide in the woods after calling Snow some less than polite names, whilst Anthony was neither seen nor heard from concerning the topic?
Jim, regarding jdallens reply to you over at the forum where he said winter volume could prove to be the real canary in the mine… What about DMItemp???
It’s toasty up there at the moment!
What really counts is the integral of temperature over the whole freezing season. “Freezing degree days”.
Which reminds me that for several months I’ve been meaning to pester DMI about the fact that the raw daily data is no longer being updated at the advertised location. Without that my DMI FDD graph for 2024/24 is currently non existent!
Yeh, the area under the curve. FDD is such a great way to present things to the public.
So, if it’s been two days of 15 degrees above normal and a further perhaps five of 10 degrees above normal: is that enough to weaken the ice?
Not quite the Arctic, but if In allowed:
https://www.perthnow.com.au/news/albany-advertiser/albanys-hottest-february-day-as-temperatures-soar-across-great-southern-and-lower-wheatbelt-c-13662699
The highest we ever had in Perth, btw, was 46.3