It’s that time of year again! Tony Heller has been asserting that “summer is over at the North Pole” for several weeks now, and the 2023 Arctic sea ice minimum extent will occur at some point over the next four or five weeks. The exact date and level will almost certainly vary from one extent metric to the next.
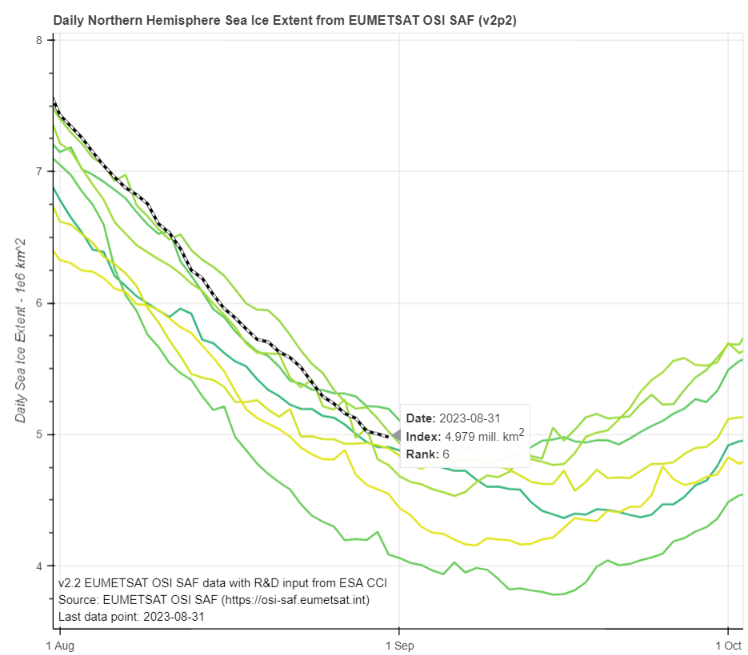
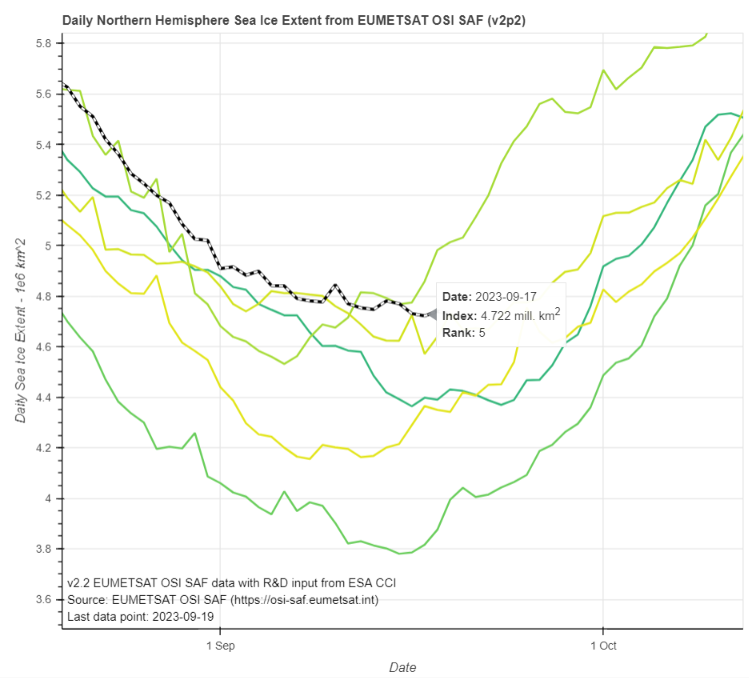
To get the minimum extent ball rolling, here’s Signe Aaboe’s graph of previous summer minima based on OSI SAF data:
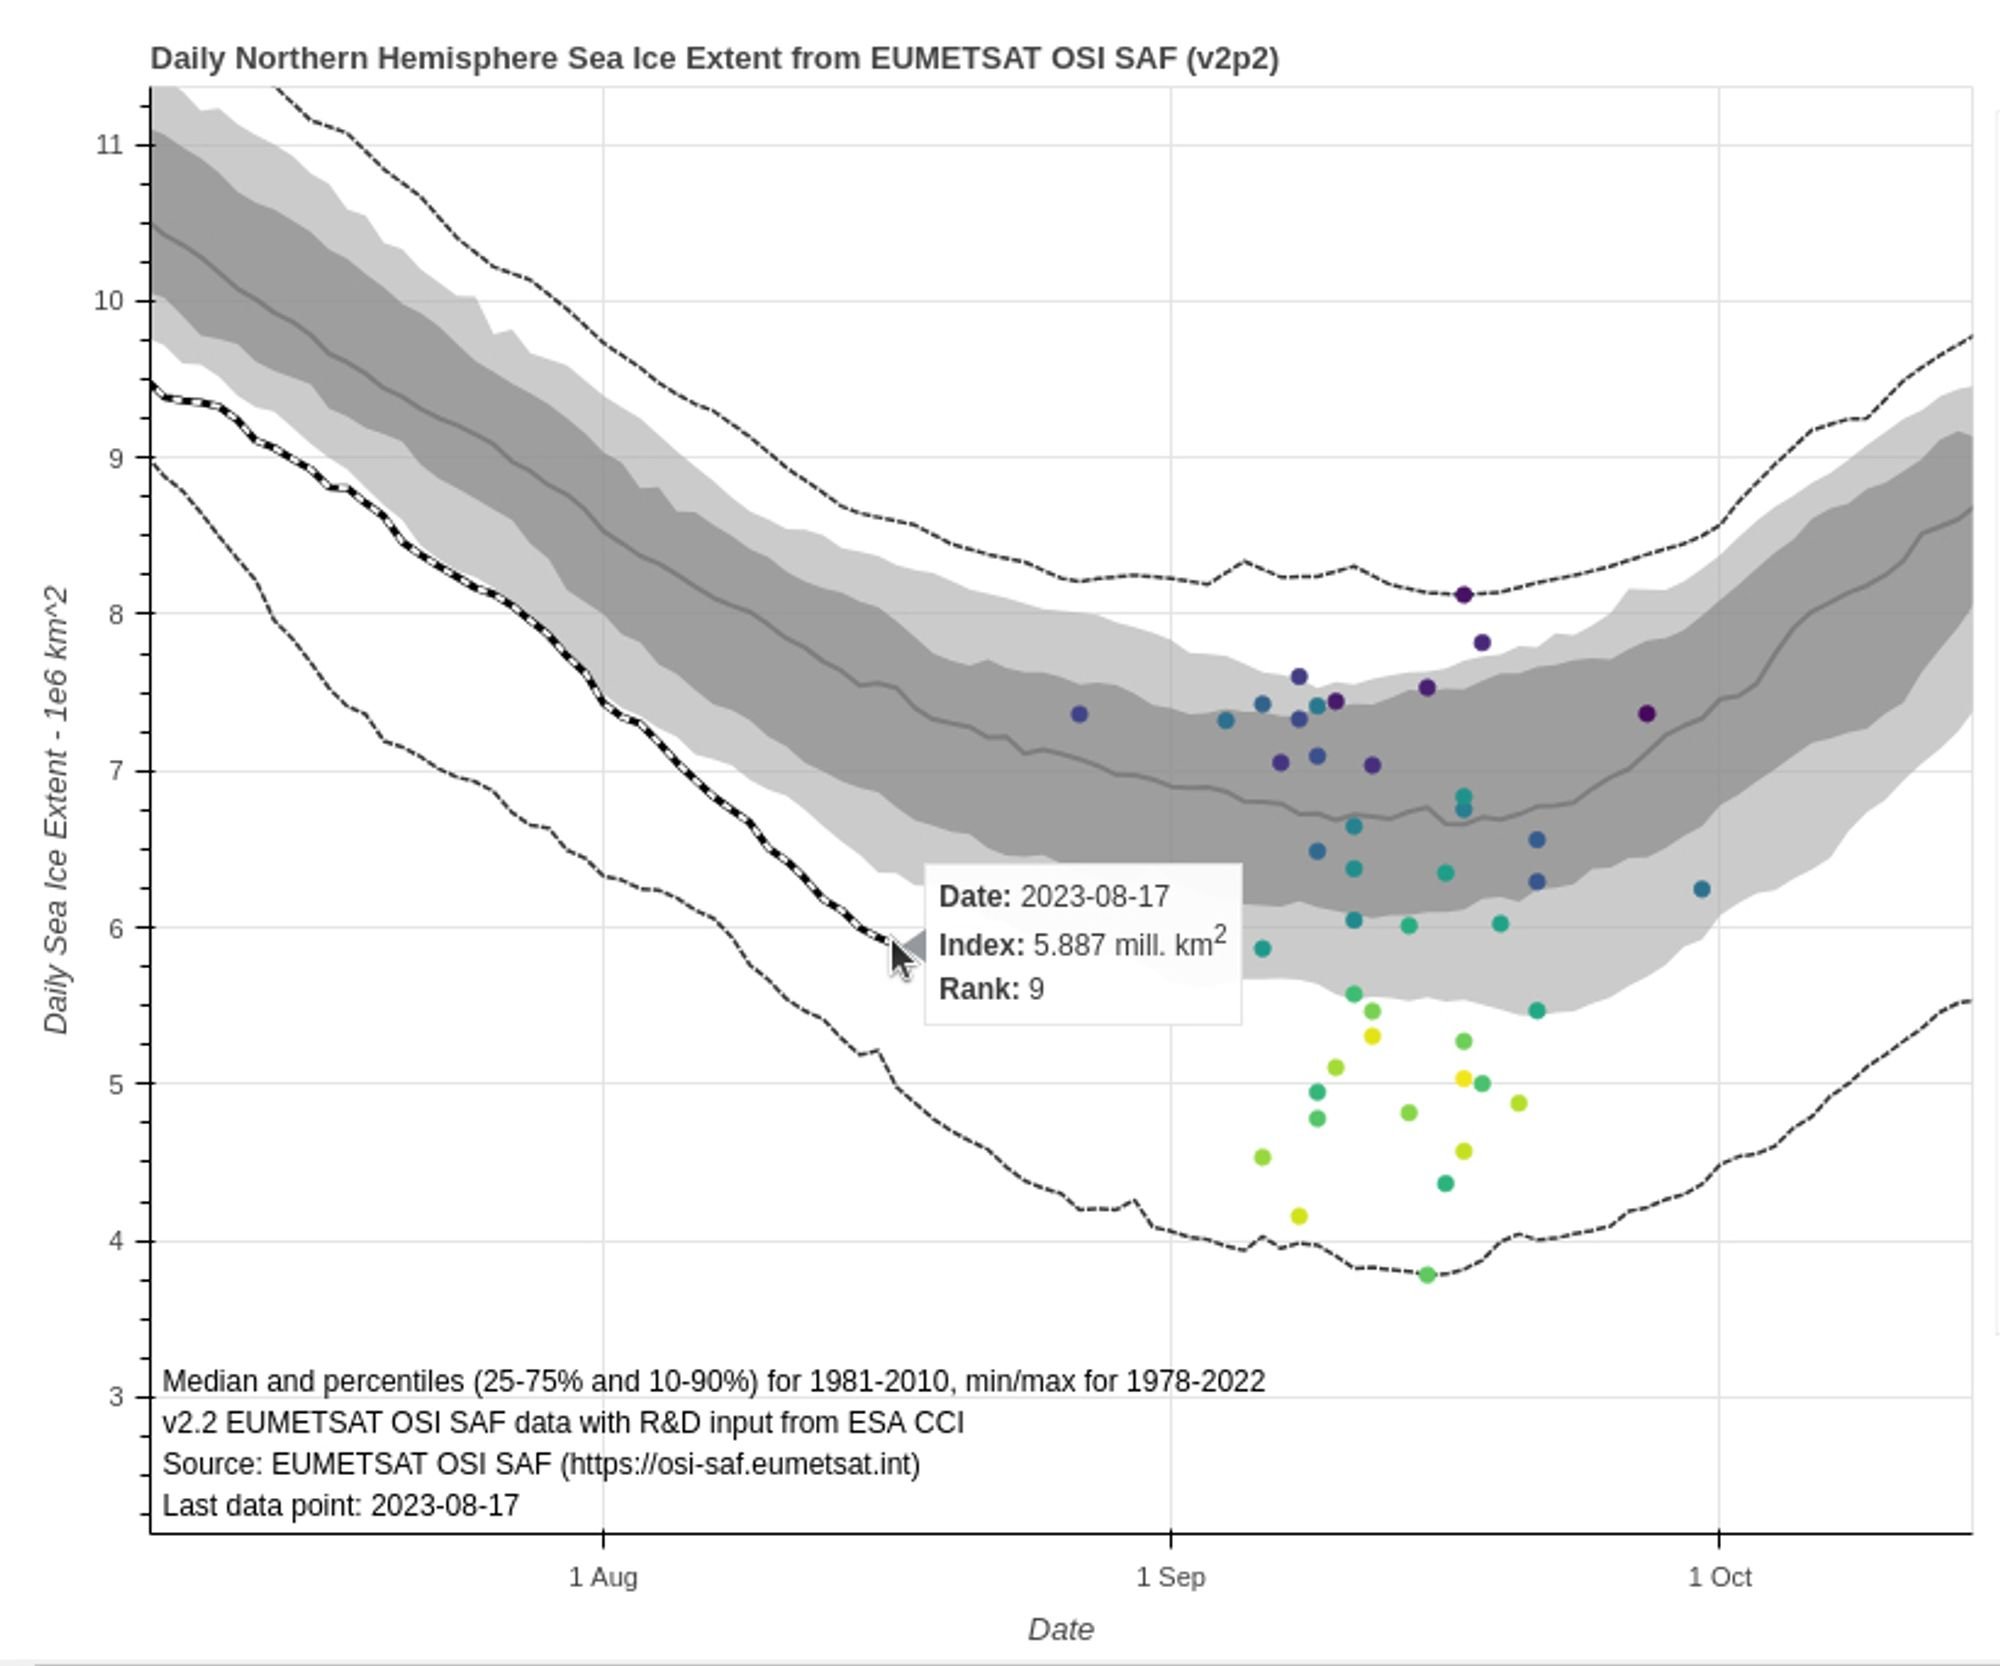
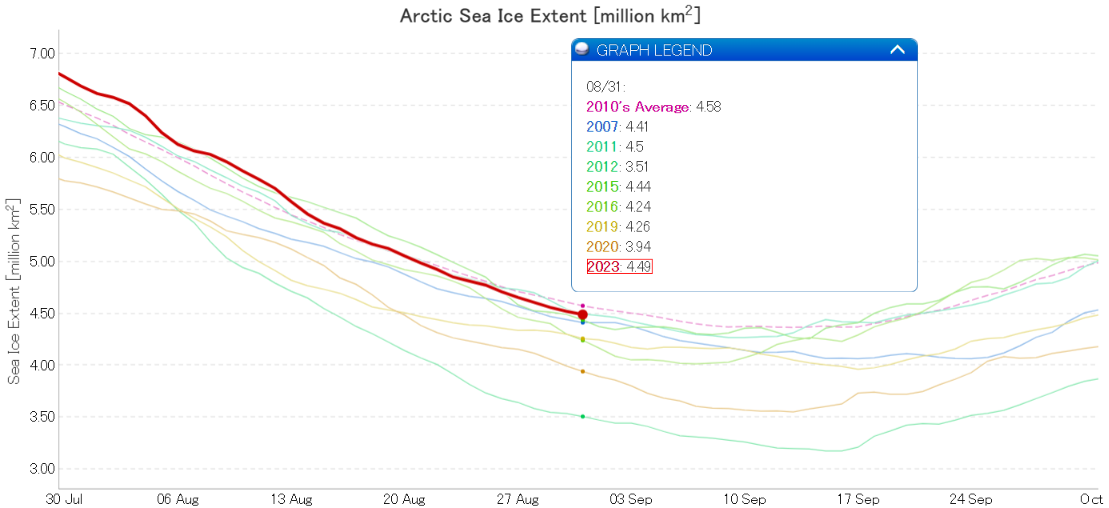
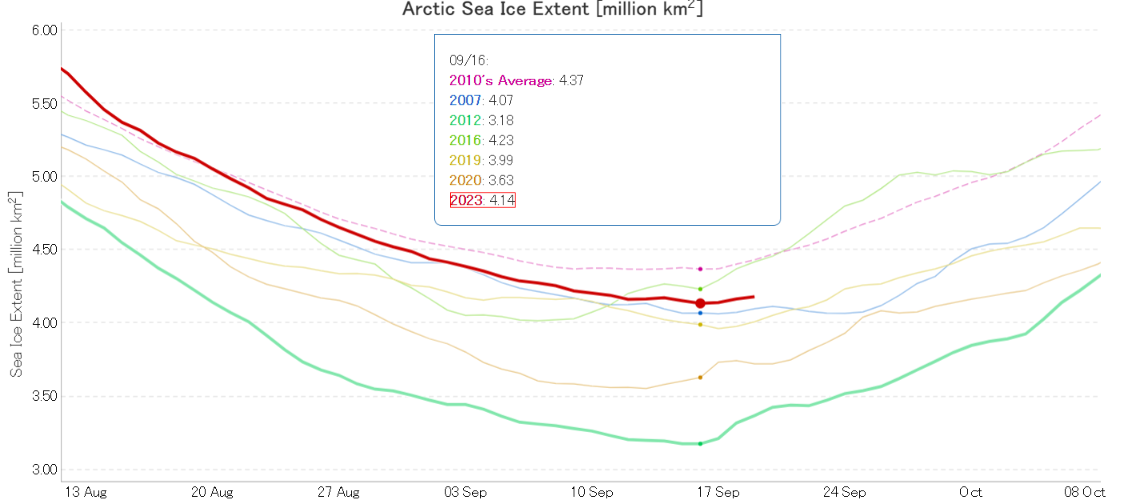
Here too is Zack Labe’s equivalent, based on JAXA data:
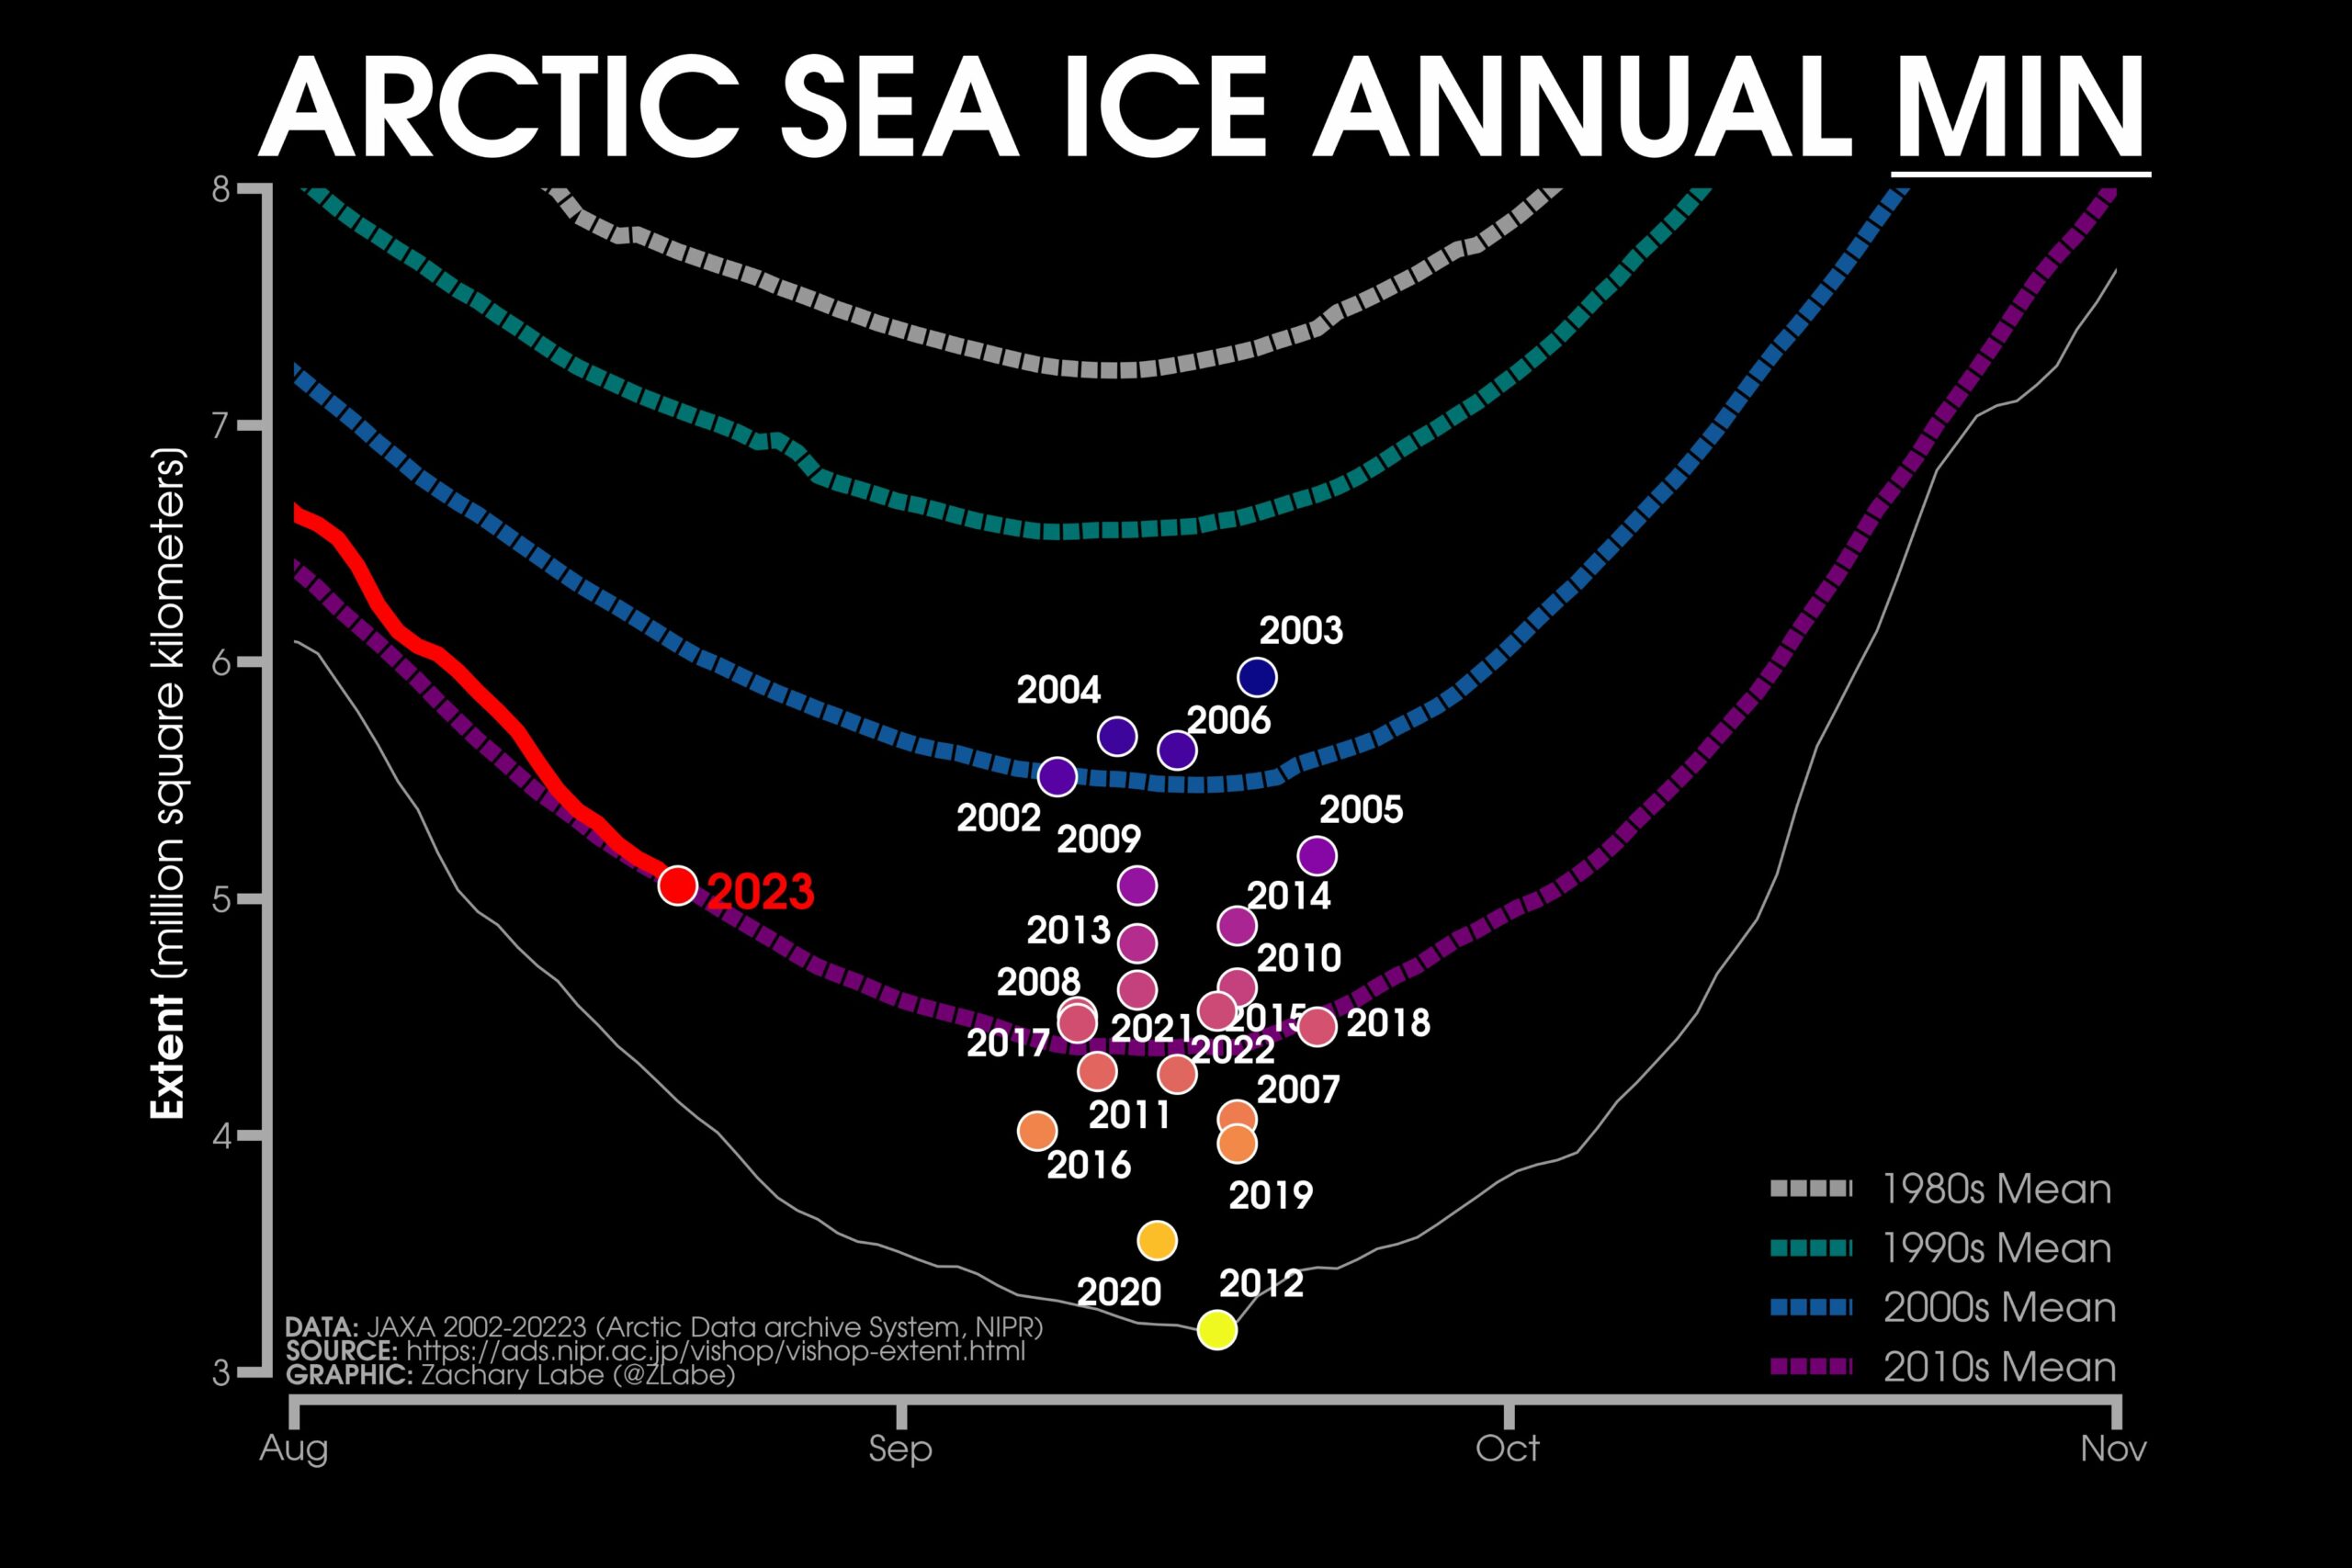
Would anyone here care to make a prediction?
[Edit – August 31st]The ARCUS Sea Ice Prediction Network August report has recently been published. Here’s the graphic overview of the 30 predictions for September sea ice monthly average extent, not the daily minimum extent:
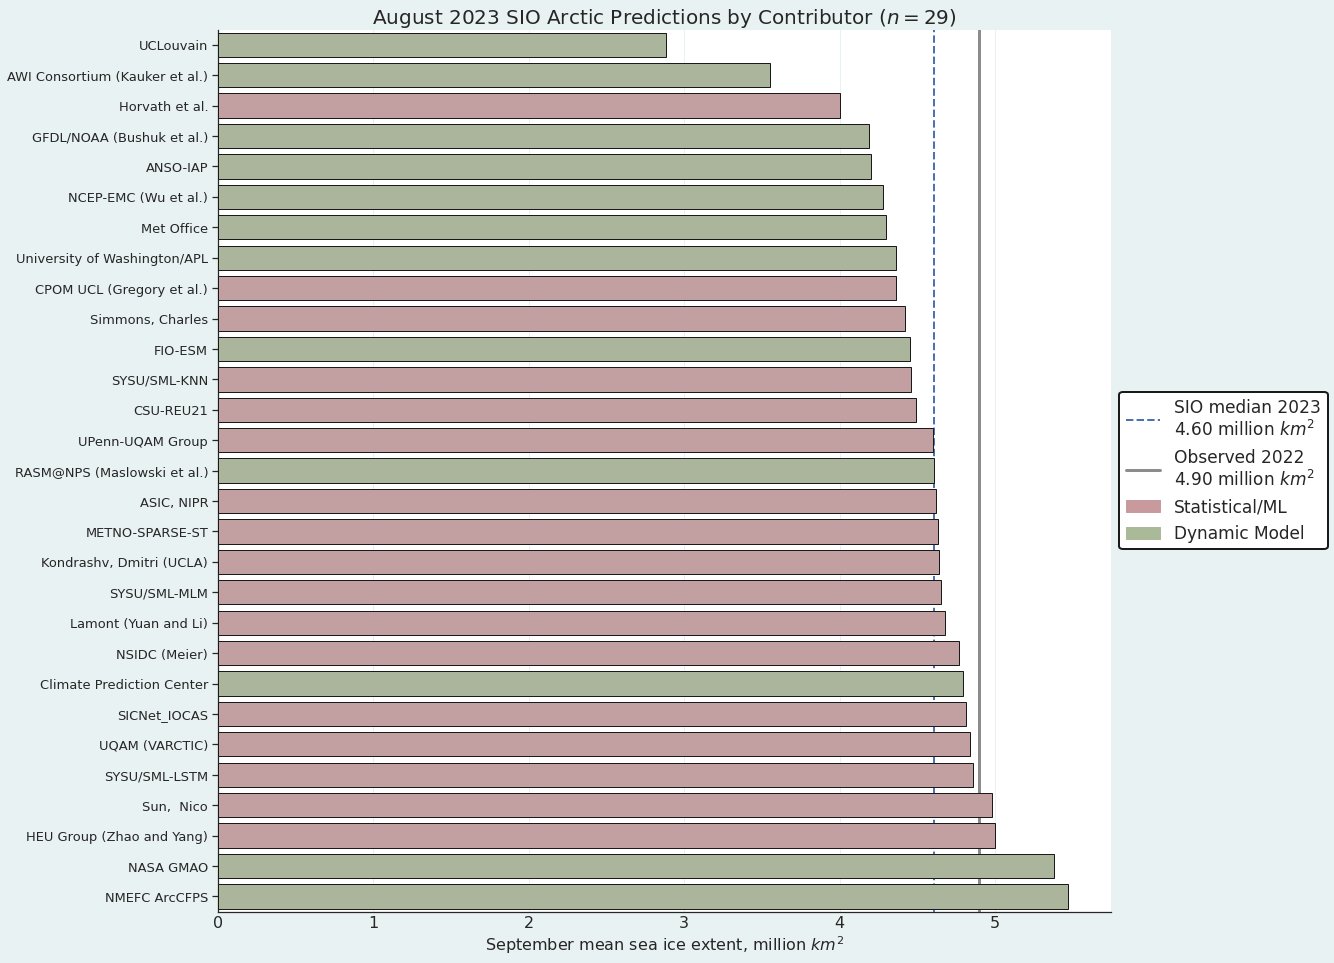
The August median forecasted value for pan-Arctic September sea-ice extent is 4.60 million square kilometers with interquartile values of 4.35 and 4.80 million square kilometers, while individual forecasts range from 2.88 to 5.47 million square kilometers. We note that the lowest two forecasts predict a new record September sea-ice extent value (current record is September 2012, with a sea-ice extent of 3.57 million square kilometers), but these forecasts are outliers relative to the other contributions.
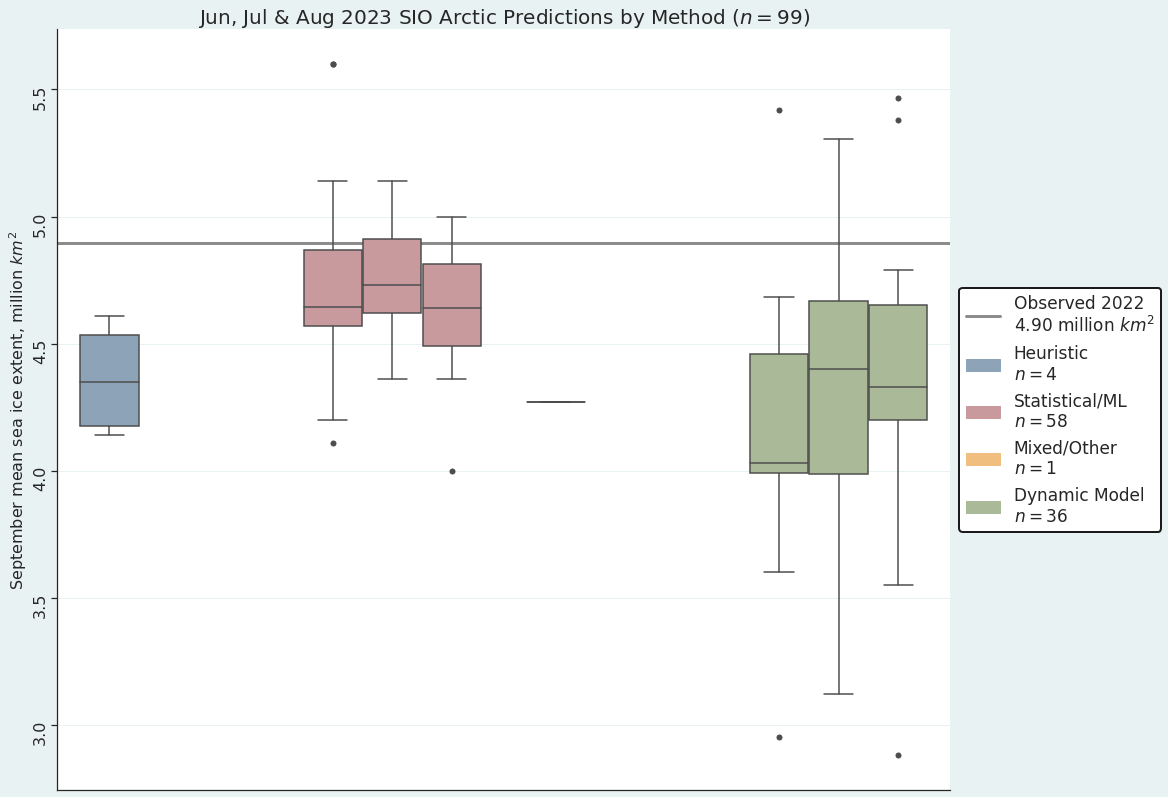
The August median forecast of 4.60 million square kilometers is slightly lower than the July median (4.66) and slightly higher than the June median (4.54). Interestingly, the interquartile range of August forecasts is slightly higher than the July interquartile range (0.45 compared to 0.36 million square kilometers), illustrating that inter-model uncertainty was not reduced between early July and early August forecasts. The August interquartile range is narrower than the June interquartile range of 0.56 million square kilometers.
Here’s how the National Snow and Ice Data Center’s 5 day averaged extent looks with September just around the corner:
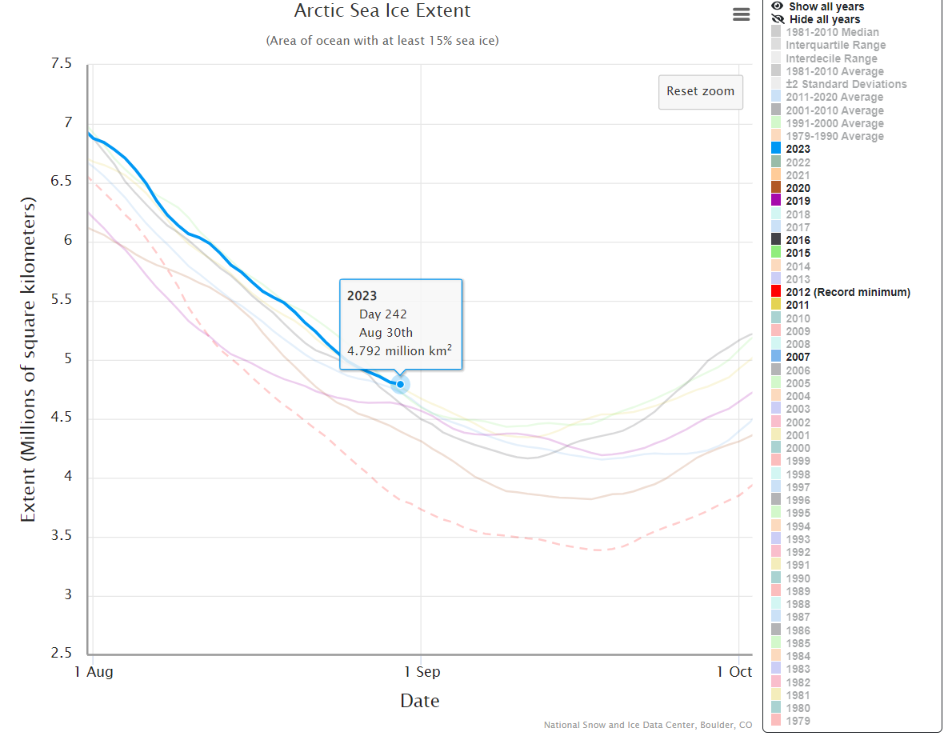
Getting back to the daily minimum extent, here’s the state of play of a variety of other extent metrics at the end of August. To begin with let’s take a look at Signe’s OSI SAF metric:
Next here’s Zack’s JAXA AMSR2 extent:
Finally, for the moment at least, here’s AWI’s “preliminary” AMSR2 metric:
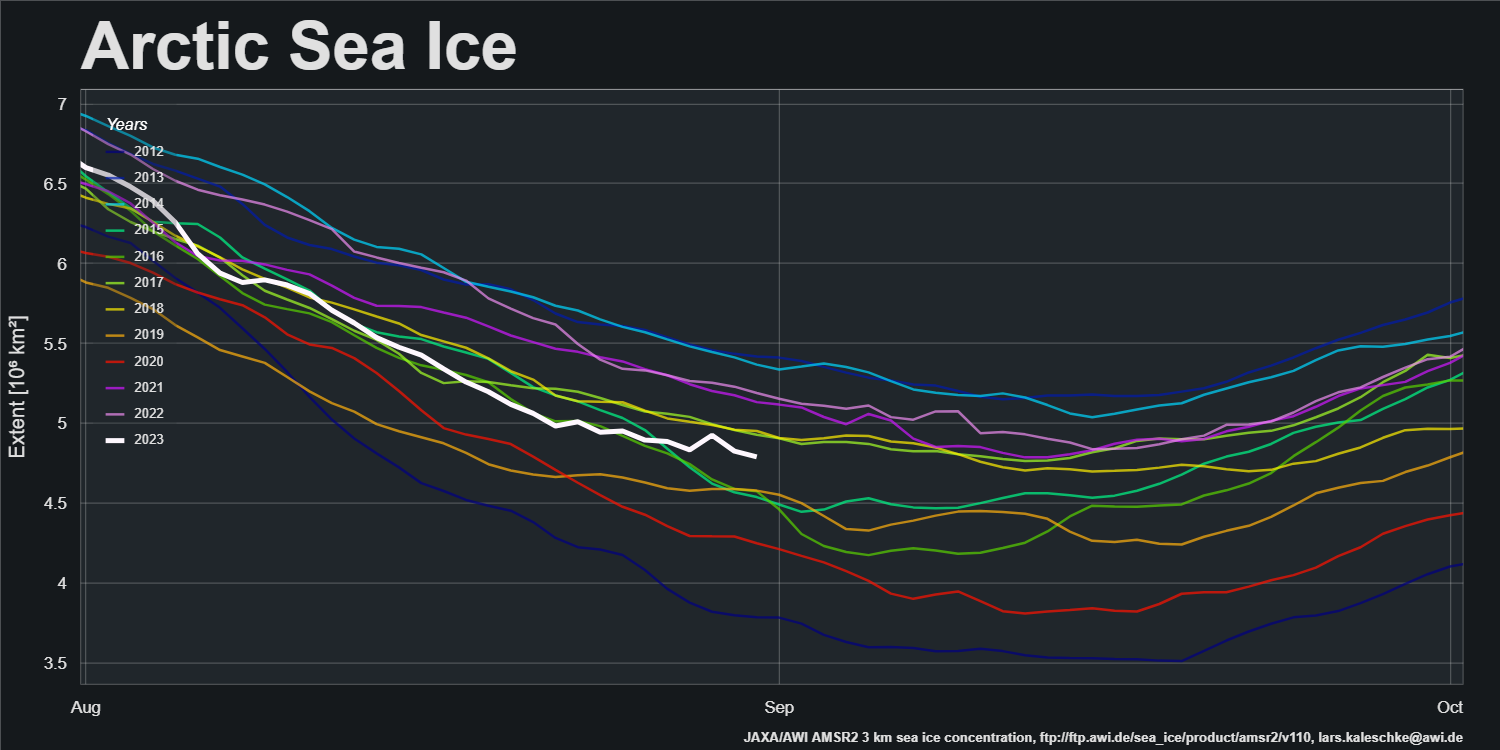
Note that this graph doesn’t include a curve for 2007, since the GCOM-W1 satellite carrying the AMSR2 instrument wasn’t launched into space until May 2012.
[Edit – September 20th]After quite a long wait we now have some candidates for the 2023 minimum Arctic sea ice extent. The current JAXA minimum is 4.14 million km² on September 16th (and 17th), 6th lowest in the satellite record:
The OSI SAF minimum is currently 4.72 million km² on September 17th, 5th lowest for the date but once again the 6th lowest minimum extent:
The NSIDC’s 5 day average extent is still declining, but the daily extent also posted a potential minimum on September 17th, at 4.21 million km² .
[Edit – September 26th]The NSIDC has tentatively announced the 2023 minimum extent:
On September 19, Arctic sea ice likely reached its annual minimum extent of 4.23 million square kilometers (1.63 million square miles). The 2023 minimum is sixth lowest in the nearly 45-year satellite record. The last 17 years, from 2007 to 2023, are the lowest 17 sea ice extents in the satellite record…
Please note that this is a preliminary announcement. Changing winds or late-season melt could still reduce the Arctic ice extent, as happened in 2005 and 2010. NSIDC scientists will release a full analysis of the Arctic melt season, and discuss the Antarctic winter sea ice growth, in early October.
NASA has also released this video:
If you watch it until the end you will note that it refers to the 2023 maximum Antarctic sea ice extent too:
Antarctic sea ice reached its lowest maximum extent on record on Sept. 10 at a time when the ice cover should have been growing at a much faster pace during the darkest and coldest months.
The NSIDC’s announcement is more circumspect:
[Edit – October 9th]In the Antarctic, sea ice extent set unprecedented record lows through most of the growth season. Highly variable conditions are typical of Antarctic sea ice extent near the seasonal maximum, and ice may still continue to grow but will unlikely avoid setting a record low. The previous five lowest maximums on record include 1986, 2002, 2017, 1989, and 2022. The maximum for Antarctic sea ice typically occurs in late September or early October, but has been as early as August 30.
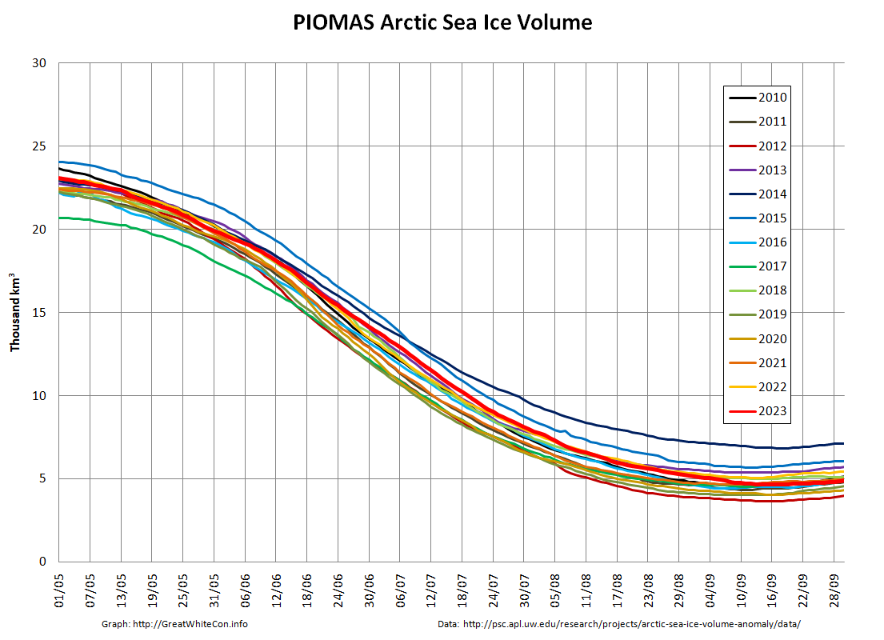
Returning to the Arctic, the latest release of PIOMAS gridded thickness data reveals that modelled sea ice volume reached a daily minimum of 4,651 km³ on September 16th 2023, the 9th lowest value in the satellite era:
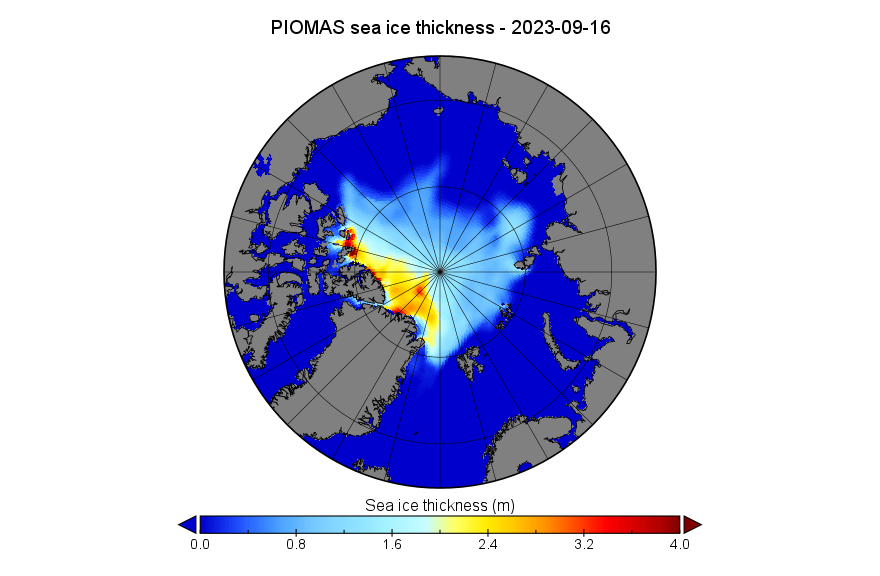
Here’s the thickness map on September 16th:
Watch this space!
We’re 6th lowest JAXA extent today, still the weather will decide a lot. I’ll only predict a lower minimum than last year,a top 10 finish.
Why is extent important?
It’s the subject of this post.. obviously!
Which is very true Tom!
However at this time of year I would maintain that area and volume are more important then extent.
Discussion concerning which should occur in the August open thread!
Cold May aside, there’s been plenty of warmth over the CAA,and blowing over the thickest ice in the CAB. Temperatures have still to fall, as I write, north of 80°,
So I would guess volume still has more to drop by mid September.
How’s the caa doing?
2 of September, and at 4,440K JAXA extent we’re now at least below the 2017&2018 minimums.
And there’s a fair amount of stormy weather coming up the Atlantic side over the next week!
7th of September JAXA extent 4,276k which should take it below 2011&2015 into 6th place in satellite record.
More notibly NISDC area 2,824,878 only 40 I above 2020 and 144k below 2019.
Without further drop in area it’s already 4 th place in the satellite record.
Which is quite a drop after the cold start to the summer in May!
JAXA down to a new low of 4,154k this morning, have a feeling that the minimum is close!
NISDC is currently second lowest for date too!
All that remains now is the Piomas minimum!
I’ve been eagerly awaiting the PIOMAS mid month gridded thickness update, but it looks like it’s gone missing this month.
Looking on the bright side, a new month is not far away now.
Just to reply to Speakmylanguages question I had to check Arctic sea ice forum ..Gerontocrats graphs put area/extent numbers on October 24 at 200/350k square km, which is 200/250 below 2012/16 numbers, which, judging by the graph is low for the time of year.
Drawing a parallel to the Laptev in 2020 or the Chucki in 2019, a combination of early melt and warm temperatures can lead to locally slower refreeze.
Maybe in the case of the CAA it will make space for a bit of “Garlic press” export during the winter
Yeh Tom, 2012 rebounded quickly… Not sure about 2016 but if it did the same that’s interesting!
I wonder if 2007 rebounded quickly?!
Yet, to further add, DMI temps don’t seem out of control: so, it’s a mystery…
Did someone say the arctic was supposed to be melting?
Melts every summer, you must have missed the party?
Merry Xmas Matt!
You’re invited to the GWC party, held as always on the now frozen shores of Santa’s Secret Summer Swimming Pool:
https://GreatWhiteCon.info/2023/12/facts-about-the-arctic-in-december-2023/#Dec-24
Merry Christmas Jim. It’s nice to see the arctic sea ice doing well despite the alarmism too.
What planet are you on buddy ?