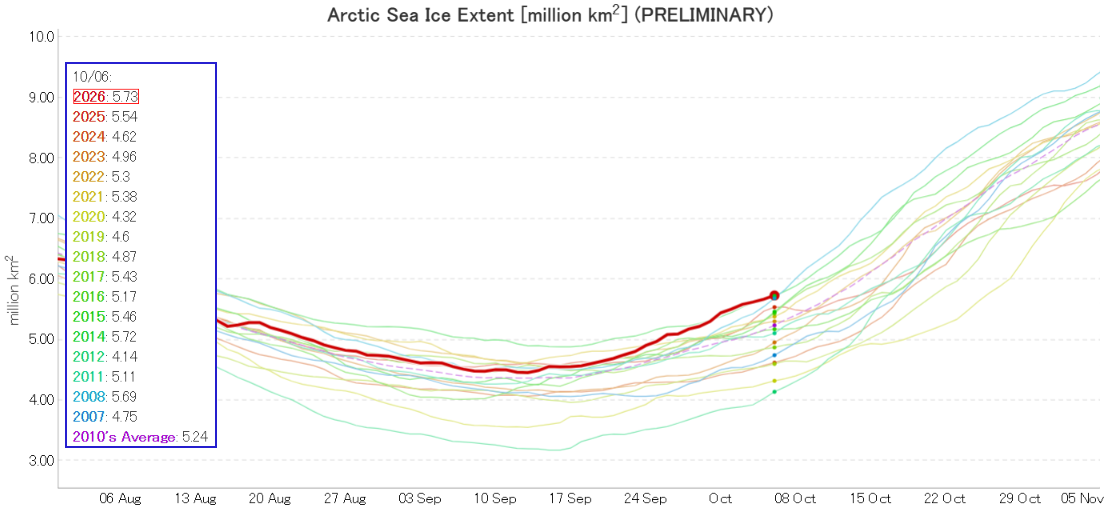
The Arctic sea ice refreeze has started with a bang, and JAXA/ViSHOP extent is currently 17th lowest for the date in the satellite era:
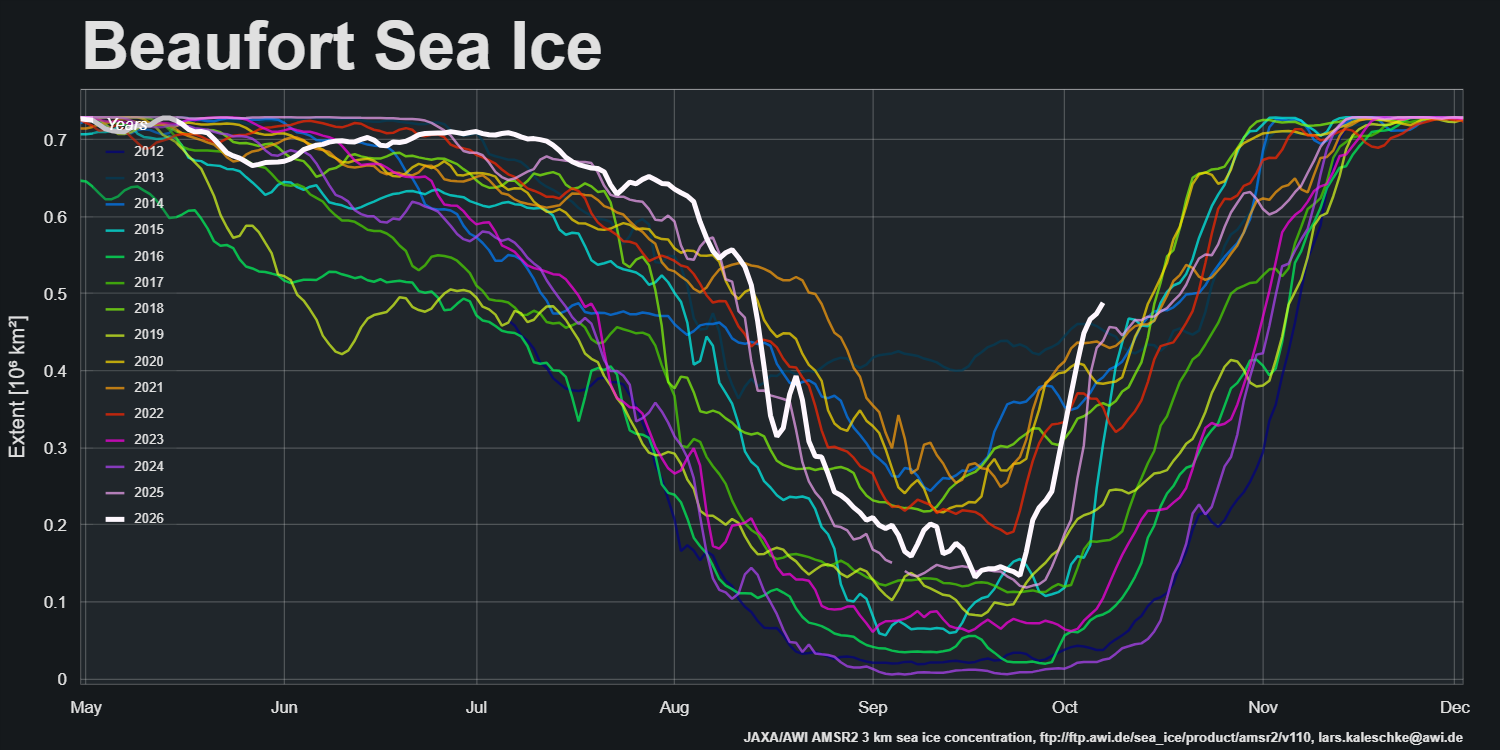
A large area of the Beaufort Sea melted late and has now refrozen swiftly:
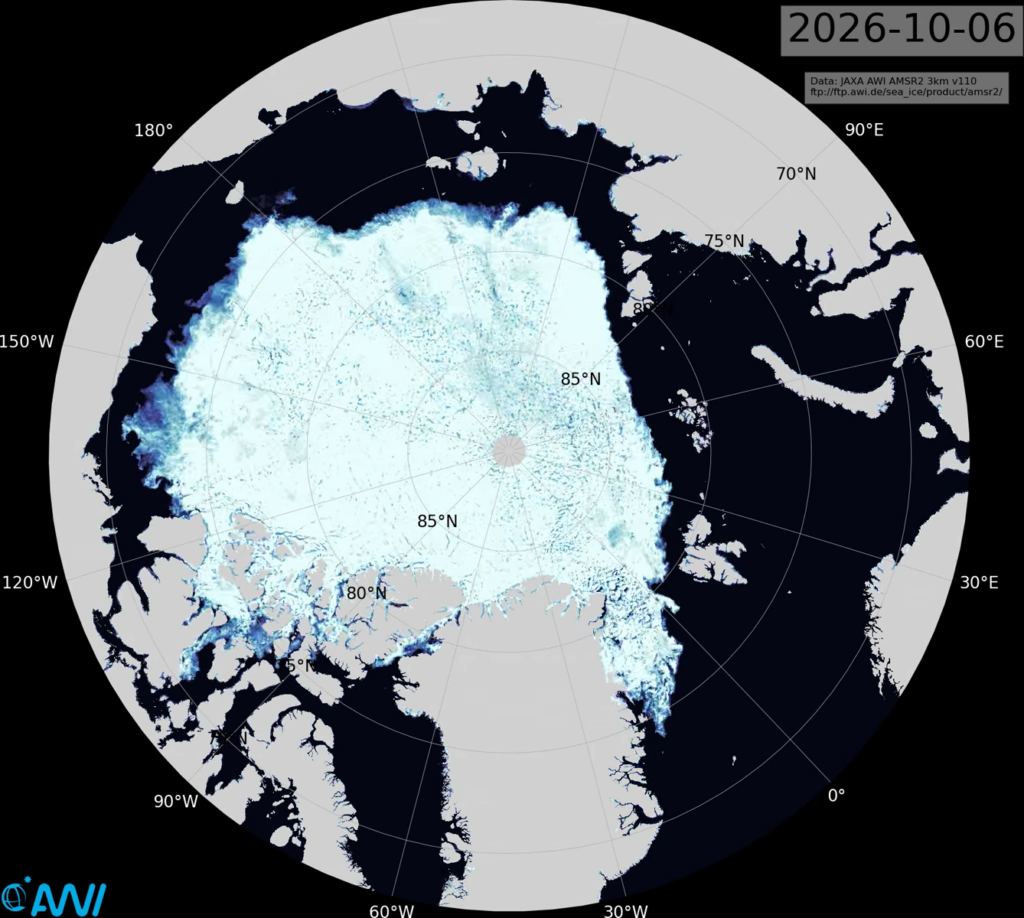
Here’s the current AWI concentration map. Click the image so view a 2 Mb animation showing the process in detail:
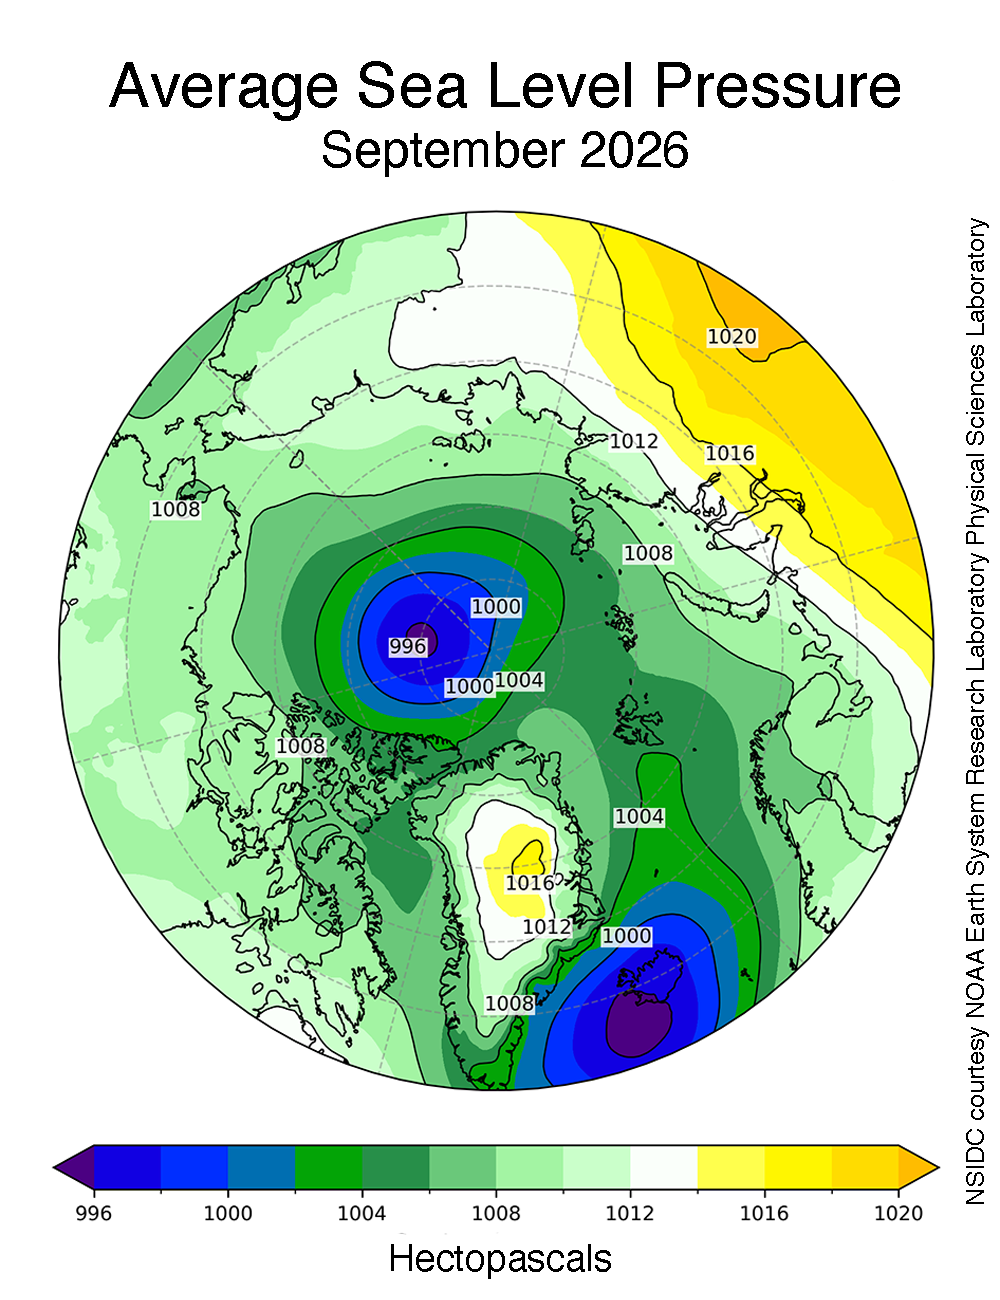
After being absent for many a month, the National Snow and Ice Data Center’s monthly “Sea Ice Today” reports have restarted. Their September 2026 summary points out that:
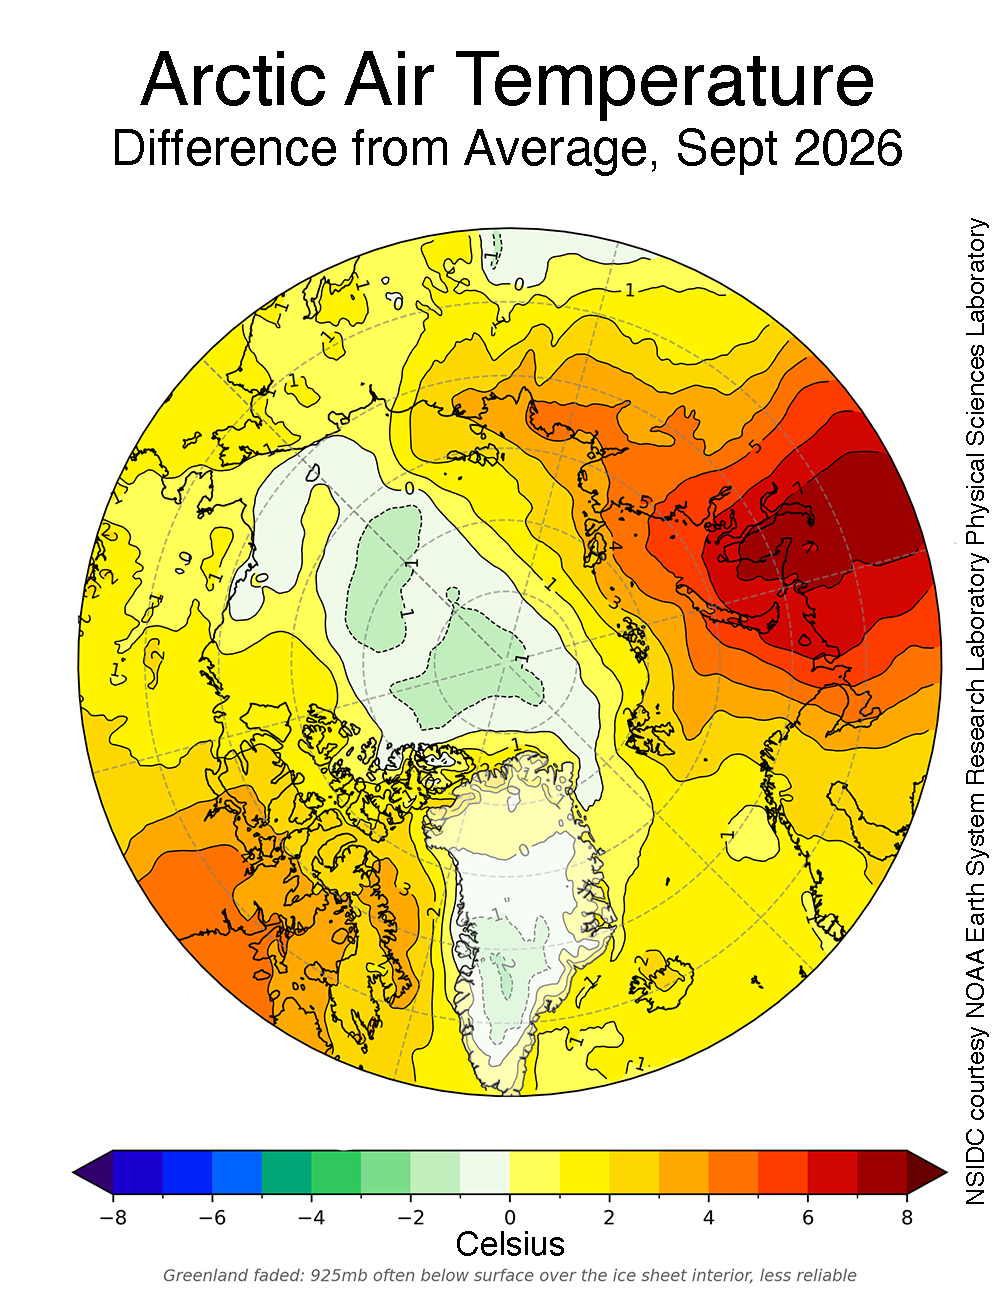
As was the case for all of summer, low sea level pressure dominated the Arctic Ocean during September, accompanied by below-average temperatures that fostered rapid ice growth. Air temperatures at the 925 hPa level (about 2,500 feet above the surface) were 0 to 1 degree Celsius below average over much of the Arctic Ocean, but strongly above average over northern Eurasia.
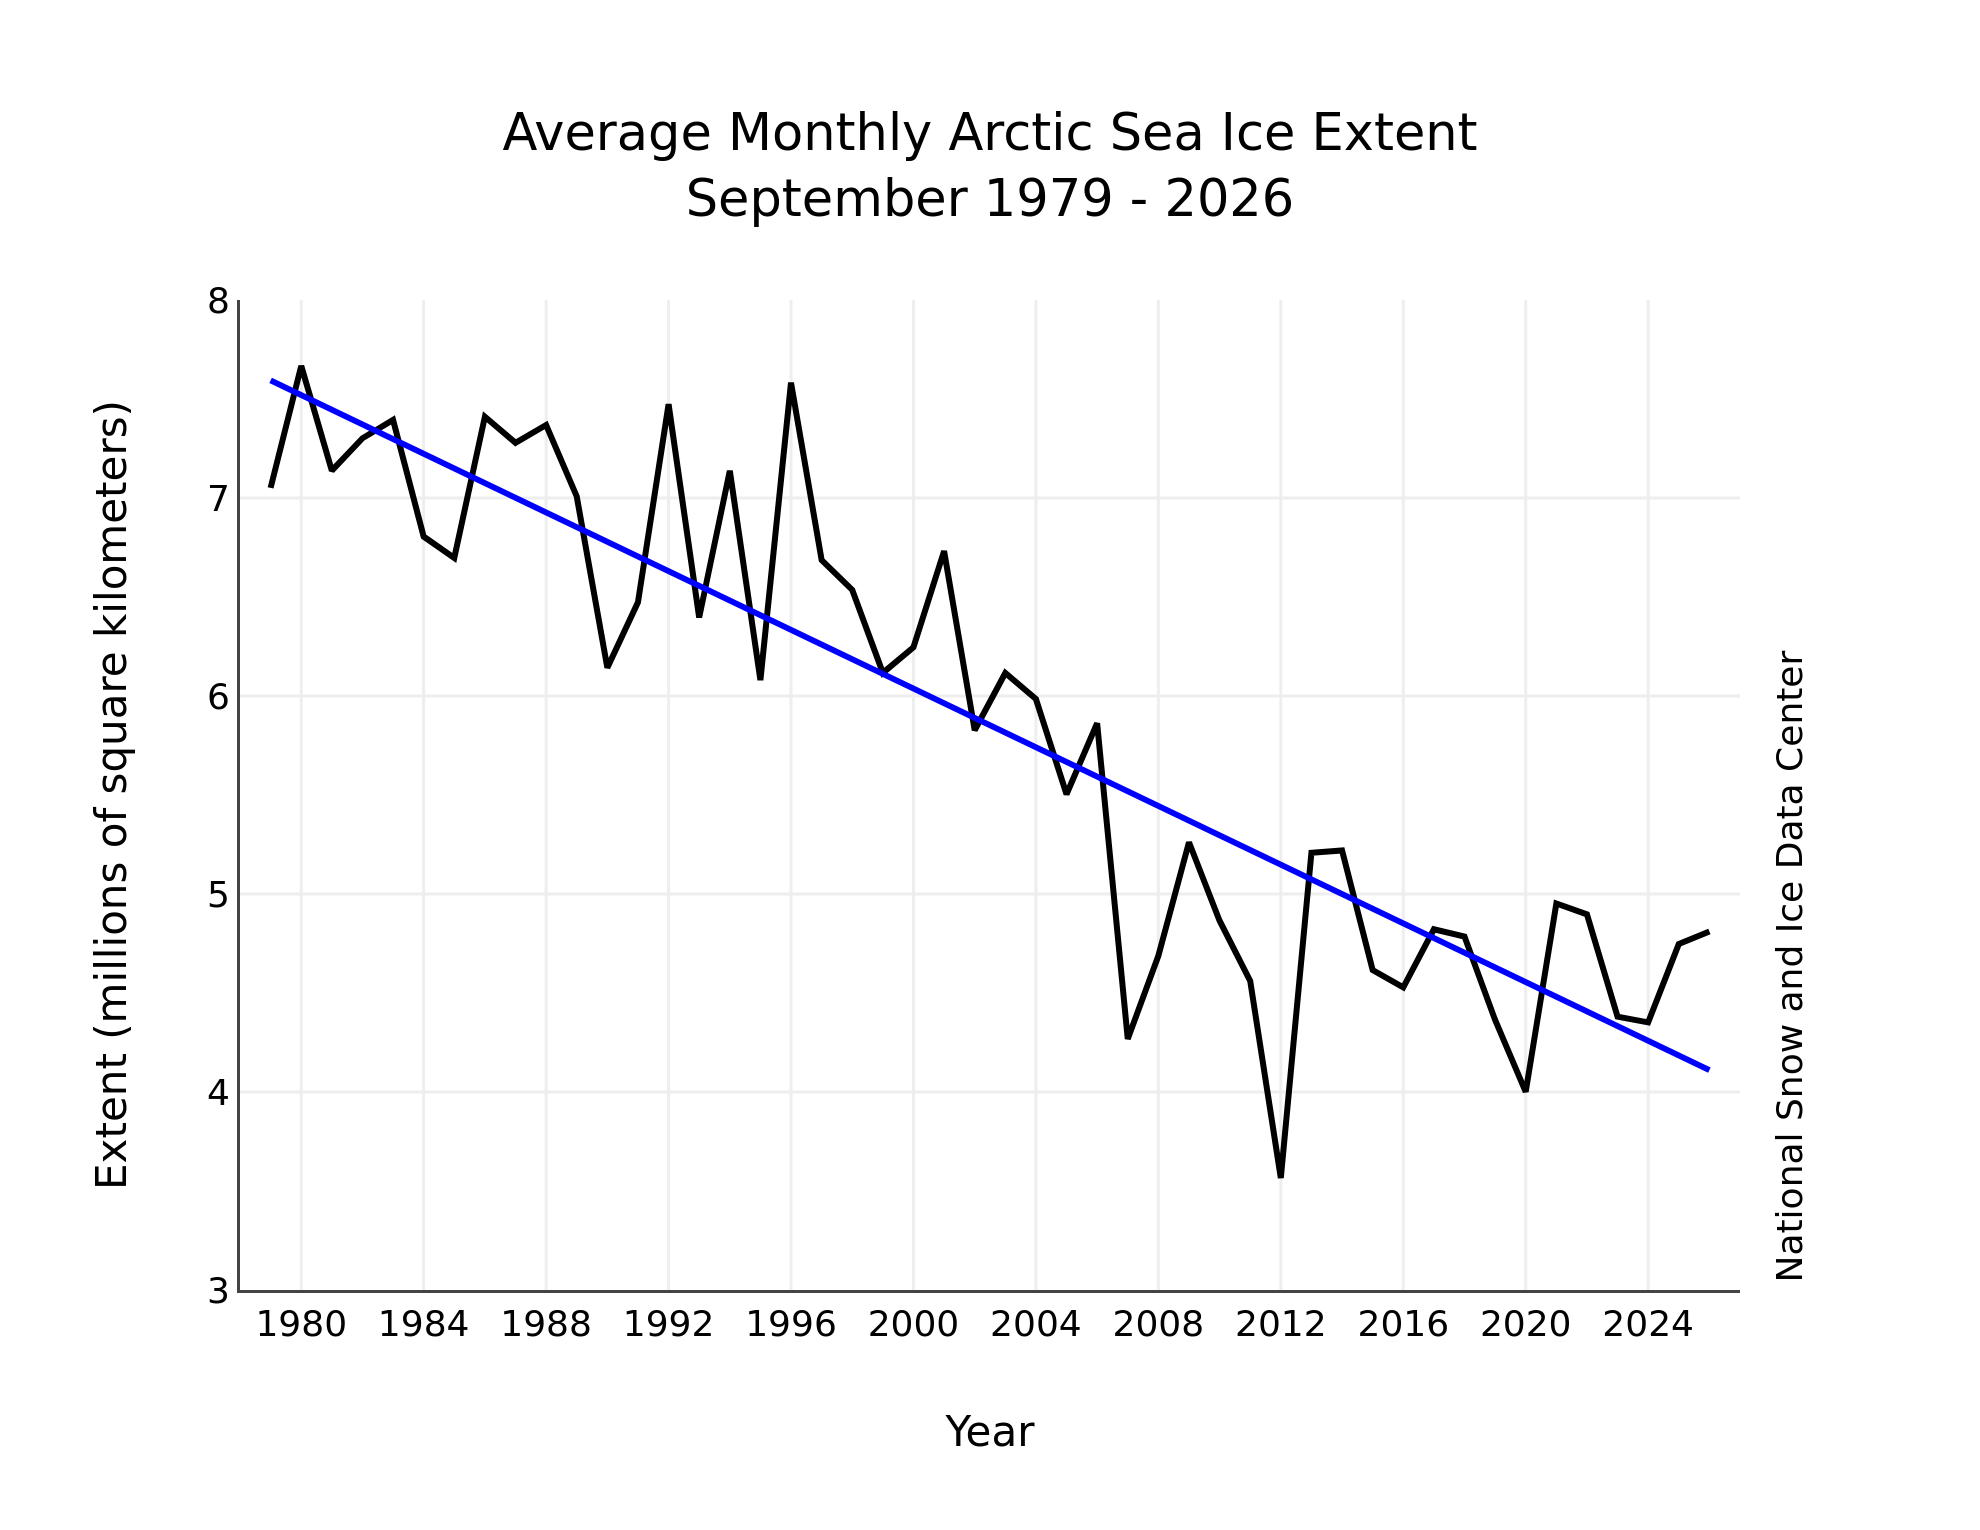
The downward linear trend in September Arctic sea ice extent through 2026 is 74,100 square kilometers per year or 11.6 percent per decade relative to the 1981 to 2010 average. Based on the linear trend, since 1979, September has lost 3.24 million square kilometers of sea ice. This is equivalent to twice the size of Alaska.
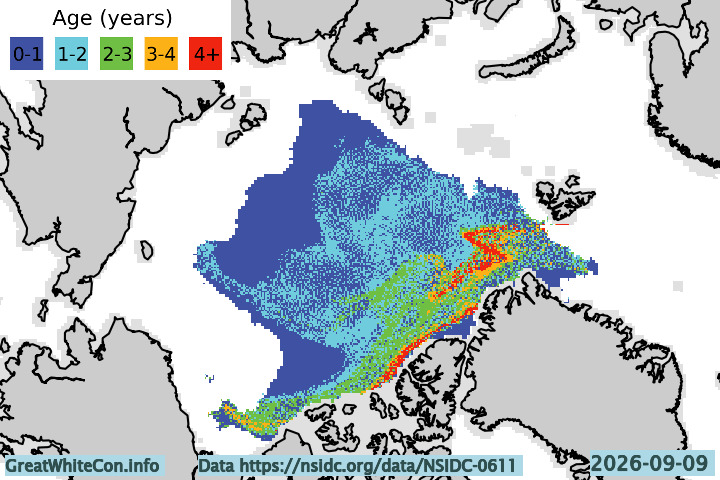
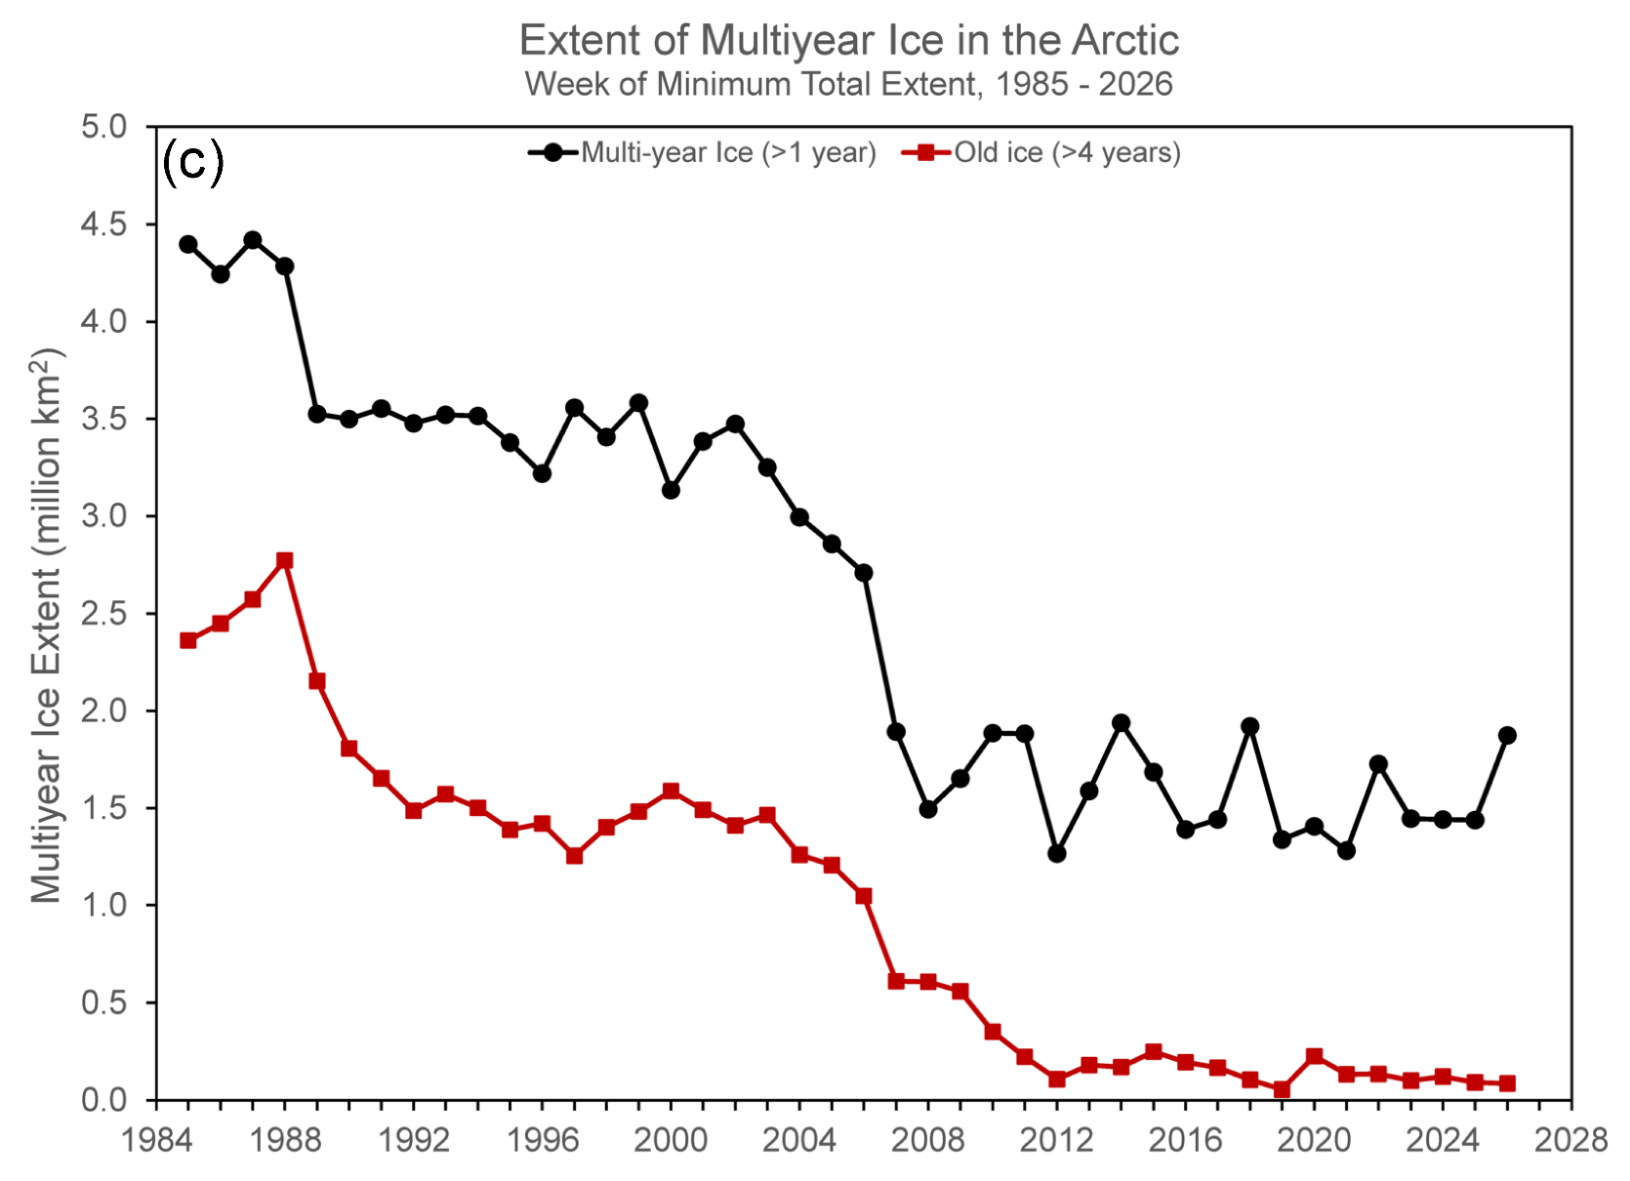
NSIDC sea ice age data is also now available once again after a lengthy hiatus. Here is a summary of the situation for the week of the 2026 minimum extent:
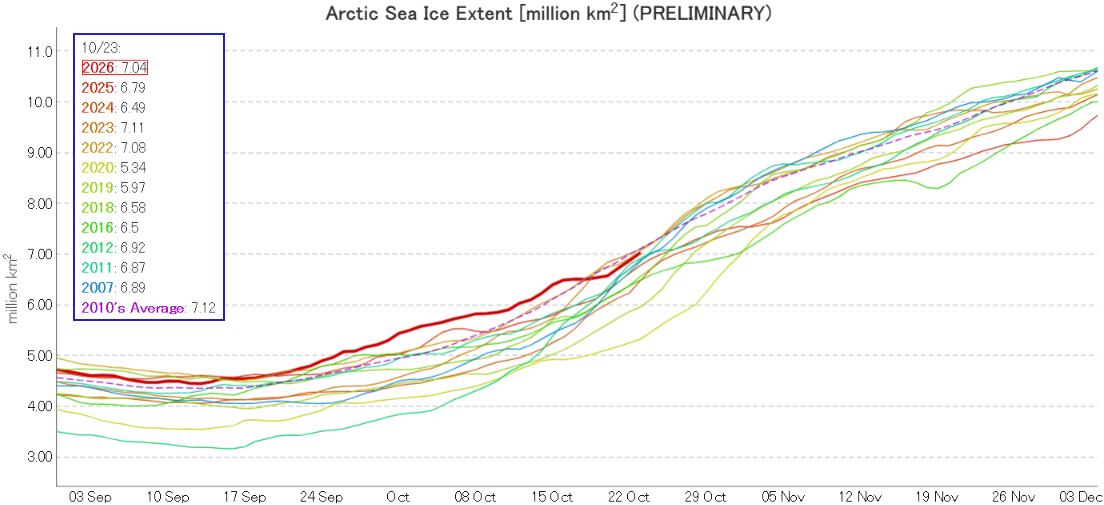
JAXA Arctic sea ice extent has just reached 7 million km², and is 10th lowest in the satellite era. Extent is just below 2022, 2023 and the 2010s average:
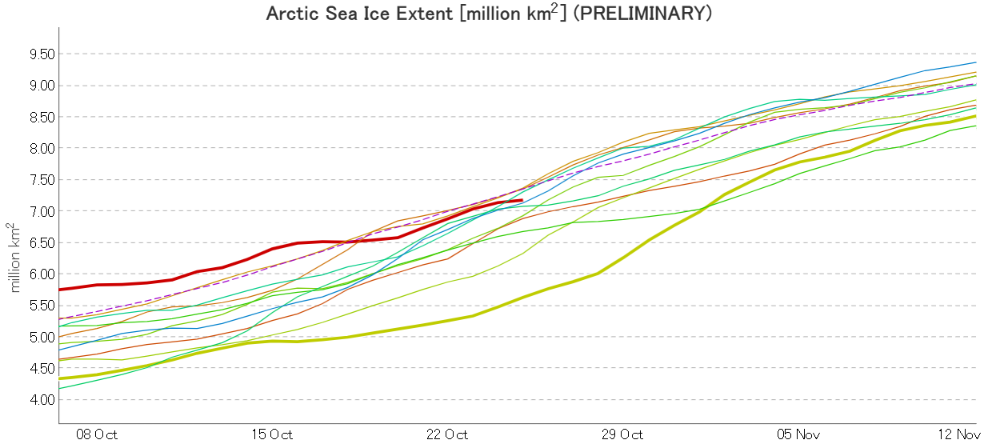
Will Going South’s prediction come to pass?
[Update – October 26th]JAXA extent verified GS’s prediction on Sunday:
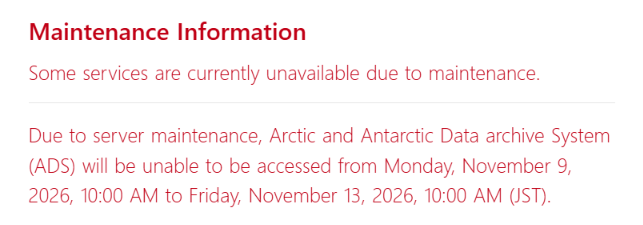
Note also that JAXA is currently predicting a multi-day ADS outage next month:
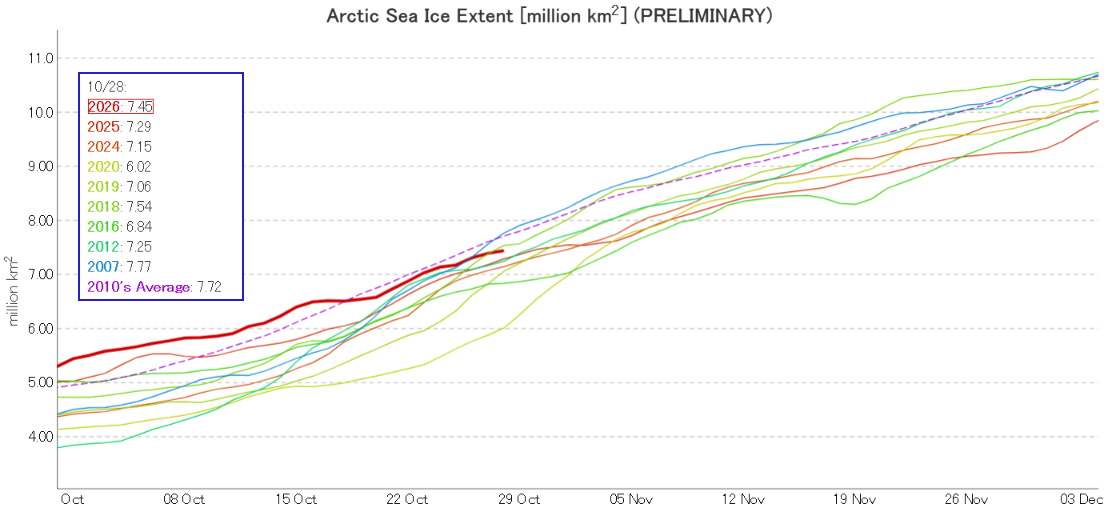
JAXA extent is now down to 7th lowest for the date (in the satellite era):
Going South’s prayers have been answered! Here is the first Arctic sea ice thickness map this Autumn, based on AWI’s combined CryoSat-2, Sentinel 3 and SMOS data:
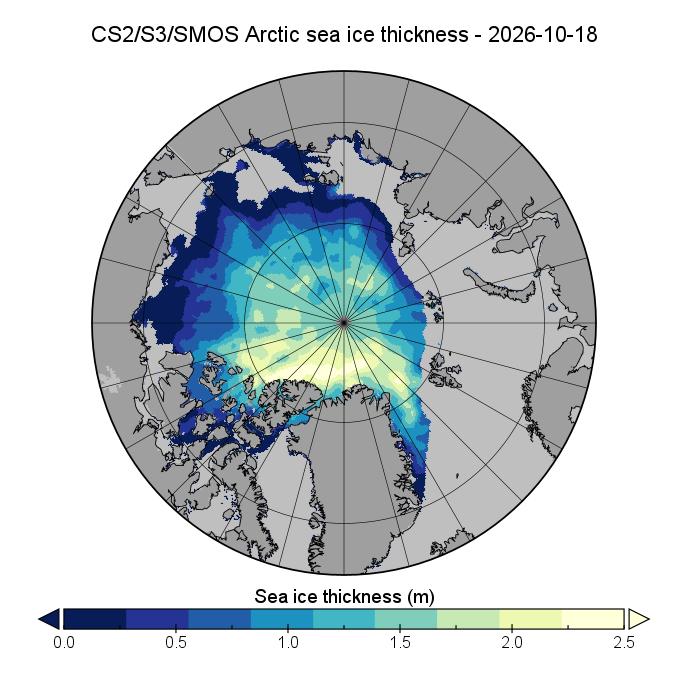
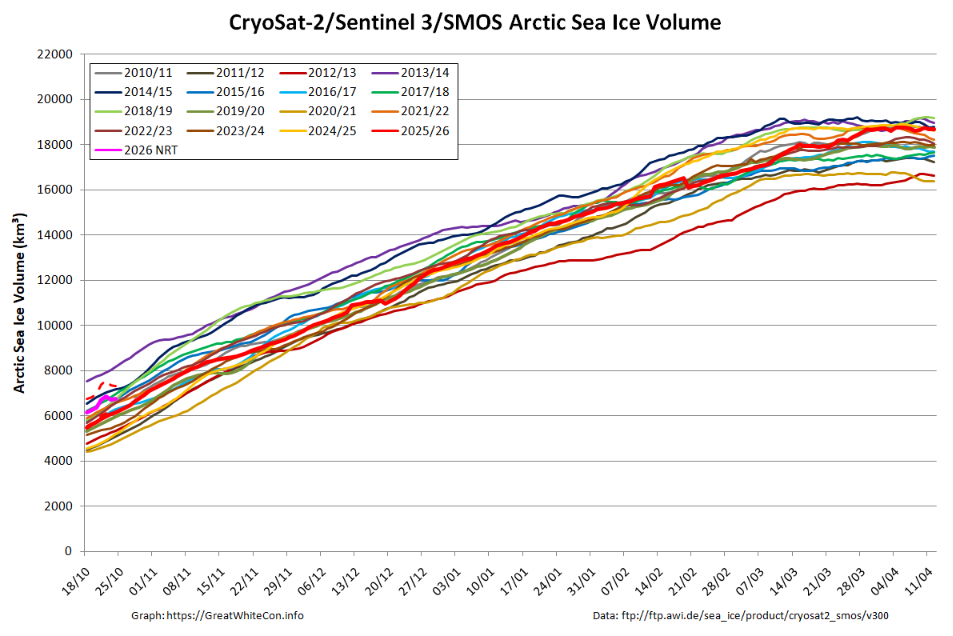
The weekly average Arctic sea ice volume centred on October 18th was 6145.7 km³.
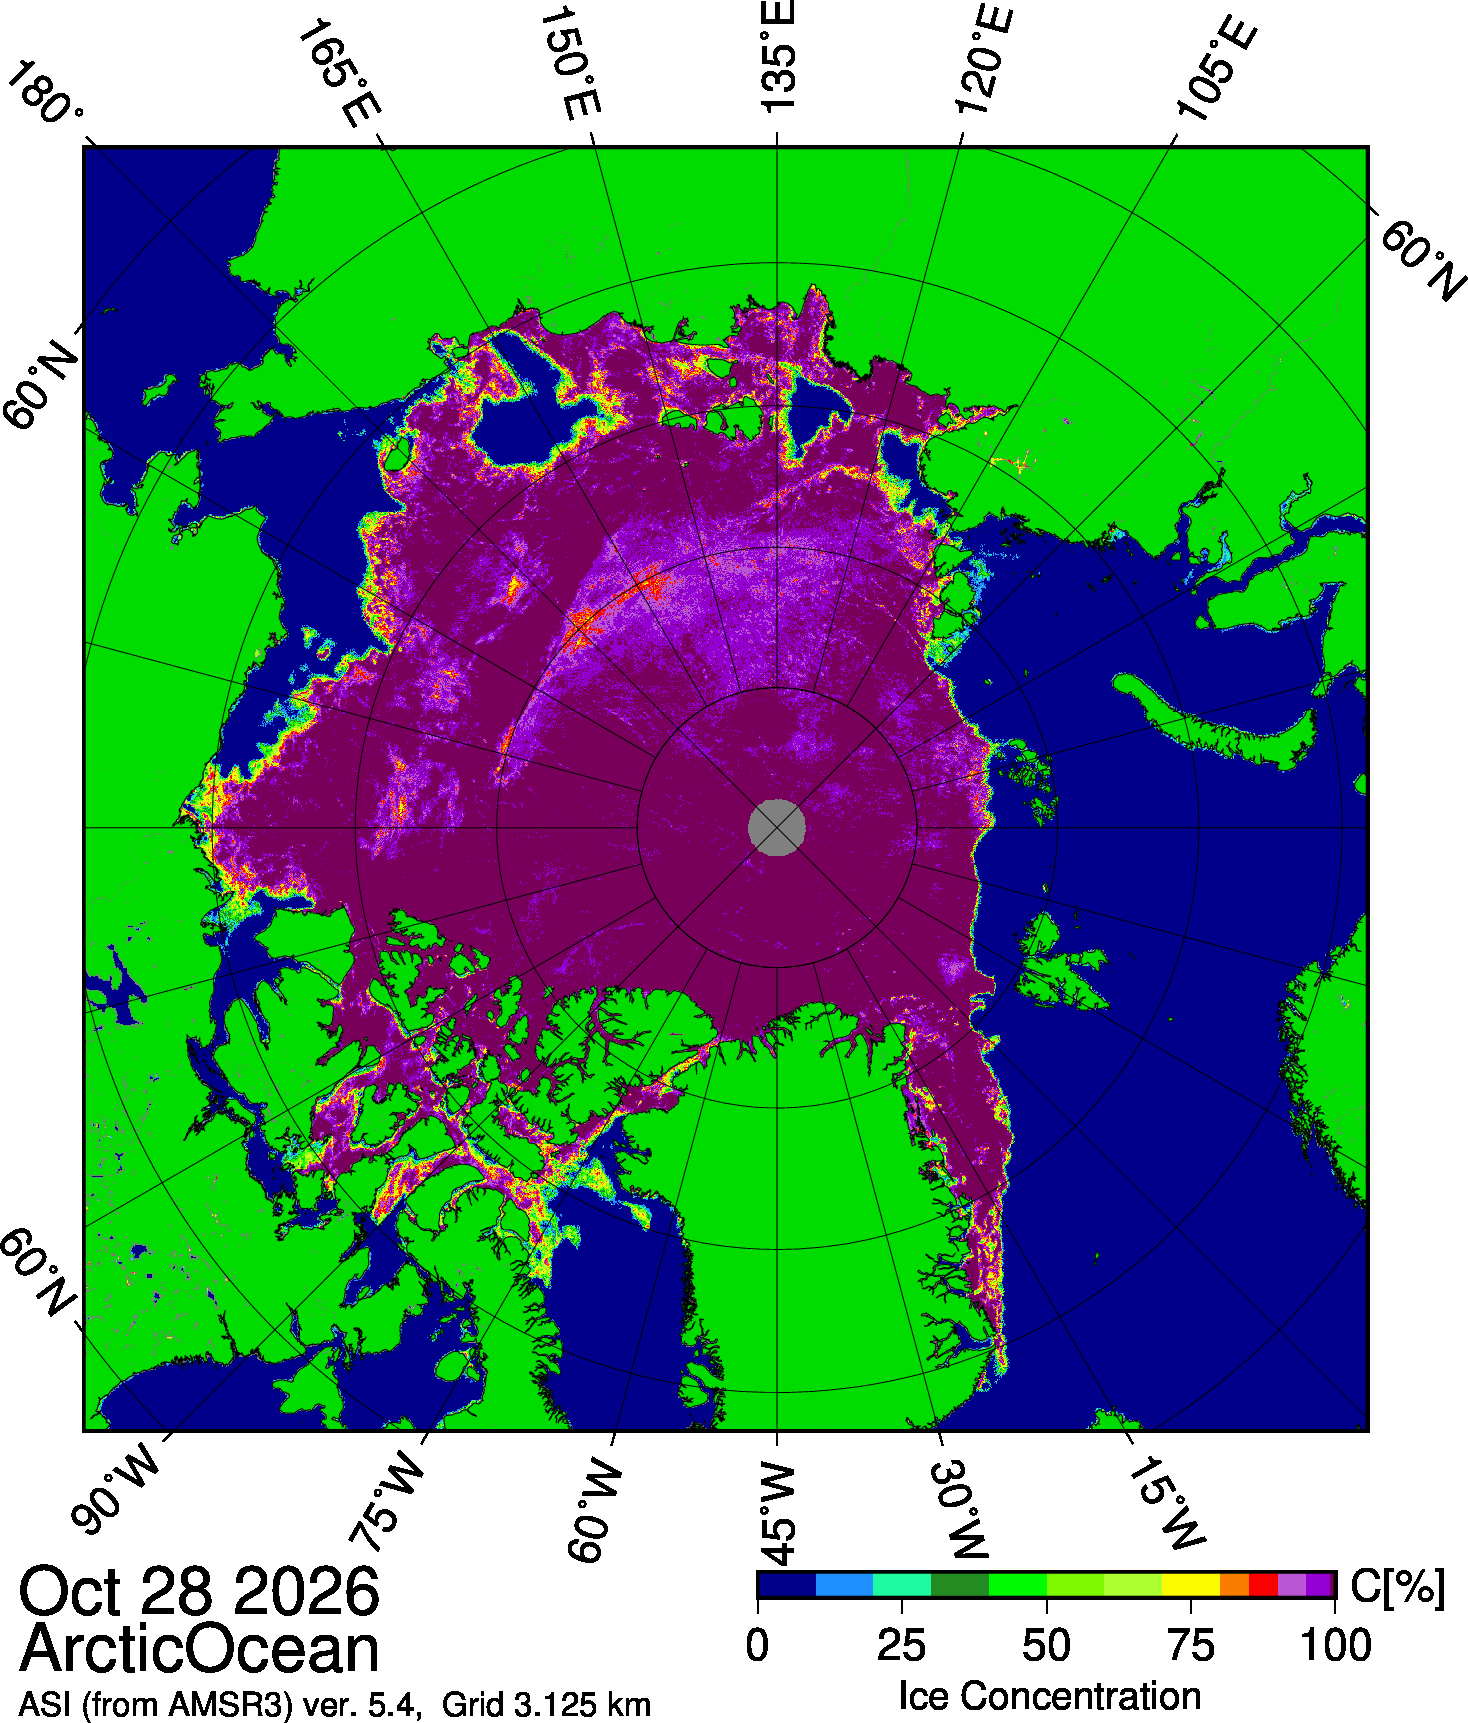
AWI’s sea ice concentration map is still stuck on October 18th, so by way of a change here is the University of Bremen’s latest concentration map, based on data from the new AMSR3 satellite:
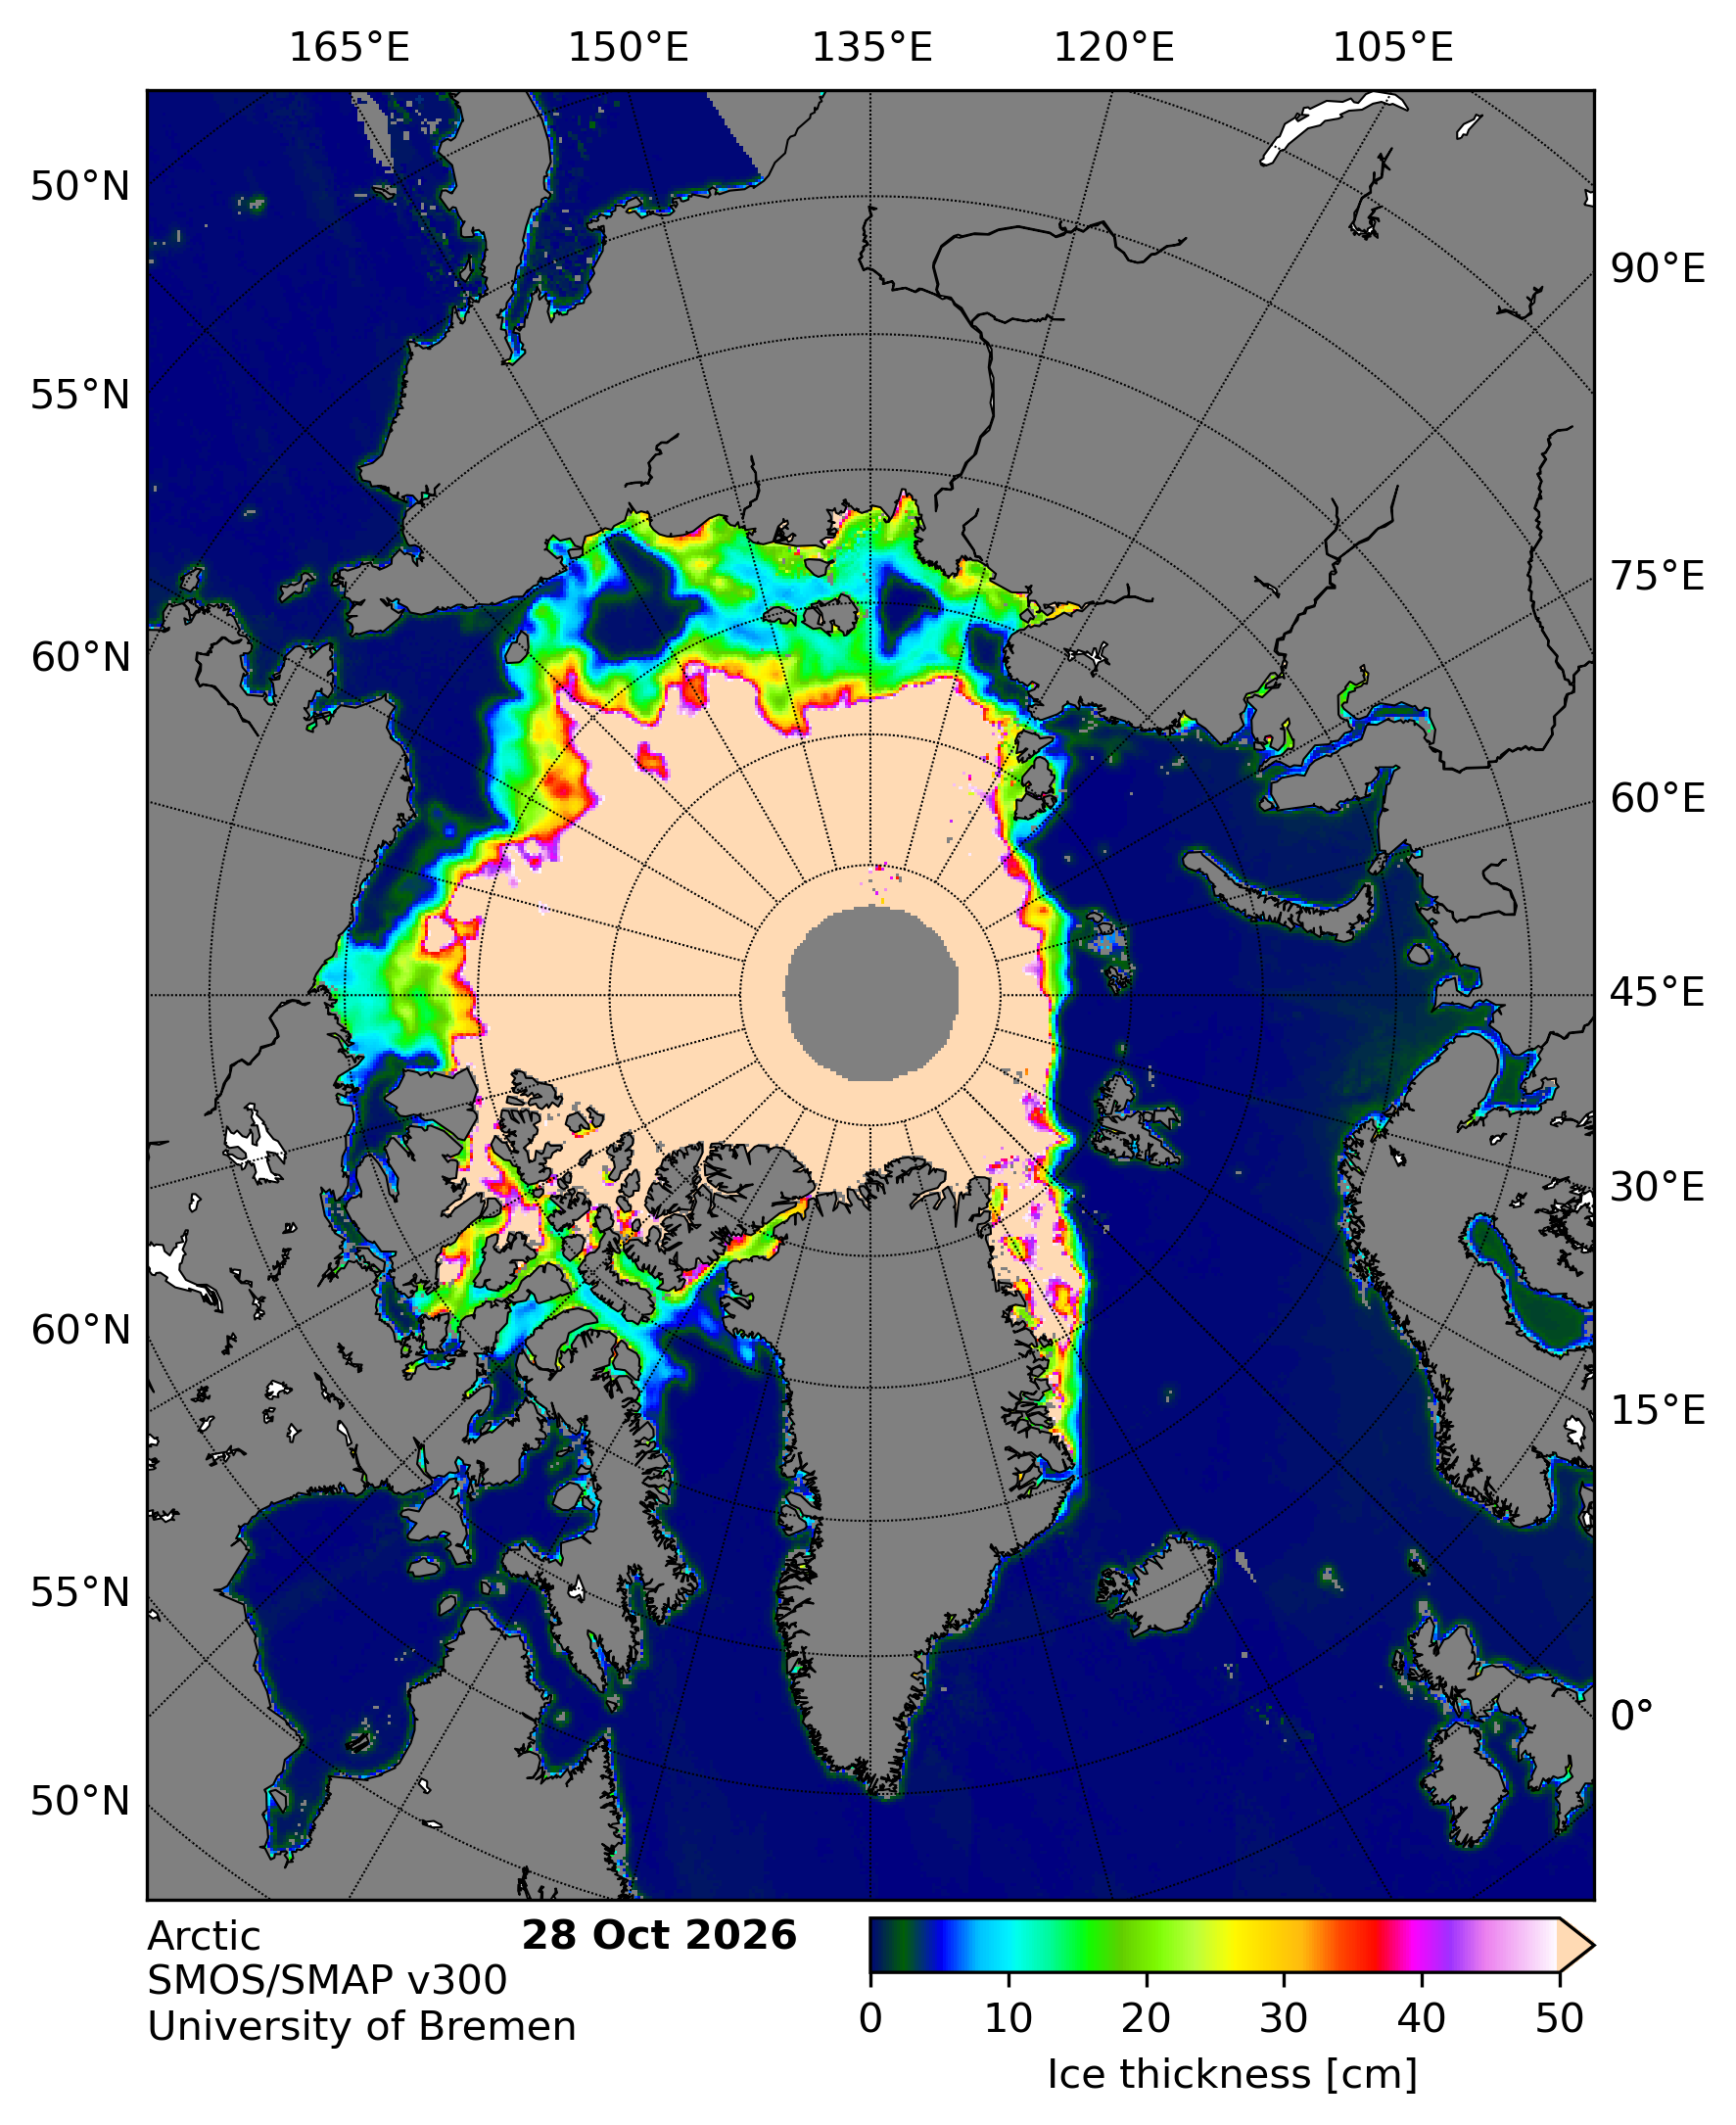
Here too is the University of Bremen’s latest SMOS/SMAP “thin ice thickness” map:
The conversation continues over on the November open thread.
Jim,
looking into the ice crystall ball:
Losing Our Cool 2027
Ice, less and cataclysmically low
Jim,
today’s surprise drop of 6602 km2, the largest in recorded history for the date, brought us back down to 11th lowest on the JAXA Arctic sea ice extent dataset.
To quote from my above linked comment: “[…] last year from mid October we were back in the single digit positions (9th and lower). Every day after Oct 30 was Top 4 lowest”.
Compared to 2025 we’re a few days late, but 9th and lower isn’t that far from 11th, so I’ll estimate single-digit position by 25th October. Maybe Top 4 starting November 1st?
Bonus: If my amateur polar physics is right, Southern Ocean ice will now start losing its Top 3 lowest sea ice extent positions, we’re currently 2nd lowest for the date.
Two days at #10 now.
And also below the 2010s average for the first time in a long time.
Will it reach single figures this week?!
I bet by the 25th which is Sunday, but binntho somehow* got ’10th’ for 21st:
An increase of 155,109 km2 and a so-called ‘century break’, which is kind of bad news if you want the 22nd to be 9th. I’m still confident for within Sunday, though 😀
*) Now for investigating how binntho got that number out of the under repair Japanese server.
“A script that ran earlier”!
Jim,
I was gonna post an excuse/explanation for why not, when end-summer time surprised me, and today’s data were already out.
I was gonna say 6x10th lowest, but alas…
But alas, we hit 9th on the 25th, just as predicted.
Sometimes I surprise even myself!
A good call GS!
When do you suppose 8th lowest will be achieved?
How about 7th lowest?
After an increase of 132,668 km² JAXA extent has sneaked below 2007 on October 26th, and is now 8th lowest for the date (in the satellite era!).
The JAXA web site is undergoing maintenance yet again:
However, a script that ran earlier suggests that extent on October 21st was 6,736,998 km². Which is an increase of ~155k.
Jim,
not even the first year we’ve sat at the end of October, wondering what the ice volume did on Sep 15. I dunno how they do it, but somehow they manage, year after year.
So the Ersatz solution this year is CryoSat, but they’re trying to set a new Quiet record, for some reason. Do you have some inside tips on when they will break their silence this late October?
Because I’m curious. And they are Über Silent.
CS3SMOS data started flowing on October 24th last year. I’ve no idea why AWI are still silent on the matter this year, since the assorted components all seem to be up and running.
For (potential) comparison purposes, here’s last years combined map:
and this year’s current SMOS map:
Jim,
Polar Portal / DMI seem to suggest this fall is utterly extraordinary, which I somehow doubt, in that both 1) late September refroze record fast, and 2) late October had a record slow freeze.
As repeated many times over: I don’t trust DMI because they refuse to display daily numbers (graphs are drawn from), plus censor anything before 2022 – even record years before 2022.
Jim,
moving on to the EU & Mercator, they’re saying this September’s minimum was at 2,958 km³, shockingly with absolutely zero media coverage: For context, PIOMAS has 2025 volume minimum at 3,874 km³ as the 2nd lowest on record, and the lowest minimum year is also more than 700 km³ higher than what Mercator claimed for 2026.
Mercator, of course, also won’t display daily numbers (graphs are drawn from), plus censor anything before 2023 – even record years before 2023.
You’ve confused me GS. I assume that you extracted that image from the Mercator sea ice bulletin?
They may not reveal “daily numbers”, but they certainly are not “censor[ing] anything before 2023”!
I agree with you that the DMI and Mercator models don’t seem to bear much resemblance to the “reality” revealed by CS2/S3/SMOS.
Jim,
granted, “censorship” may not be the most fitting word. But as we sit here with no PIOMAS volume on the 9th month, and no reliable (DMI not regarded as such), the tiny volume specific parts of Mercator are either completely quiet about 2026 minimum at a record low, or they are “economical with the fact” 2012 was lower.
For the lay-person it comes across as “always lowest ever”, just like we used to say about DMI, who finally changed their ways.
Jim,
well, Nov 1 is in and we’re at 6th. I think we’ll see 4th shortly, and then keep there or lower for the rest of 2026.
You beat me to it GS!
See also the shiny new November open thread.