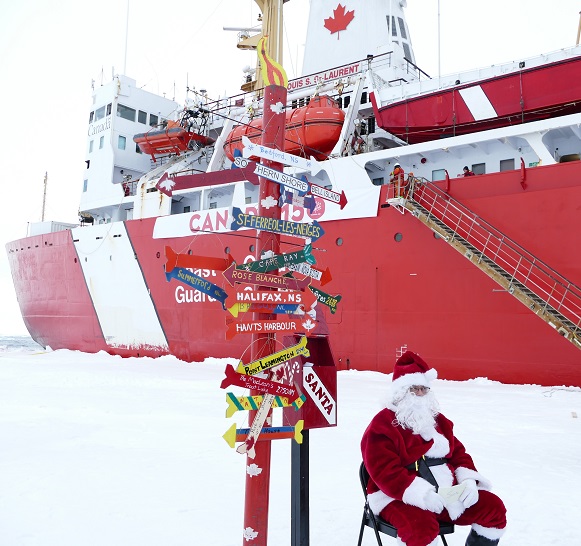
Christmas is rapidly approaching, and Santa and Snow White send festive greetings to one and all from the North Pole:
JAXA extent currently seems to be stuck on December 17th, but here’s how it looked a couple of days ago:
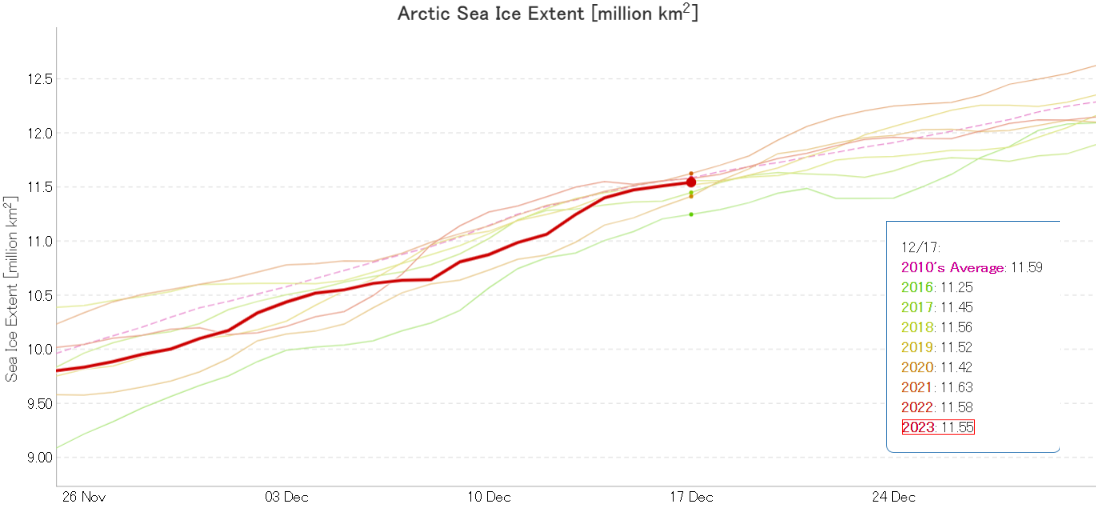
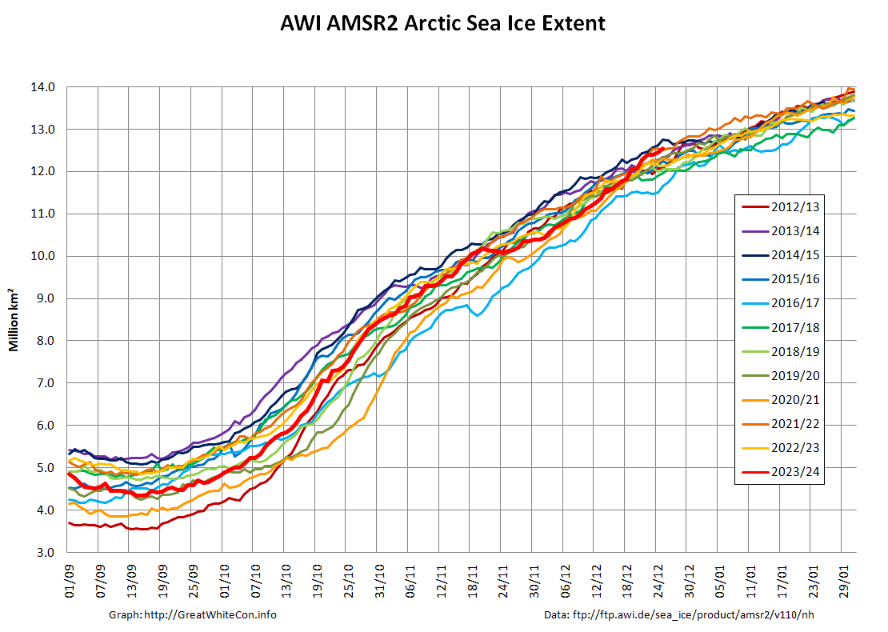
Having been comfortably in 3rd lowest position in the satellite era a few days ago, AMSR2 extent is now 5th lowest and very close to the 2010s average for the date.
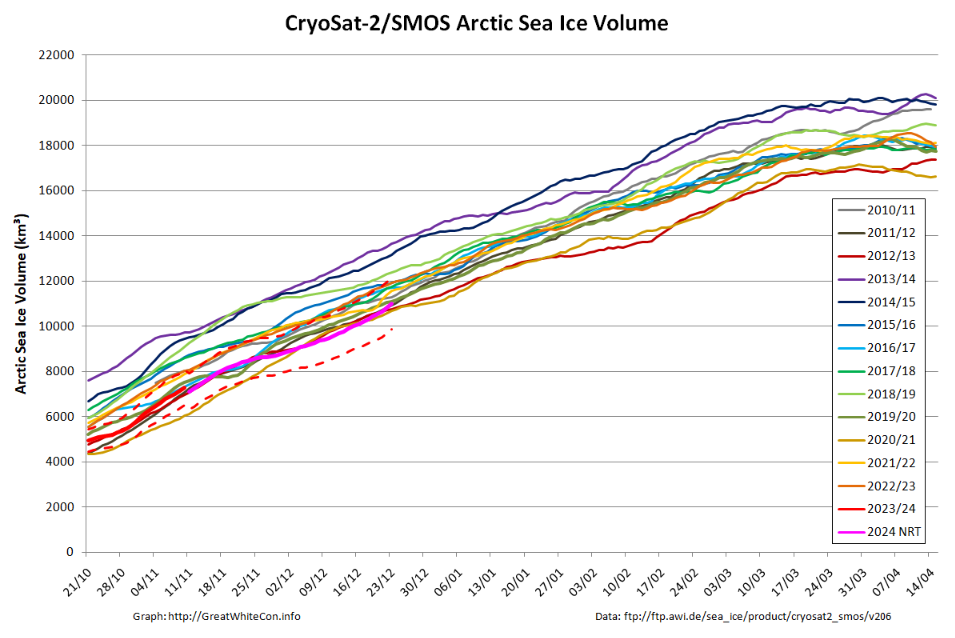
The Alfred Wegener Institute have been releasing reanalysed CryoSat-2/SMOS merged thickness data for a few days, and here is the resulting Arctic sea ice volume chart:
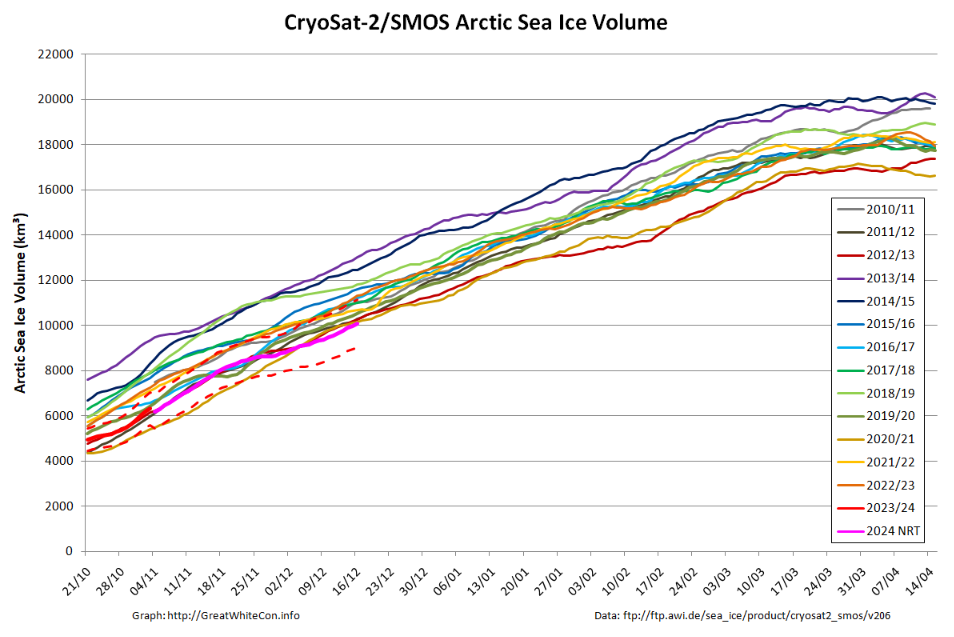
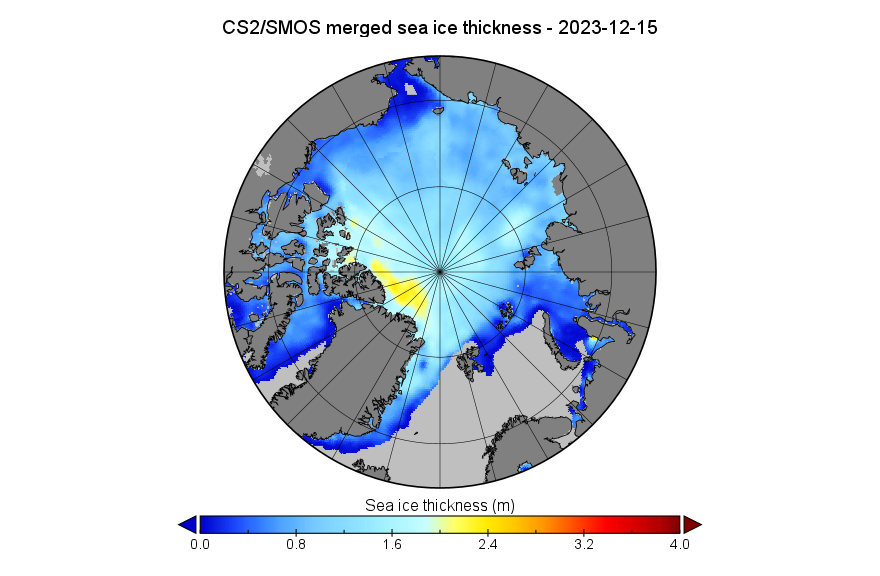
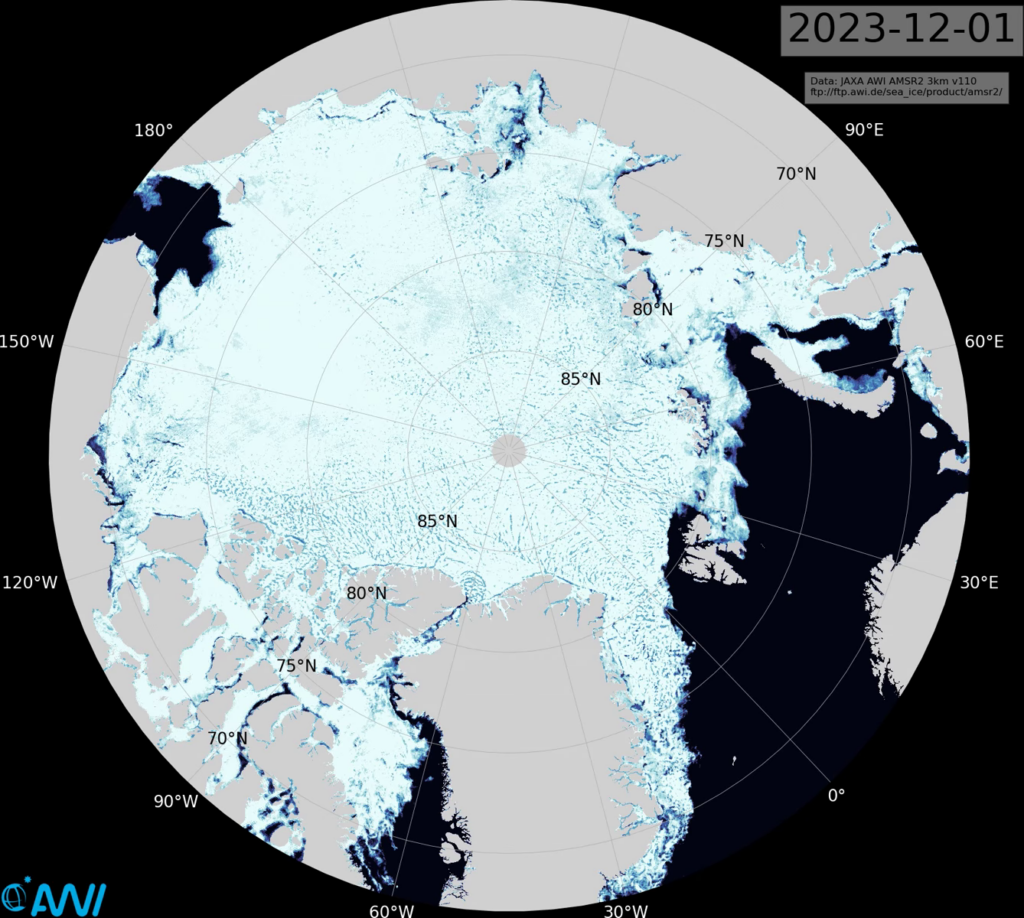
Near real time volume is currently lowest for the date in the CS2 record, but is likely to be revised upwards when the reanalysed data is eventually released. The associated NRT thickness map looks like this for December 15th:
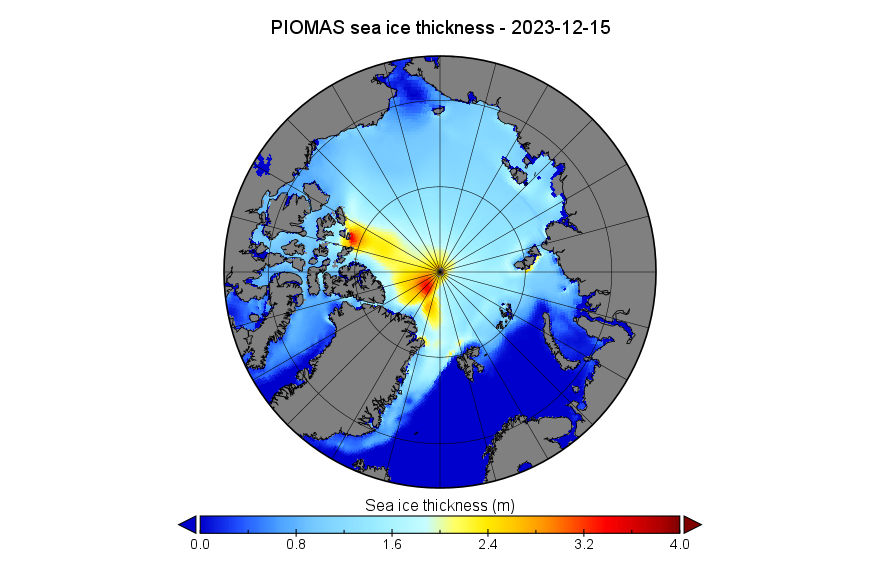
The mid-month PIOMAS modelled gridded thickness data has also been released. The calculated volume is 5th lowest in the satellite era:
Here too is the PIOMAS thickness map for December 15th:
Merry Xmas everyone, especially Matt! Here’s a couple of images from the National Snow and Ice Data Center’s latest edition of Arctic Sea Ice News. In the short term sea ice is always melting somewhere:
From November 21 to 28, a series of three extratropical cyclones followed a common track from the northeast coast of Greenland eastward along the northern edge of the Barents, Kara, and Laptev Seas. As each storm moved into the Arctic Ocean, it merged with its predecessors, creating a persistent cyclonic (counter clockwise) wind regime. The first and third of these storms originated in the Icelandic Low region before migrating up the east side of Greenland. The second storm originated just north of Greenland. Simultaneously, a center of high pressure developed over the ice-free part of the Barents Sea, becoming especially strong on November 26 to 28.
This combination of persistent low pressure to the north and west of Svalbard and a high-pressure center to the southeast created a strong, persistent flow from the south of relatively warm and moist air from the North Atlantic Ocean toward Svalbard, which then turned eastward along the marginal ice zone. This is seen as an extension of an atmospheric river into the Arctic. Atmospheric rivers are long narrow corridors that carry a large amount of water vapor. A recent study suggests that atmospheric rivers lead to ice loss by transporting warm, moist air into the Arctic that can limit sea ice growth. This is consistent with the observed pause in seasonal ice growth in late November.
And over the longer term:
From being near the bottom of the recent pack at the end of November, Arctic sea ice extent is now edging towards the top of the 2010s range. Here’s the AWI high resolution AMSR2 metric:
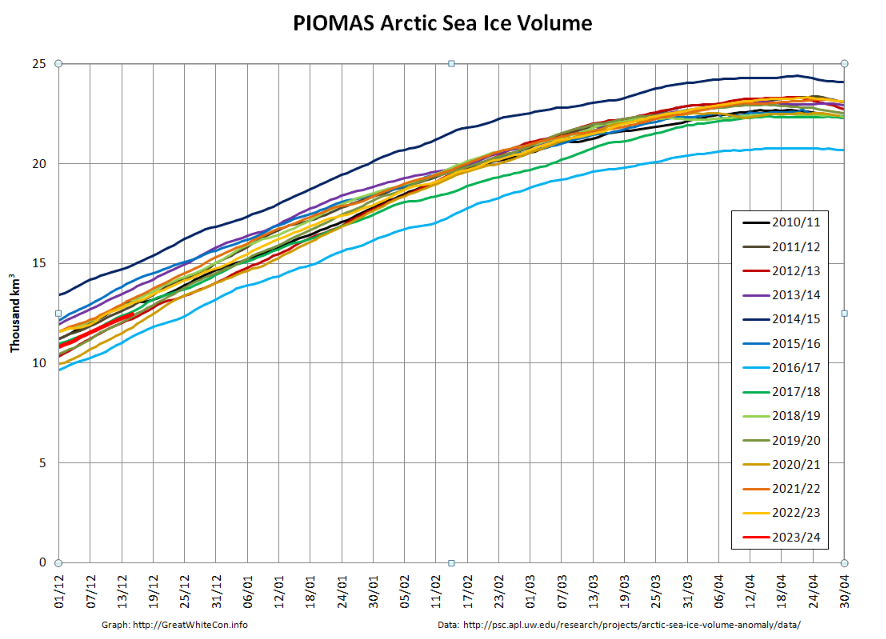
However sea ice volume has not followed suit, and remains near the bottom of the range:
Here’s an animation of sea ice motion over the last month, revealing amongst other things the recent rapid refreeze of the Chukchi Sea (click to animate):
Matt is getting very excited about the allegedly “high Arctic sea ice extent” over on XTwitter. So is Tony Heller, although he has also helpfully provided convincing empirical evidence that the IPCC’s global warming “predictions” are correct!
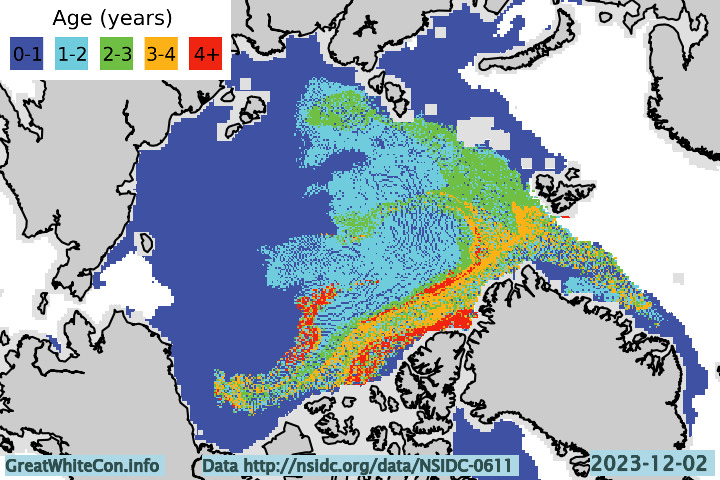
However neither of them seem to be at all interested in the age of Arctic sea ice. Here’s the early December update:
Drifting off topic only slightly, whilst perusing social media I also found this animation from Kev Pluck highly amusing:
The conversation continues on the New Year 2024 open thread.
Welcome back to your own blog, Jim. Missed the conversations…
Pleased to see you back Jim.
Year end sea ice seems to be heading for highest for some time
I’m, how unqualified are you infact?
You are what SML?
Apart from a persistent poster of apparently random comments that is!
I’m not that random- there is method.
It really grinds my gears when I can’t fix typos tho: oh well, such is life. The part that says “I’m” was of course a typo: it meant to read, of course, “Um..”
Hey, you ever seen Kingswood Country- a series from Australia back in the 80s. Ted Bullitt would’ve said, “Someone outta blow all typos up!”
– you’ll just have trust me on that one lol!
Bullpitt,.. lol, I make a correction: “Someone should blow all auto corrects up!”
“There! I’ve said it now!!” (! Ruffles paper with beer waiting patiently!)
It’s nice to see the arctic sea ice extent in good condition
Extent may be near the top of the recent range, but the same does not apply to volume. See above.
The distribution of that volume is also noticeably different from the same date last year:
The so called “last ice area” is currently lacking the traditional “oldest, thickest ice in the Arctic”.
Extent has risen quite a bit faster than usual for the last week or ten days.
Looking at the sea ice drift map, the ice is been blown ” outwards” in the Bering, Barents, Greenland seas, and Hudson Bay.
Extent,
Lol
PIOMAS reports
“November 2023 adds another month to the record of CS2 data which now spans 13 years. Neither CS2 nor PIOMAS show any discernible trend over that time period underlining the importance of internal variability at decadal timescales.”
Arctic ice volume has trended about the same since 2012.
This means it stopped shrinking nearly 12 years ago.
As I’ve mentioned previously, I don’t set much store by the thickness/volume data emanating from your source.
However DMI agree that Arctic sea ice volume is currently close to the bottom of the range of recent years:
Jim,
Still playing your little games of deception. Arctic ice volume and extent stopped decreasing 12 years ago. Why is that so hard to accept?
Arctic ice cycles around 80 years in modern times and there is no doubt that within the next few years, the ice will start increasing again.
Why were you so adamant that Arctic ice would continue shrinking? And of course the answer is that your total faith in AGW overrides any logic or common sense and now your ego won’t let you open your eyes.
Cheers
Merry Xmas Peter,
Why do you find it so hard to accept that an explanation for a “slow down” in “Arctic ice volume and extent decreasing” was provided in learned journals many moons ago, and it didn’t mention “Arctic ice cycles around 80 years”?
At the risk of repeating myself ad infinitum, please see:
https://GreatWhiteCon.info/2023/04/facts-about-the-arctic-in-april-2023/#comment-677629
Sea ice extent us due to rise
Your graph seems to be of volume Matt, not extent.
What’s more the rise you anticipate hasn’t happened yet, and physics suggests it’s not going to any time soon.
I knew you’d say that but as you know volume and extent are tandem… whatch this space…
Peter: how do you explain this supposed 80 year cycle of “modern times” ?!?
Watch*
..for the tandemness of volume and extent???
Well we’ll know in the next 10 years, or so, if the ice is going to freeze back or not… We’ll also know either, there’s nothing to worry about (good) or it’s getting a bit late to just worry ( not good?)
I’ve read of reports of the sea ice receding north of 80° in the 1940s, I assume due to lack of satellite technology at the time, that this was on the Atlantic front. Maybe Jim might know of any reports from that time of the condition of the ice in the CAA, Beaufort and East Siberian Sea, where we know a lot of multiyear ice used to accumulate up to a couple of decades ago?
That might paint a clearer picture of the arctic ice over the past 80 years or so.
Well, the NSIDC hosts digitised versions:
https://nsidc.org/data/g10007/versions/1
of DMI’s hand drawn maps:
https://nsidc.org/data/g02203/versions/1
However for obvious reasons there was a gap in those between 1940 & 1946:
Thank you Jim, even without the resolution of modern satellites the August ice, ie at the end of the summer melt appears quite a bit more extensive than recent years.
It would be interesting to hear of any accounts of how thick the ice appeared off, say the coast of Alaska at that time, but one could surmise it was thick enough given that it doesn’t appear to melt to the extent that it does today…
Bear in mind that the red symbols represent “observations”. In the absence of satellites most of the white areas are therefore “supposition”.
Jim,
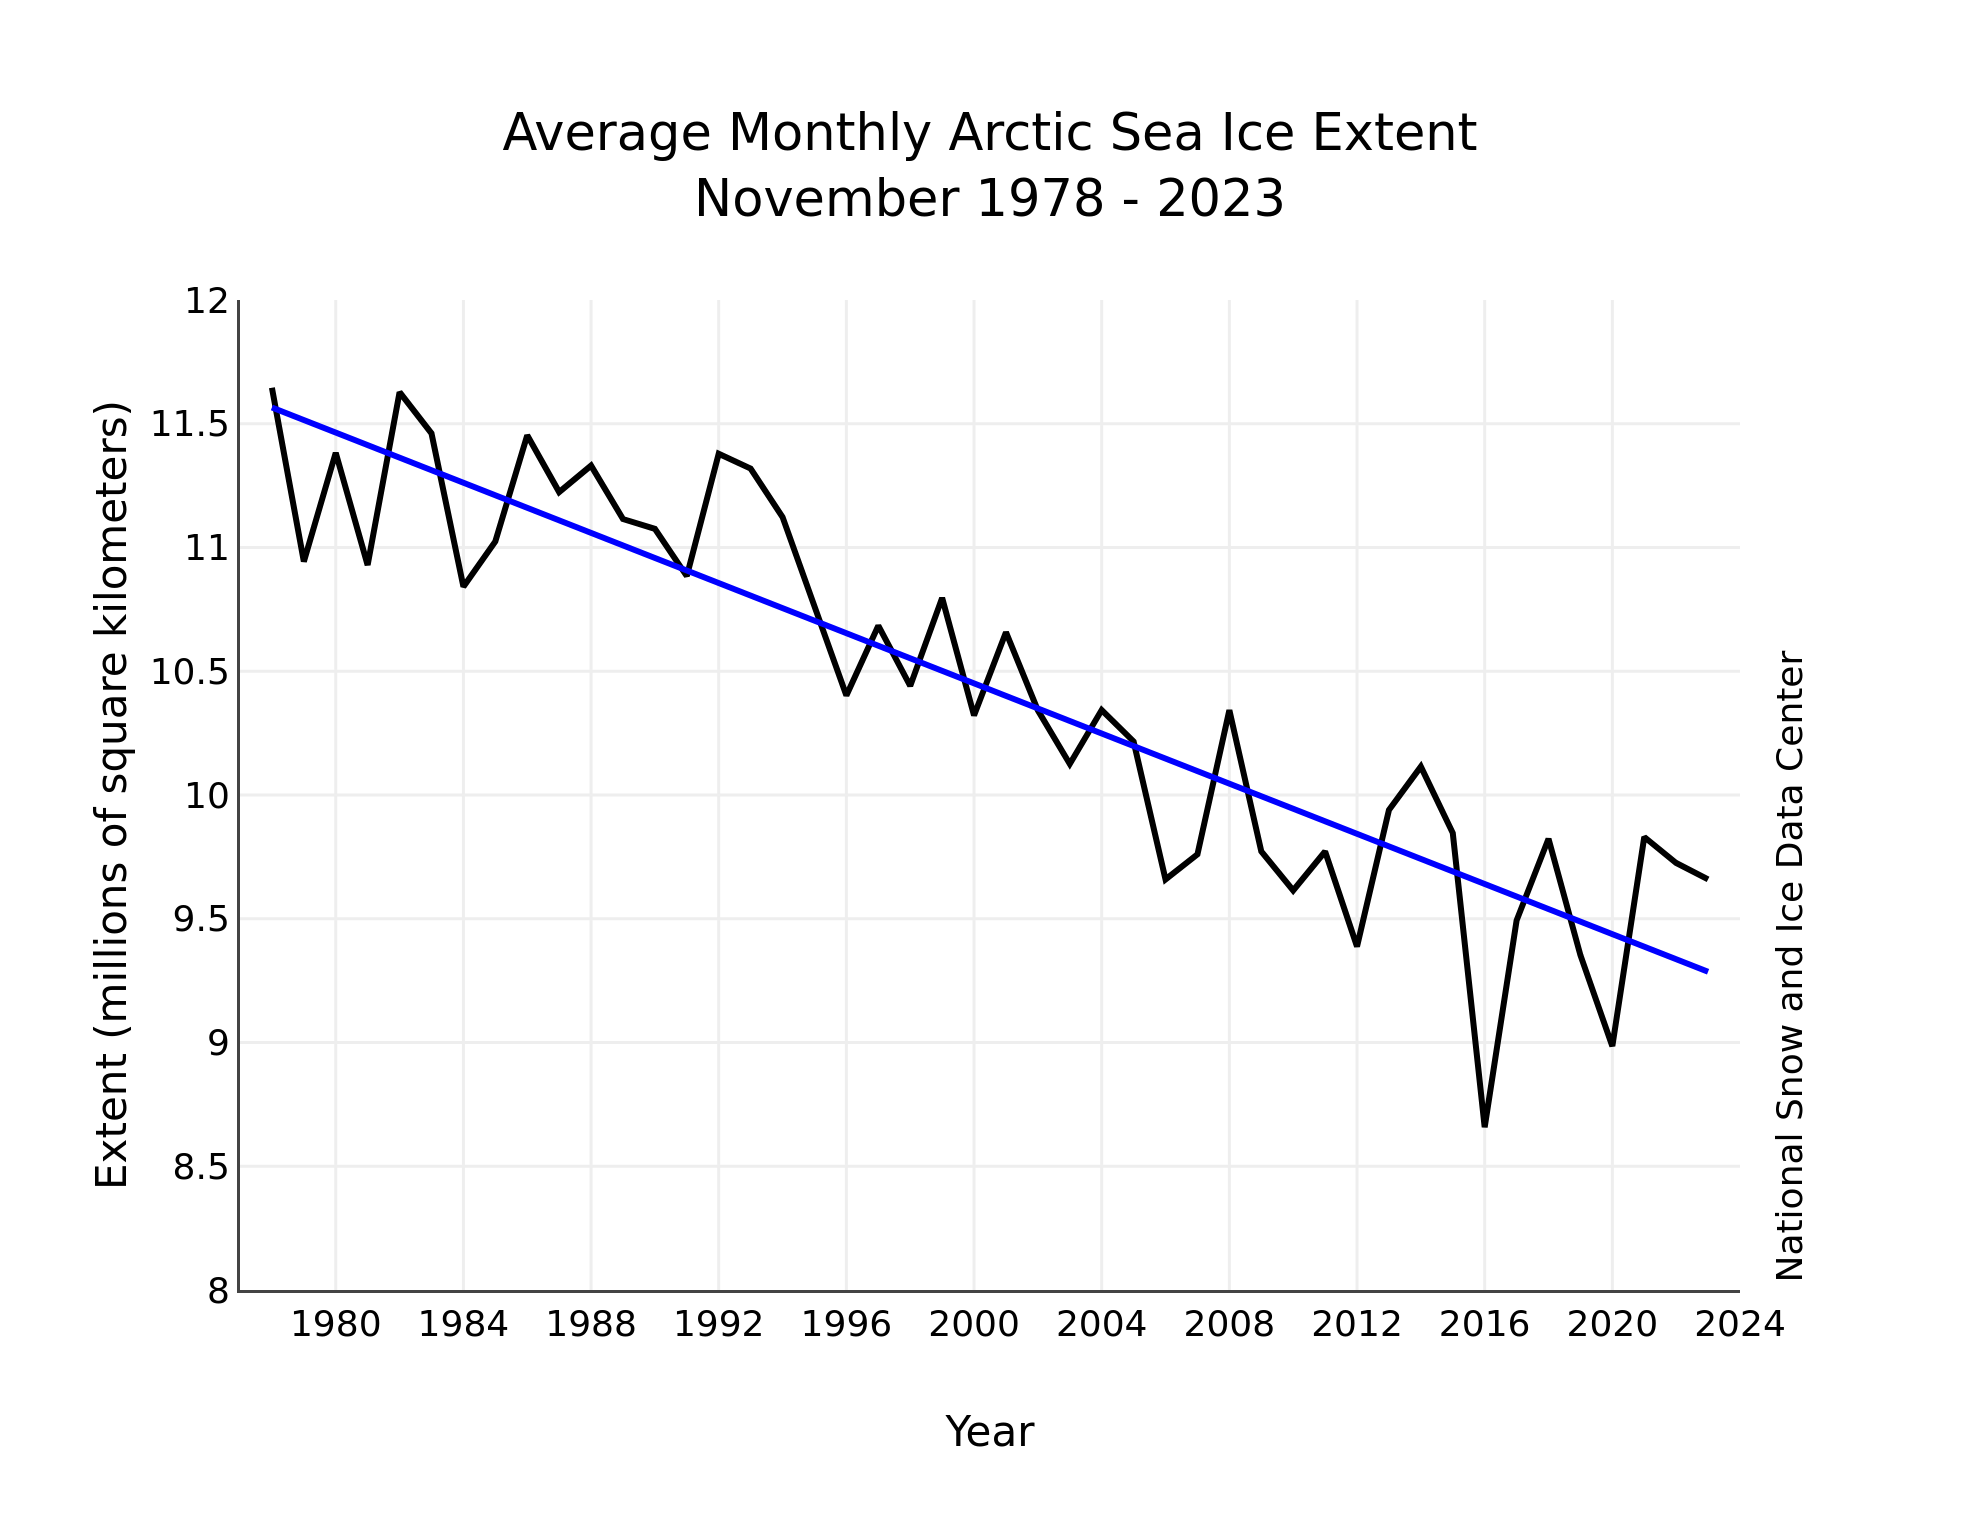
So measuring ice volume is somehow not indicative of Arctic ice trend then here is ice extent showing that there has been no significant trend since 2007.
Is this valid?
Also, why do you never post trends showing all the historical data, not just a single month?
Seasons greetings
You’ve lost me (yet again) Peter.
Where have I expressed an opinion to the effect that “measuring ice volume is somehow not indicative of [an/the?] Arctic ice trend”.
If I understand what you’re getting at, I frequently post NSIDC’s monthly trend graphs because I agree with their experts’ assessment that daily data is extremely “noisy”:
https://nsidc.org/data/g02135/versions/3
Also, having me on moderation indicates that I am considered a threat to you which I suppose is understandable.
I find lots of women sites do this because I am off message and have an annoying habit of only being impressed by data, not opinions.
Arctic ice stopped shrinking somewhere between 2007-12 but global warmists without exception will not acknowledge this indisputable fact.
Why?
And of course the answer is that Arctic ice is now off message and cannot be accepted or people might start asking questions.
You now tell us that global warming causes more snow but Dr David viner from UEA told us in 2003 the opposite.
Climate science is the only area of science that cannot be falsified. Hotter, colder, wetter, drier, more snow, less snow, less rain, more rain, etc, it can never be challenged and that makes it not science but faith, a religion, a cult, the church of AGW.
I have an open mind and you have yet to provide any evidence that Arctic ice is still shrinking. If you did I would acknowledge it.
You also dismiss reports of low Arctic ice around the 1940s with disdain but the evidence that the ice was as low as today is overwhelming. For example there are numerous examples of scientists commenting on this in newspapers but you won’t allow them to be published.
And of course they are off message and need to be banned.
Etc etc etc
I have you on moderation because otherwise you fill up the comments section of this blog with reams of unevidenced “opinion”. See above for example.
Please show me (briefly!) where I “dismiss reports of low Arctic ice around the 1940s with disdain” and provide “the (credible!) evidence that the ice was as low as today is overwhelming” which you assert is out there somewhere.
By and large “journalists” write in newspapers. All too often they get the science wrong. “Scientists” write in learned journals.
Does this additional (and firmly on topic) contribution from Kev Pluck help at all?
It doesnt change the fact arctic sea ice extent has shown no change between 2007 and today despite the global boiling fears.
Which doesn’t change the fact that daily extent is all but irrelevant, particularly at this time of year.
And which doesn’t change this fact, created as Santa’s special Xmas gift for you:
Like I’ve said before sea ice is never linear
[Excessive repetition snipped – Mod]
There’s no need to keep repeating yourself Matt.
Try adding something to the “debate” instead.
How absurd does the “cherry picking” of your nearly naked emperor need to get before you begin to question the tale he tells you, and the tale you tell yourself?
Fair enough. Heres a new study for you to have a look through
https://www.sciencedirect.com/science/article/pii/S0277379123003256?via%3Dihub
What are your thoughts?
I generally prefer physics papers to biology Matt. However see for example this new(ish) study:
“Seasonal sea-ice in the Arctic’s last ice area during the Early Holocene”
Please also see the sea ice thickness maps above.
Good study. Reminds me why I laugh when I read reports that “It’s hotter now than anytime during the past 100,000 years…”. Sure, we’re in another warming period, but nothing like ones previously in this Holocene period.
That study uses mann’s data. So I will take it with a pinch of salt.
I have no idea what you’re looking at Matt, but it’s certainly not what I’m looking at:
According to Mann’s hockey stick there was no medieval warm period, no little ice age and the planet cooled until about 1890-1900.
There is so much proxy evidence supporting the MWP and LIA that most scientists regard it as a joke. Even the Central England Temperature record shows that the LIA reached its coldest point about 1700 and we know the MWP was hotter than today because Vikings farmed parts of Greenland that are permafrost today!
So Arctic ice during that period must have been far less than today for a century or more.
“Arctic ice during that period must have been far less than today for a century or more”.
Evidence for that assertion Peter?
Hey, I’ve been waiting for,.. like,.. um, y’know like ten days now!
Where’s that evidence…!??! (Lol)
It’s simple really. You’ve just got to join the dots…
So Matt there are 97 references in Jim’s recommended reading – in one of the references Mann et al are one of 37 references – your pinch of salt is more like a grain of salt difficult to find in that pinch …. as Mann is but one of 7 Authors (and before you go down the rabbit hole of Penn State – 3 are PSU affiliated the other 4 not so much)
To reiterate
Article with 87 References > one of those Reference Articles has 37 References > One of which is a paper written by 7 authors one of whom is Mann
Pretty thin for your alleged bias
And based on my very hasty perusal of the paper in question the authors seem to be suggesting that they try not to do things the way Mann et al. do.
We may not agree on some issues but regardless. I’d like to wish you a very happy new year. I hope you have a great 2024.
Happy New Year Matt.
It can’t possibly be worse than 2023.
Can it?
All the scientific articles in existence cannot override the measured data which shows Arctic ice volume and extent have remained about the same since 2007 (extent) and 2012(volume).
Theories, projections, opinions and selective use of data cannot change the above, it is the same in JAXA, NASA, NSIDC, u of BREMEN, DMI and others.
Jim, why will you not acknowledge this simple fact? Do you not believe the data? If so, please tell us why.
But please no referring to some obscure “expert” or scientific paper that has no relevance to the fact that Arctic ice been about the same for over a decade.
Happy New Year Peter,
I keep asking you to provide evidence for your assertions, and you continually fail to do so.
I keep providing you with data, including that which I assume supports your position to some extent, and you keep on ignoring it. I seem to recall from a conversation elsewhere that you were finally going to go away and do your own due diligence, using NSIDC extent data.
What did you discover, if anything?