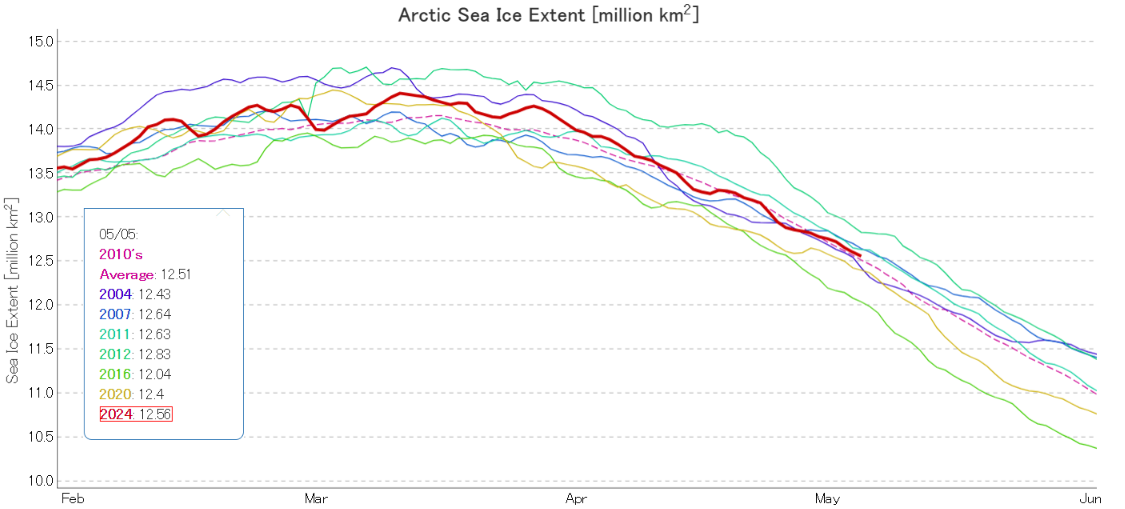
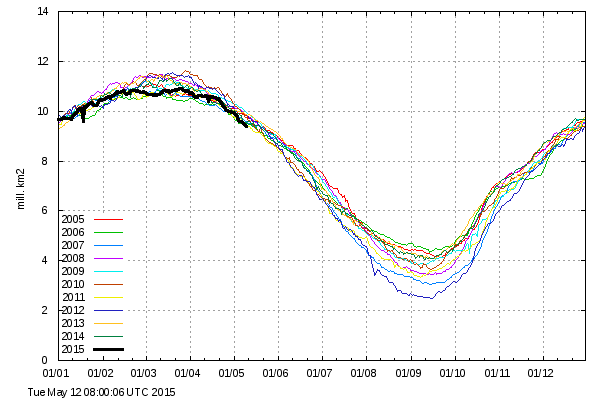
Since a certain “sceptic” has recently been comparing 2024 sea ice extent to “20 years ago”, here’s the current JAXA/ViSHOP extent graph of selected years, including 2004:
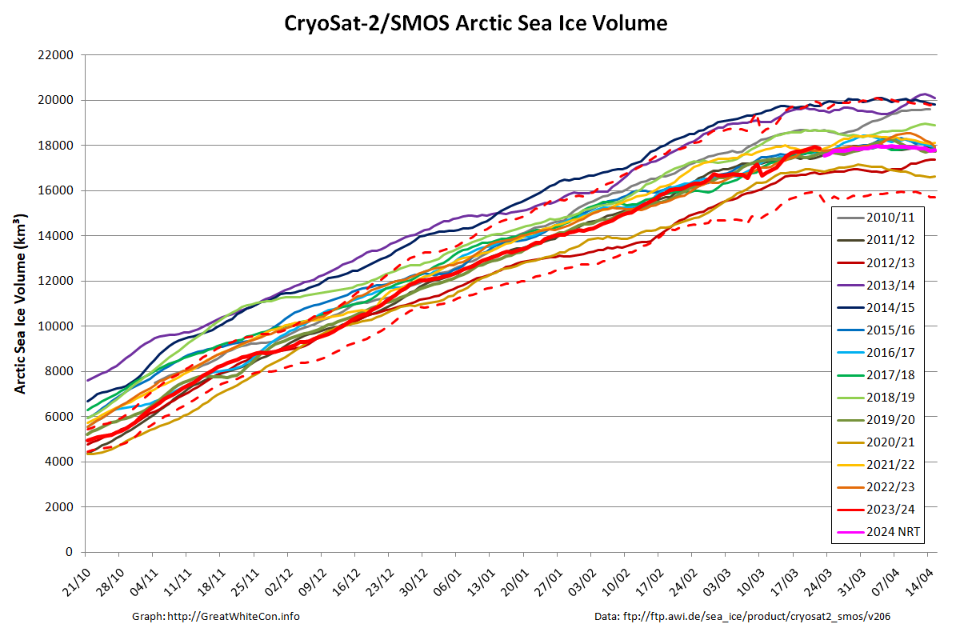
The CryoSat-2/SMOS merged Arctic sea ice volume graph finishes on April 15th, but older data is being reanalysed and here is the latest version:
The gap in the near real time data due to the problem with the SMOS satellite during the first half of March has been filled in, but the result doesn’t look very convincing to say the least!
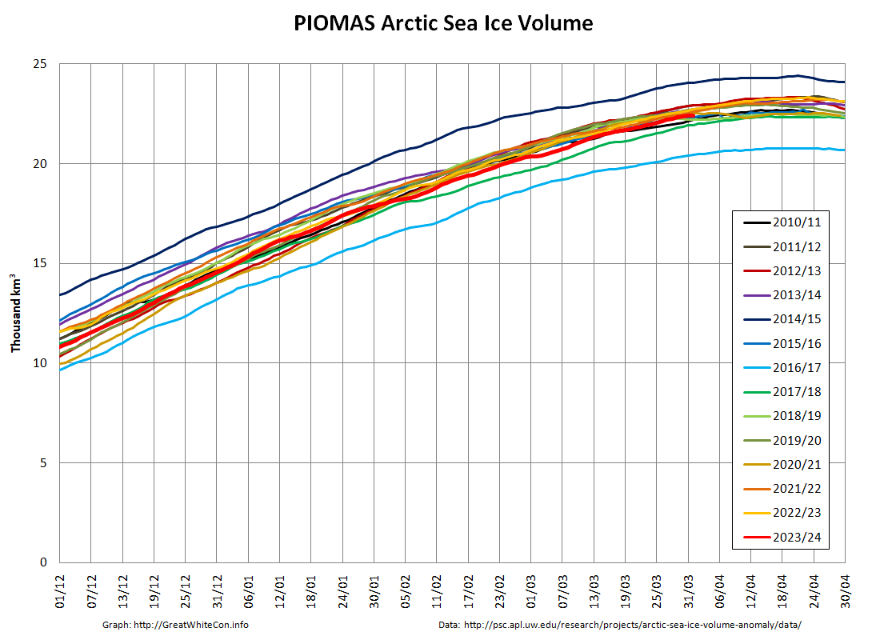
The PIOMAS gridded thickness data for April 2024 is now available. Here’s the end of month volume graph:
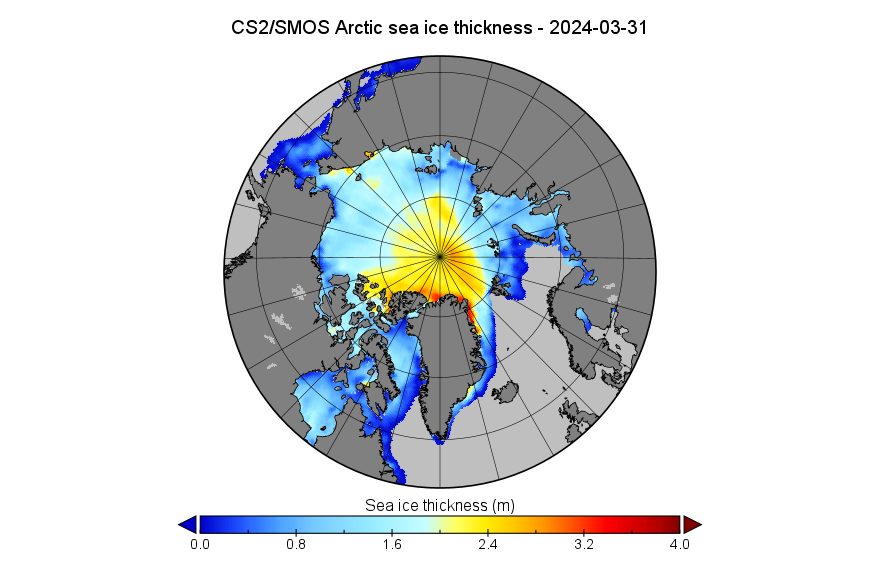
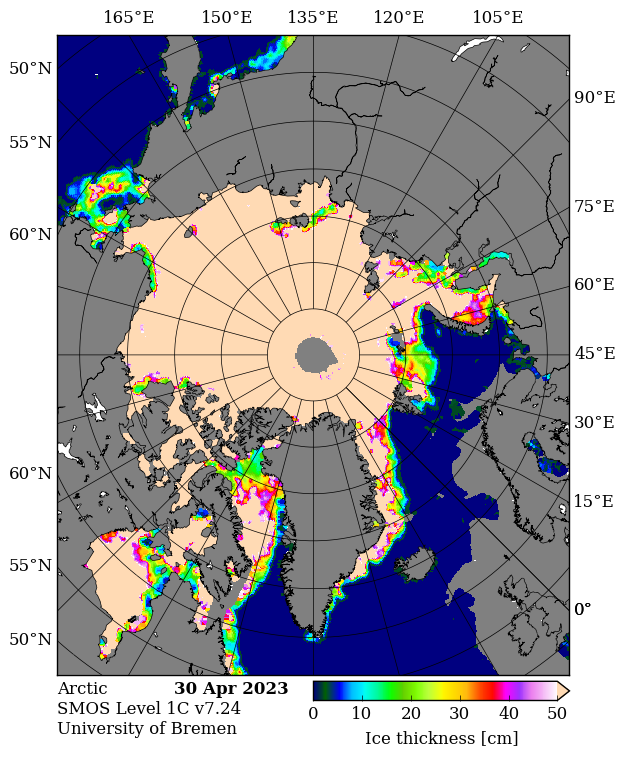
Starting this month with a look at assorted volume/thickness data, here is the CryoSat-2/SMOS merged Arctic sea ice thickness map for March 31st:
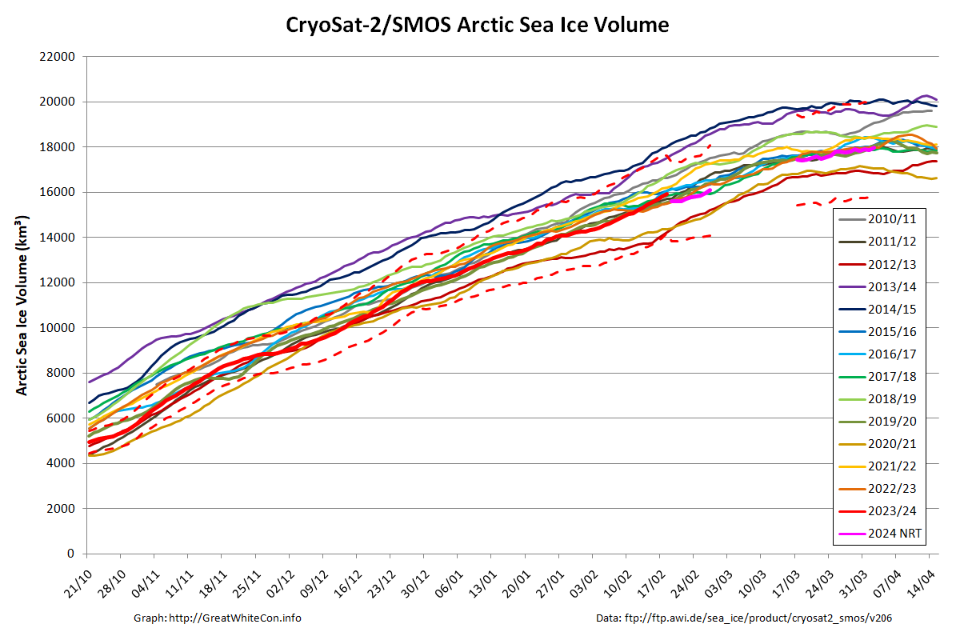
Plus the associated volume graph, which still suffers from a gap in the near real time data due to the problem with the SMOS satellite during the first half of March:
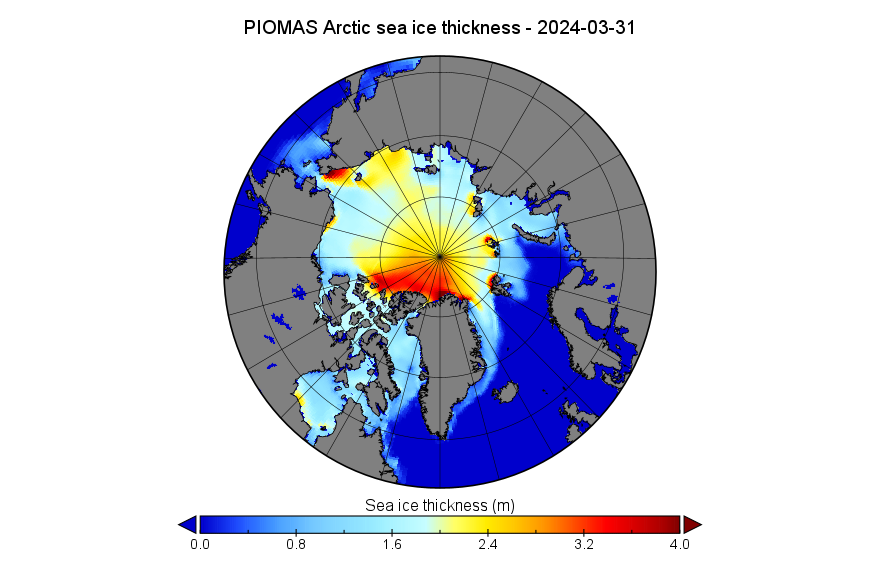
The PIOMAS gridded thickness data for March 2024 is also available. Here’s the end of month thickness map:
Plus the calculated volume graph:
Especially for Peter, here too is the DMI’s chart of monthly Arctic sea ice volume for March:
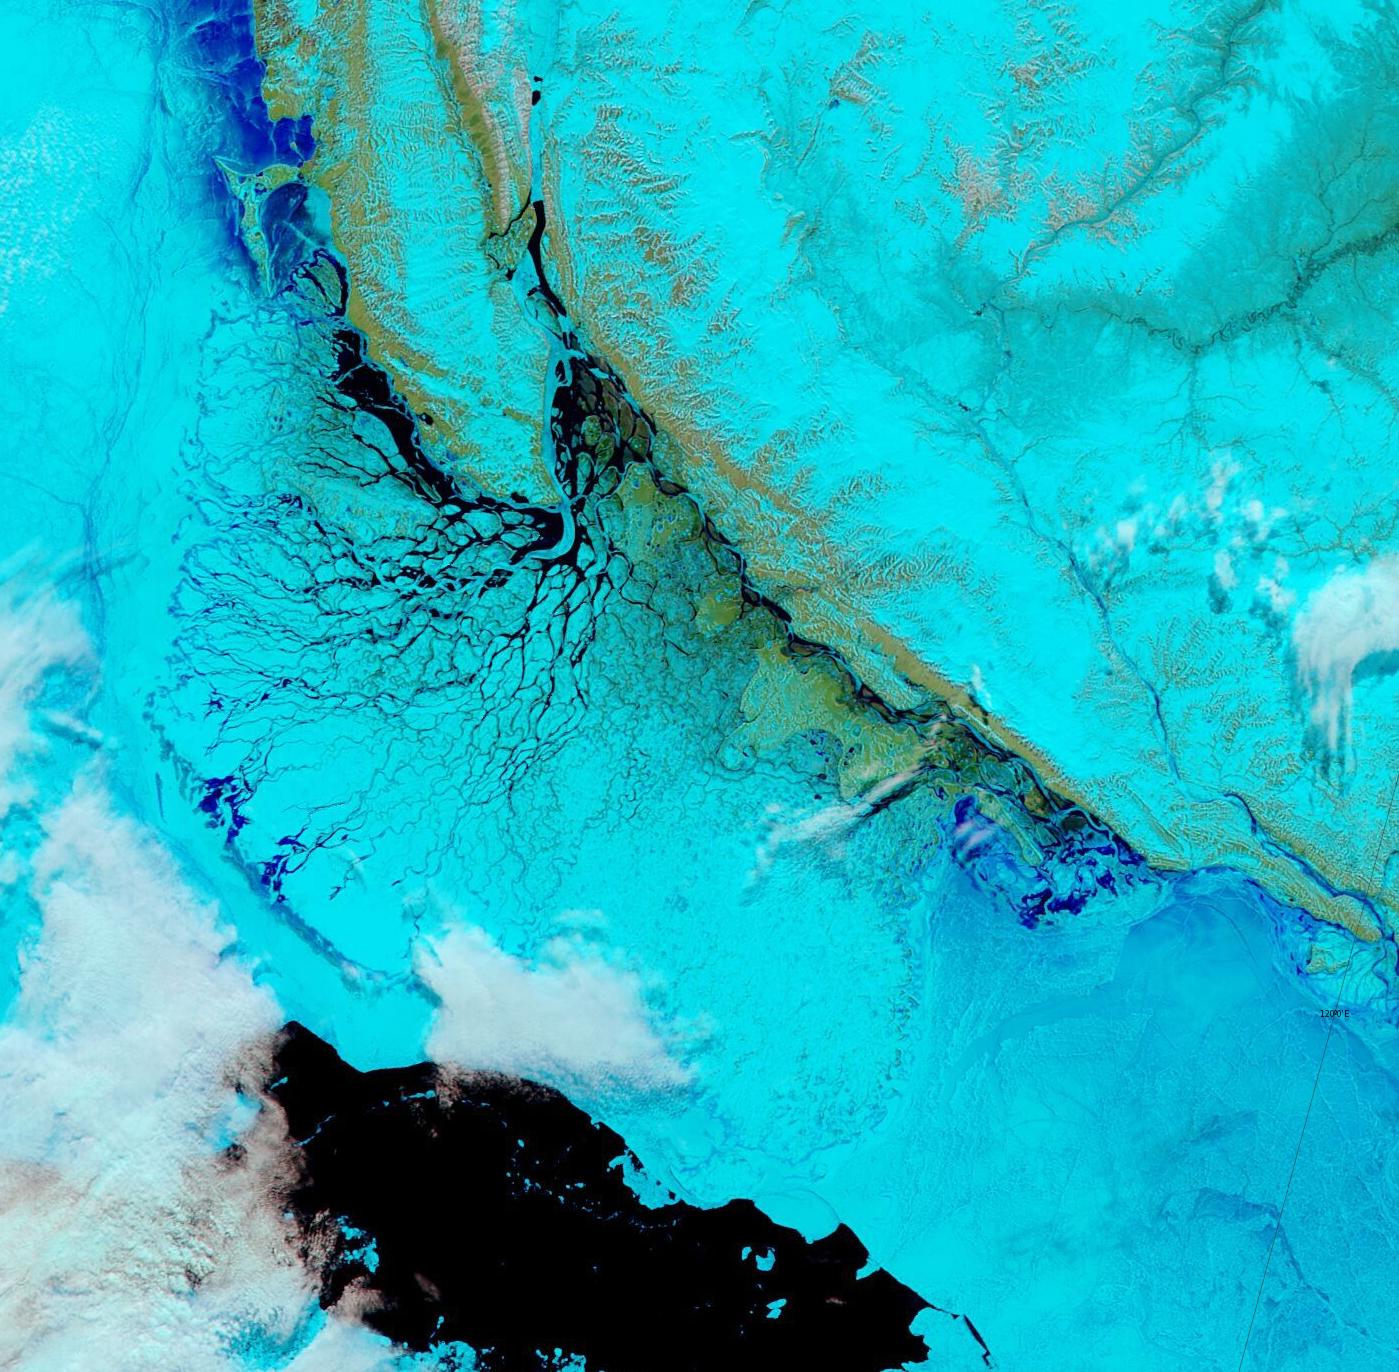
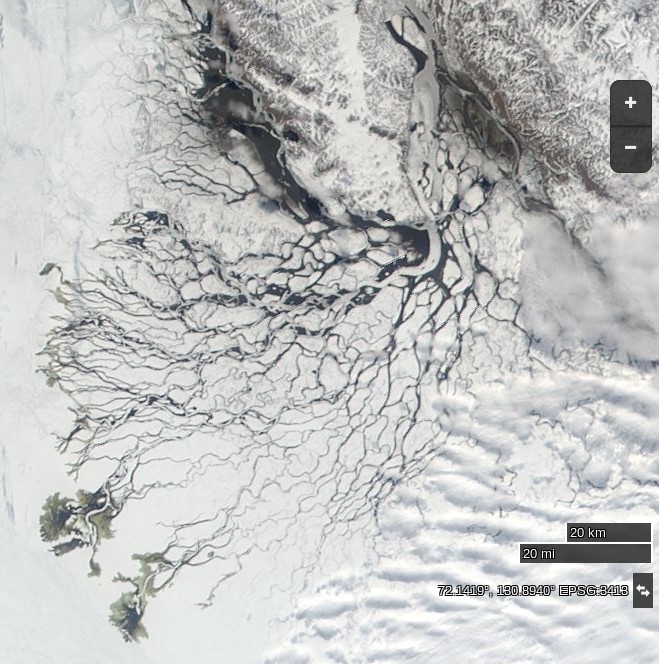
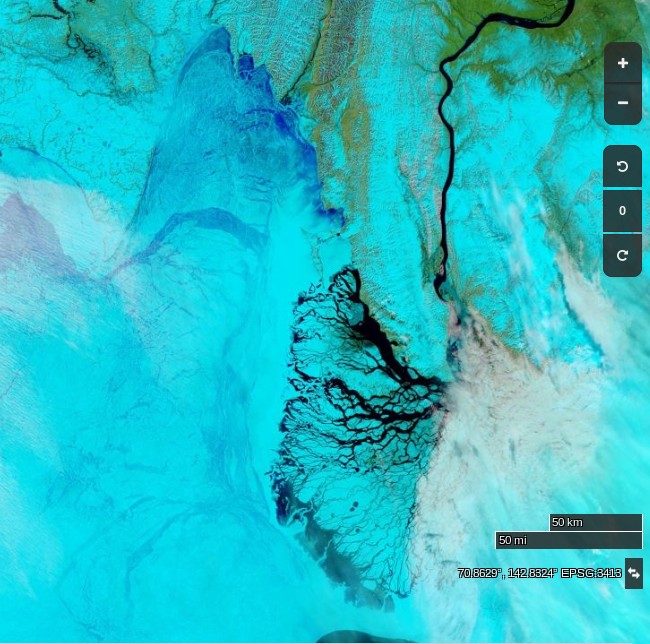
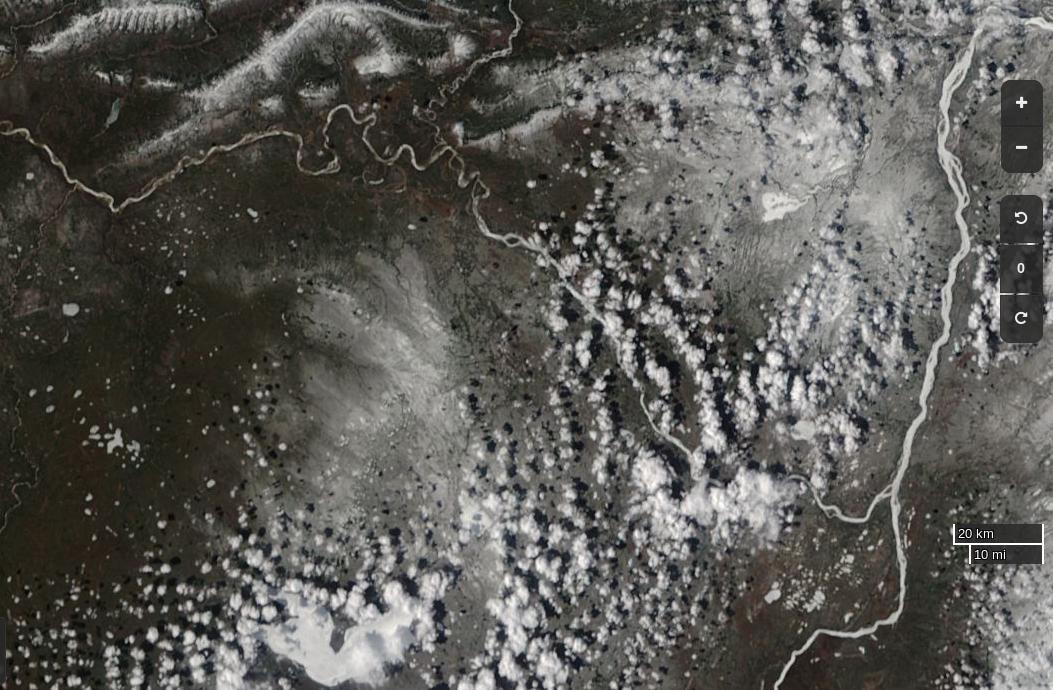
By way of a change, which is allegedly as good as a rest, let’s start the new month with a very pretty and almost cloud free “pseudo-colour” image of the Lena Delta and adjacent areas of the Laptev Sea:
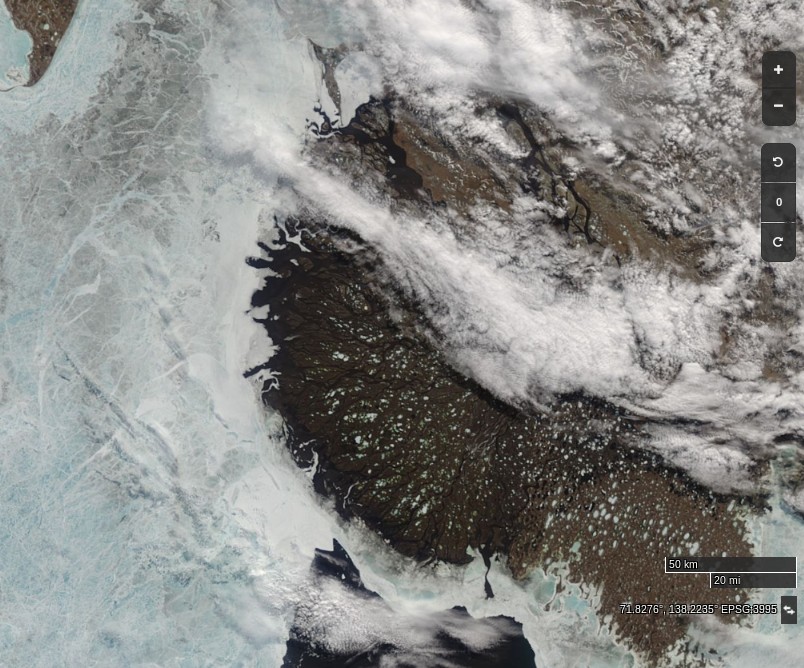
“False colour” image of the Lena Delta on June 1st from the MODIS instrument on the Aqua satellite
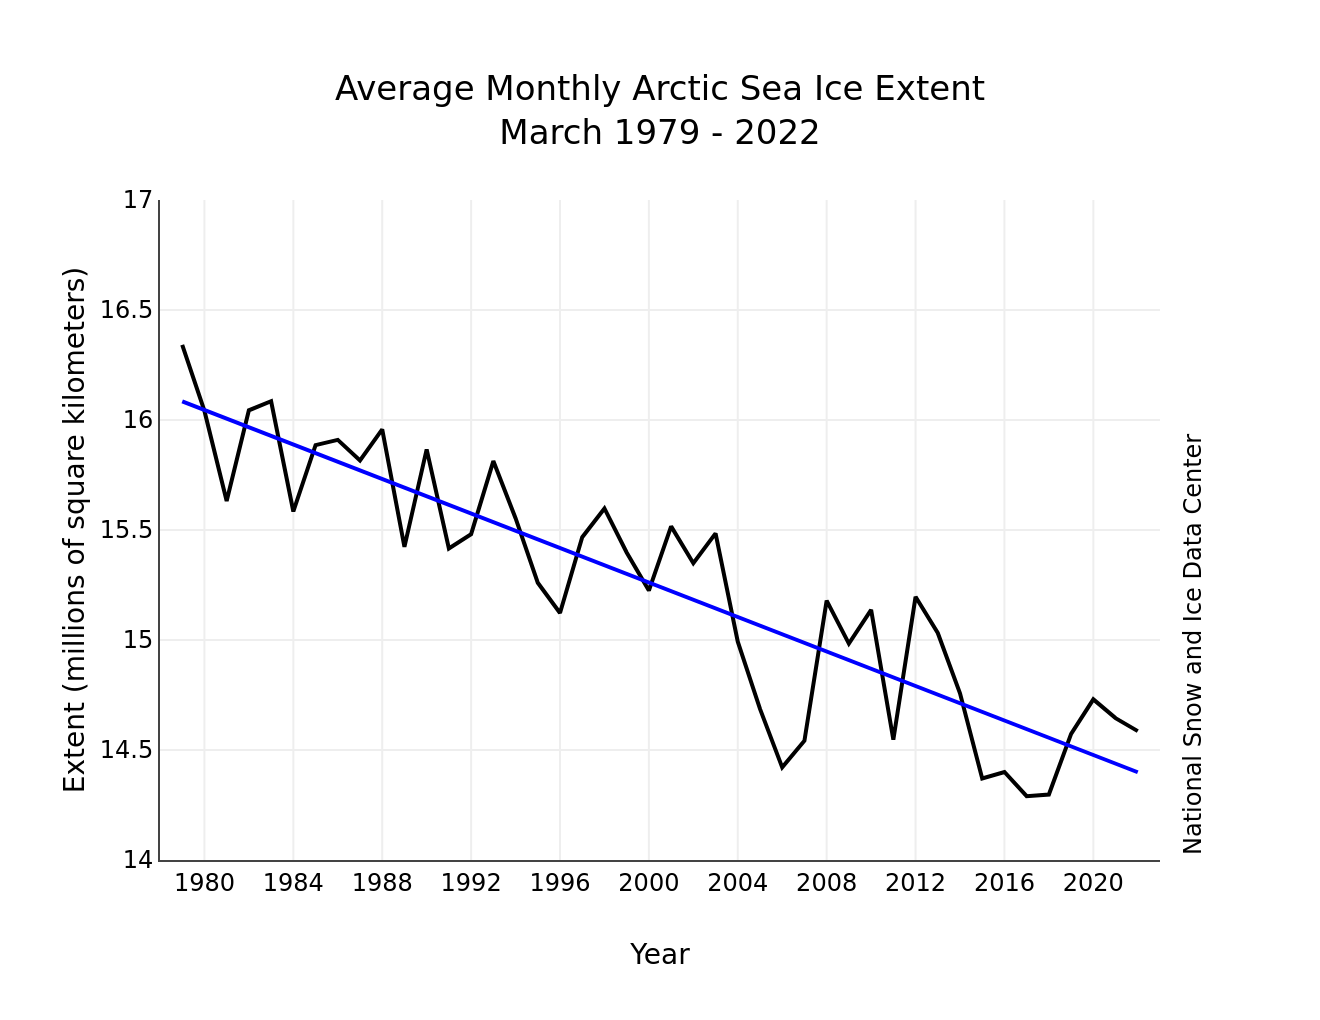
The April edition of the NSIDC’s Arctic Sea Ice News summarises March 2022 as follows:
Average Arctic sea ice extent for March 2022 was 14.59 million square kilometers (5.63 million square miles), ranking ninth lowest in the satellite record…
The total decline, after a series of small ups and downs, was only 250,000 square kilometers (96,500 square miles):
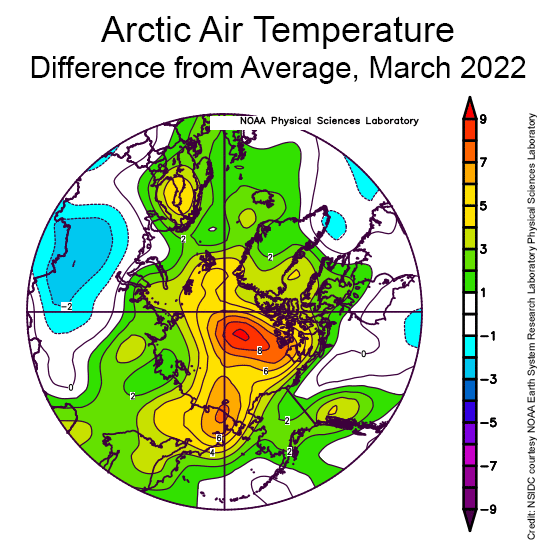
Counter to what might be expected given the very slow rate of sea ice loss over the month as a whole, air temperatures at the 925 millibar level (about 2,500 feet above the surface) were above average over all of the Arctic Ocean:
March temperatures were up to 9 degrees Celsius (16 degrees Fahrenheit) higher than average north of the Canadian Arctic Archipelago, up to 6 degrees Celsius (11 degrees Fahrenheit) above average in the East Siberian Sea, but up to 5 degrees Celsius (9 degrees Fahrenheit) above average over a wide area.
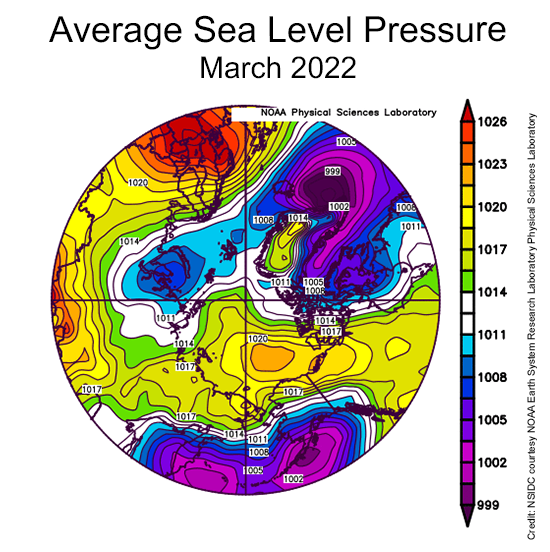
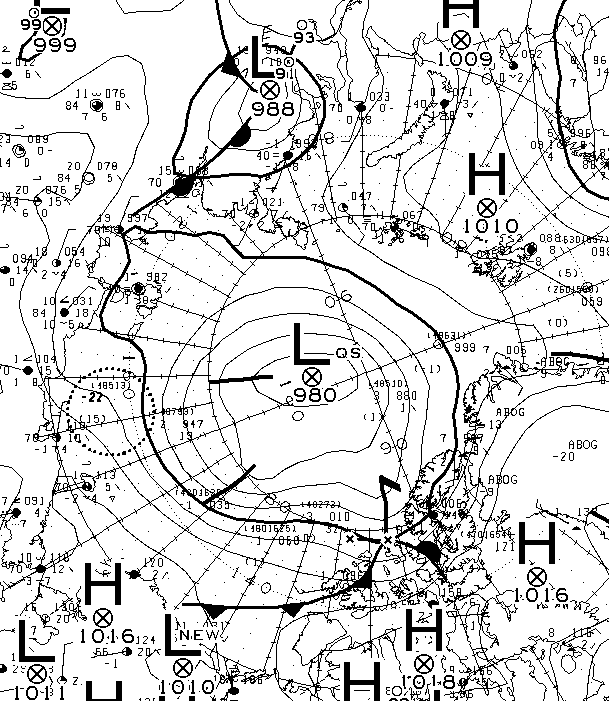
The key features of the sea level pressure pattern were high pressure (an anticyclone) over the central Arctic Ocean, a trough of low pressure extending into the Barents Sea, and an unusually high pressure over Northern Europe:
While having an anticyclone over the central Arctic Ocean is quite typical for this time of year, the combination of the high pressure over northern Europe and the pressure trough to the west led to a strong pressure gradient, leading to strong winds from south through the Norwegian and Barents Seas…
This can be tied to the extreme warm event over the Arctic Ocean seen in the middle of the month, associated with strong water vapor transport and the passage of several strong cyclones.
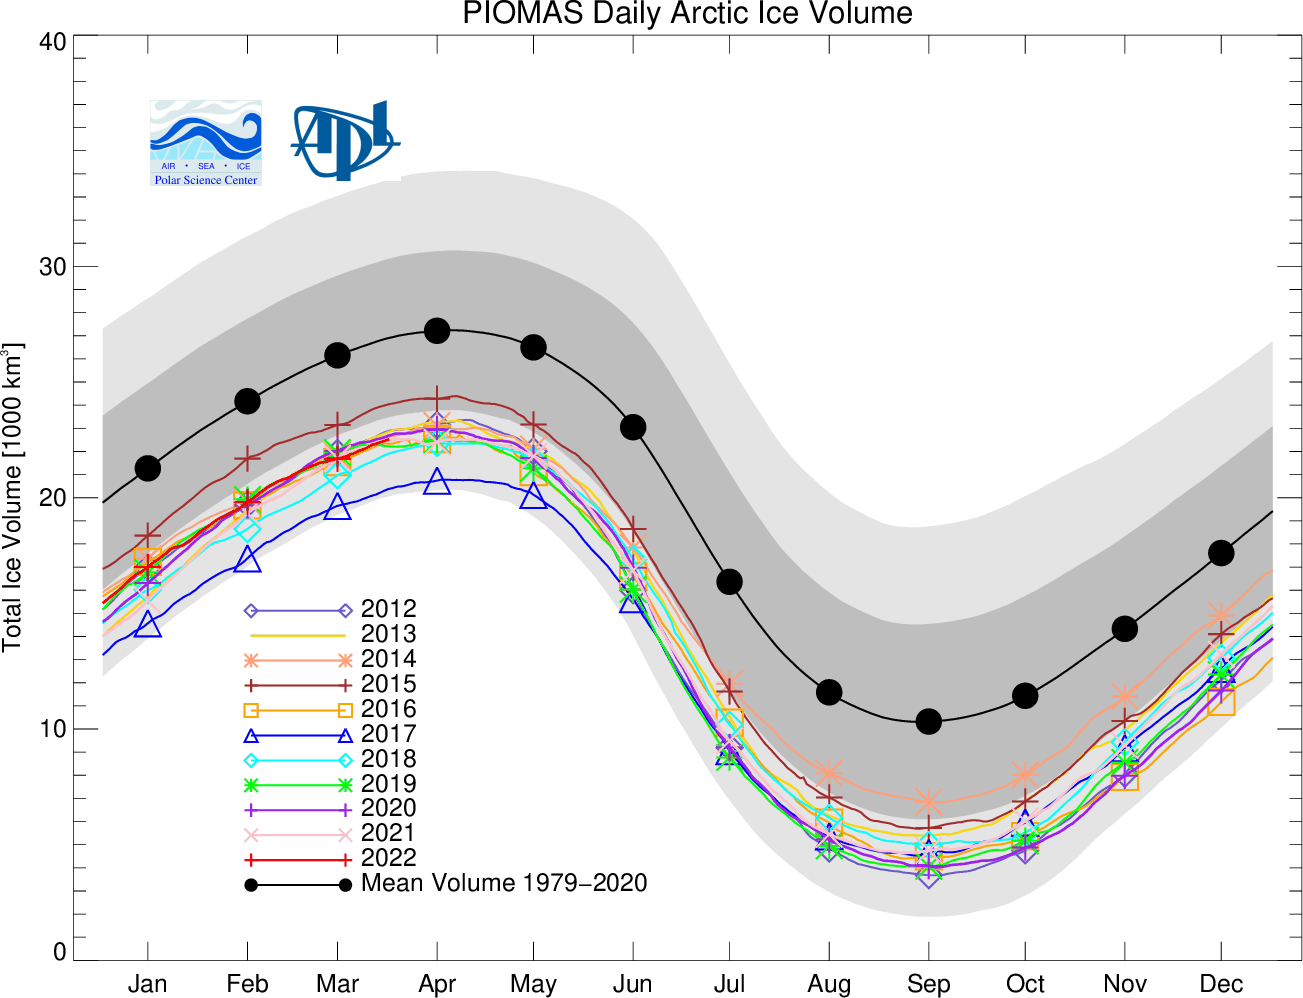
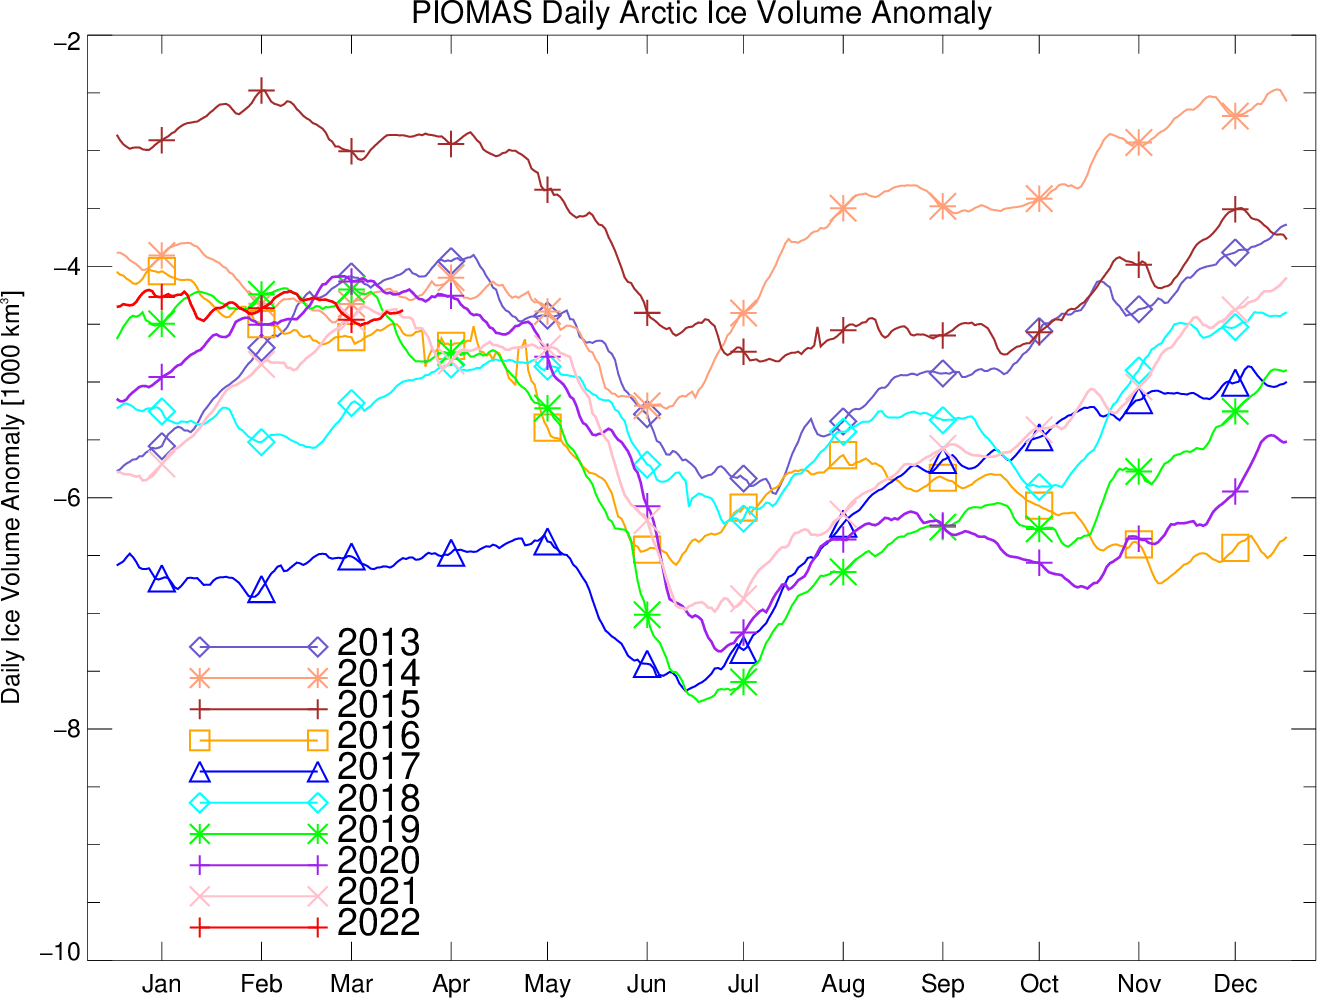
The Polar Science Center at the University of Washington has also released the PIOMAS volume data for March 2022:
Average Arctic sea ice volume in March 2022 was 21,700 km3. This value is the 6th lowest on record for March, about 2,200 km3 above the record set in 2017. Monthly ice volume was 38% below the maximum in 1979 and 25% below the mean value for 1979-2021:
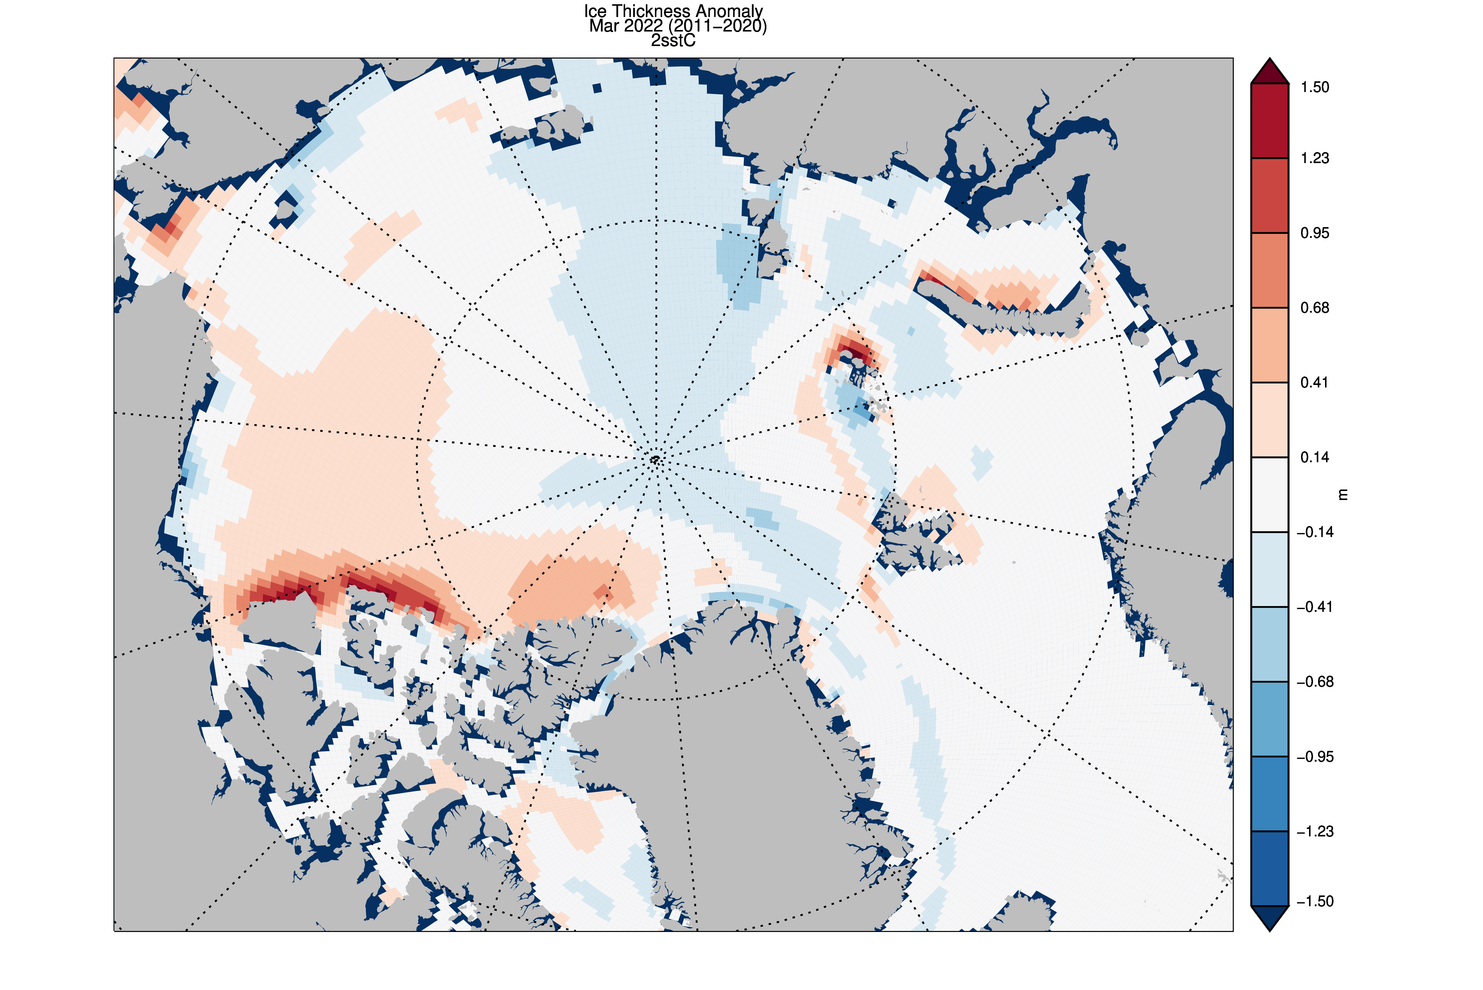
Ice growth anomalies for March 2022 continued to be at the upper end of the most recent decade with a mean ice thickness (above 15 cm thickness) at the middle of recent values:
The ice thickness anomaly map for March 2022 relative to 2011-2020 divides the Arctic in two halves with positive anomalies in the “Western Arctic” but negative anomalies in “Eastern Arctic”. A narrow band of negative anomalies remains along the coast of North of Greenland but positive anomaly exists north of Baffin Island.
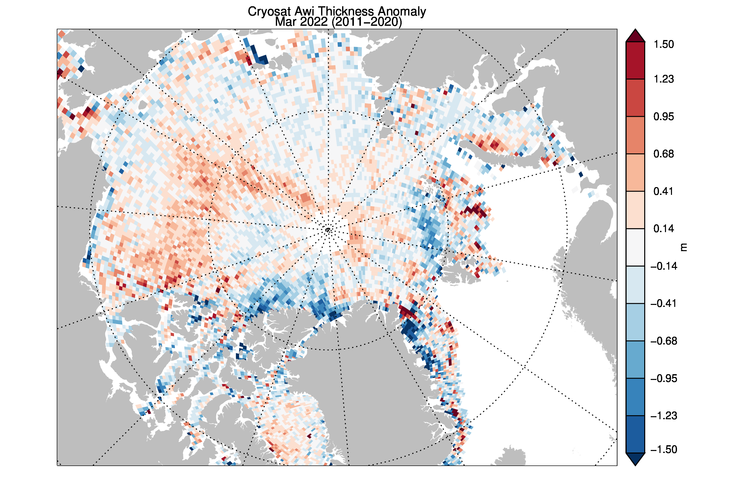
CryoSat 2 ice thickness shows an similar pattern of sea ice thickness anomalies though the areas North of Greenland and Baffin Bay show substantial differences:
[Edit – April 10th]
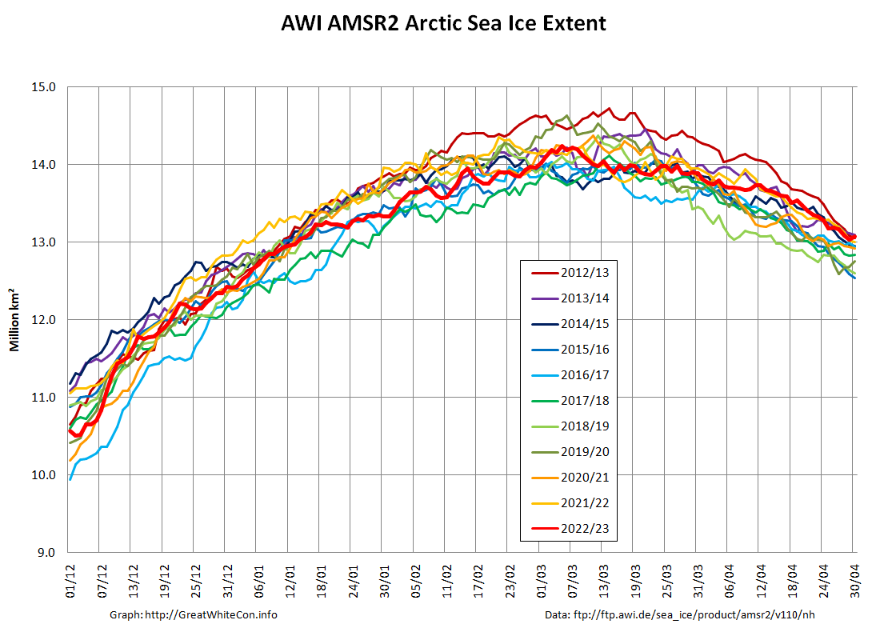
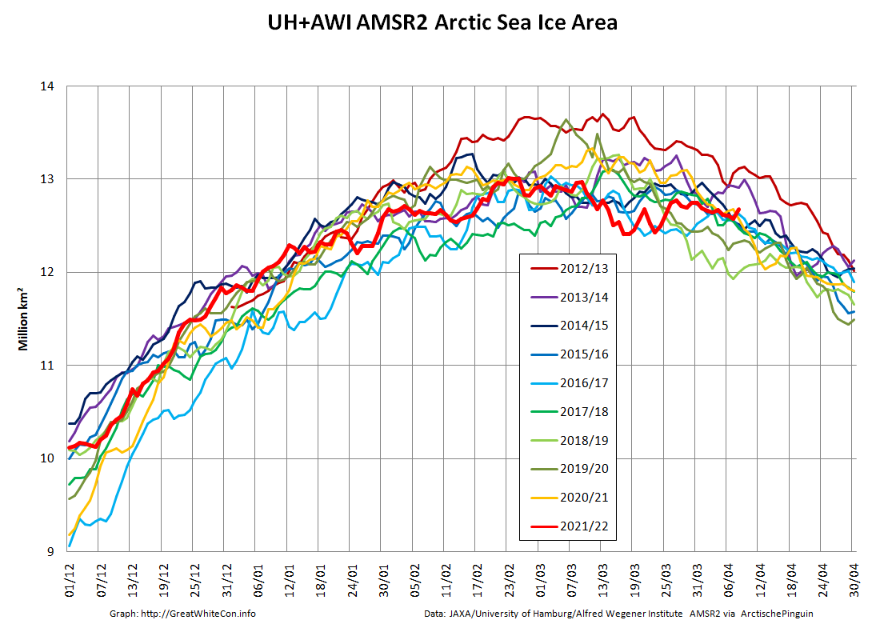
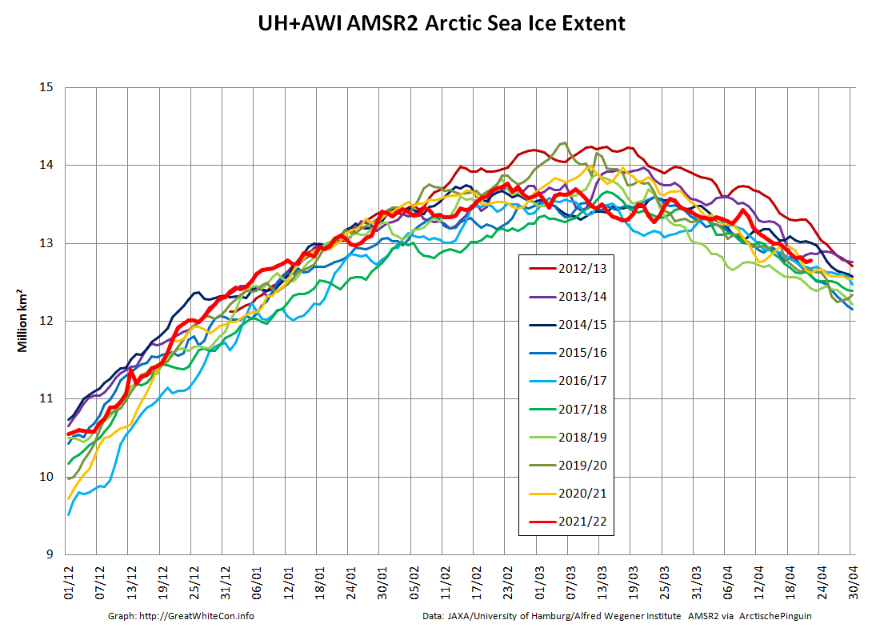
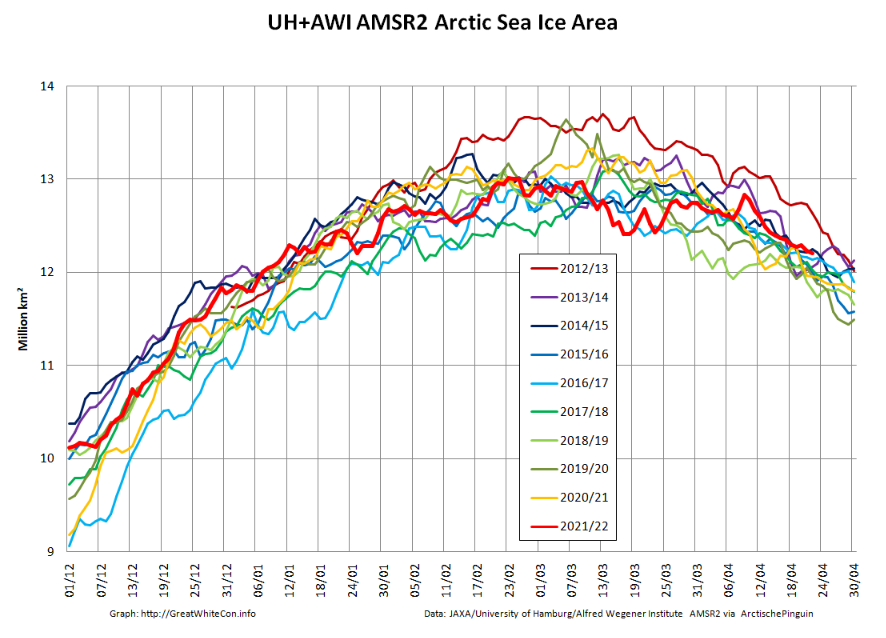
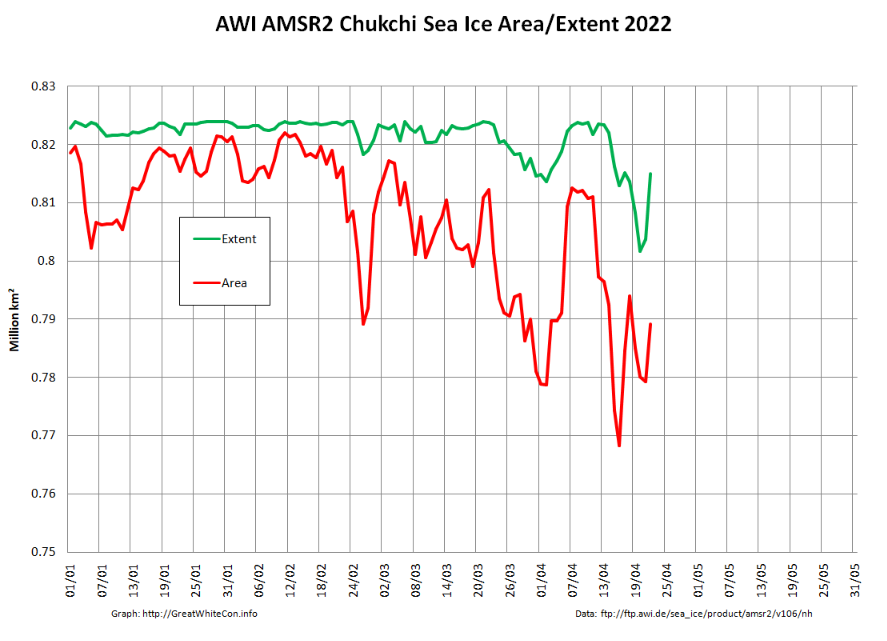
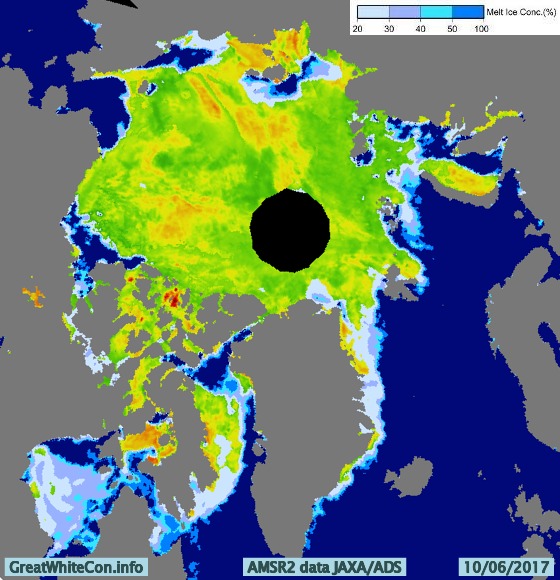
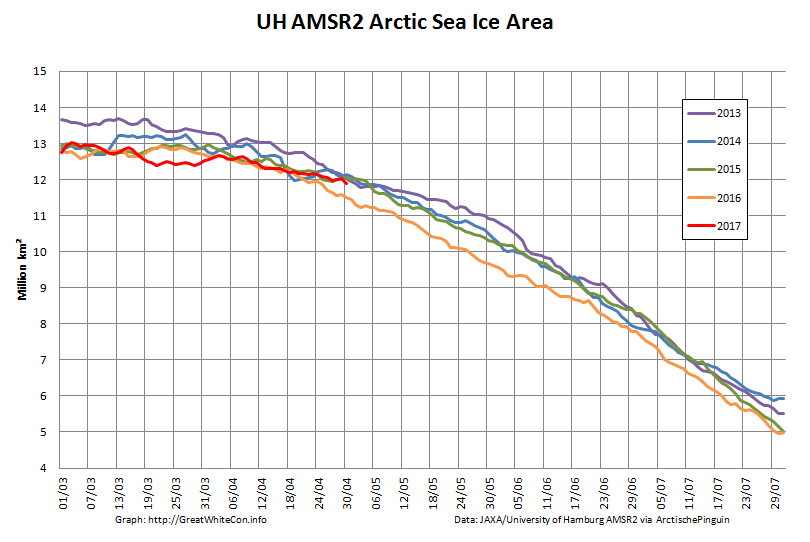
Here are the latest graphs of our favourite “high resolution” AMSR2 metrics, which combine recent data from the Alfred Wegener Institute with historical data from the University of Hamburg:
As you can see, there have indeed been a few ups and downs! Click the image below to see a 10 Mb animation of ice motion over the last few weeks:
The obvious point to note at the moment is that there are currently long flaw leads on both the Siberian and Canadian sides of the Arctic Ocean. The animation also reveals episodes of open water in the Beaufort and Chukchi Seas, as well as north of Franz Josef Land and Svalbard.
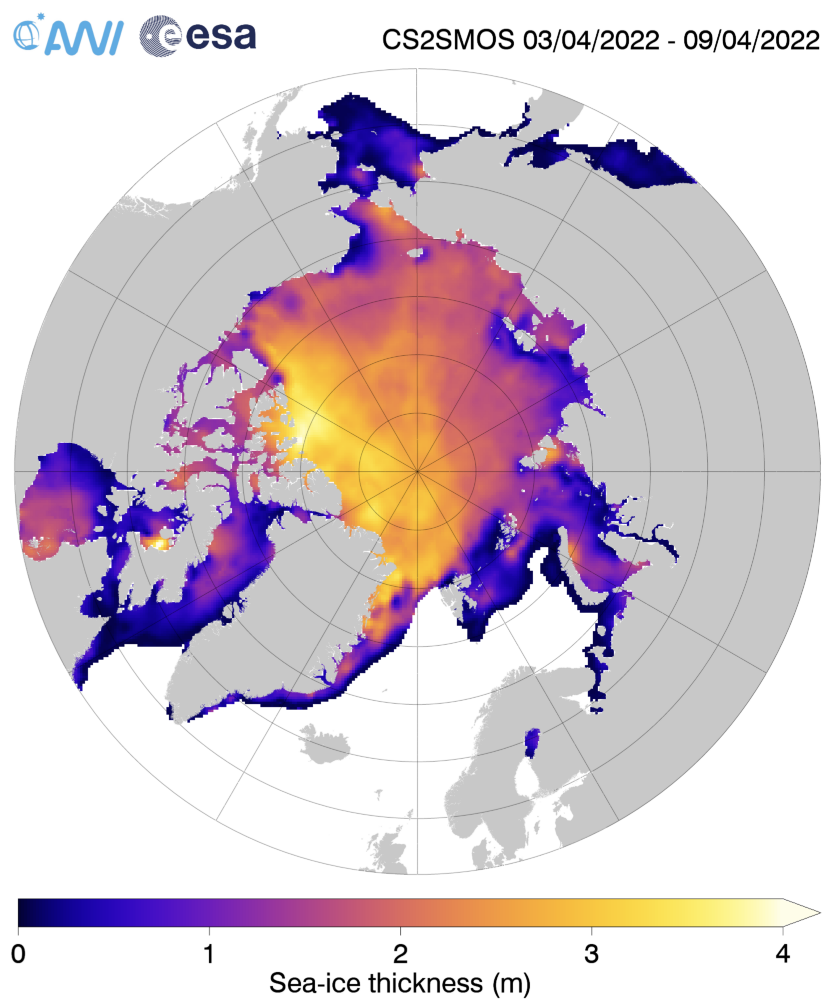
The ice in those areas is still very thin on the latest AWI CryoSat-2/SMOS sea ice thickness map:
[Edit – April 11th]
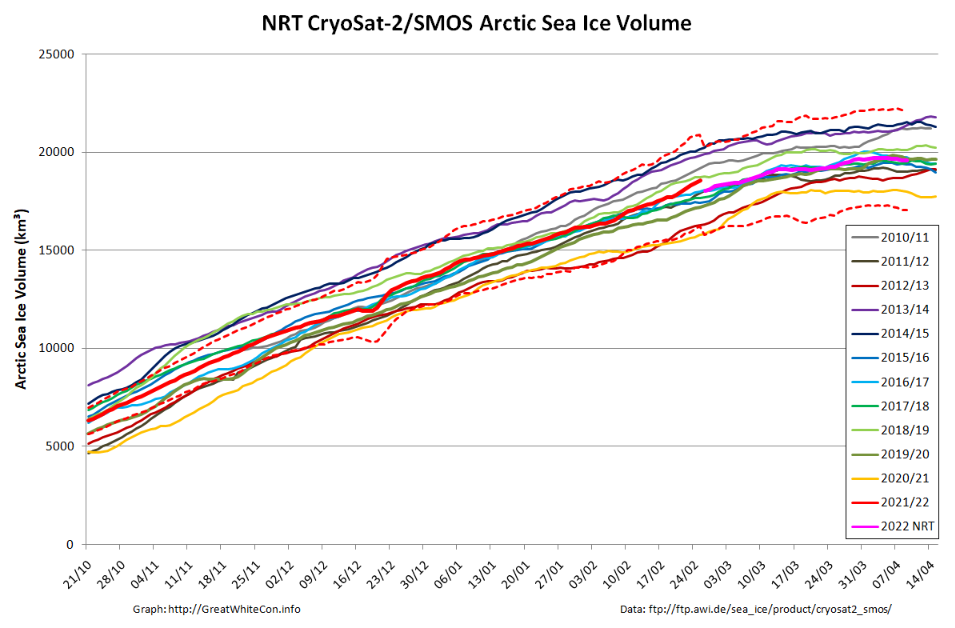
Here too is the latest AWI CryoSat-2/SMOS volume graph:
The reanalysed data is now showing something of a surge towards the end of February.
[Edit – April 23rd]
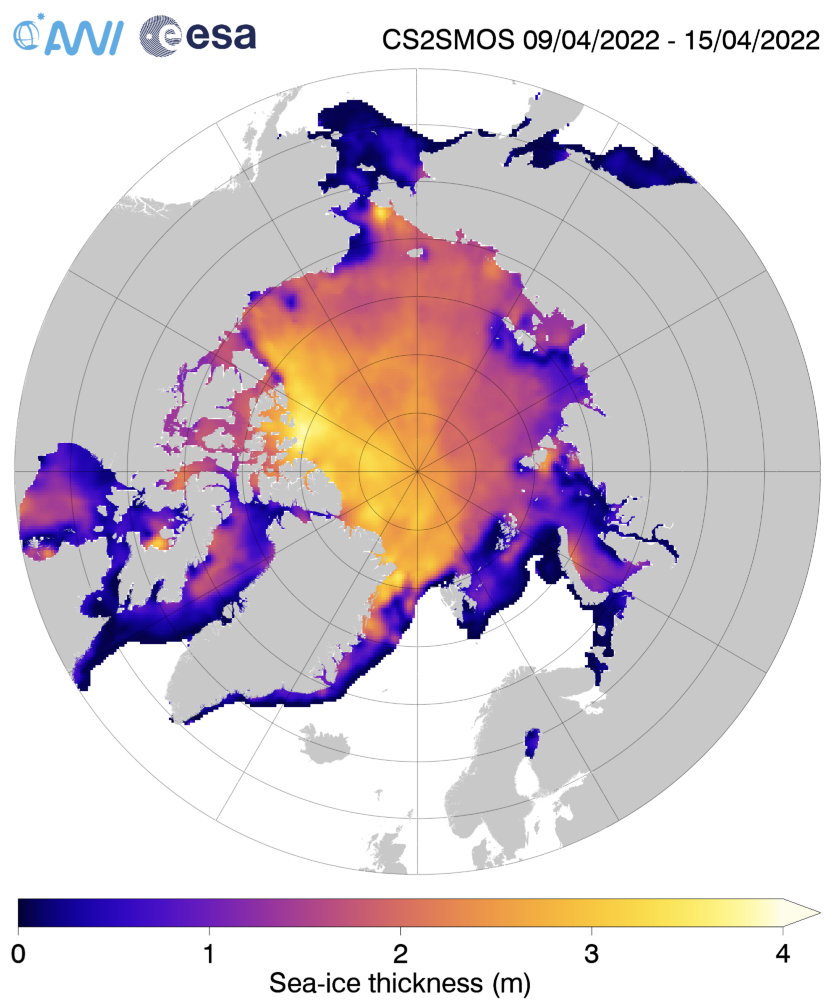
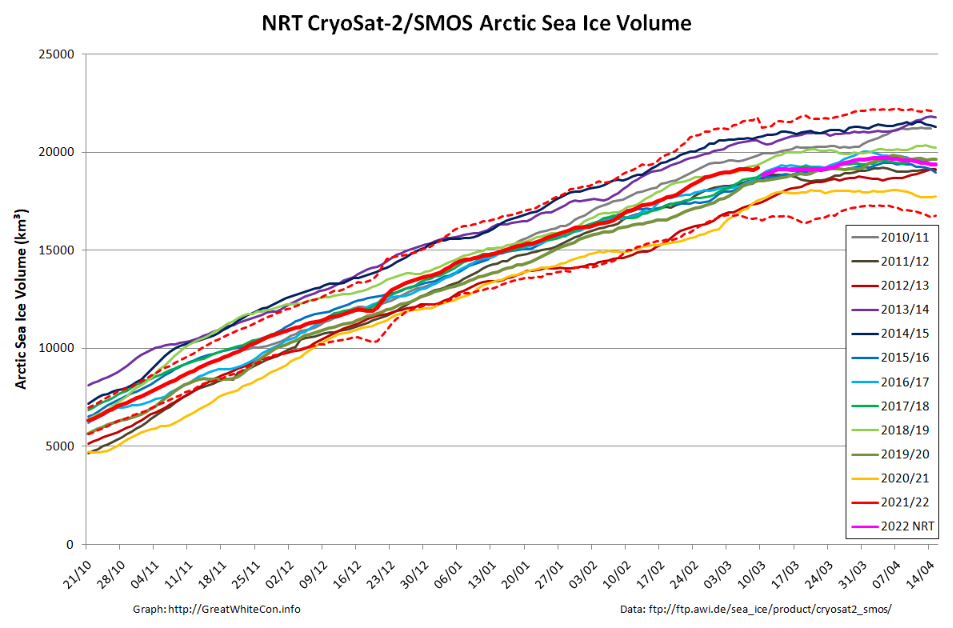
Here’s the last “near real time” AWI CryoSat-2/SMOS Arctic sea ice thickness map for Spring 2022:
The significantly thinner areas in the Beaufort and Chukchi Seas are even more pronounced than previously. Here also is the associated CS2/SMOS volume graph:
The 2022 maximum volume based on NRT data is 19719 km³ on April 5th. Expect that to be revised upwards when the reanalysed data is ultimately published.
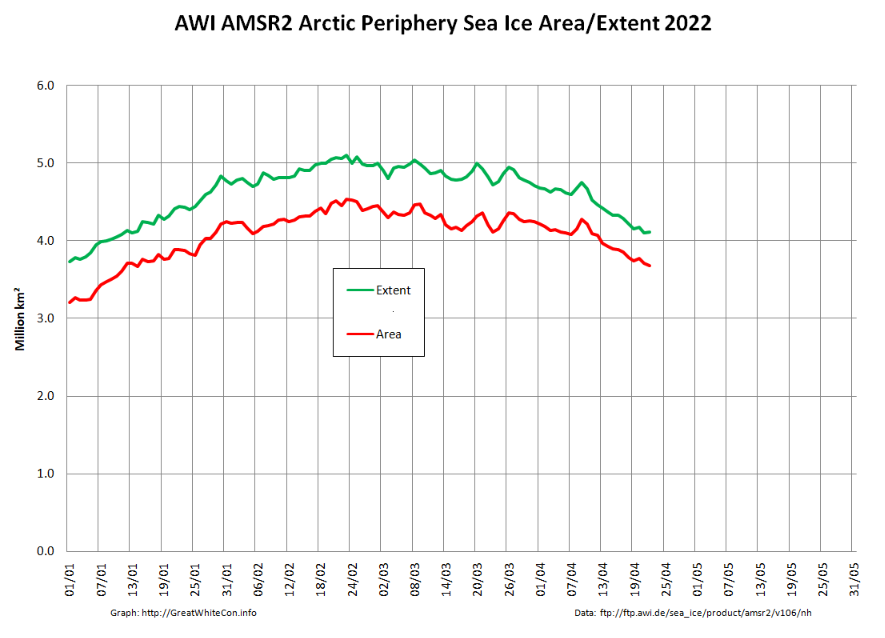
Going back to 2 dimensions, the assorted “ups and downs” now seem to have resolved into the melting season proper:
The peripheral sea have been responsible for most of the recent decline:
However as mentioned above, the Chukchi Sea has been experiencing some ups and downs of its own. Perhaps the sun is now high enough in the sky for the most recent “down” to stick around for the summer?
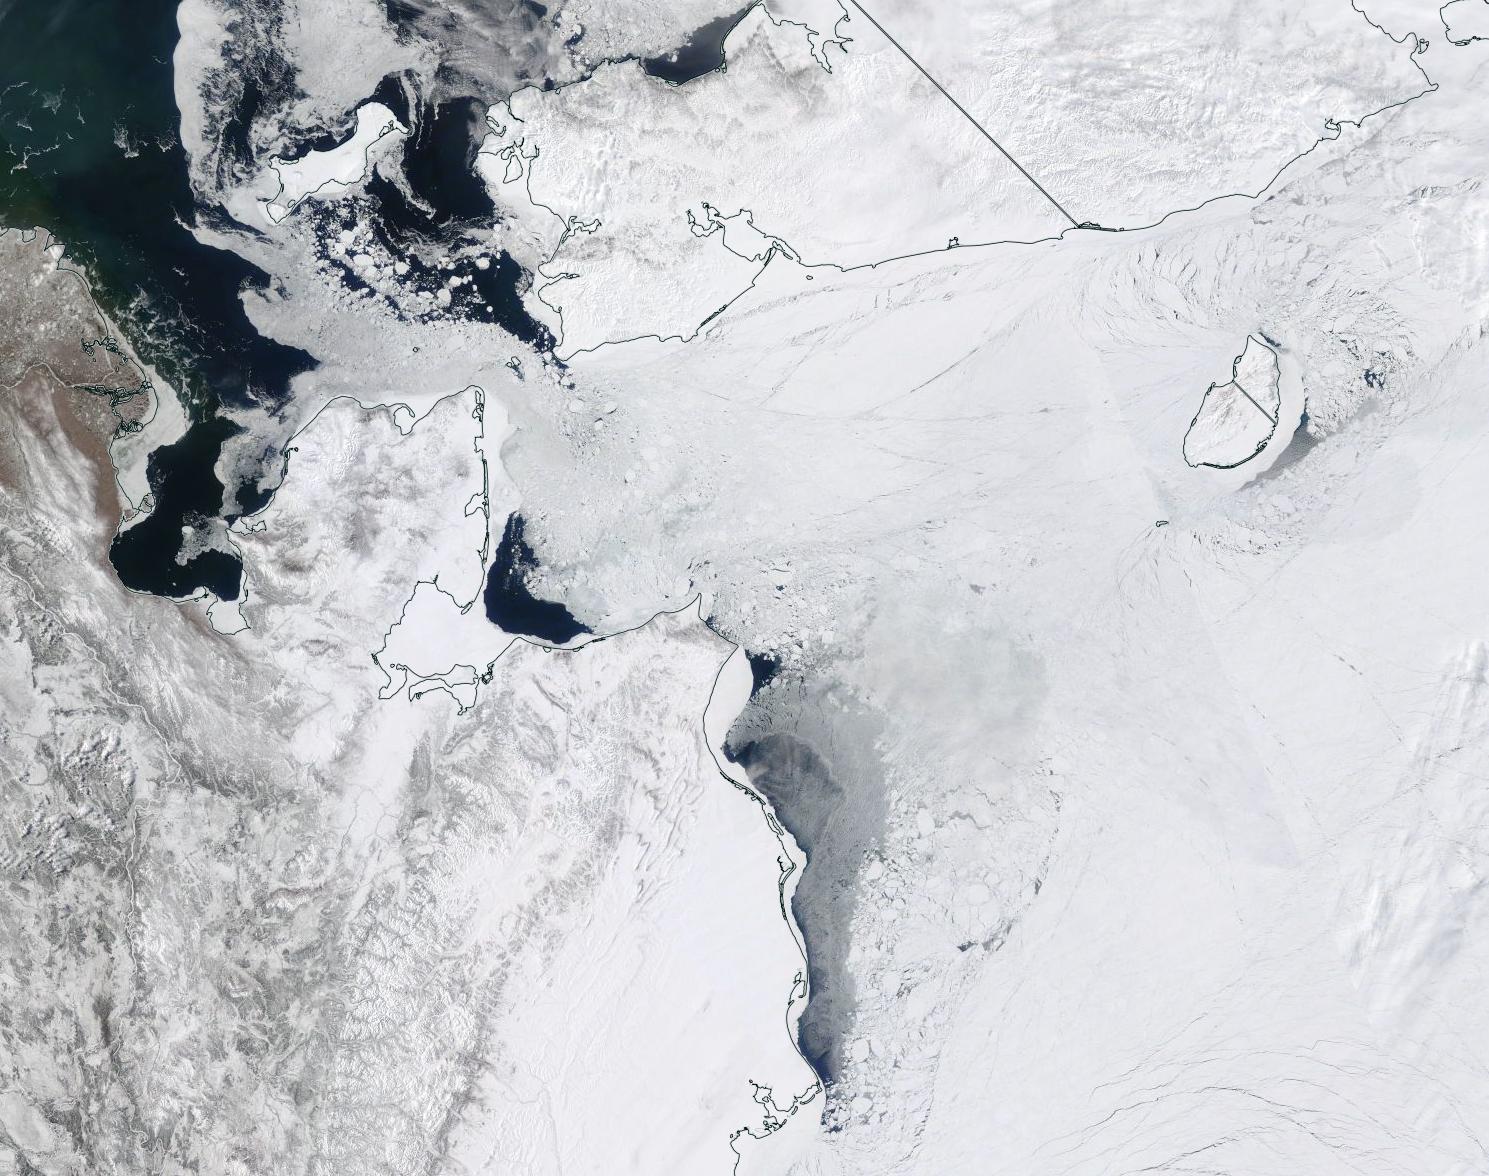
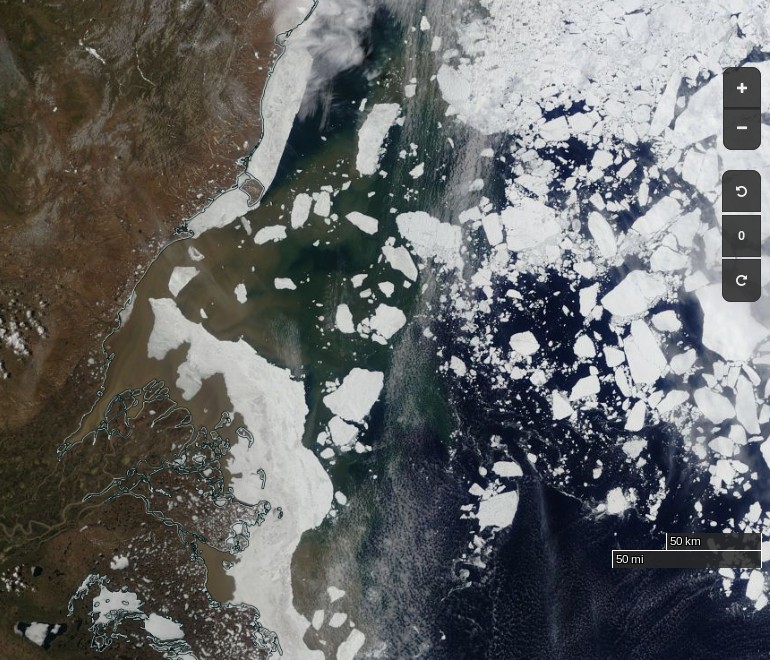
“True colour” image of the Chukchi Sea on April 21st from the MODIS instrument on the Terra satellite[Edit – April 24th]
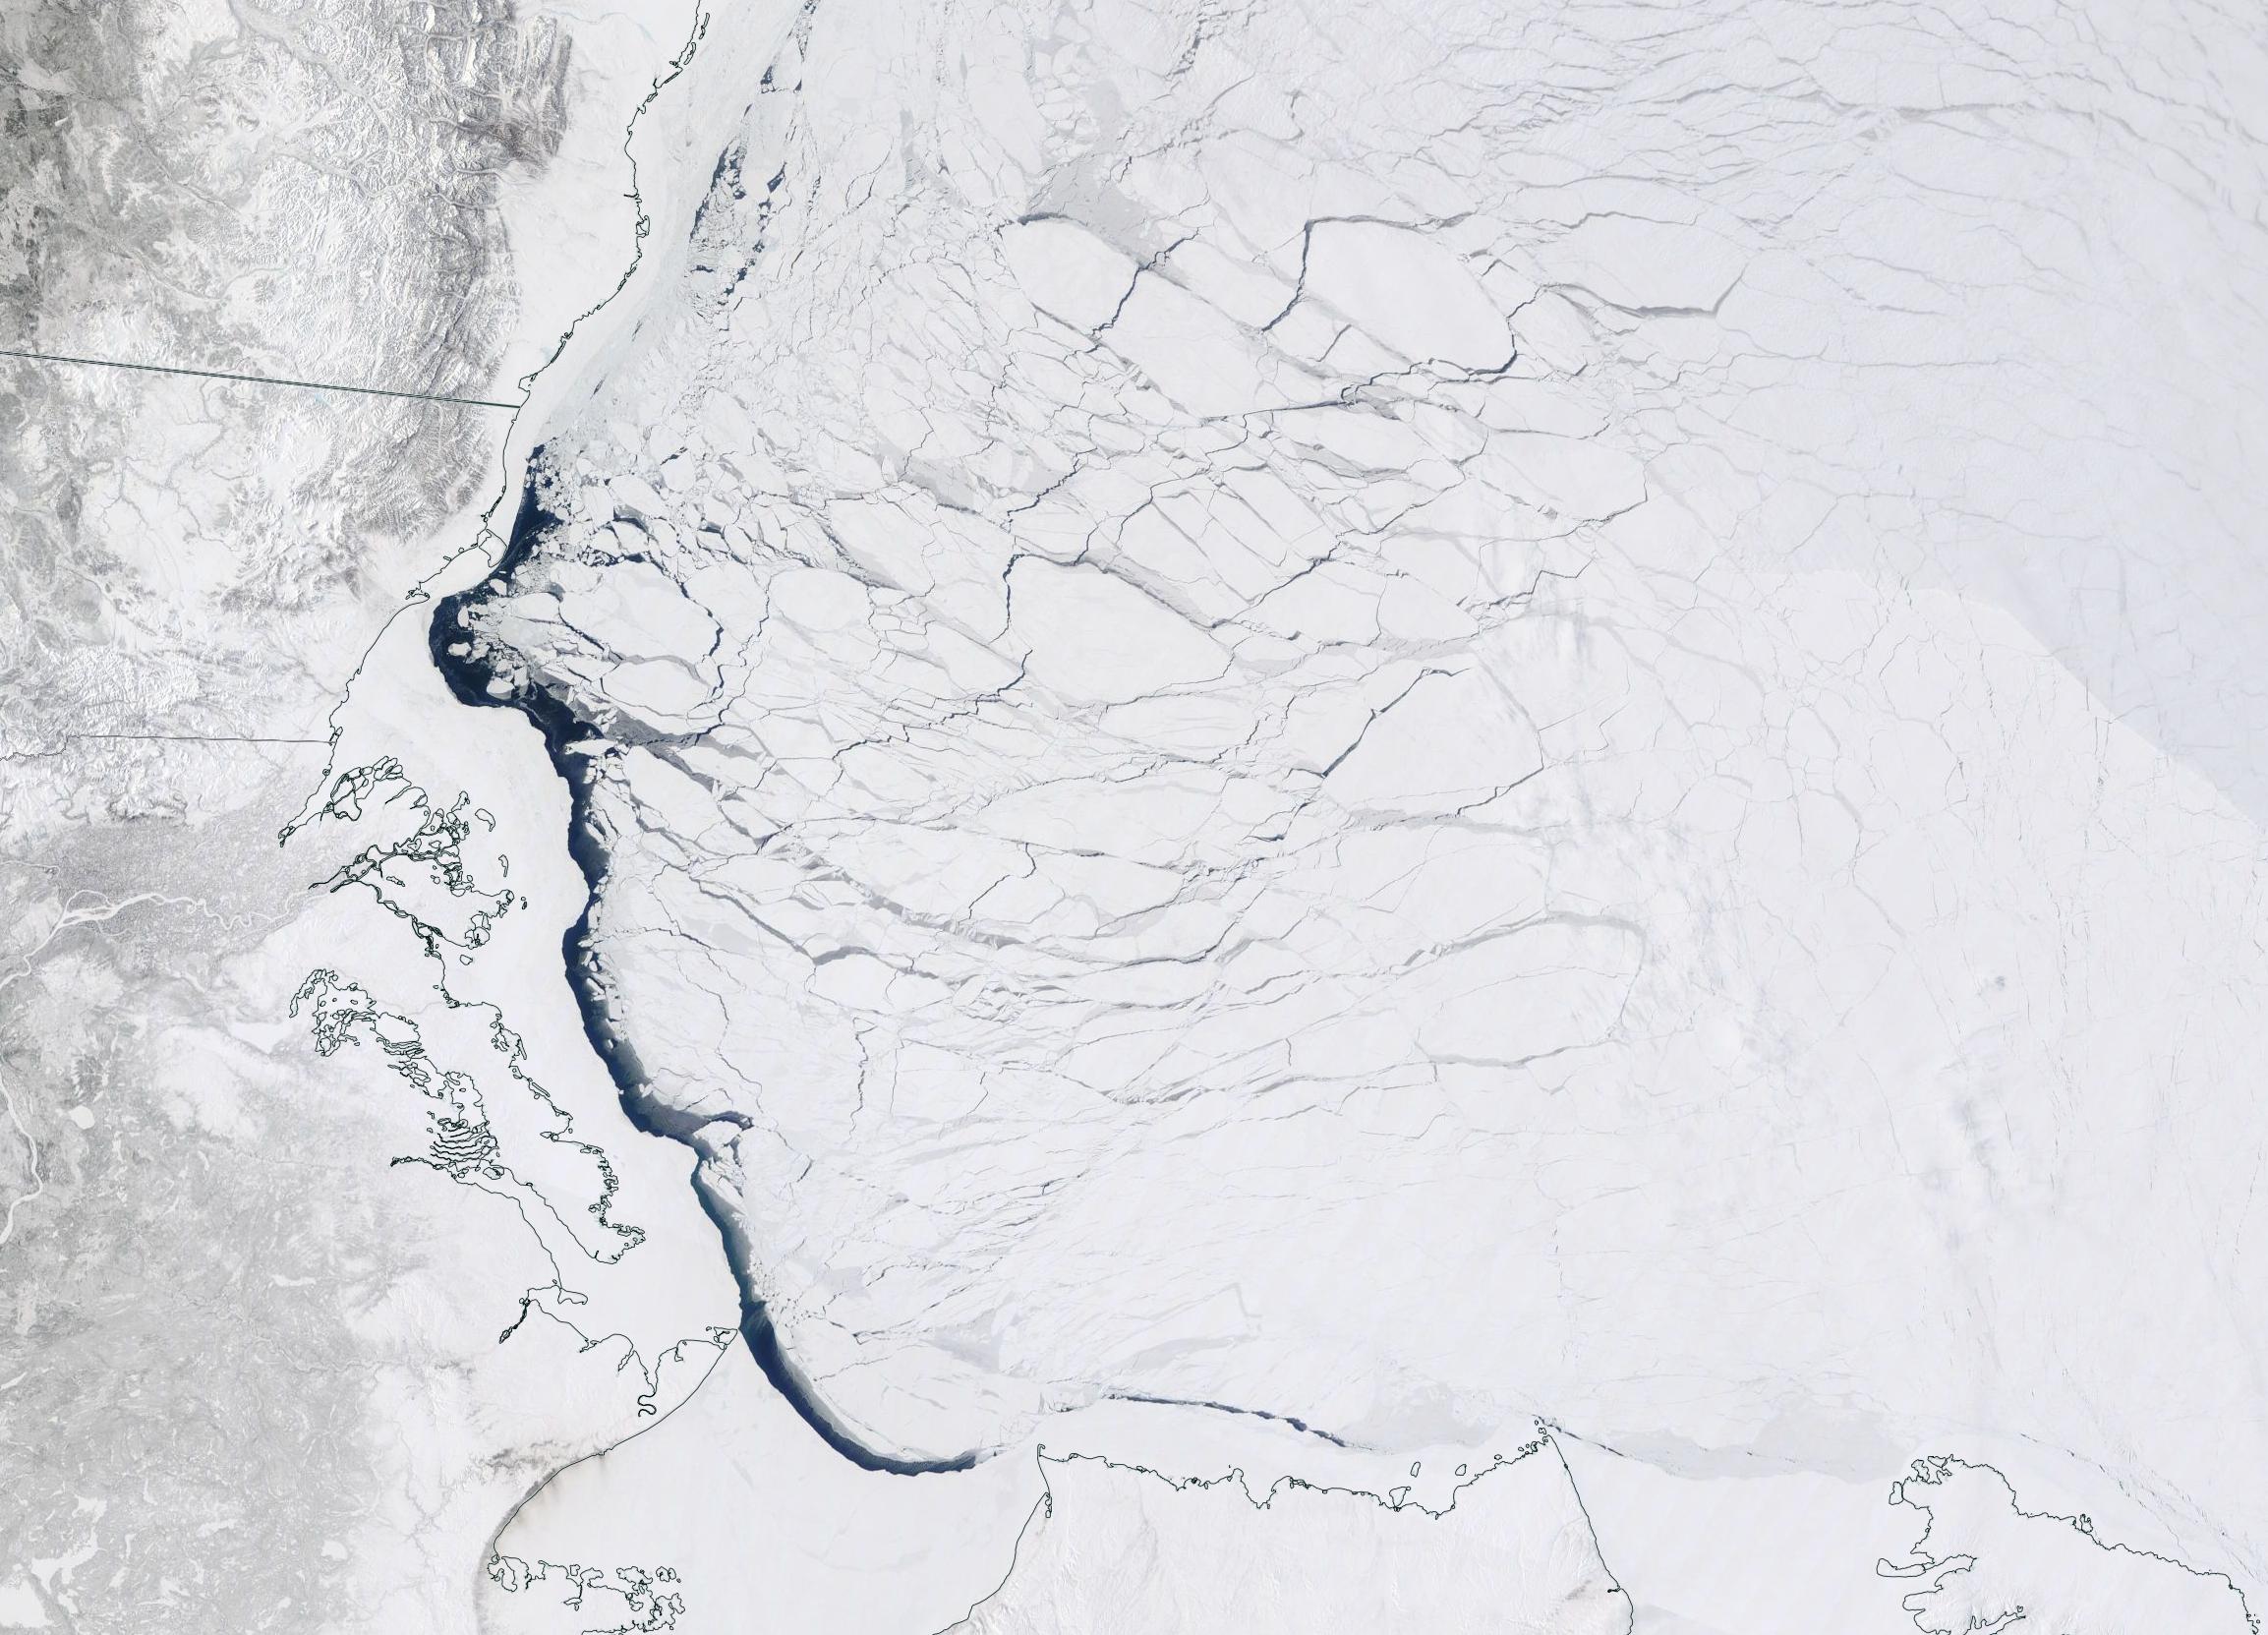
Over the last couple of days some open water has appeared in the Beaufort Sea off the Mackenzie Delta:
“True colour” image of the Beaufort Sea on April 23rd from the MODIS instrument on the Terra satellite [Edit – April 25th]
Especially for Taylor, here’s the GFS Arctic snow depth forecast for 10 days into the future:
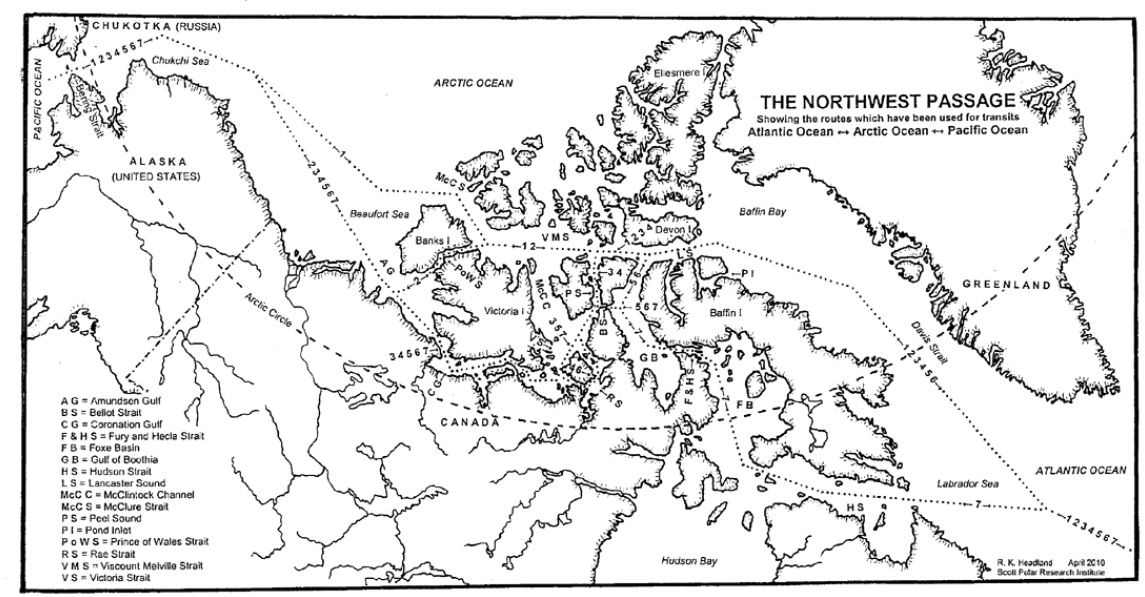
Prompted by a comment on the Northwest Passage thread from last year I’m opening the 2021 equivalent earlier than usual, in part because there’s already a lot going on of interest. First of all let’s get our bearings with the help of this map of the area:
and another map detailing the routes through Canadian Arctic Archipelago that have previously been successfully traversed:
The forecast high pressure has arrived and the skies have cleared over the Beaufort Sea, which reveals that the land-fast ice off the Mackenzie Delta has started breaking up:
In addition the snow has been melting along the valley of the Mackenzie River, and the resulting increased flow at the mouth of the delta is flooding the fast ice:
It’s May Day 2021, and just for a change we’re going to start the month off with a pretty picture!
Parts of the Laptev Sea are starting to look distinctly “warm” in the infra-red. Here’s a “false colour” image taken by the Terra satellite during a gap in the clouds:
We have reached the time of year when the SMOS “thin ice thickness” readings start being affected by surface melt, but let’s take a look anyway:
That area of the Laptev certainly appears to be either thin or melting.
Meanwhile on the Canadian side of the Arctic the fast ice off the Mackenzie Delta is starting to get damp, even though the river itself still looks to be fairly well frozen:
It will also be interesting to follow the progress of this large floe as it heads towards oblivion through the Fram Strait:
After a comparatively cool May, surface air temperatures in the high Arctic are back up to “normal”:
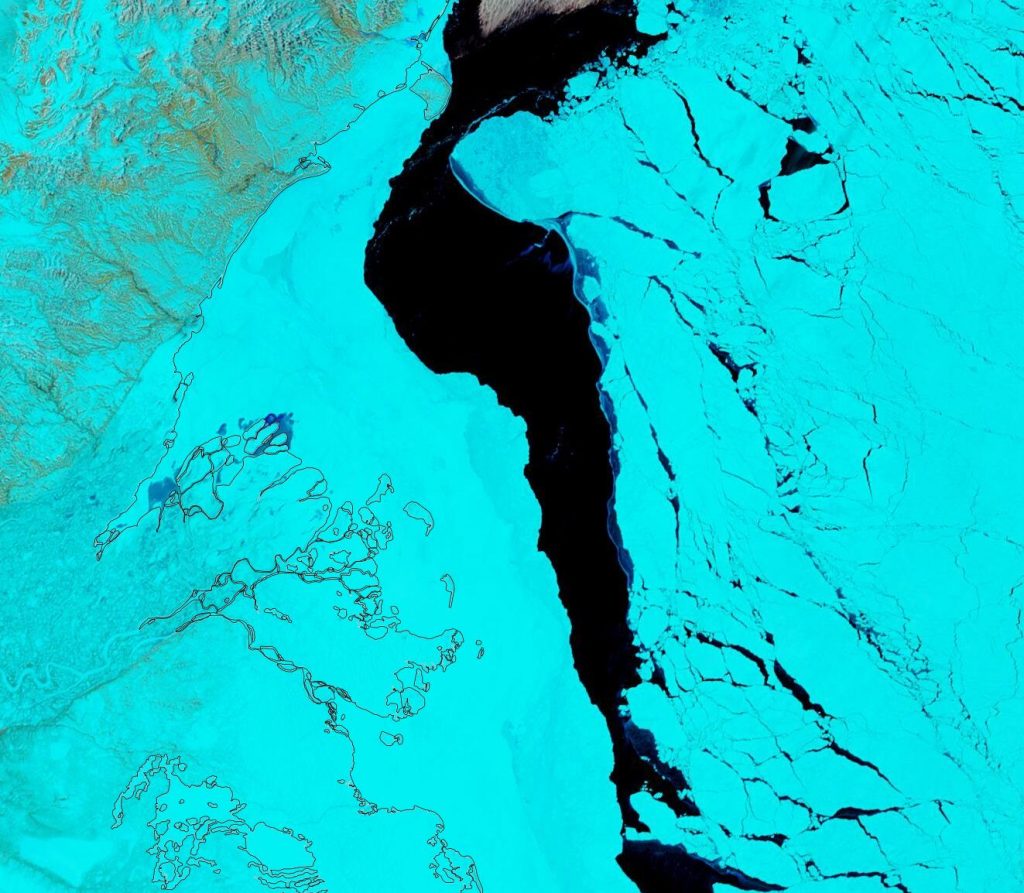
The condition of the sea ice north of 80 degrees is far from normal however. Here’s what’s been happening to the (normally) land fast ice north west of Greenland:
NASA Worldview “true-color” image of the sea ice north west of Greenland breaking up on June 2nd 2017
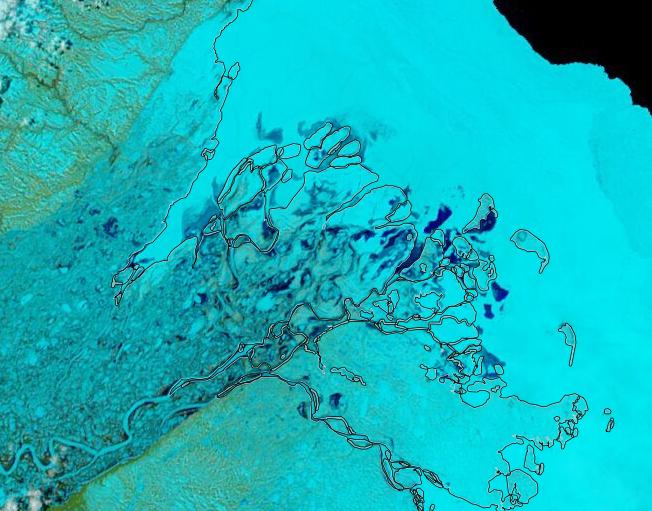
Further south surface melt has set in across the southern route through the Northwest Passage:
NASA Worldview “false-color” image of the Coronation Gulf on June 1st 2017, derived from the MODIS sensor on the Terra satellite
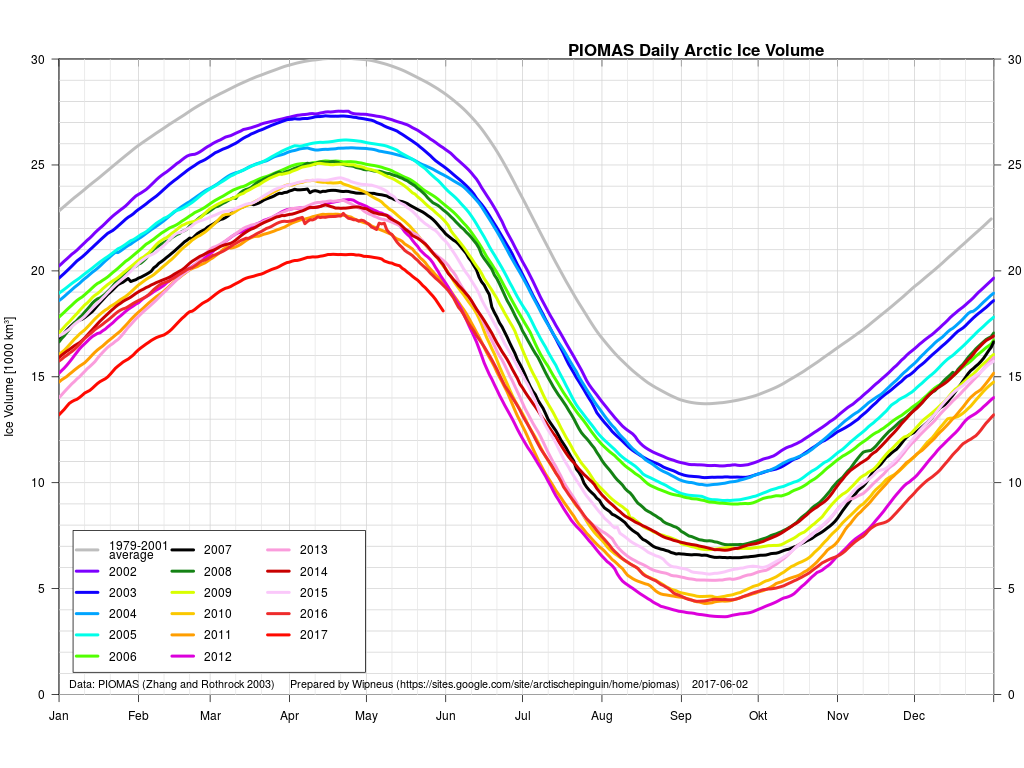
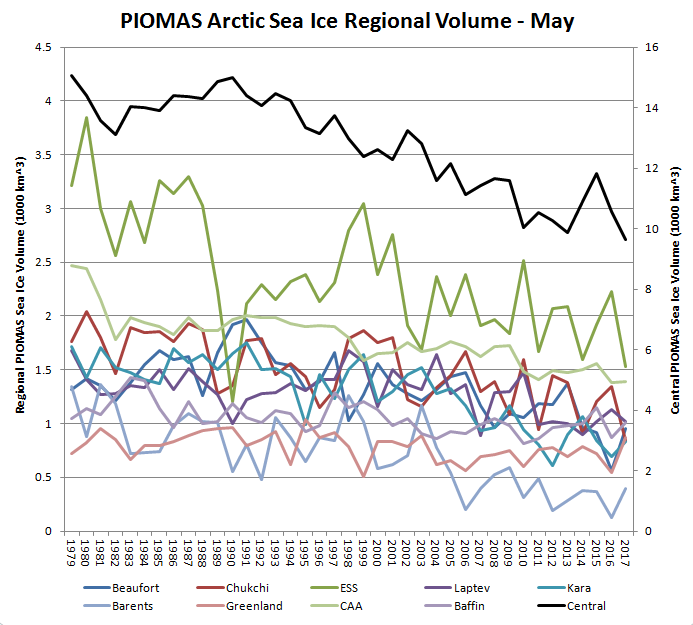
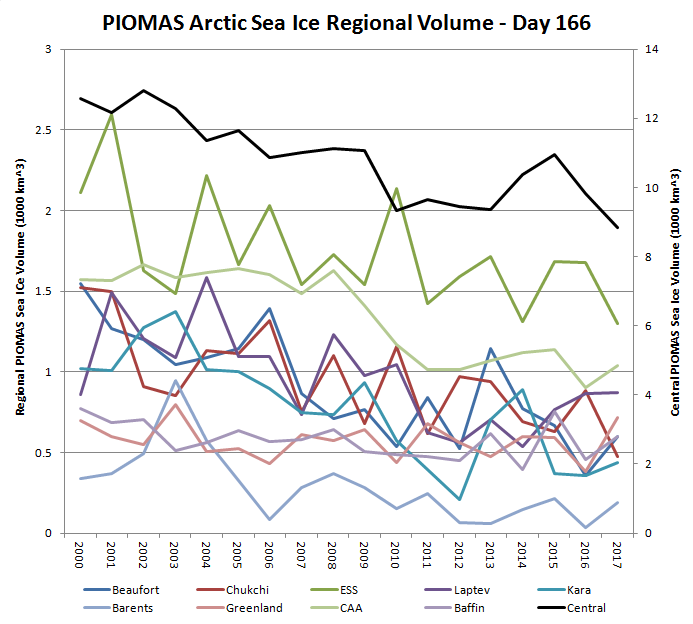
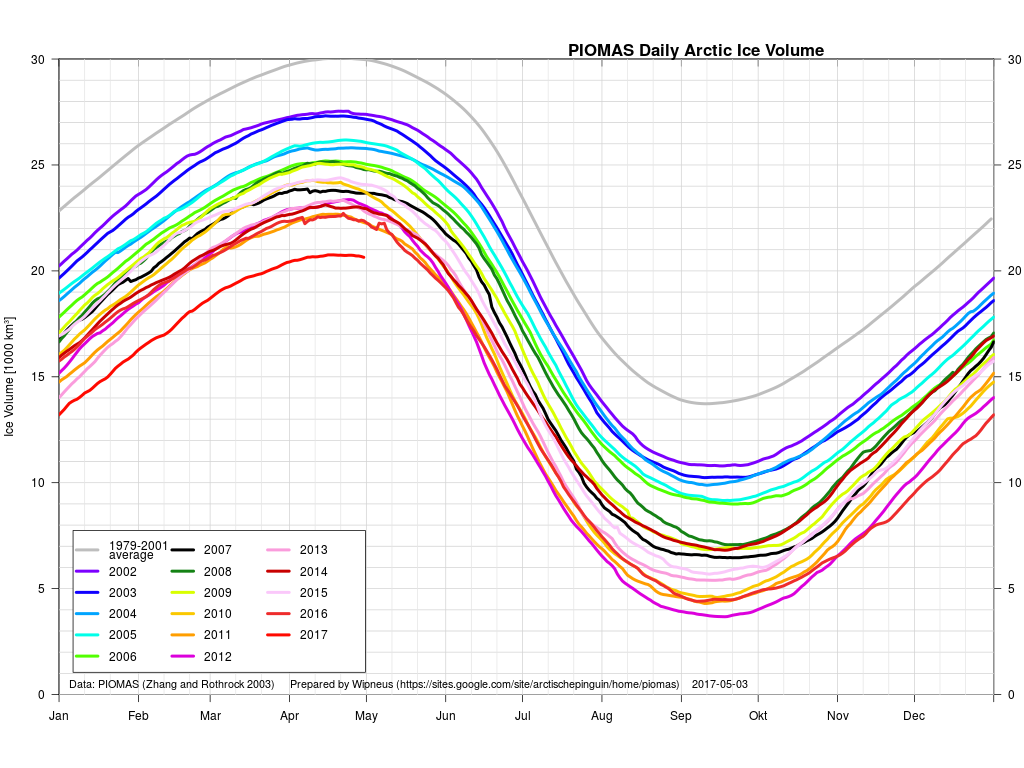
Whilst the gap with previous years has narrowed during May, PIOMAS Arctic sea ice volume is still well below all previous years in their records:
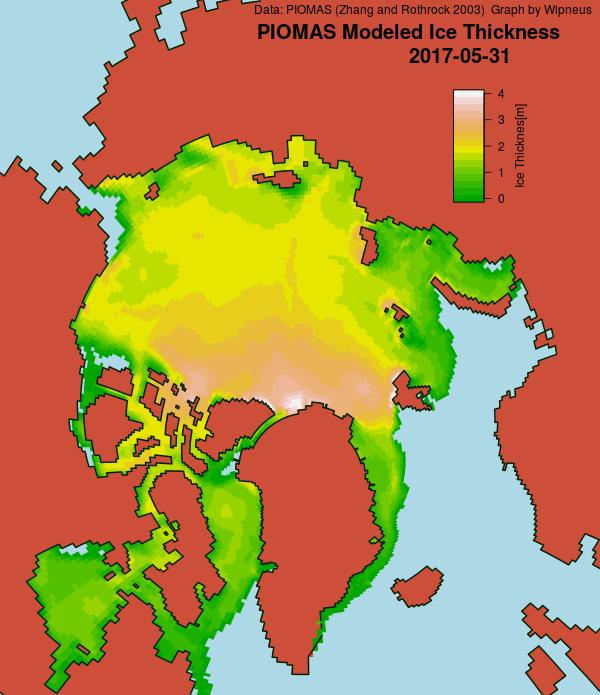
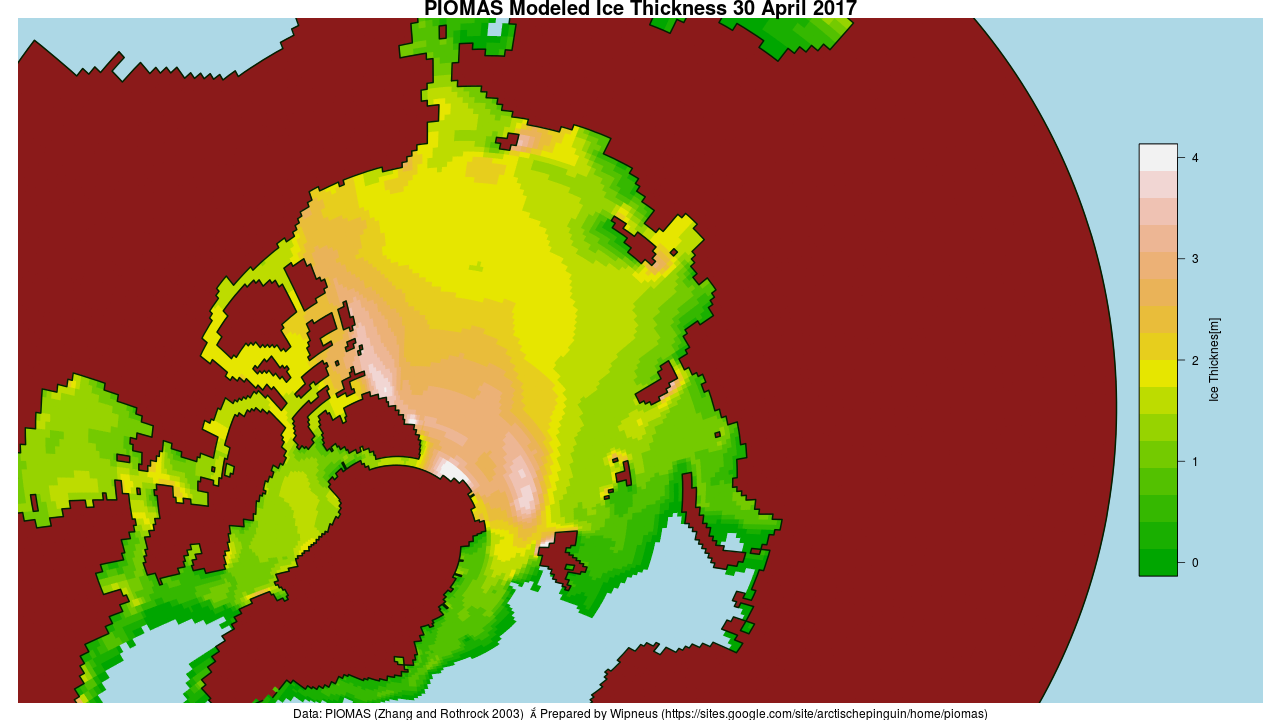
The PIOMAS gridded thickness graph suggests that a large area of thick ice is currently sailing through the Fram Strait to ultimate oblivion:
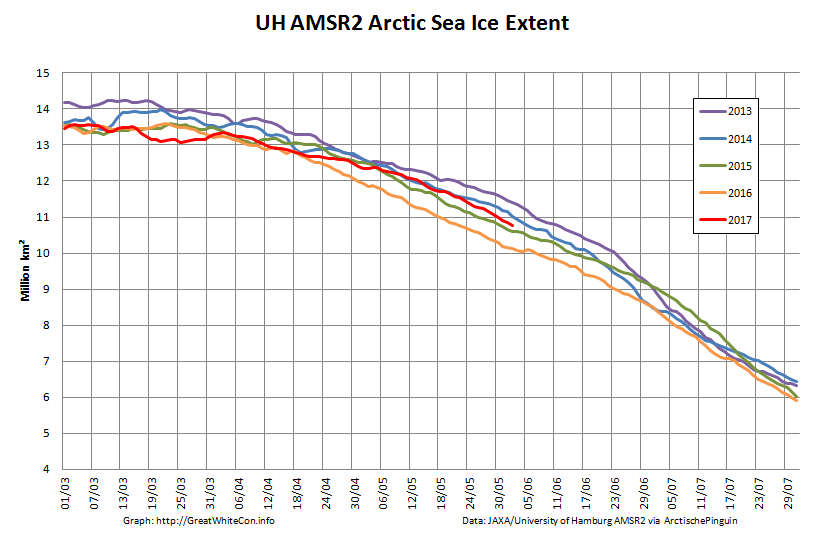
and just in case melt ponds are now affecting those numbers here is extent as well:
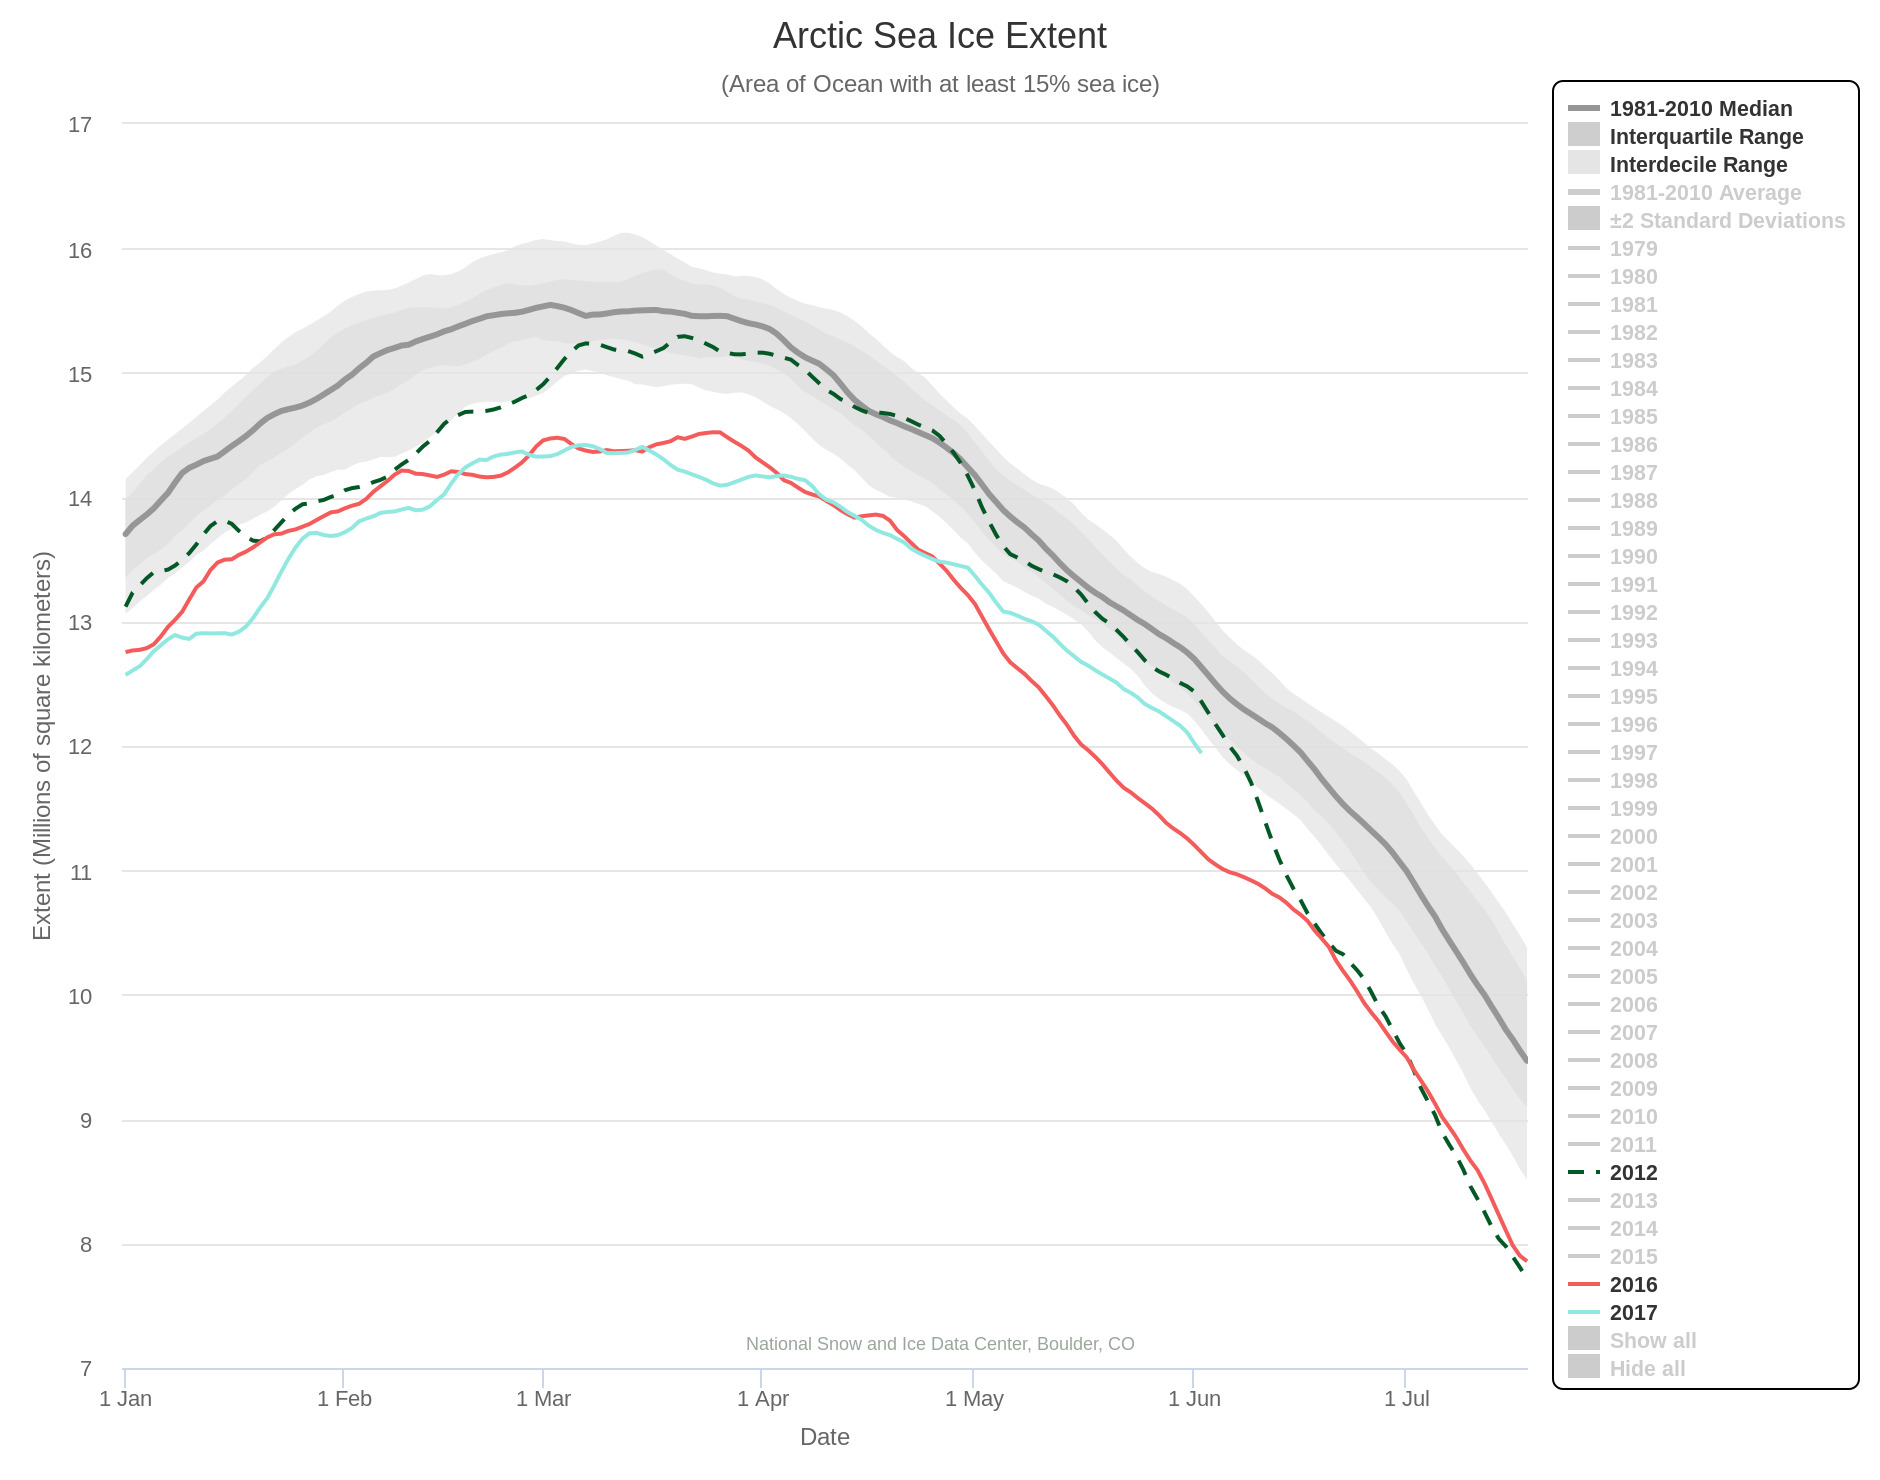
The rate of decrease is inexorably increasing! 2012 extent is currently still well above that of 2017, but those positions may well be reversed by the end of June? Here’s NSIDC’s view on the matter:
[Edit – June 8th]
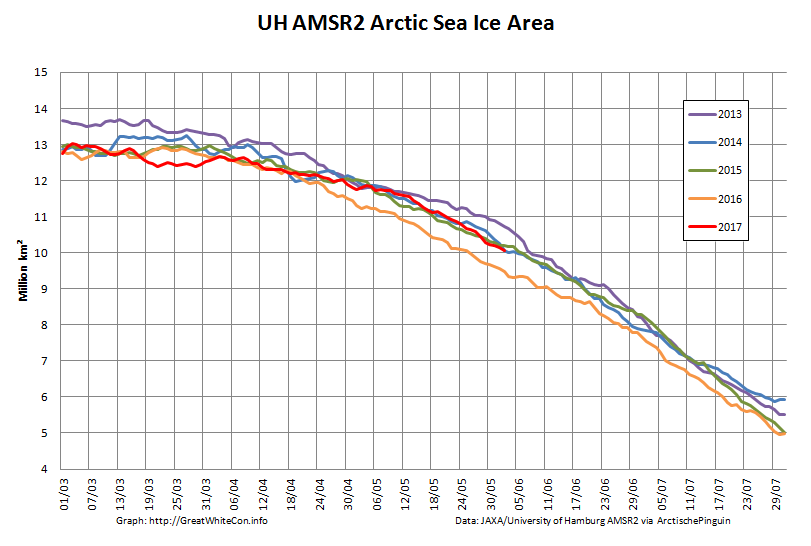
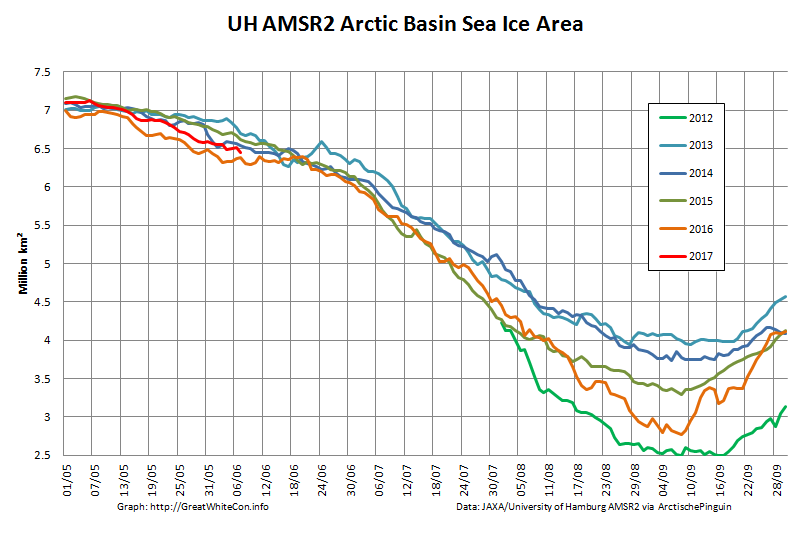
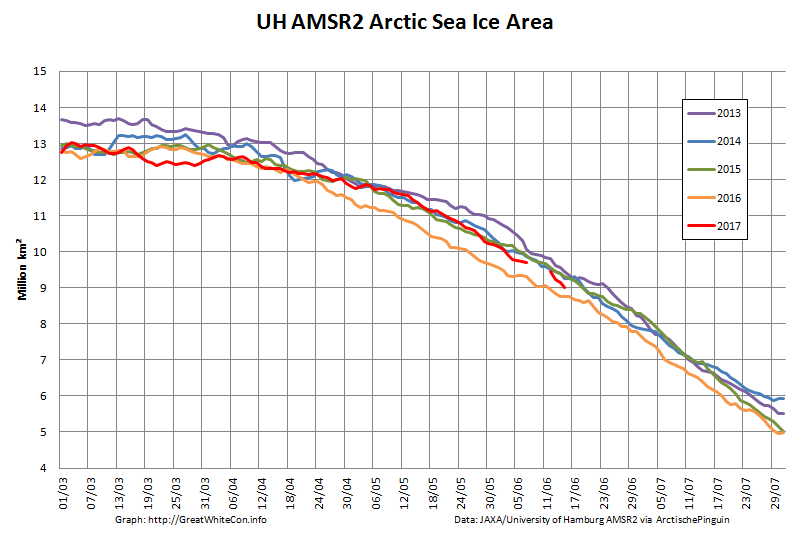
As requested by Tommy, here’s the current Arctic Basin sea ice area:
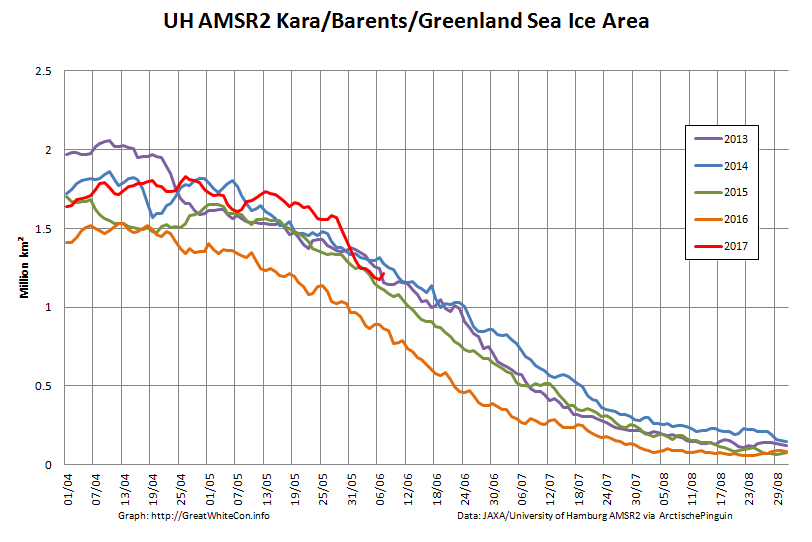
This includes the Beaufort, Chukchi, East Siberian and Laptev Seas along with the Central Arctic. It excludes the Atlantic periphery, which currently looks like this:
[Edit – June 10th]
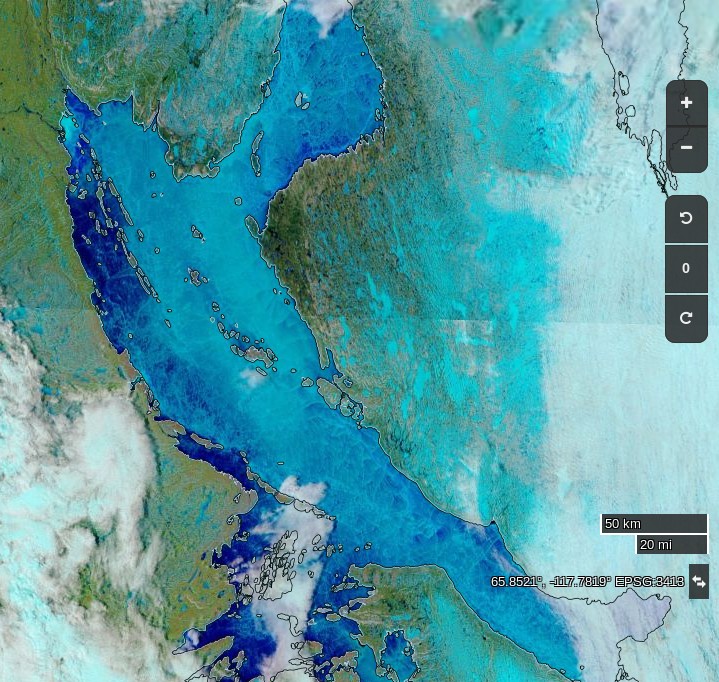
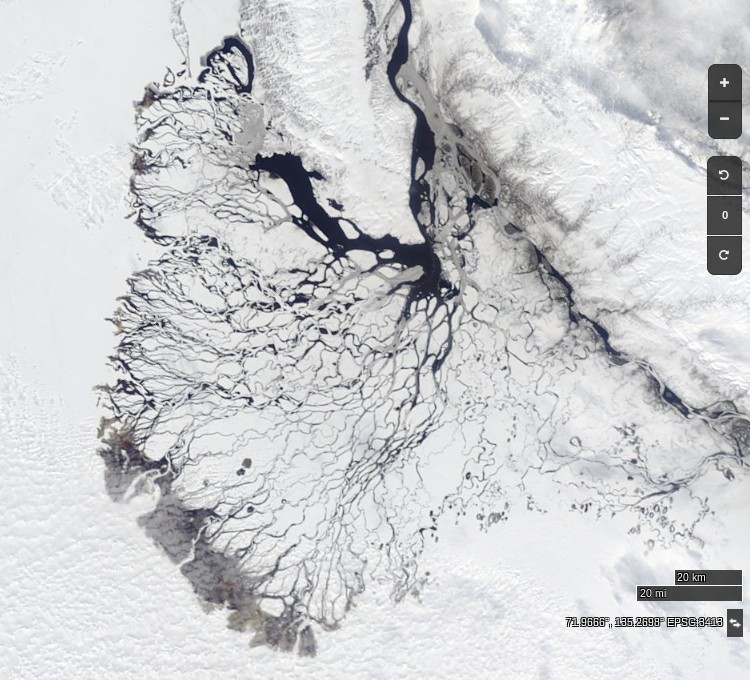
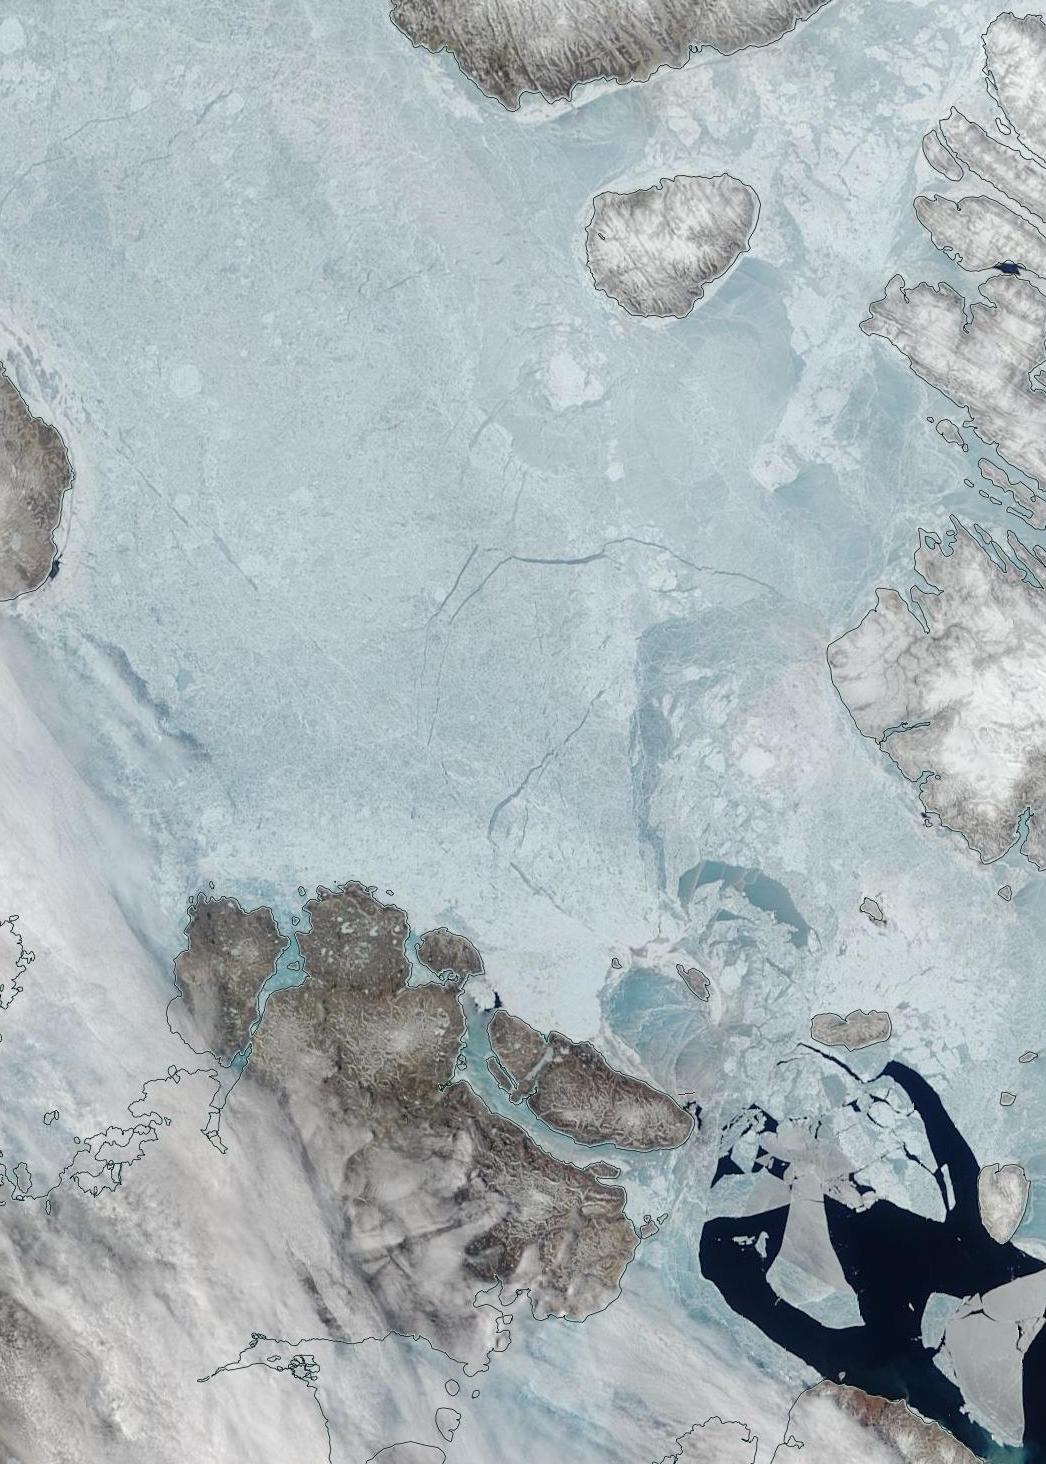
At long last a clear(ish) image of water from the Lena Delta spreading out across the fast ice in the Laptev Sea:
NASA Worldview “true-color” image of the Lena Delta on June 10th 2017, derived from the MODIS sensor on the Terra satellite
NASA Worldview “true-color” image of the Lena Delta on June 10th 2012, derived from the MODIS sensor on the Terra satellite
[Edit – June 11th]
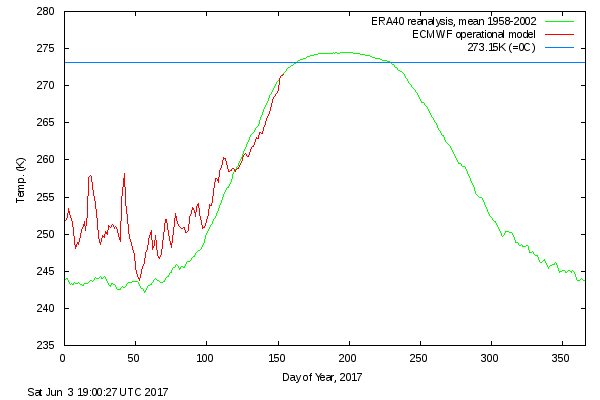
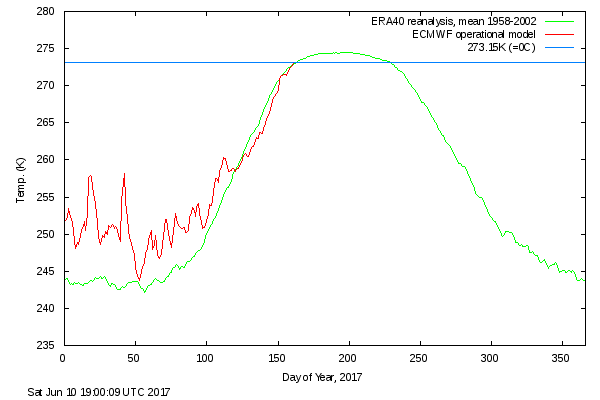
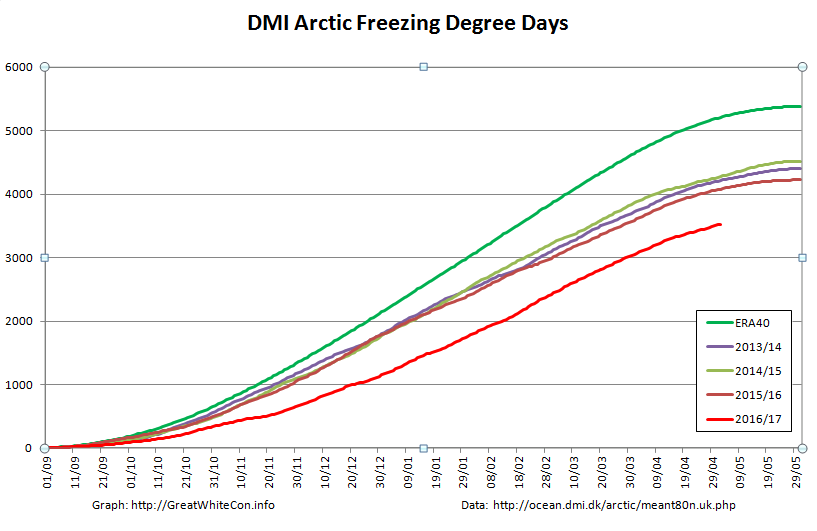
DMI’s daily mean temperature for the Arctic area north of the 80th northern parallel has reached zero degrees Celsius almost exactly on the climatological schedule:
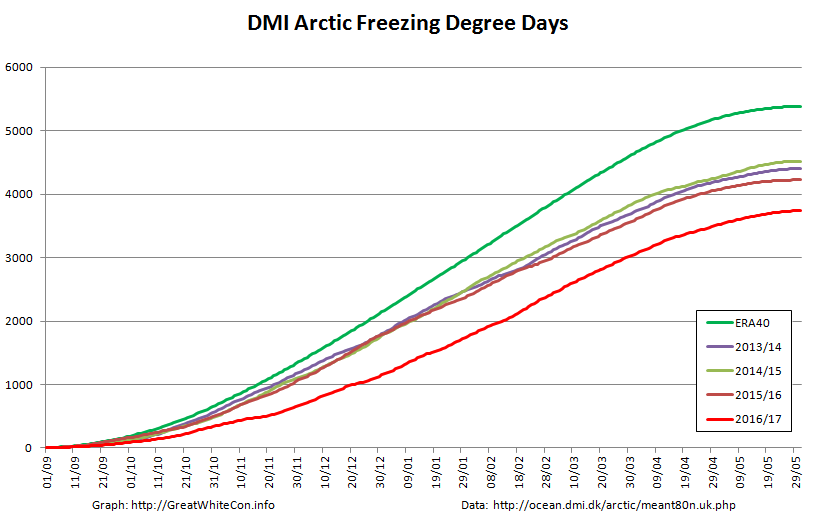
We calculate our freezing degree days on the basis of the freezing point of Arctic sea water at -1.8 degrees Celsius. On that basis this winter’s grand total of 3740 was reached on June 1st:
Despite the “coolish” recent weather total FDDs are way below the climatology and other recent years. Consequently there’s a lot less sea ice in the Arctic left to melt at the start of this Central Arctic melting season than in any previous year in the satellite record. However whilst there are some melt ponds visible in the Arctic Basin on MODIS, in that respect 2017 is lagging behind both last year and 2012.
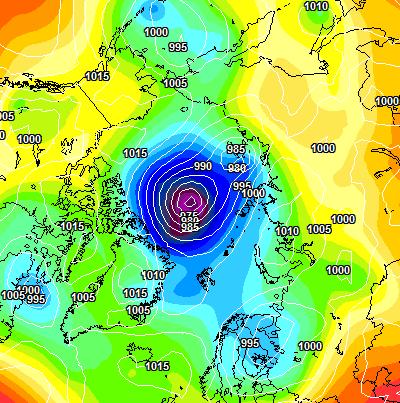
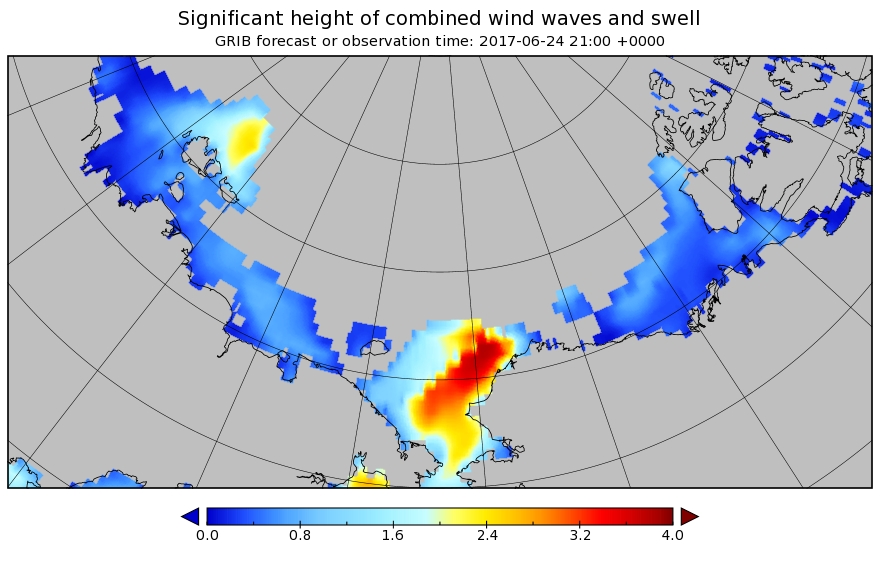
A sub 970 hPa cyclone is starting to enter the realms of realistic possibility, and also forecast are some significant waves in the Chukchi Sea and the expanding 2017 “Laptev Bite”:
[Edit – June 27th]
The forecast cyclone was nowhere near as deep as predicted. According to the analysis by Environment Canada it bottomed out at 980 hPa yesterday:
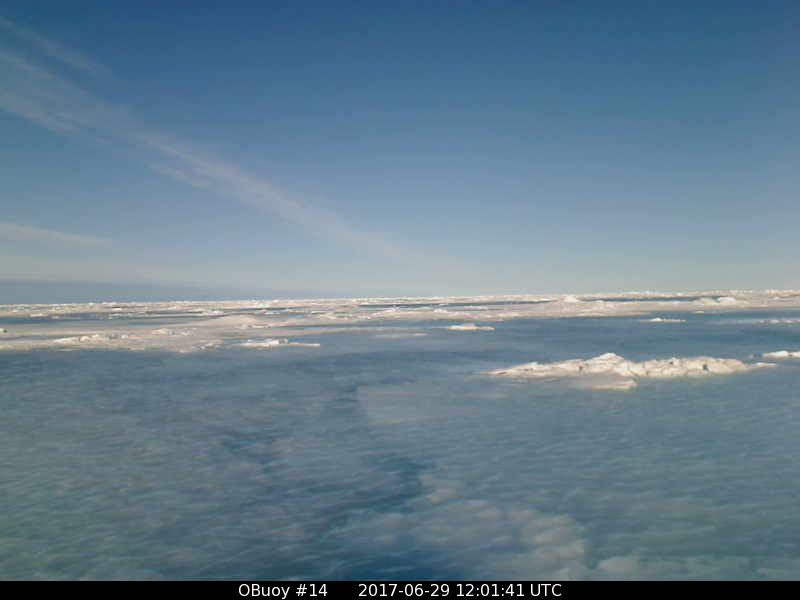
[Edit – June 29th]
O-Buoy 14 is currently firmly embedded in the fast ice of Viscount Melville Sound, deep in the heart of the Northwest Passage. Here’s the view from the buoy’s camera:
Before we got on to the more usual Arctic metrics let’s bear in mind that the beginning of May is the time when the ice on the mighty Mackenzie River begins to break up, ultimately sending a surge of (comparatively!) warm water rushing into the Beaufort Sea. The patches of open water visible in the Beaufort Sea off the Mackenzie Delta in early April refroze, but have recently opened up once again:
NASA Worldview “true-color” image of the Beaufort Sea on May 2nd 2017, derived from the MODIS sensor on the Terra satellite
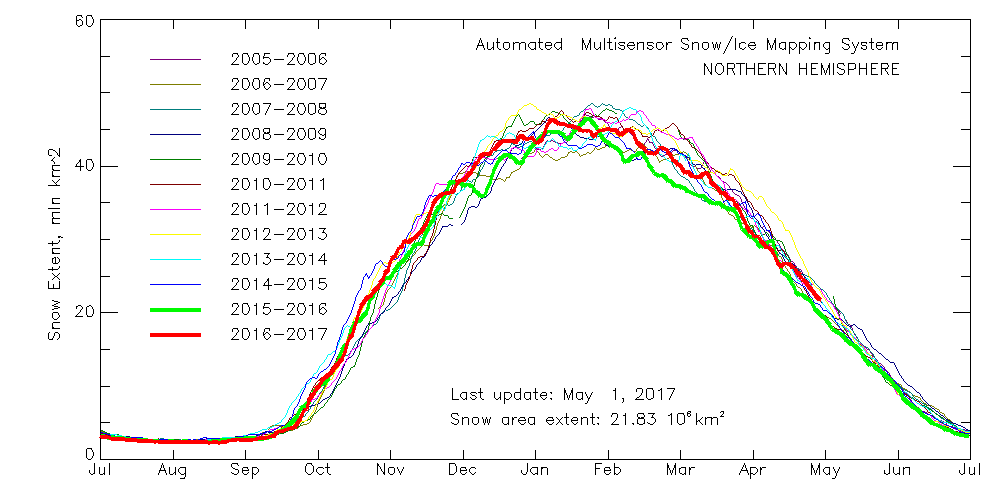
Meanwhile Northern Hemisphere snow cover is falling fast, albeit still above last year’s levels:
Here’s the current view of the Liard River in northern Canada, with the Mackenzie River running bottom to top on the right hand side:
NASA Worldview “true-color” image of the Liard and Mackenzie Rivers on May 2nd 2017, derived from the MODIS sensor on the Terra satellite
The break-up of the Liard leads the Mackenzie, and taking a look at last year’s view of the same area it’s apparent that this year there’s somewhat more snow on the ground, and that this years Mackenzie break-up will therefore be a few days later than last year:
NASA Worldview “true-color” image of the Liard and Mackenzie Rivers on May 2nd 2016, derived from the MODIS sensor on the Aqua satellite
Whilst early melt in the Beaufort Sea is currently behind last year, the reverse is most certainly the case next door in the Chukchi Sea. The skies are rather cloudy there at the moment, but using the Suomi NPP day/night band to peer through the gloom reveals this:
NASA Worldview “day/night band” image of the Chukchi Sea on May 2nd 2017, derived from the VIIRS sensor on the Suomi satellite
Whilst sea coverage on the Pacific periphery has continued to fall, extent on the Atlantic side has not been following suit. Hence overall Arctic sea ice area is no longer lowest in the satellite record:
Finally, until the new PIOMAS numbers are released at least, here’s how DMI freezing degree days look at the moment:
[Edit – May 4th]
The April PIOMAS numbers have been published: Arctic sea ice volume is yet again by far the lowest on record:
[Edit – May 5th]
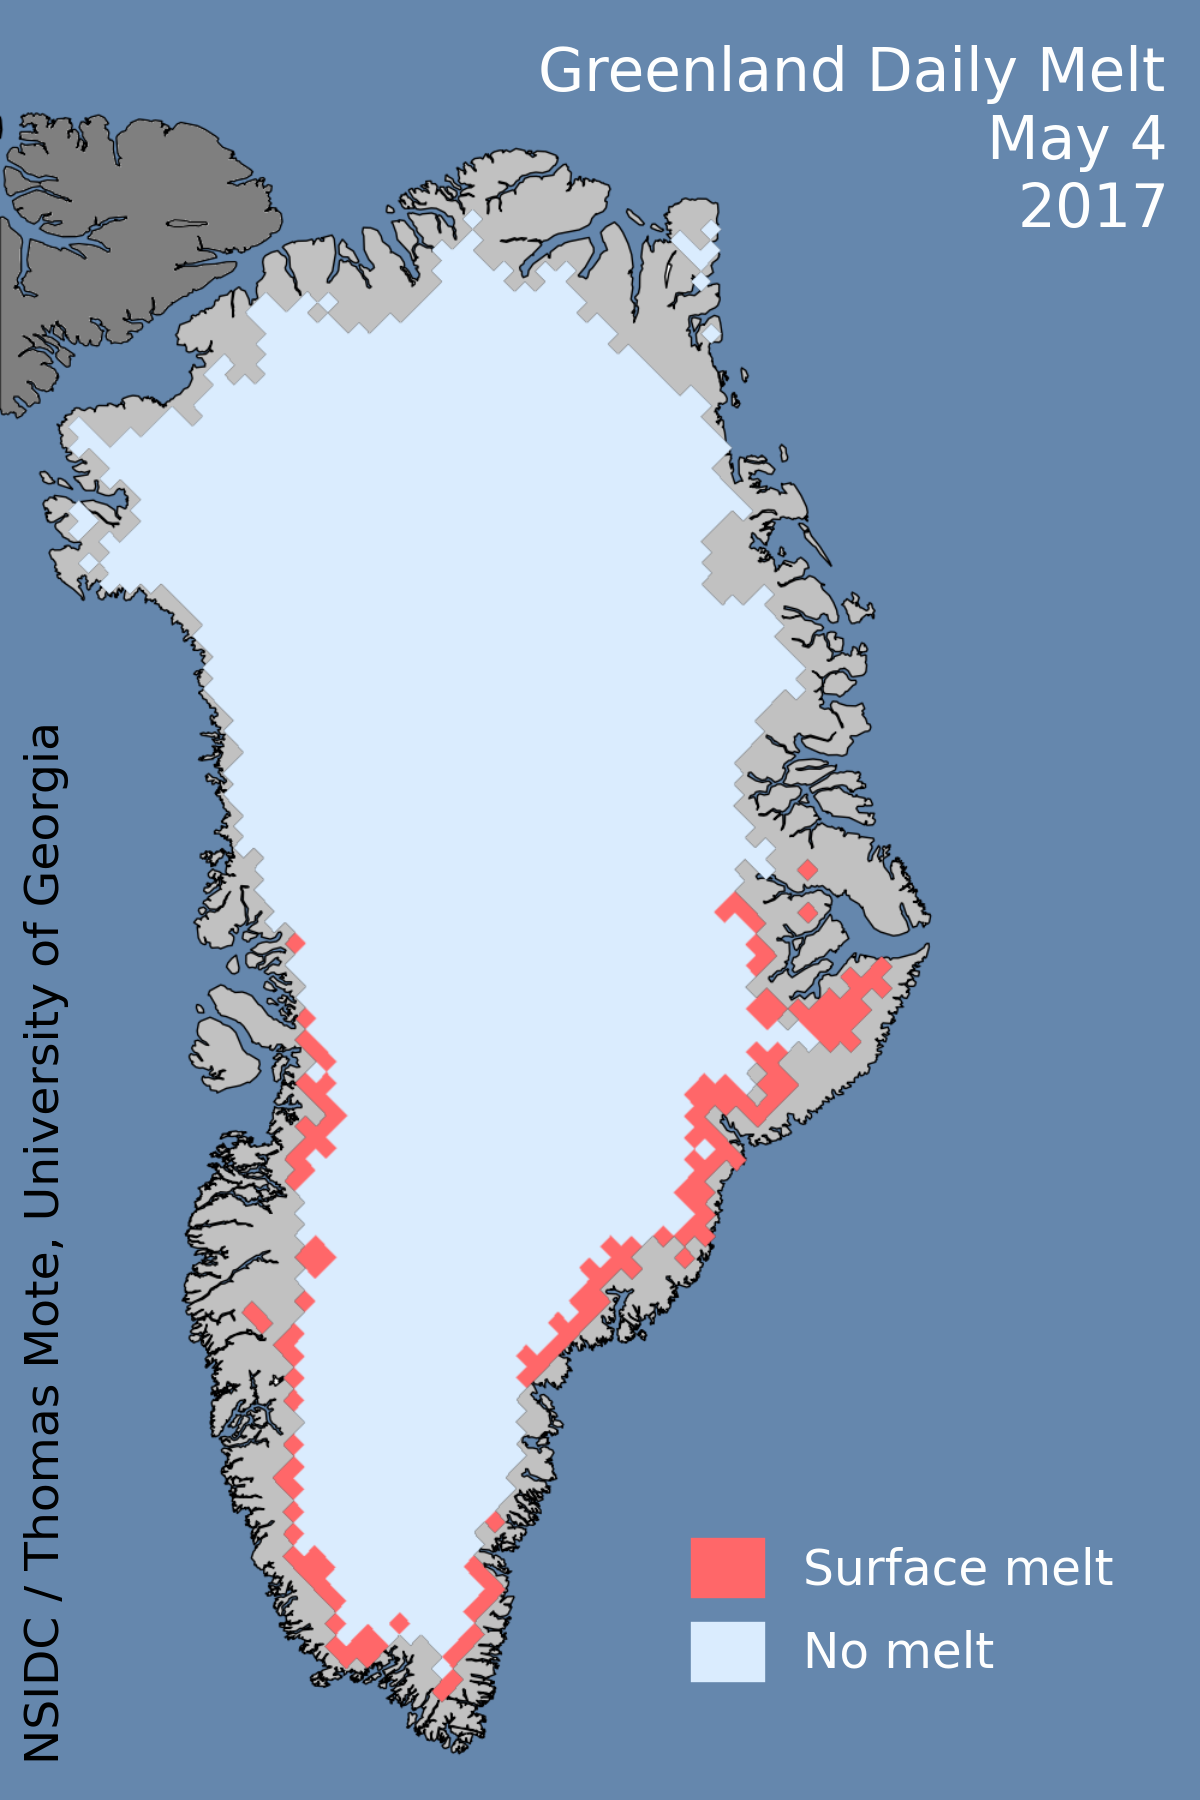
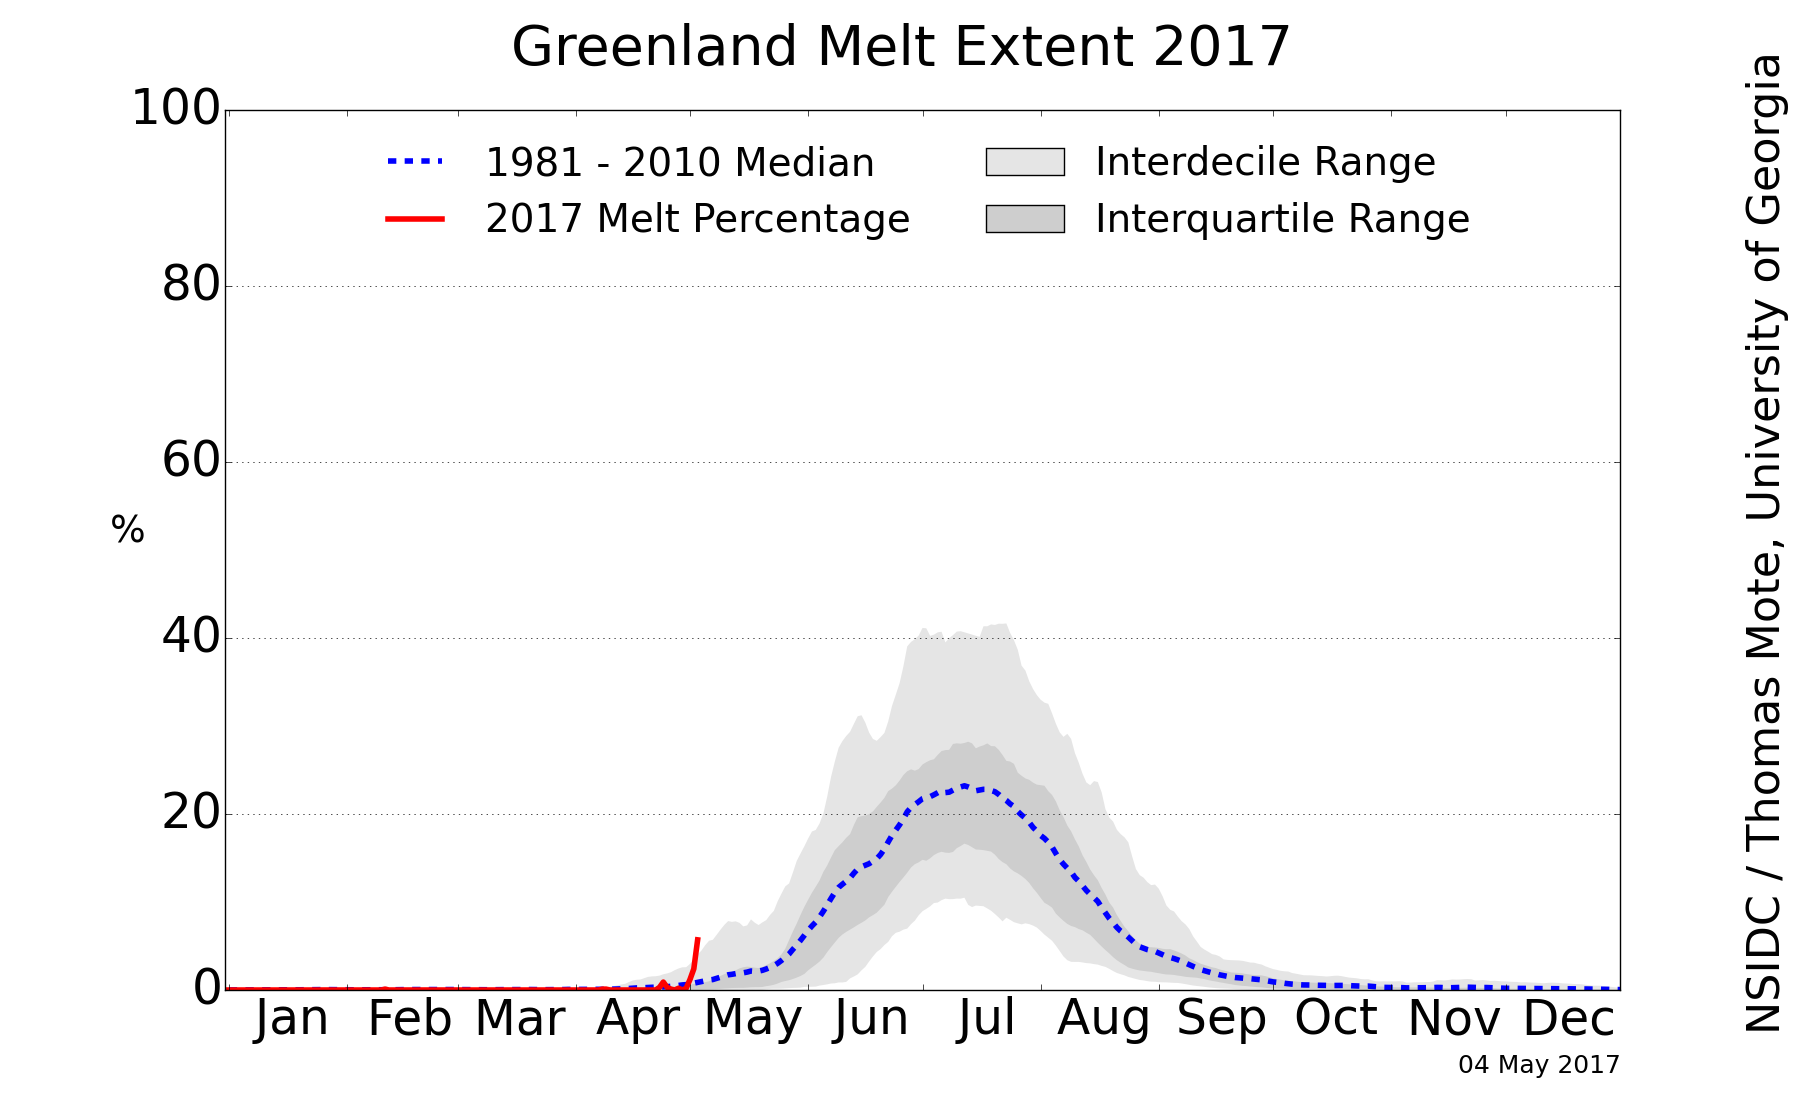
Greenland ice sheet surface melt has started early this year:
[Edit – May 12th]
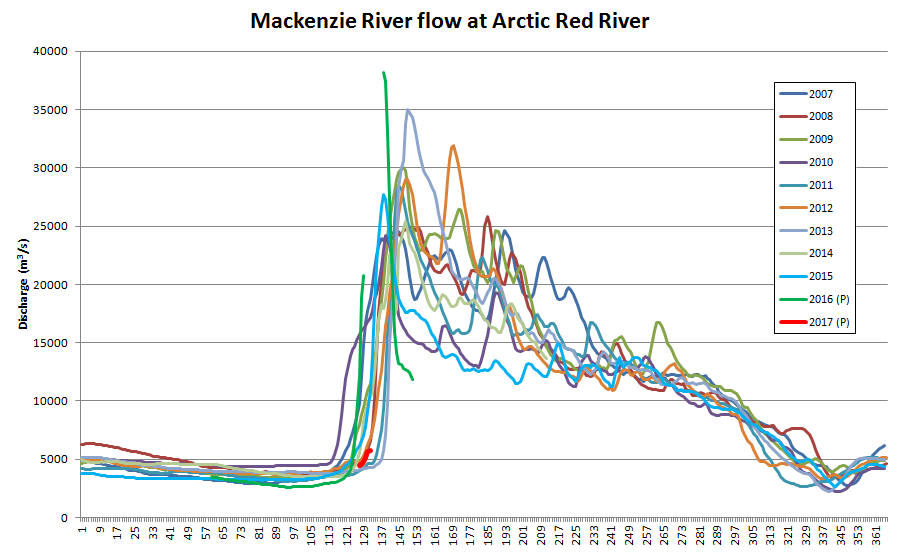
The ice break-up of the Mackenzie River is now visible as increased flow at the junction with Arctic Red River just south of the delta:
Mackenzie River flow at Arctic Red River up to May 12th 2017
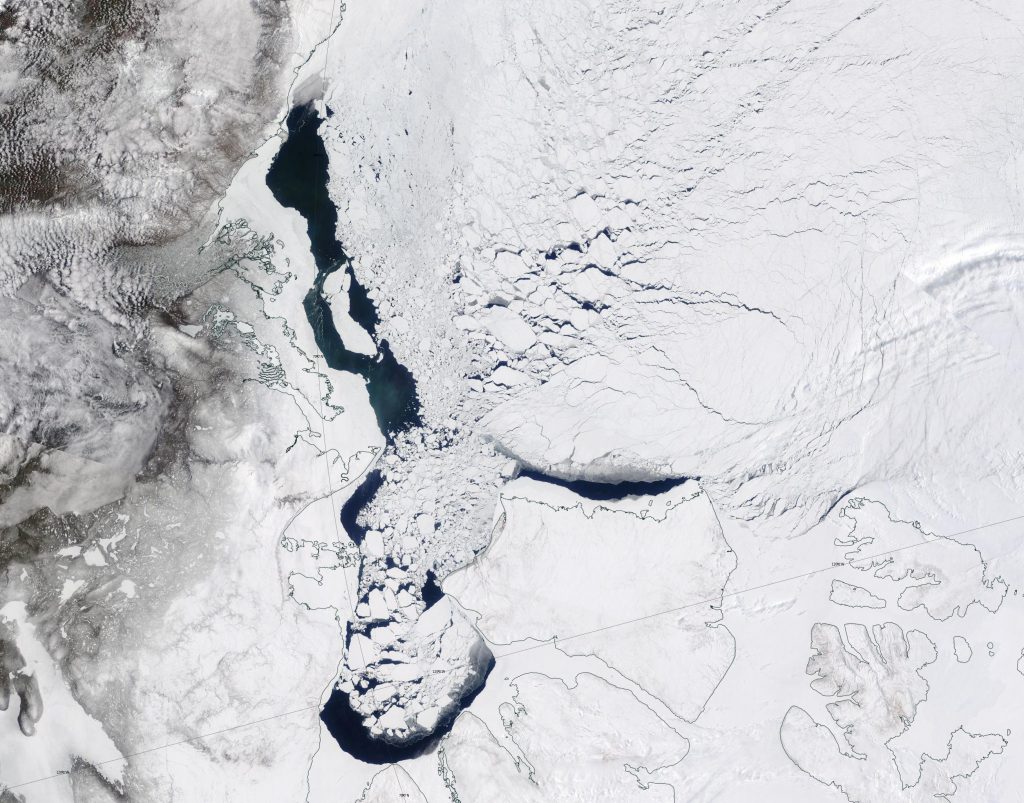
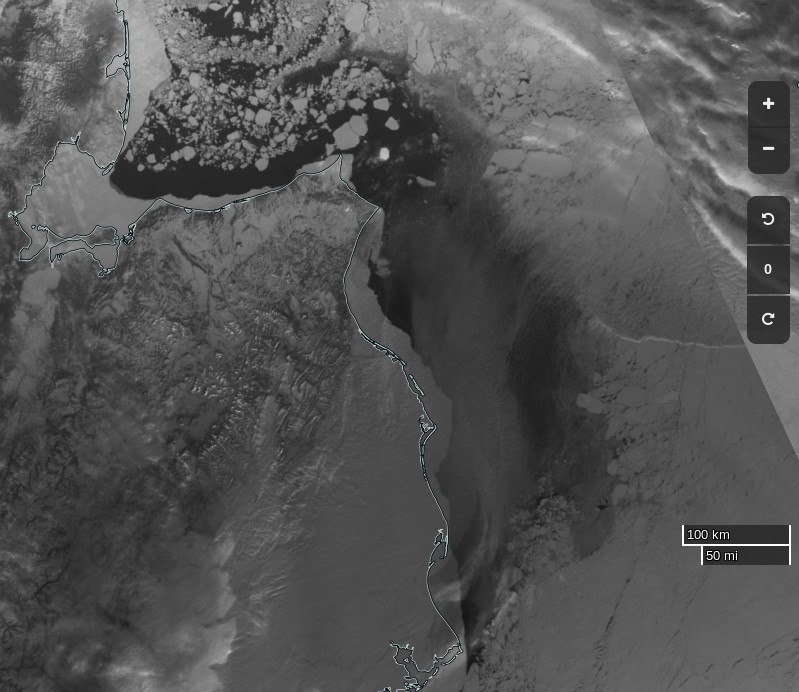
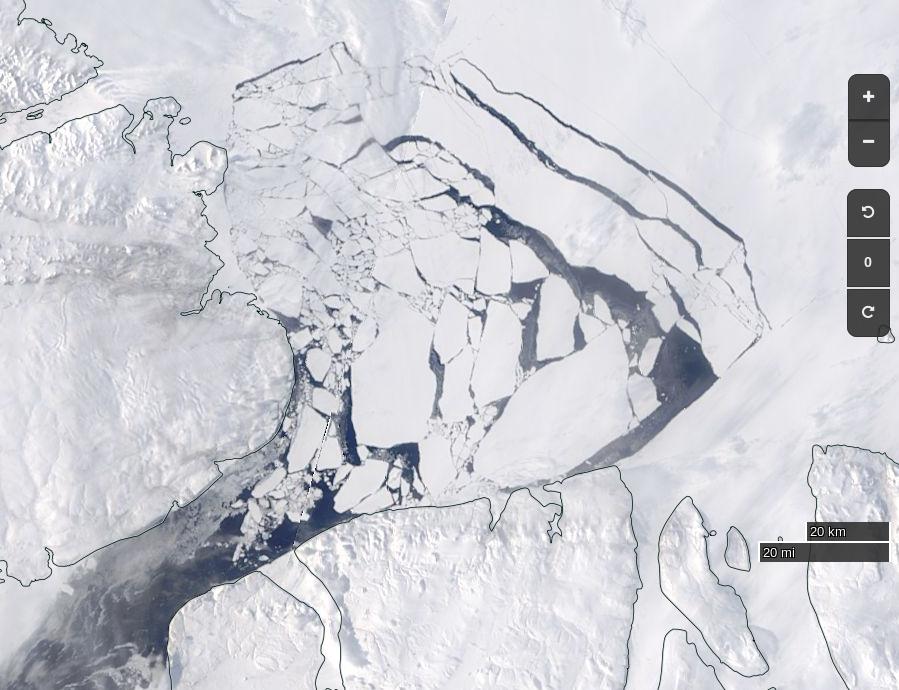
Meanwhile the sea ice in the Lincoln Sea north the Nares Strait is coming apart at the seams:
NASA Worldview “true-color” image of the Lincoln Sea on May 12th 2017, derived from the MODIS sensor on the Terra satellite
[Edit – May 17th]
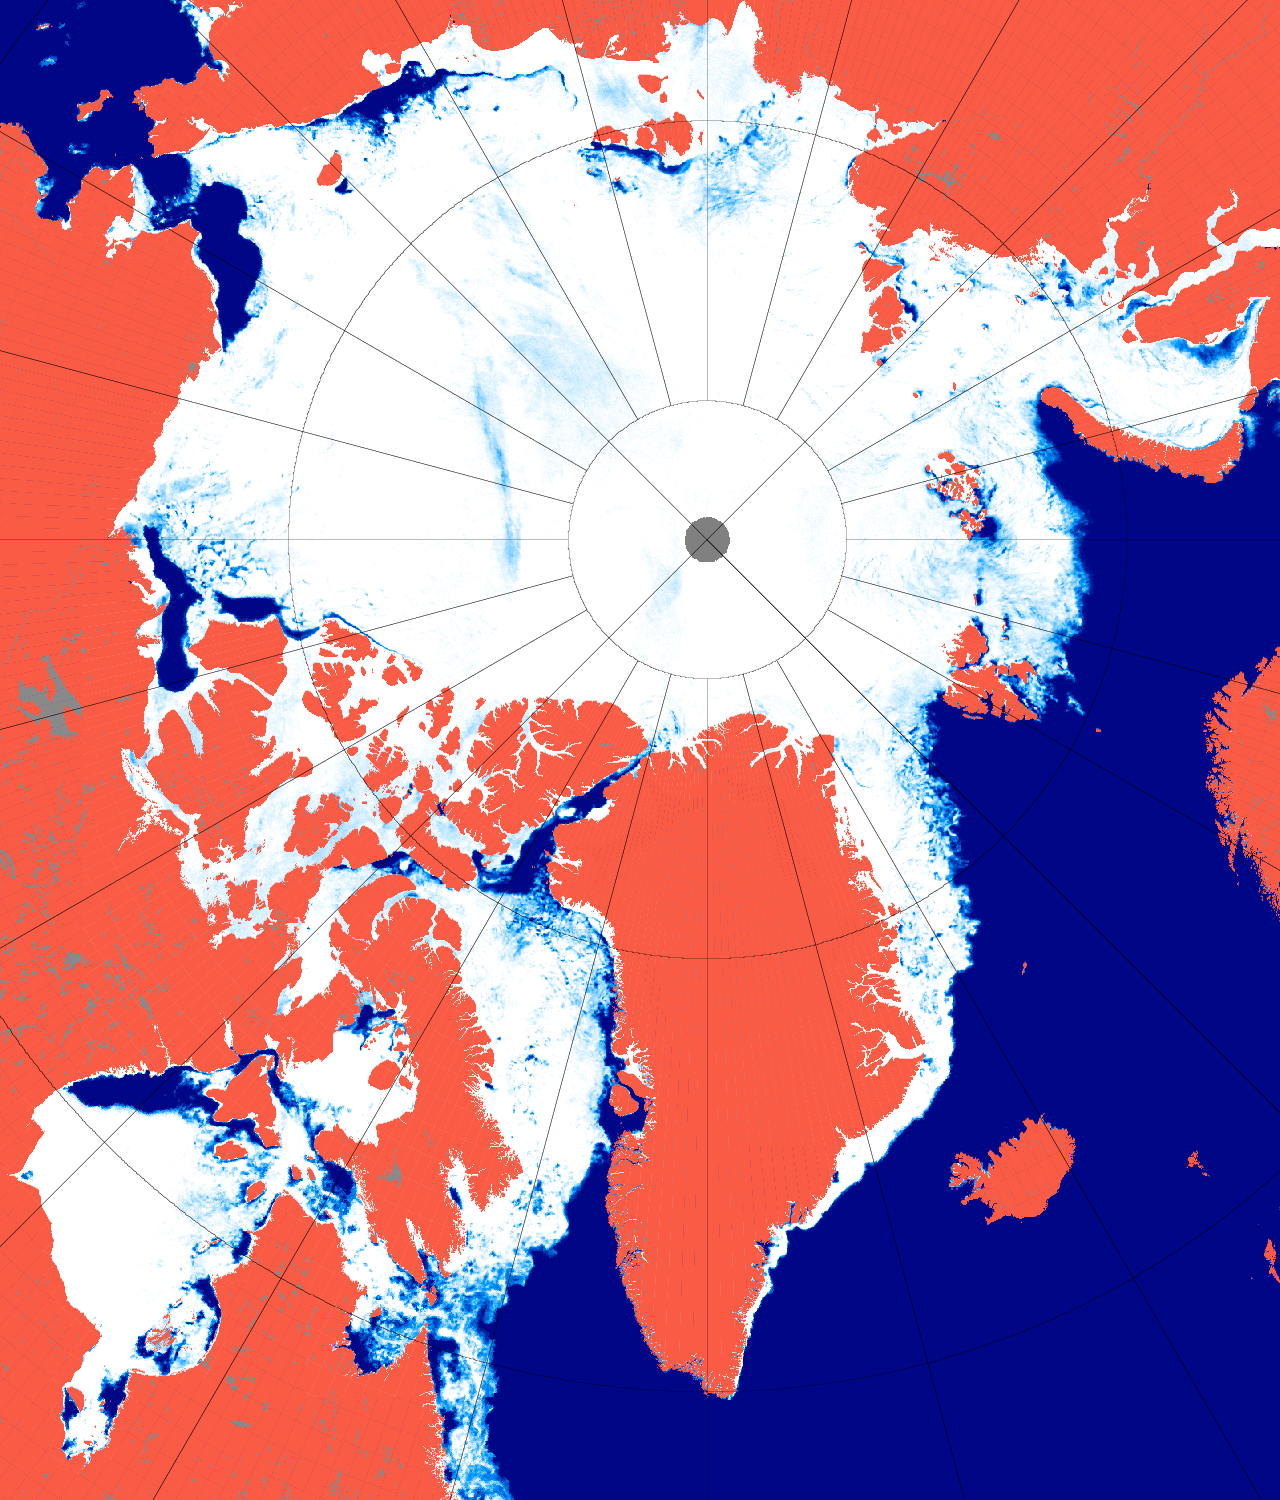
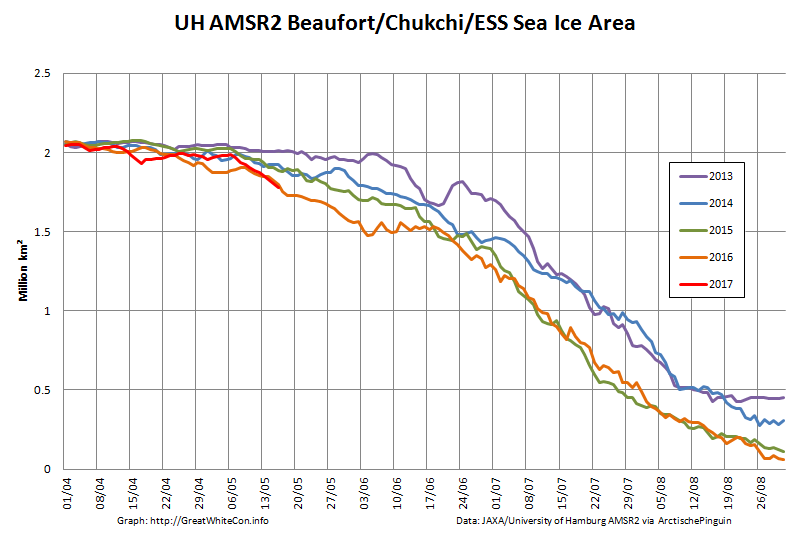
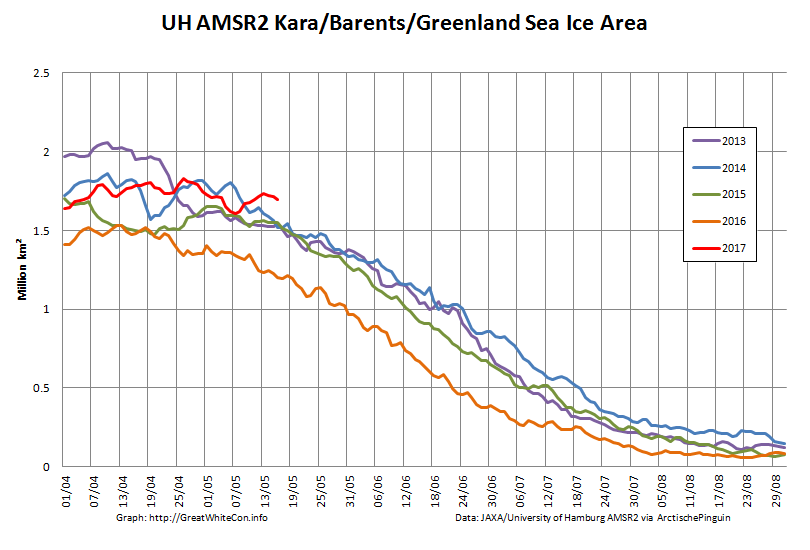
May seems to be shaping up as month of two halves, both spatially and temporally. Here’s an overview of the current state of play:
On the Pacific side of the Arctic sea ice area has been declining rapidly courtesy of the expanding areas of open water visible in the Beaufort, Chukchi and East Siberian Seas. It’s currently tracking below other recent years:
However over on the Atlantic side area has been flatlining, and is currently above other recent years:
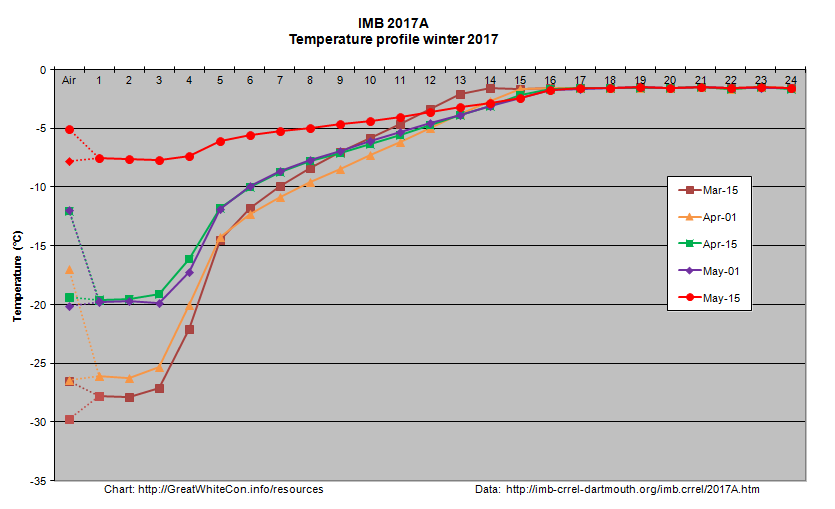
Ice mass balance buoy 2017A is now located near the boundary between the Beaufort and Chukchi Seas and as the melting season in that vicinity rapidly approaches it reveals that thermodynamic thickening has thus far achieved a mere 119 cm:
Arctic wide sea ice area has recently started to decline at an increasing rate:
During the second half of the month it will be interesting to see whether the forecast high temperatures produce significant melt ponding. If so it’s conceivable that 2017 area could drop below 2016 again by the beginning of June. There already signs of surface melt at places as far apart as Franklin Bay, Chaunskaya Bay and even the Great Bear Lake!
Watch this space!
References
Muhammad, P., Duguay, C., and Kang, K.-K.: Monitoring ice break-up on the Mackenzie River using MODIS data, The Cryosphere, 10, 569-584, doi:10.5194/tc-10-569-2016, 2016.
Rood S. B., Kaluthota S., Philipsen L. J., Rood N. J., and Zanewich K. P. (2017) Increasing discharge from the Mackenzie River system to the Arctic Ocean, Hydrol. Process., 31, 150–160. doi: 10.1002/hyp.10986.
Kwok, R., L. Toudal Pedersen, P. Gudmandsen, and S. S. Pang (2010), Large sea ice outflow into the Nares Strait in 2007, Geophys. Res. Lett., 37, L03502, doi:10.1029/2009GL041872.
Both of the last two years, temperatures stayed below normal for the entire melt season.
The below normal summer temperatures are keeping the ice from melting, and have led to a large expansion in the amount of thick multi-year ice.
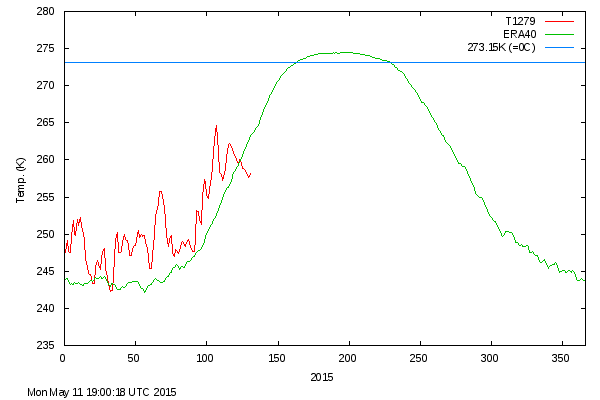
However the Arctic is unfortunately failing to cooperate with that narrative. Today we are unhappy to report that Tony Heller‘s favourite Arctic sea ice metric, the Danish Meteorological Institute 30% threshold extent, is at the lowest level ever for the date since their records began:
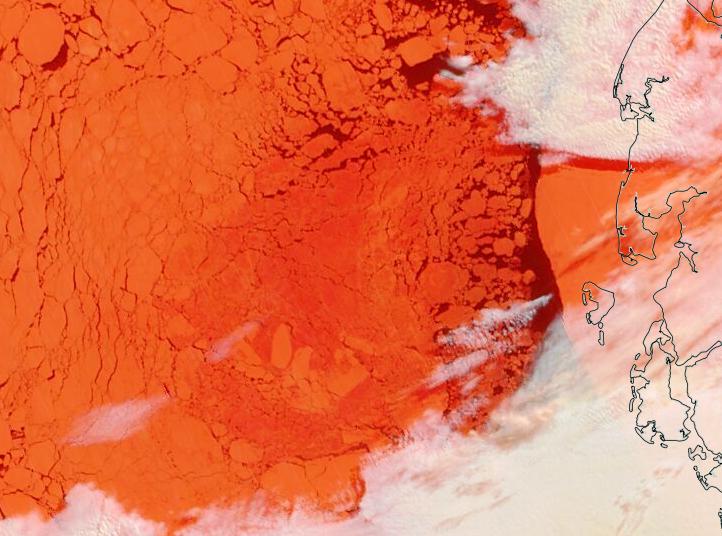
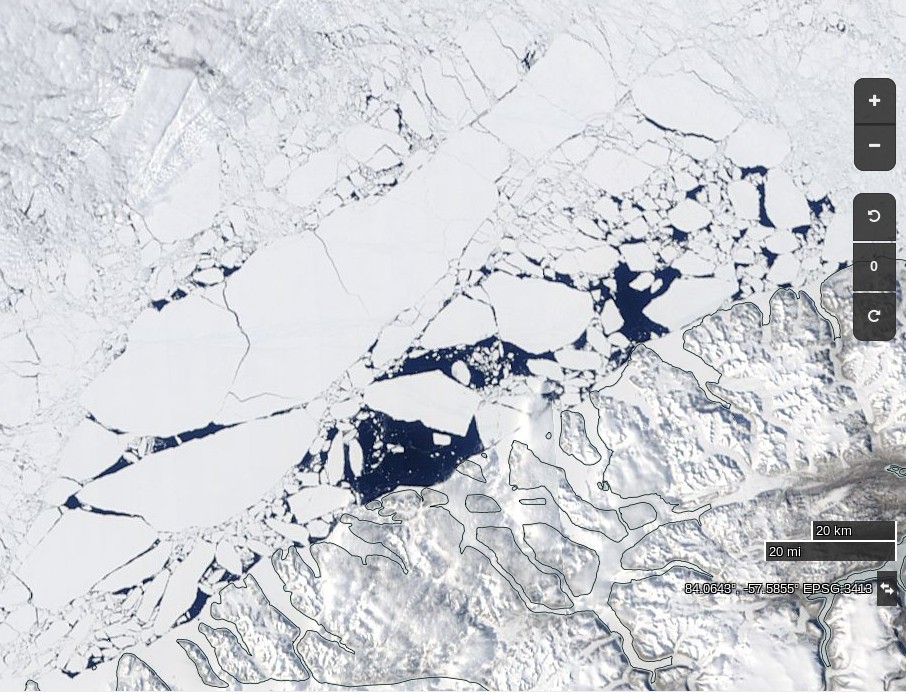
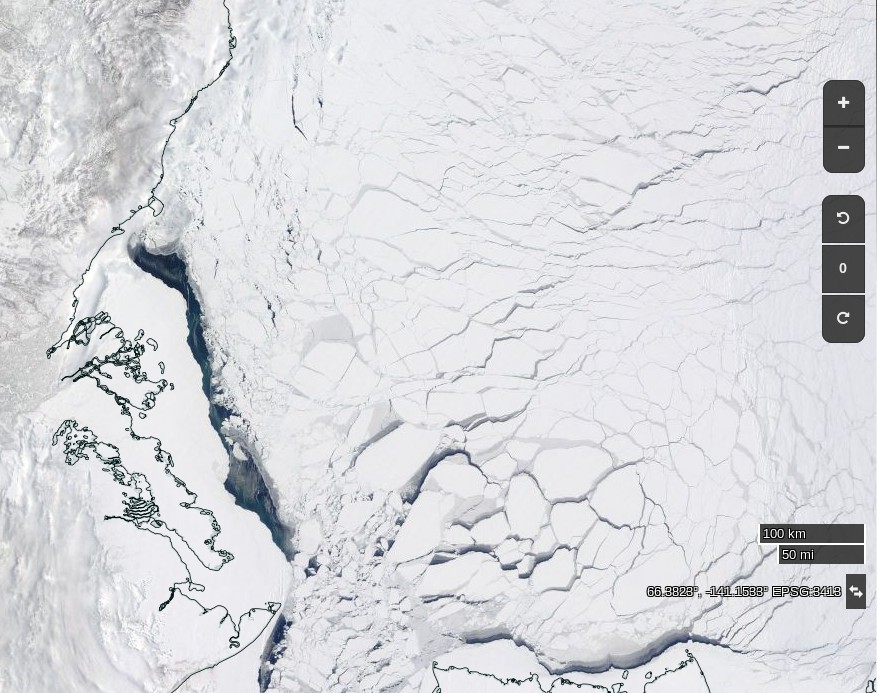
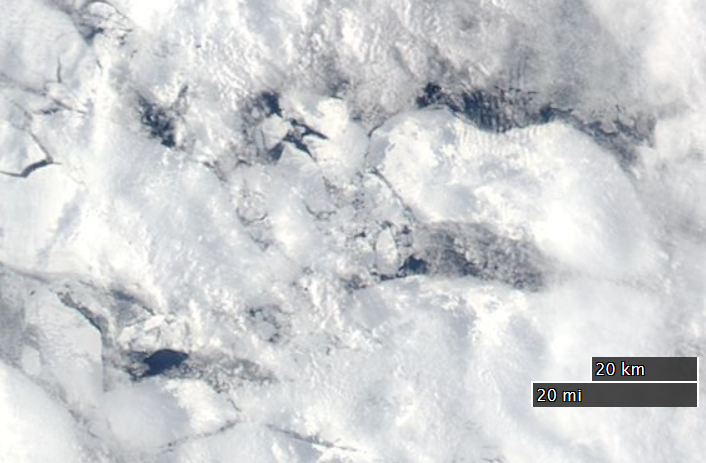
As if that wasn’t enough to be going on with, some big holes have already appeared in the middle of the supposedly multi-meter thick, multi-year sea ice in the Beaufort Sea, well away from the open water already warming up off the Mackenzie Delta:
NASA Worldview “true-color” image of The Beaufort Sea on May 11th, derived from bands 1, 4 and 3 of the MODIS sensor on the Aqua satellite
This website uses cookies to improve your experience. We'll assume you're ok with this, but you can opt-out if you wish. Cookie settingsACCEPT
Privacy & Cookies Policy
Privacy Overview
This website uses cookies to improve your experience while you navigate through the website. Out of these, the cookies that are categorized as necessary are stored on your browser as they are essential for the working of basic functionalities of the website. We also use third-party cookies that help us analyze and understand how you use this website. These cookies will be stored in your browser only with your consent. You also have the option to opt-out of these cookies. But opting out of some of these cookies may affect your browsing experience.
Necessary cookies are absolutely essential for the website to function properly. This category only includes cookies that ensures basic functionalities and security features of the website. These cookies do not store any personal information.
Any cookies that may not be particularly necessary for the website to function and is used specifically to collect user personal data via analytics, ads, other embedded contents are termed as non-necessary cookies. It is mandatory to procure user consent prior to running these cookies on your website.