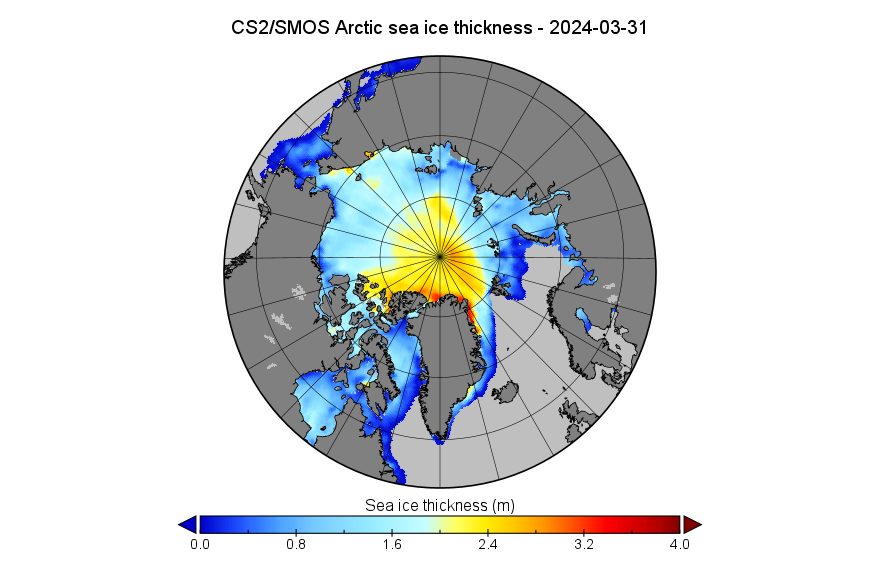
Starting this month with a look at assorted volume/thickness data, here is the CryoSat-2/SMOS merged Arctic sea ice thickness map for March 31st:
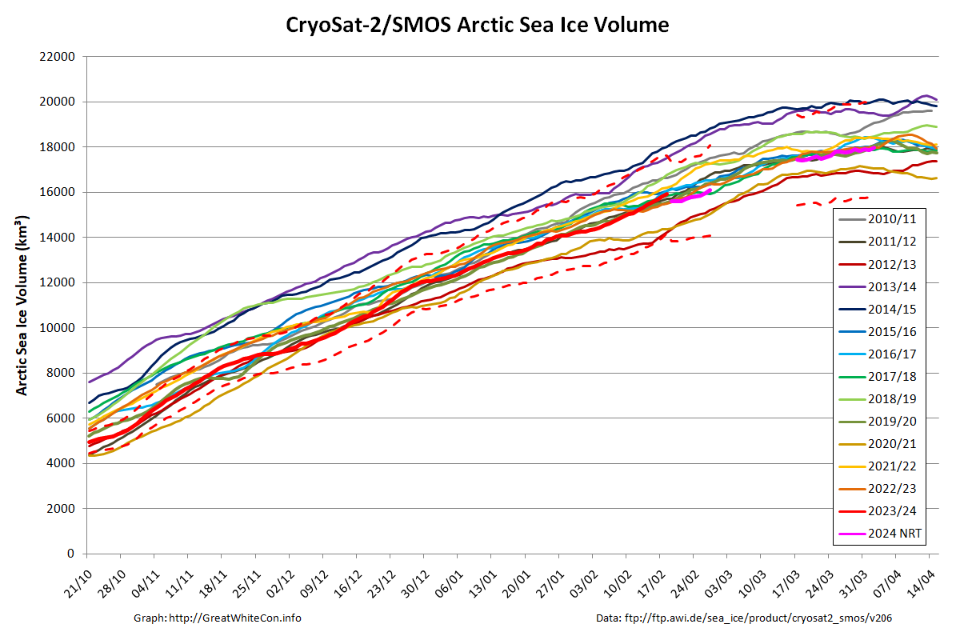
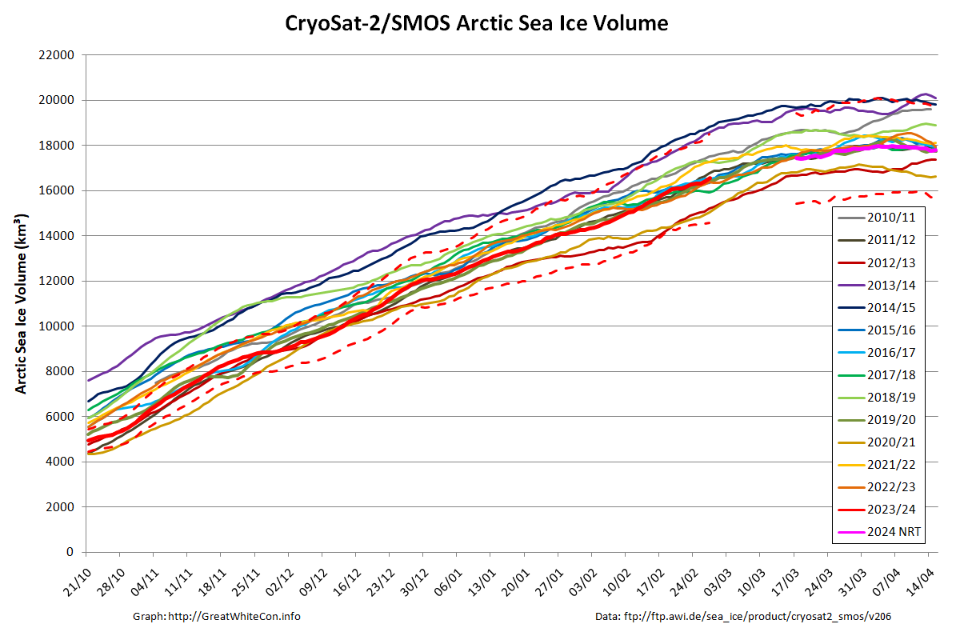
Plus the associated volume graph, which still suffers from a gap in the near real time data due to the problem with the SMOS satellite during the first half of March:
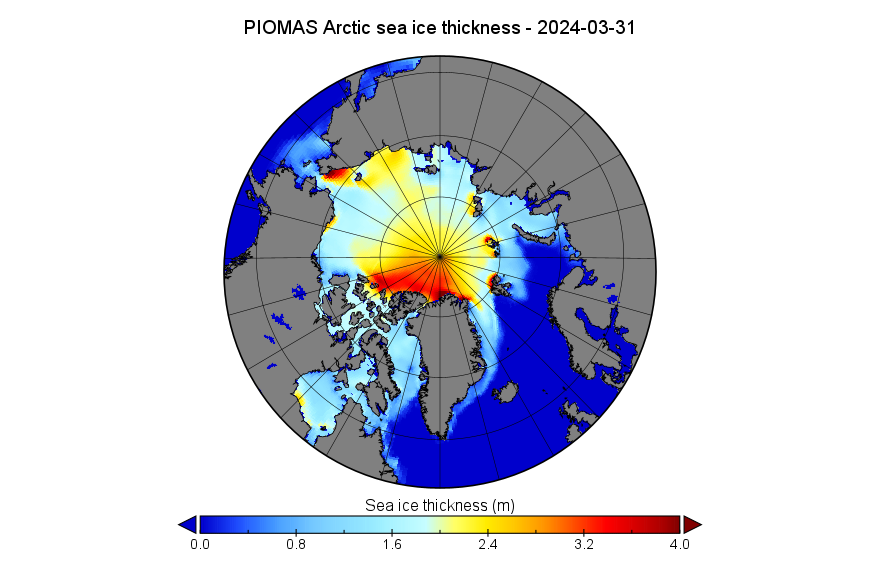
The PIOMAS gridded thickness data for March 2024 is also available. Here’s the end of month thickness map:
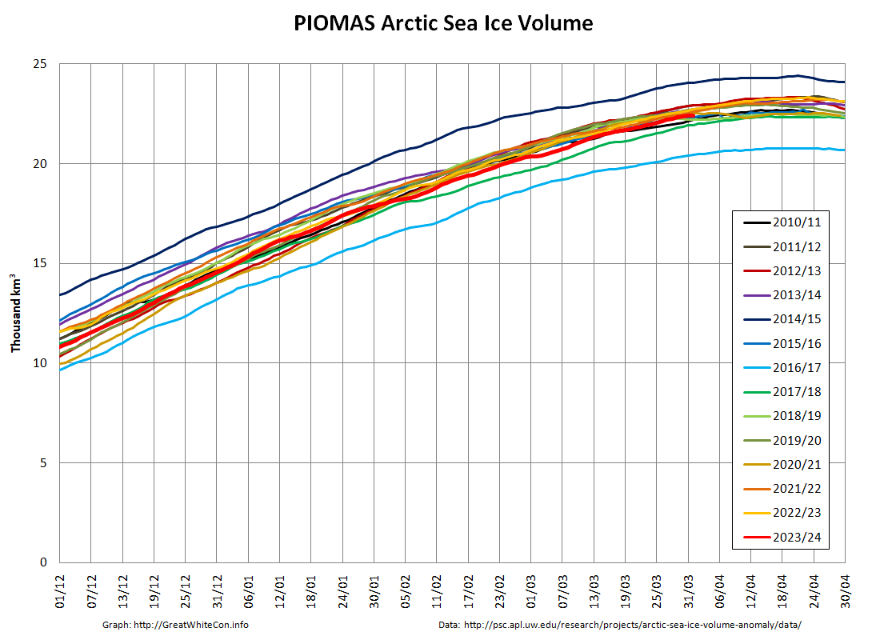
Plus the calculated volume graph:
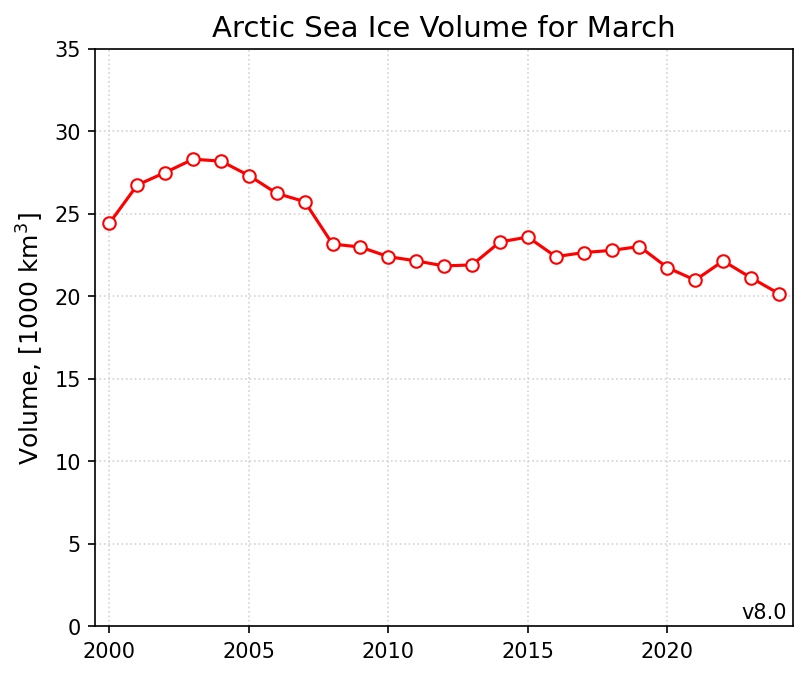
Especially for Peter, here too is the DMI’s chart of monthly Arctic sea ice volume for March:
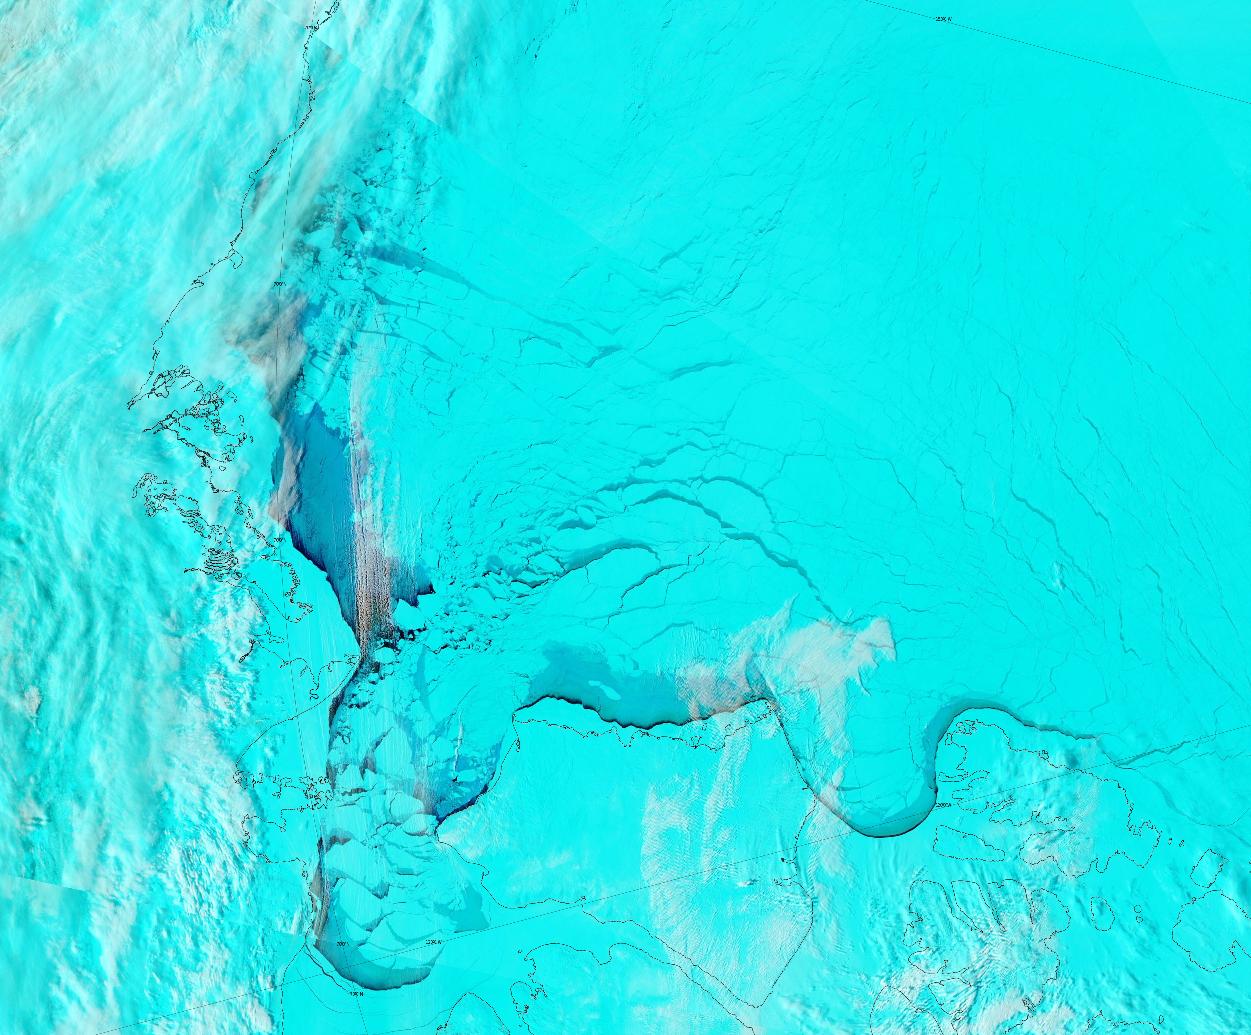
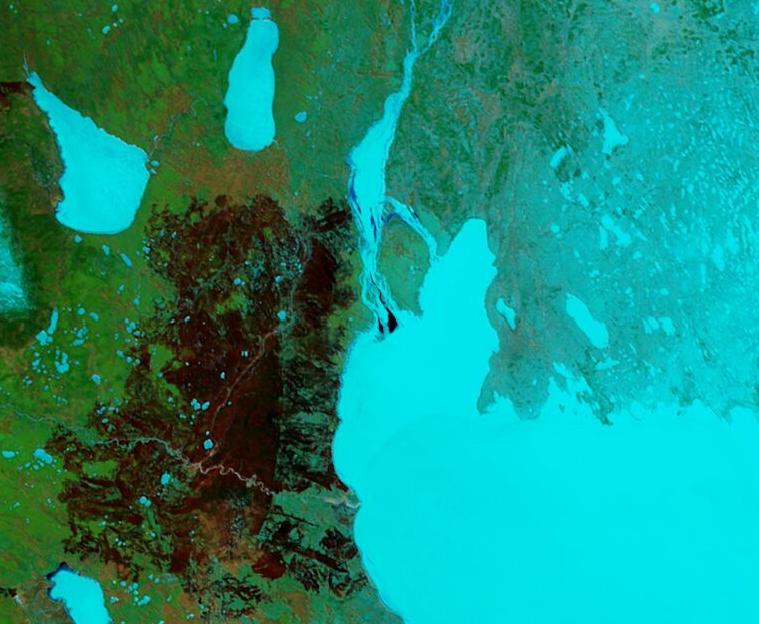
There is still no sign of the usual band of thicker ice across the Beaufort Sea, and the area of thin ice off the Mackenzie Delta in the thickness maps is also visible in MODIS imagery:
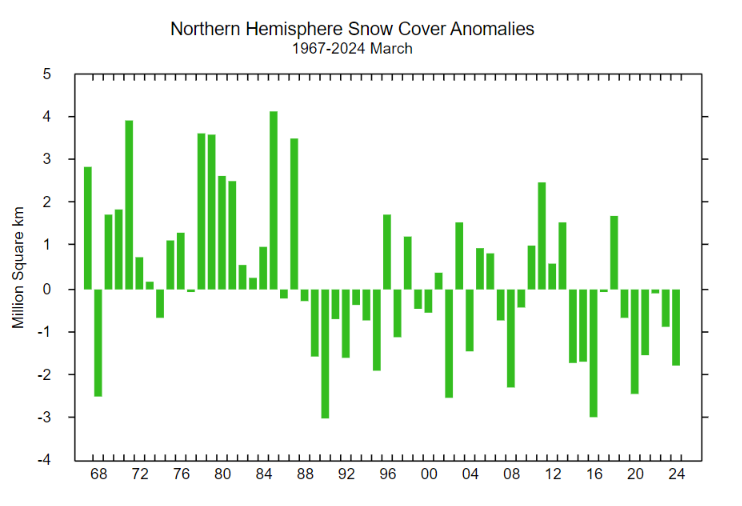
The March Rutgers Global Snow Lab northern hemisphere snow cover anomaly chart reveals a negative anomaly of almost 2 million km2, similar to last month:
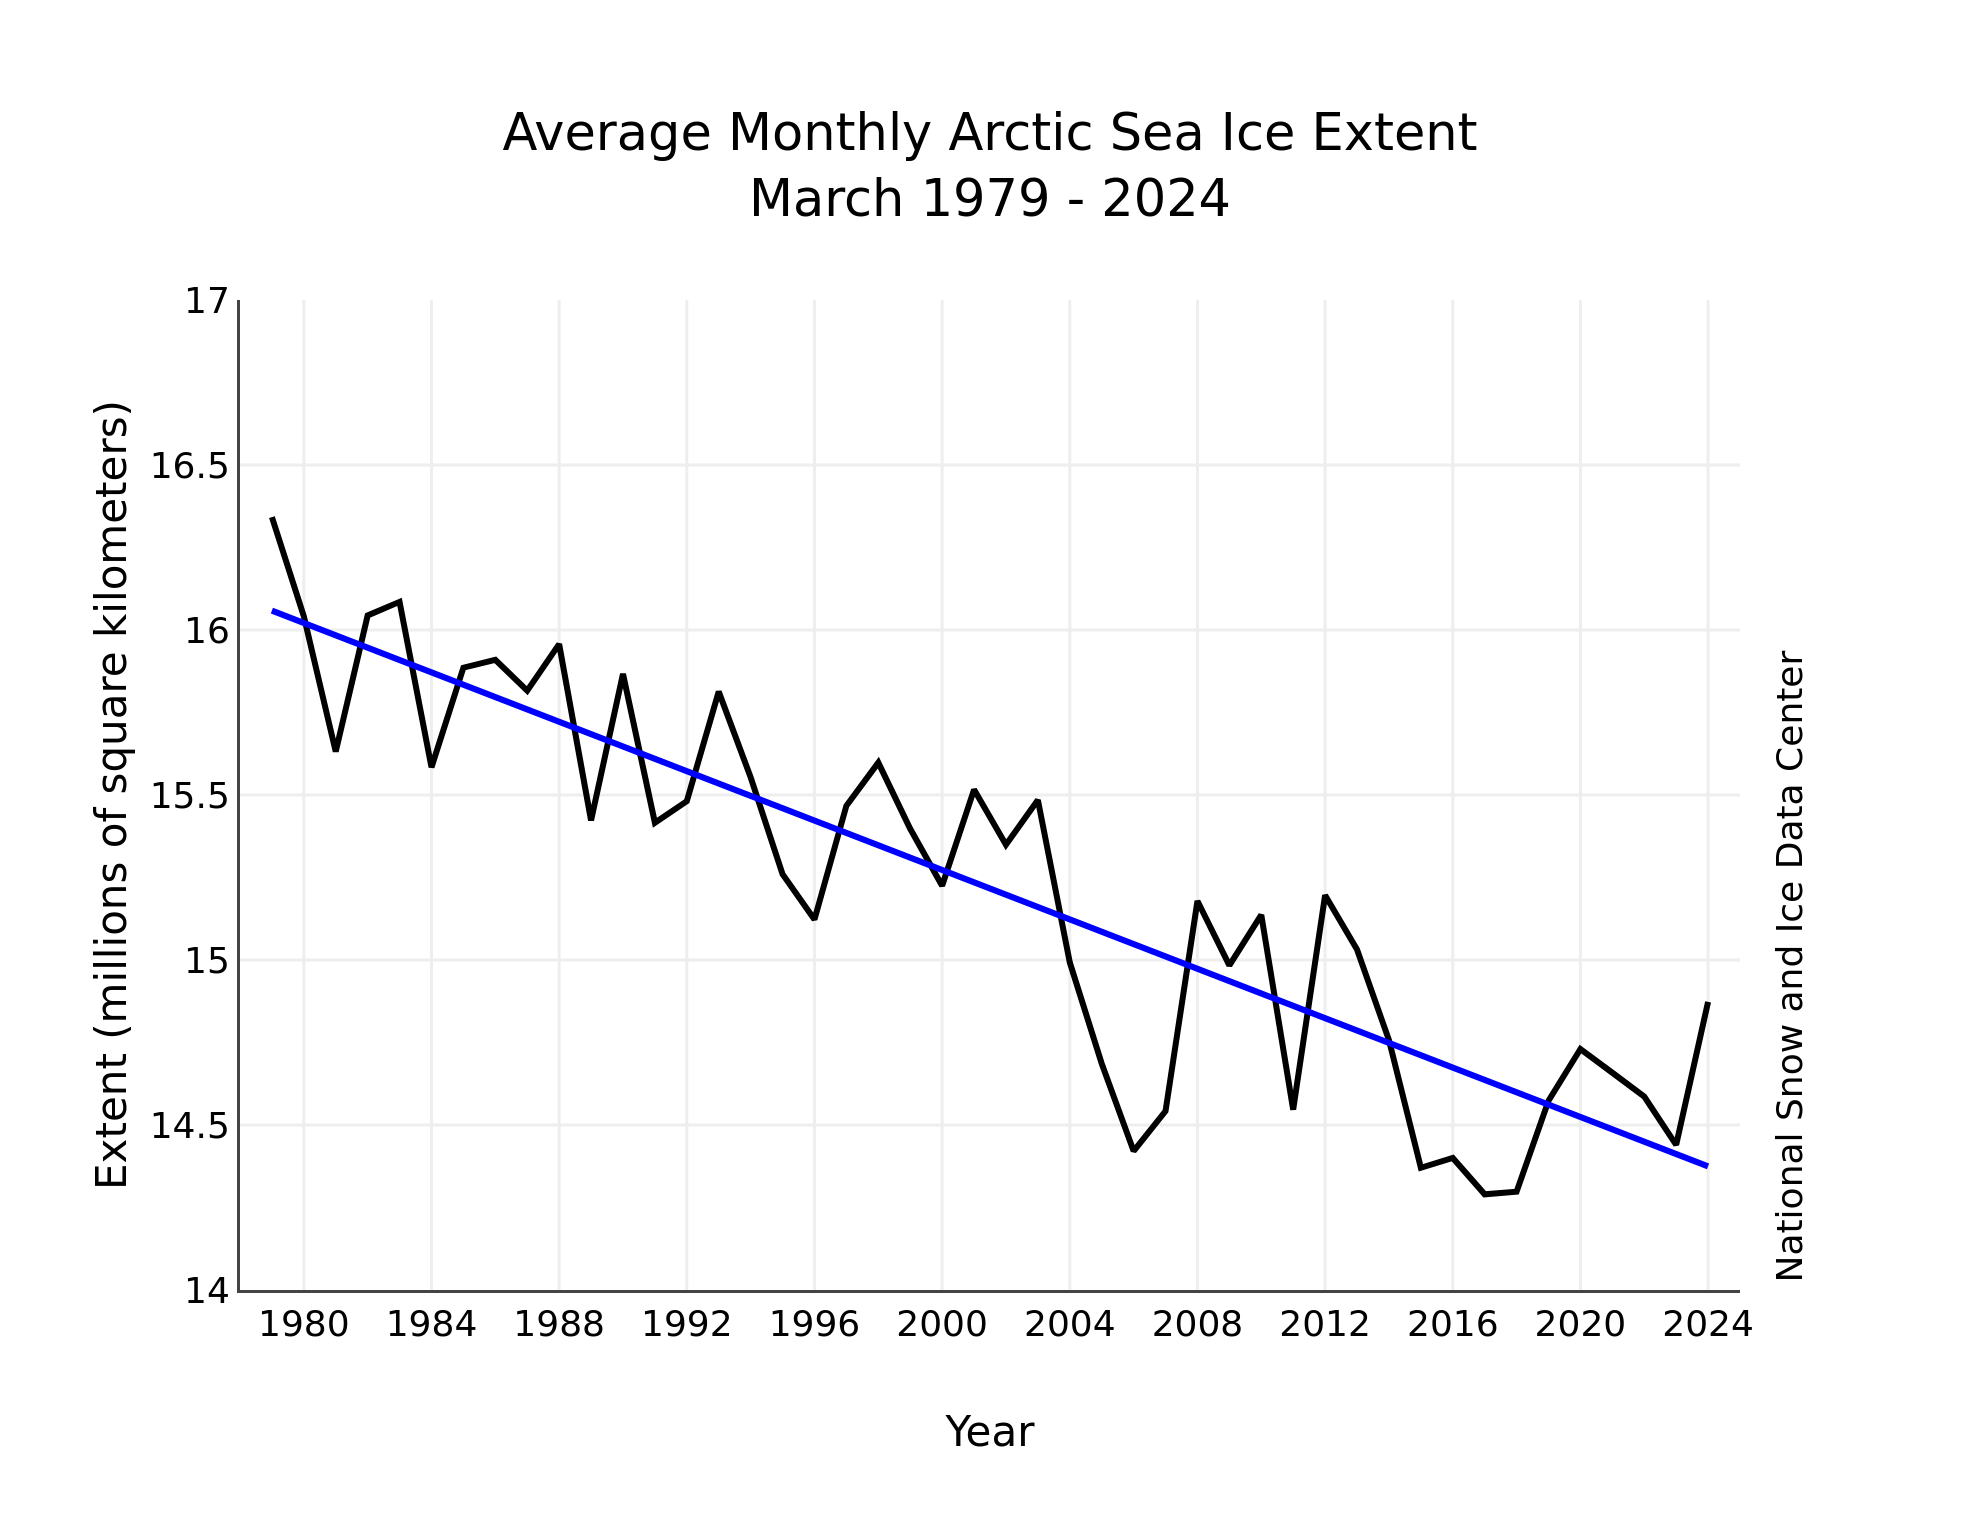
The National Snow and Ice Data Center have published the latest edition of their Arctic Sea Ice News:
The average ice extent for March 2024 is 14.87 million square kilometers, fifteenth lowest in the passive microwave satellite record. As of the beginning of April 2024, Arctic sea ice extent had dropped by about 278,000 square kilometers below the March 14 maximum:
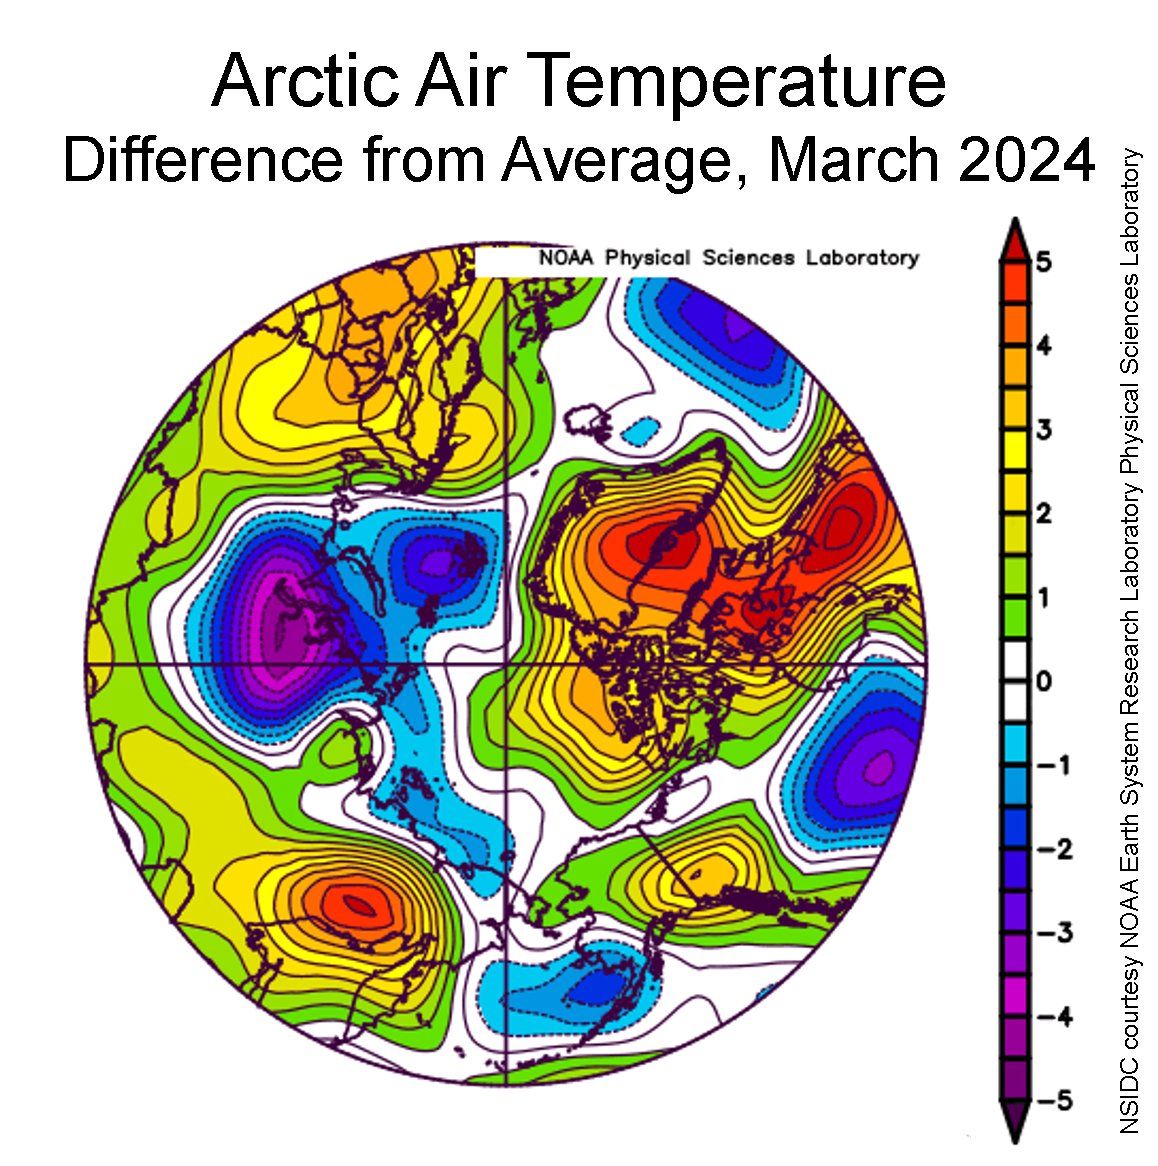
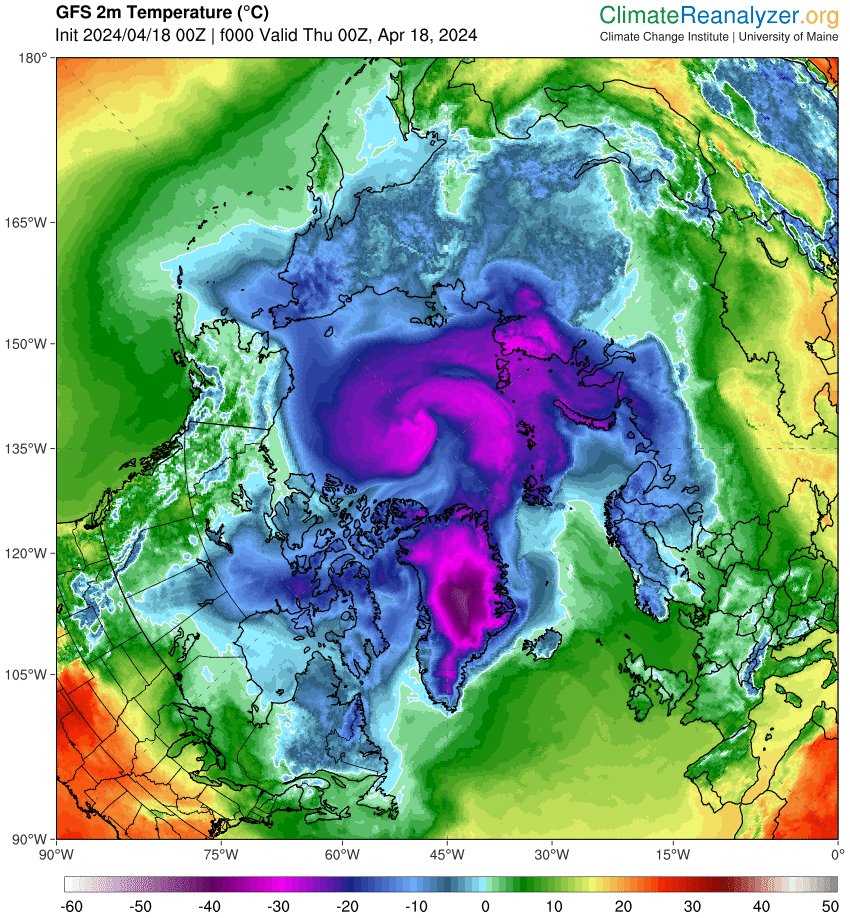
Air temperatures for March 2024 at the 925 hPa level (about 2,500 feet above the surface) were below average in the Barents Sea and along the Eurasian coast at 1 to 3 degrees Celsius contrasting with above average values of 2 to 5 degrees Celsius over the Canadian Arctic Archipelago, Greenland, and Baffin Bay:
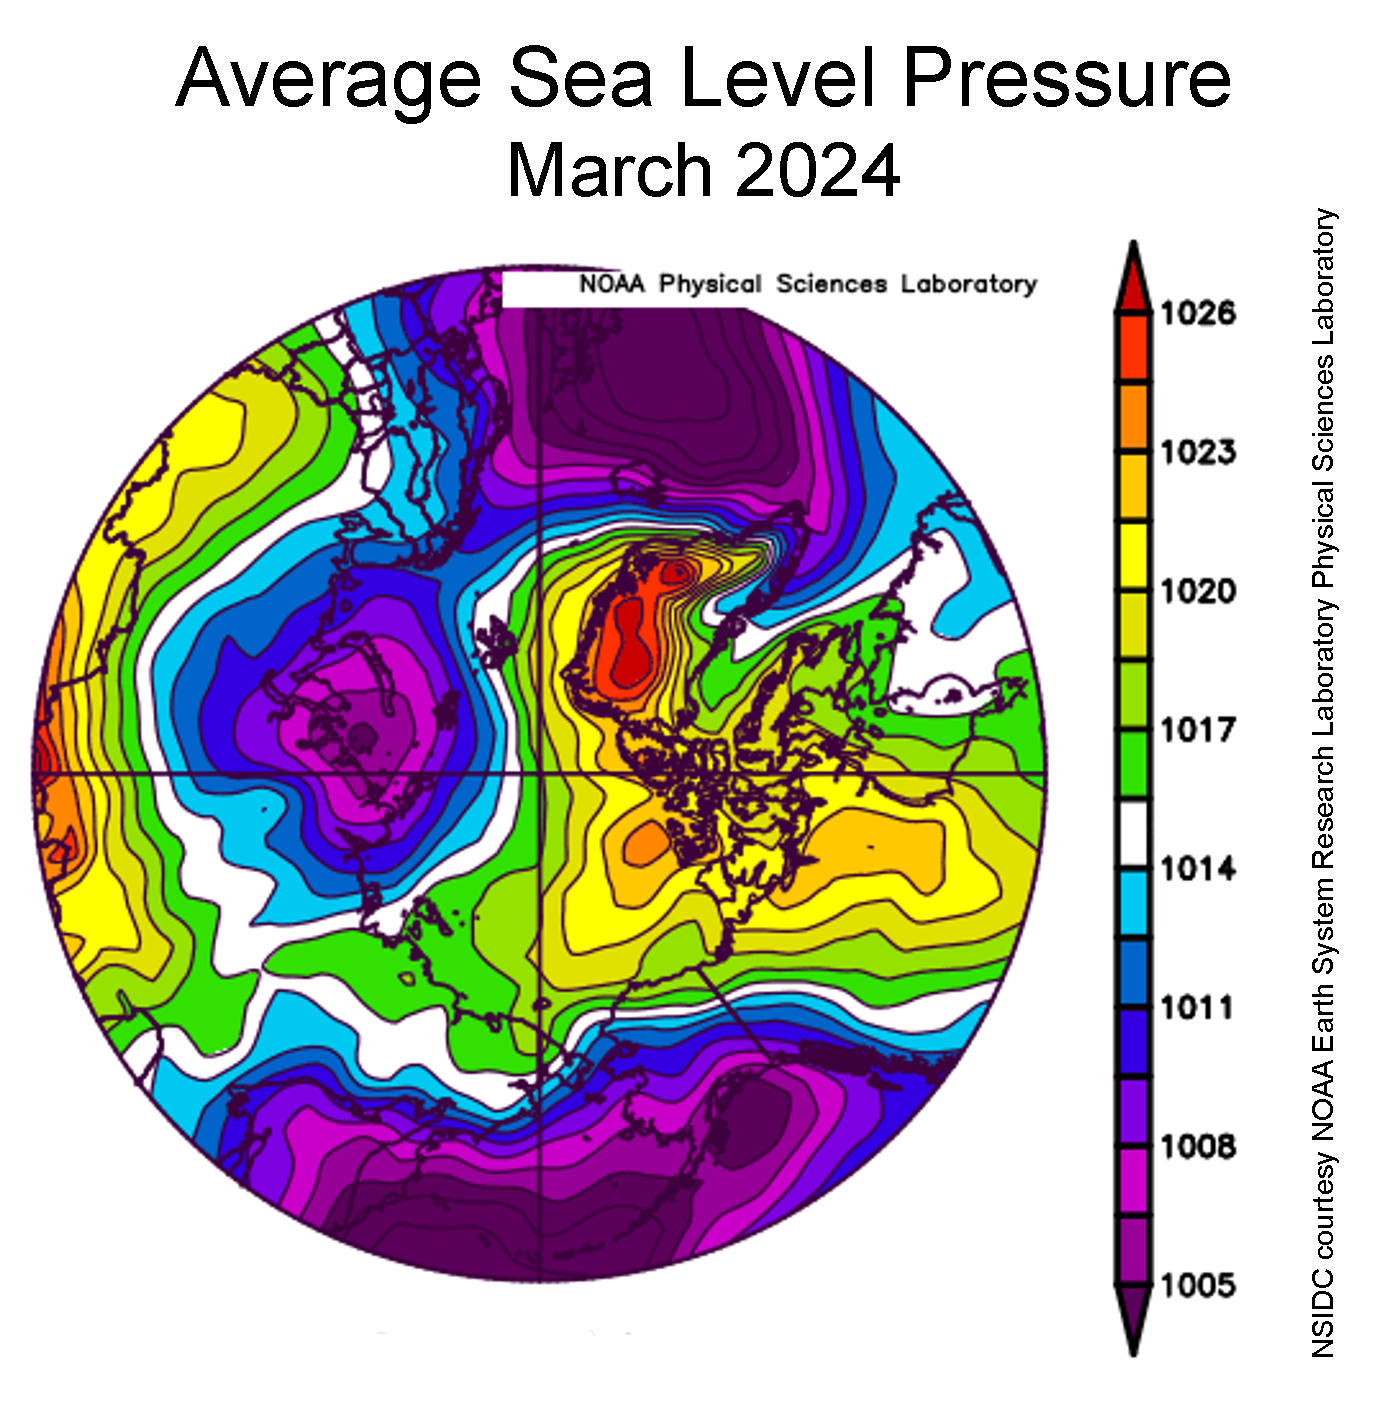
This was attended by an unusual atmospheric circulation pattern at sea level, with high pressure over the North American side of the Arctic and low pressure centered over the Kara Sea, leading to a strong intervening pressure gradient across the Fram Strait. This implies strong winds from the north directed down the strait, which likely favored a strong export of sea ice out of the Arctic Ocean. Whether this pattern continues to persist bears watching:
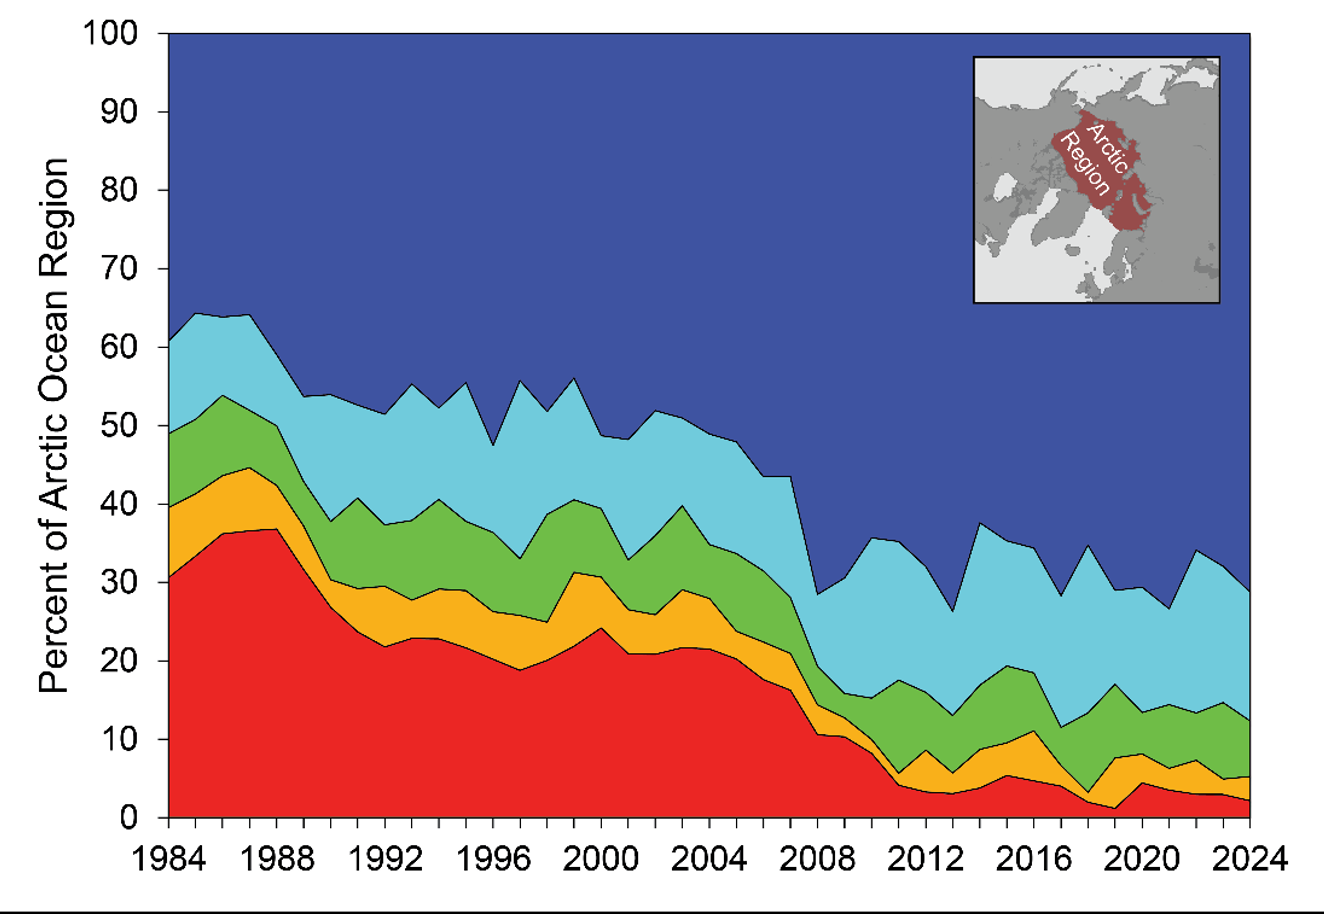
With the passage of the seasonal maximum sea ice extent, it is appropriate to provide an updated assessment of sea ice age. Older, multiyear ice (ice that has survived at least one melt season) is generally thicker and more resistant to melting completely during the upcoming melt season than first-year ice, which represents ice growth of the previous autumn and winter. As seen in the figure, first-year ice dominates, as it has for the past several years. The extent of multiyear ice is lower than last year, mostly because of less second-year ice (one- to two-year-old ice that has survived two melt seasons), but it is within the ranges that have been seen since 2008. The oldest ice (greater than four-years old) has been at very low levels since 2012 and is slightly lower than last year:
Here is the end of March map of Arctic sea ice age:
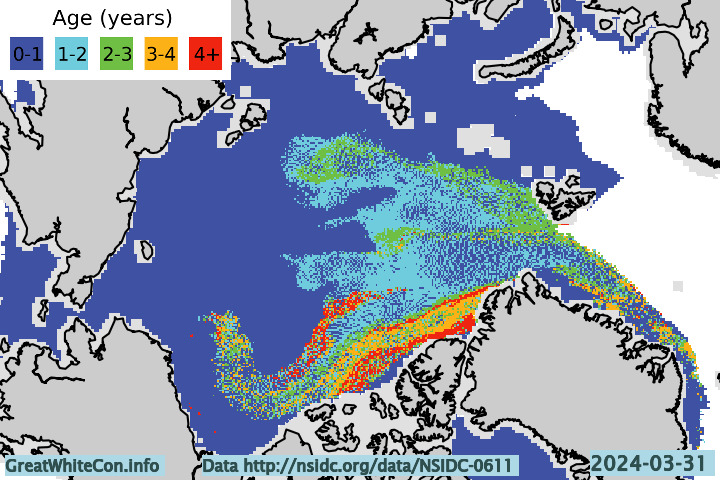
The mid month PIOMAS gridded thickness data has still not been published, but here is the final “near real time” CryoSat-2/SMOS thickness map for the 2024 melting season:
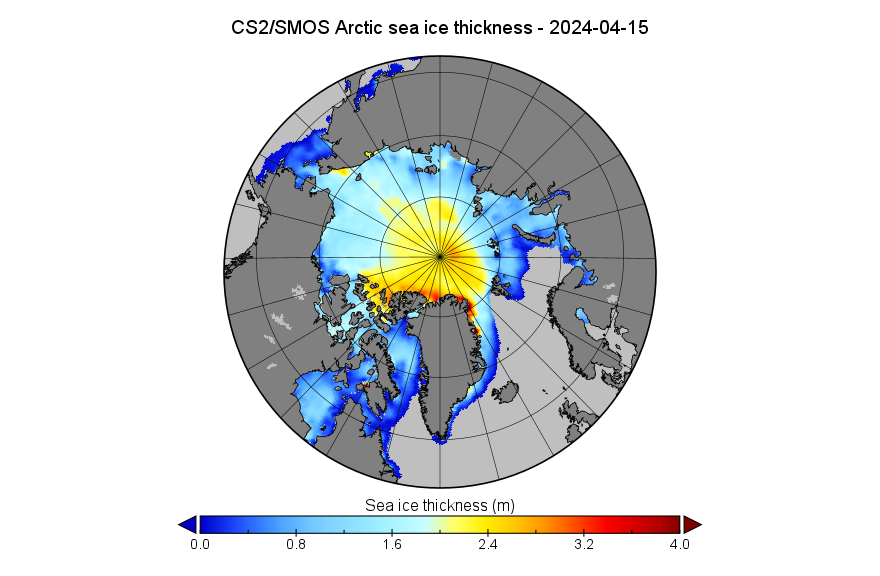
It still shows no sign of the arm of old ice in the Beaufort Sea visible in the sea ice age map above.
The preliminary maximum volume for 2024 is 17.97 thousand km³ on April 5th:
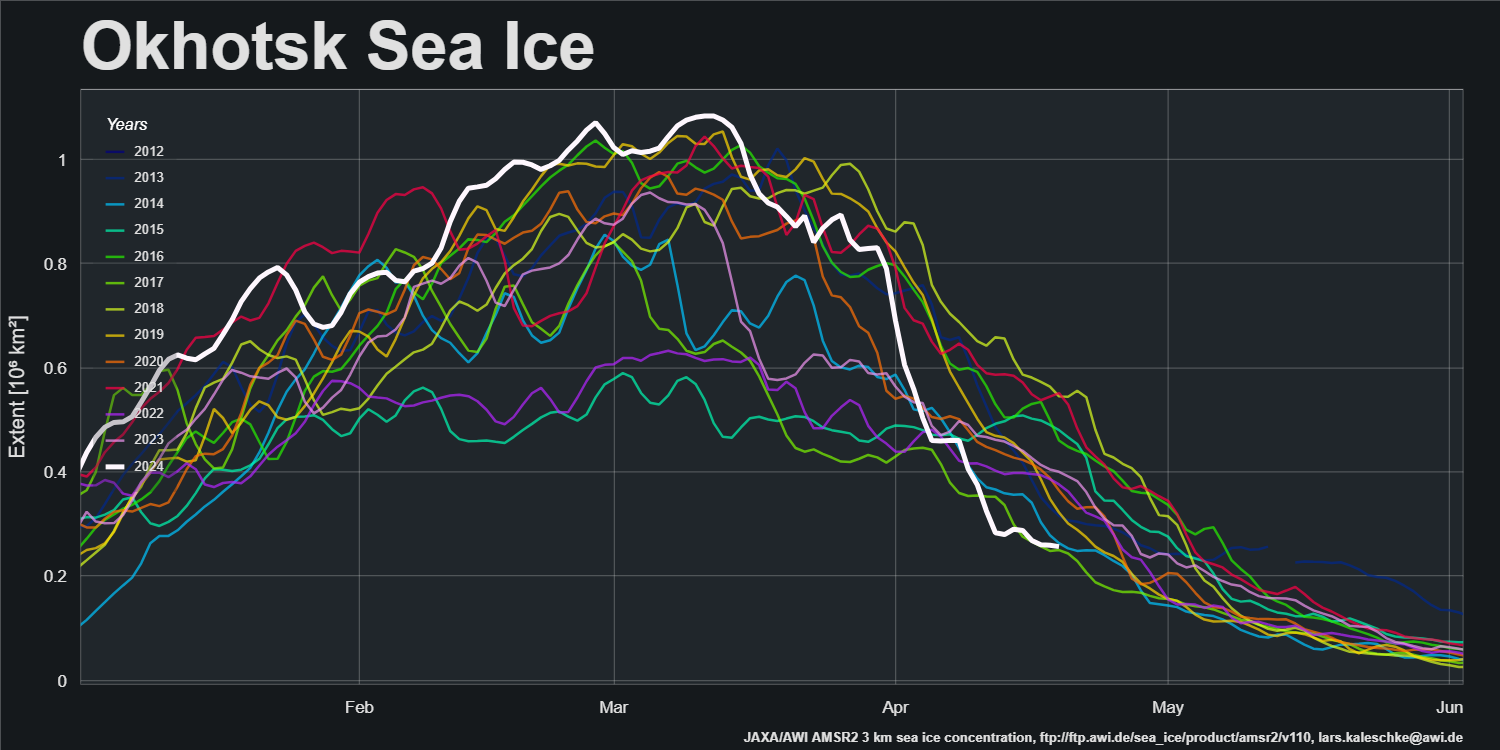
Sea Ice extent in the Sea of Okhotsk has fallen off the proverbial cliff over the last month:
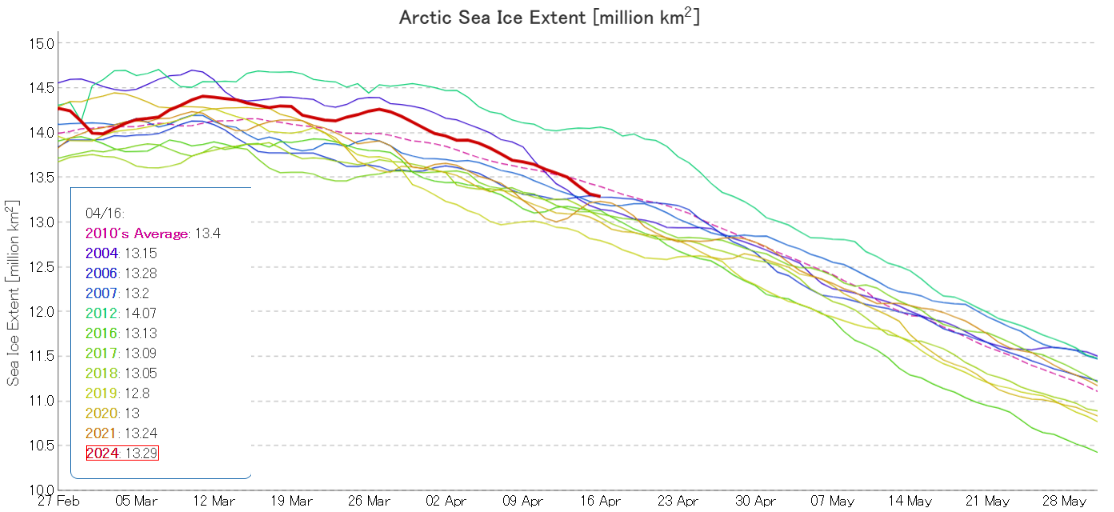
Largely as a consequence, JAXA pan Arctic extent is now below the 2010’s average:
Air temperatures along the Mackenzie valley and over the Beaufort Sea are now above freezing point:
The upper reaches of the Mackenzie River have started to break up:
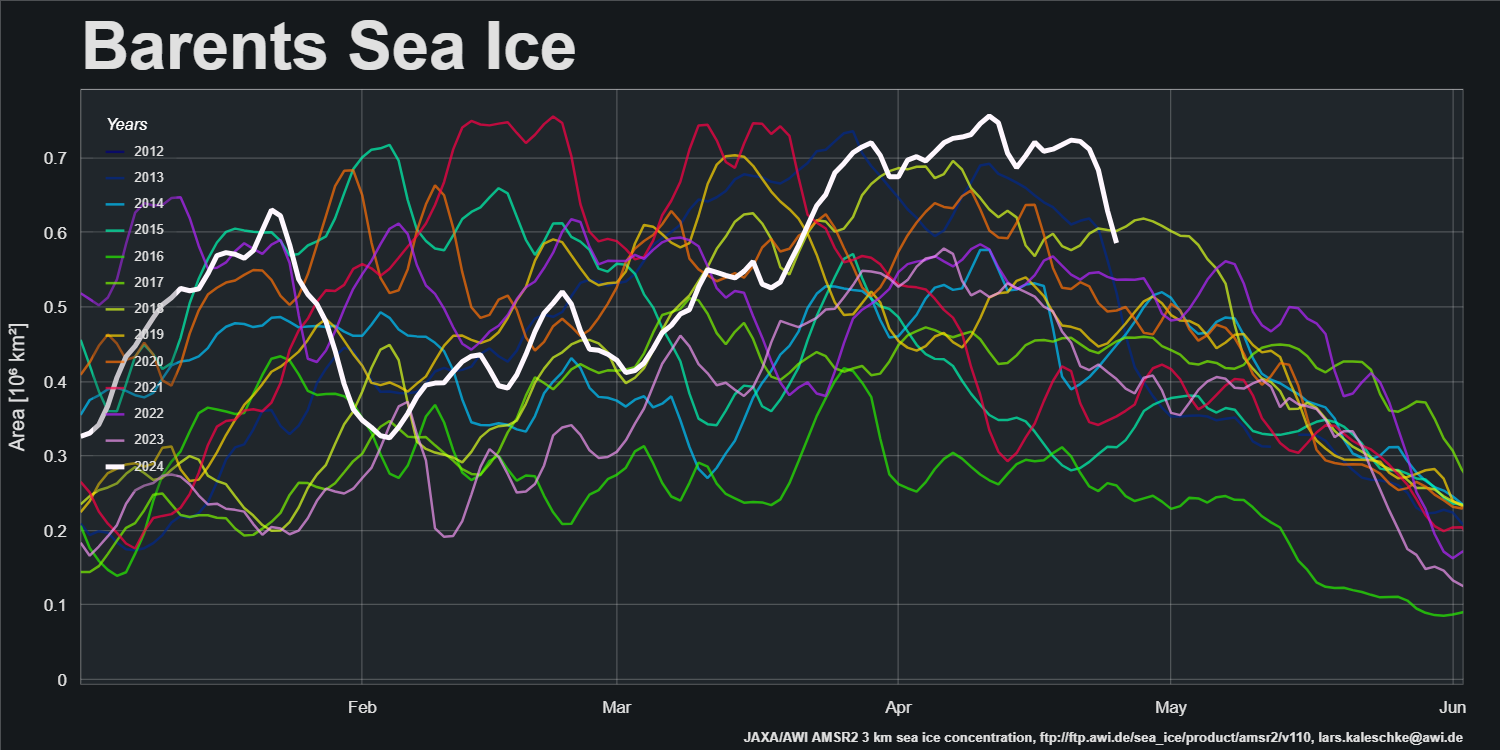
The recent storm on the Atlantic periphery seems to have had some effect on sea ice area, particularly in the Barents Sea:
The conversation continues over on the May open thread.
I note with some interest that the latest news from NSIDC represents another blow to poor professor Wadhams and his failed predictions. In discussing the March average (which was 15th lowest) they reference a recent survey study that concludes: “Using sea ice area, the earliest ice-free conditions in the September monthly average are likely to occur by 2050”. There is no stated definition of ‘ice free’, so I assume they are using the ‘1 Wadham’ standard (I.e. one million square kilometers). After predicting (in 2014) that this event would happen by 2020, the professor took his reward by becoming emeritus. If only our weather forecasters had such a retirement plan…
Lest there be some question about predictions of Area vs Extent, this from the same authors is useful:
“ice-free conditions based on sea ice area occur usually 10 years prior to ice-free conditions based on sea ice extent.”
“Following this formula into the future would suggest a September ice-free Arctic around 2060. This is considering only anthropogenic warming without the contribution of internal variability, excluding any feedbacks for thin ice cover and assuming sea ice loss would continue to accelerate in the future until September ice-free Arctic is reached. Although our approximation for the timing of a September ice-free Arctic is questionable, it is close to the estimate of the CMIP6 multi-model ensemble mean for the high emission scenario (Notz and SIMIP Community 2020).”
“Variability modes of September Arctic sea ice: drivers and their contributions to sea ice trend and extremes” Mehdi Pasha Karami et al 2023 Environ. Res.: Climate 2 025005
So yes that is the time frame that excludes many other feedback variables. A big one is the Ocean Heat Content is accelerating much faster than realized – aka the “heat blobs” newly discovered. There are other factors – the NSIDC published how shocked they were by the arctic sea loss ice before. So no big deal that they are still underestimating our current situation. As http://arctic-news.blogspot.com notes, “this low volume indicates that sea ice is indeed very thin, which must be caused by ocean heat melting sea ice from below, since little or no sunshine is yet reaching the Arctic at the moment and air temperatures are still far below freezing point, so where ocean heat may be melting sea ice away from below, a thin layer of ice will quickly be reestablished at the surface. “
“The Arctic could see summer days with practically no sea ice as early as the next couple of years, according to a new study out of the University of Colorado Boulder.
The findings, published March 5 in the journal Nature Reviews Earth & Environment, suggest that the first ice-free day in the Arctic could occur over 10 years earlier than previous projections, which focused on when the region would be ice-free for a month or more. The trend remains consistent under all future emission scenarios.”
Arctic could become ‘ice-free’ within a decade
Date:
March 5, 2024
Source:
University of Colorado at Boulder
You seem to have forgotten that we started discussion of that review paper last month?
https://GreatWhiteCon.info/2024/03/facts-about-the-arctic-in-march-2024/#Mar-10
The paper states that:
None of the 141 references include Prof. Wadhams amongst the authors.
A quick update on The Nenana Ice Classic
Ice thickness was 50.5 inches. on April this year 4 (Will it beat the record?)
On the record high in 2013 the ice thickness was 50.3 on April 15 (Breakout date was May 20)
http://www.nenanaakiceclassic.com/ (Scroll down for web cam)
The Nenana tripod is gone!!
So it has!
Presumably this is the official announcement?
Has anyone here got lucky?
Here is a an Arctic fact. Linear trend of SII average ice extent is virtually constant from 2014 and Arctic volume with all the data showing nearly the same.
But dear old Jim never shows all 12 months extent, just sIngle months when it agrees with his preconceptions.
[Repetitive & ad hominem remarks redacted – Mod]
At the risk of repeating myself, I suggest that instead of repeating yourself ad nauseam you answer this question:
https://GreatWhiteCon.info/2024/03/facts-about-the-arctic-in-march-2024/#comment-742940
Here is a cherry picked portion of your March ice extent showing an upward trend from 2006 it if course this is off message! lol!
[Repetition redacted – Mod]
Anyway, no hard feelings, I realise that to admit that arctic ice is cyclic and plateaus 15 years ago would make you feel like a bit of a dill and that’s not good for the old ego.
Cheers
Is that your answer to my question?
Eyeballing a “cherry picked” extent graph proves that “arctic ice is cyclic”?
What do your eyes see if they glance at the DMI volume graph above?
Ah, Peter, how do you explain that blue line?
Hi Jim,
PIOMAS annual sea ice volume seems to suggest a pause in the ice volume since 2010
[Embedded image – Mod]
I would characterise it as a “slowdown” rather than a “pause” Neil. Let’s wait and see what the 2024 mean volume looks like.
I keep on asking people what they think the significance of this is, but I never seem to receive an answer.
By way of example, I recently endeavoured to educate the young “skeptical” pretender Chris Martz on such matters:
https://GreatWhiteCon.info/2024/04/chris-martz-shouldve-gone-to-specsavers/
For some strange reason he hasn’t responded to “Snow White’s” helpful Xweets yet.
Even the EU climate site says that Arctic ice has not shrunk since 2007.
No it doesn’t Peter.
Your screenshot says “In the Arctic, sea ice extent has declined markedly since 1979, although the trend has levelled off since 2007.”
Further down the page “the EU climate site” says:
At the risk of repeating myself, repeating myself, please see:
https://GreatWhiteCon.info/2024/04/facts-about-the-arctic-in-april-2024/#comment-743448