Tag Archives: Laptev Sea

Facts About the Arctic in October 2025

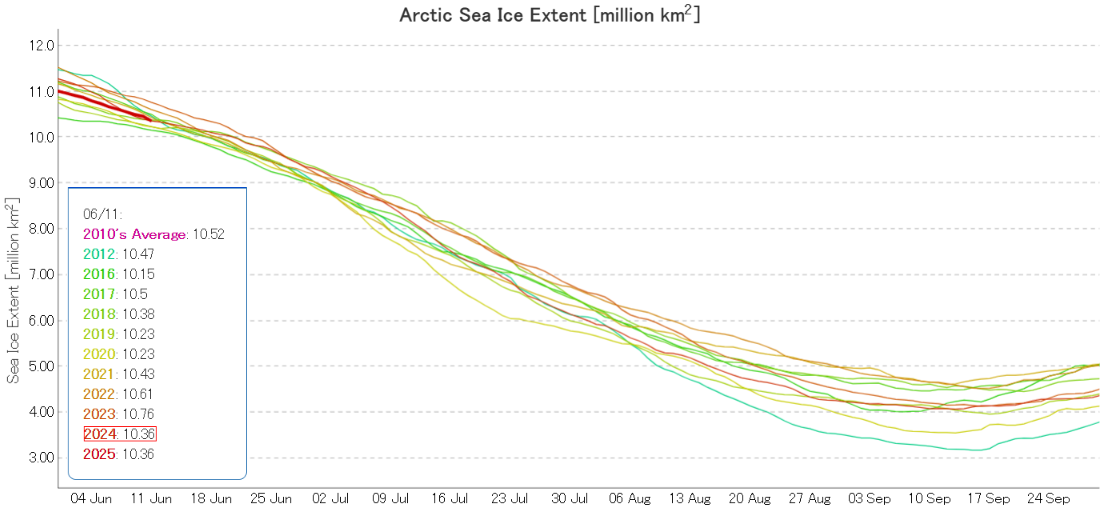
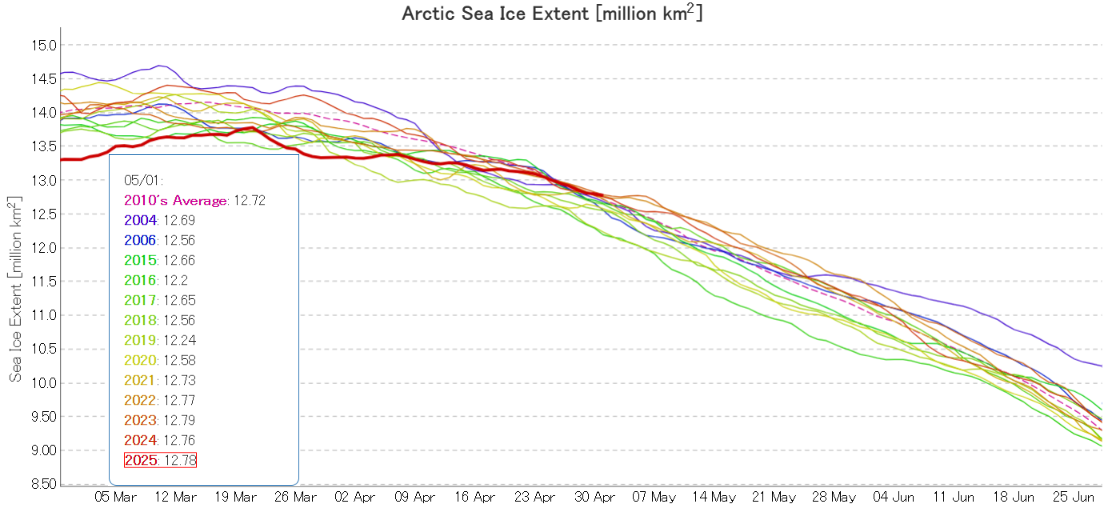
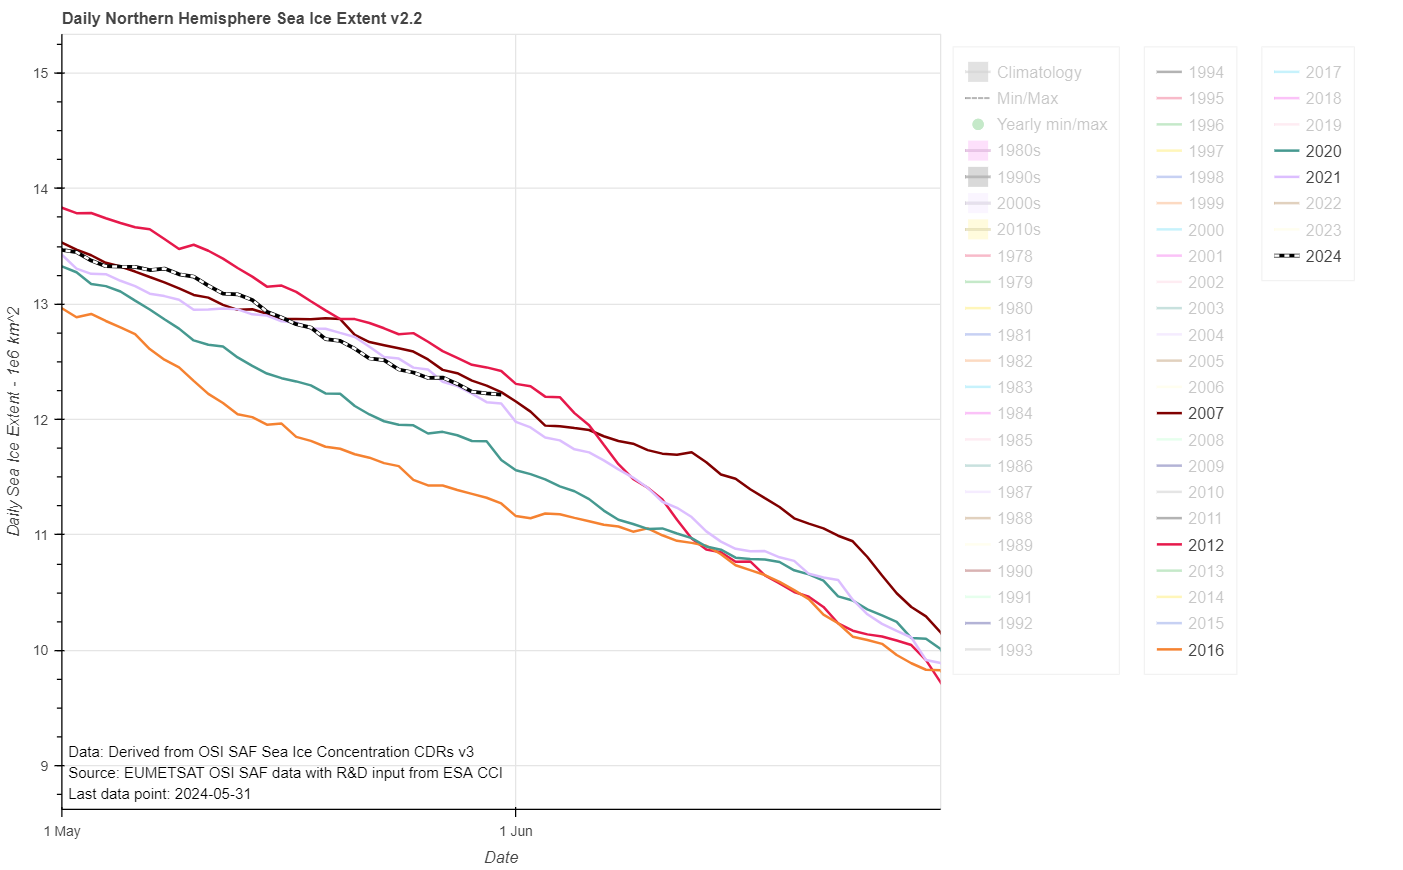
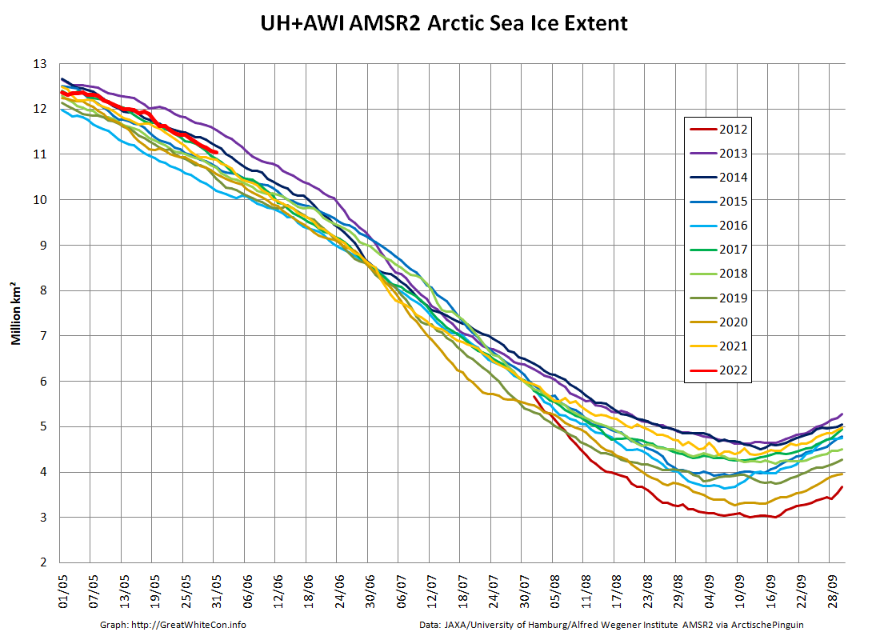
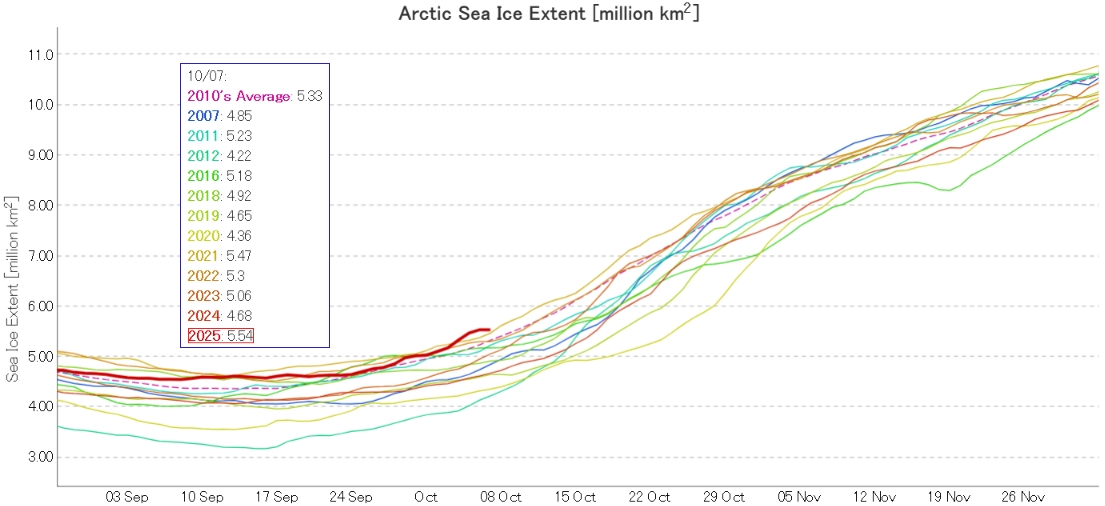
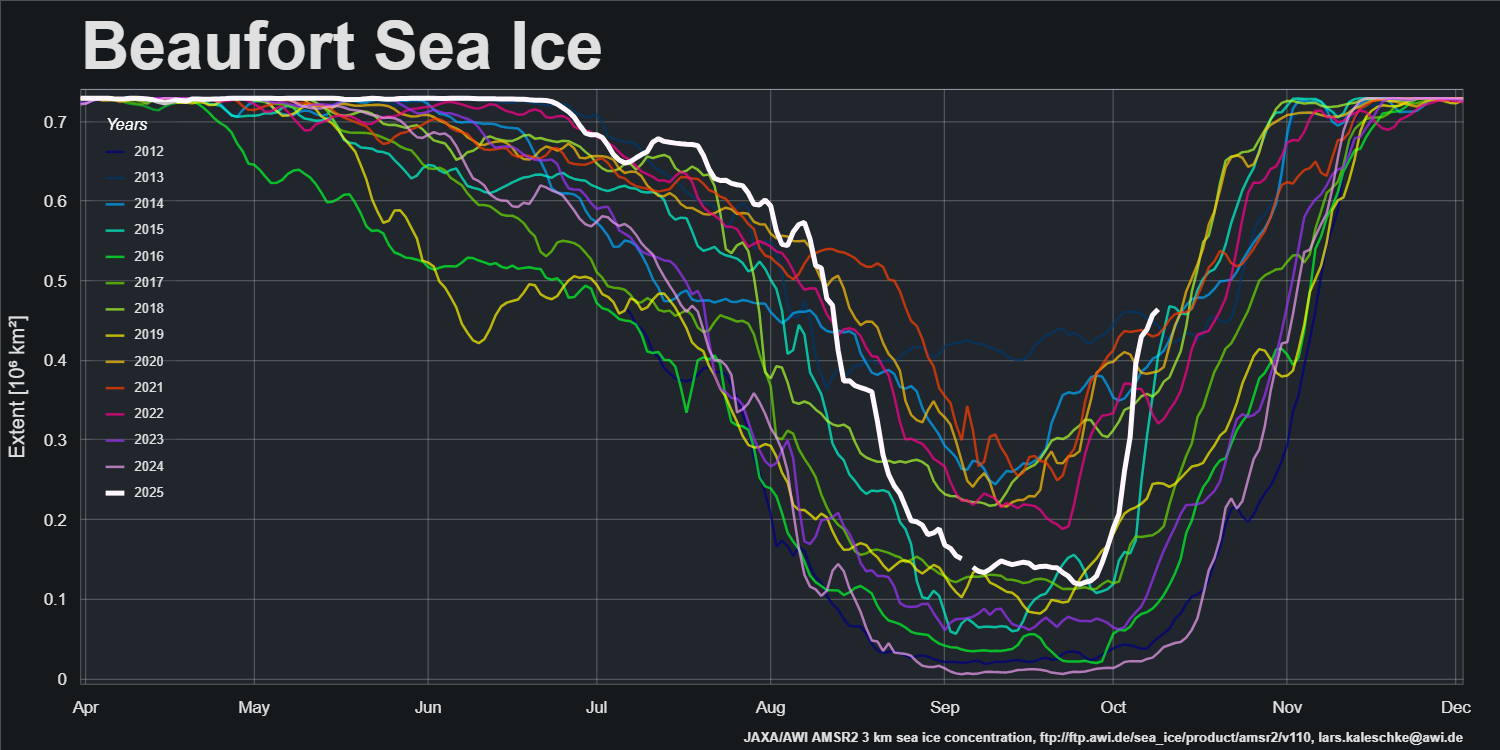
I was hoping that the September PIOMAS gridded thickness data would have been published by now, but no such luck. Reverting to JAXA/ViSHOP extent, after flatlining for most of September the refreeze has started in earnest over the last two weeks. Extent is currently 12th lowest in the satellite era:

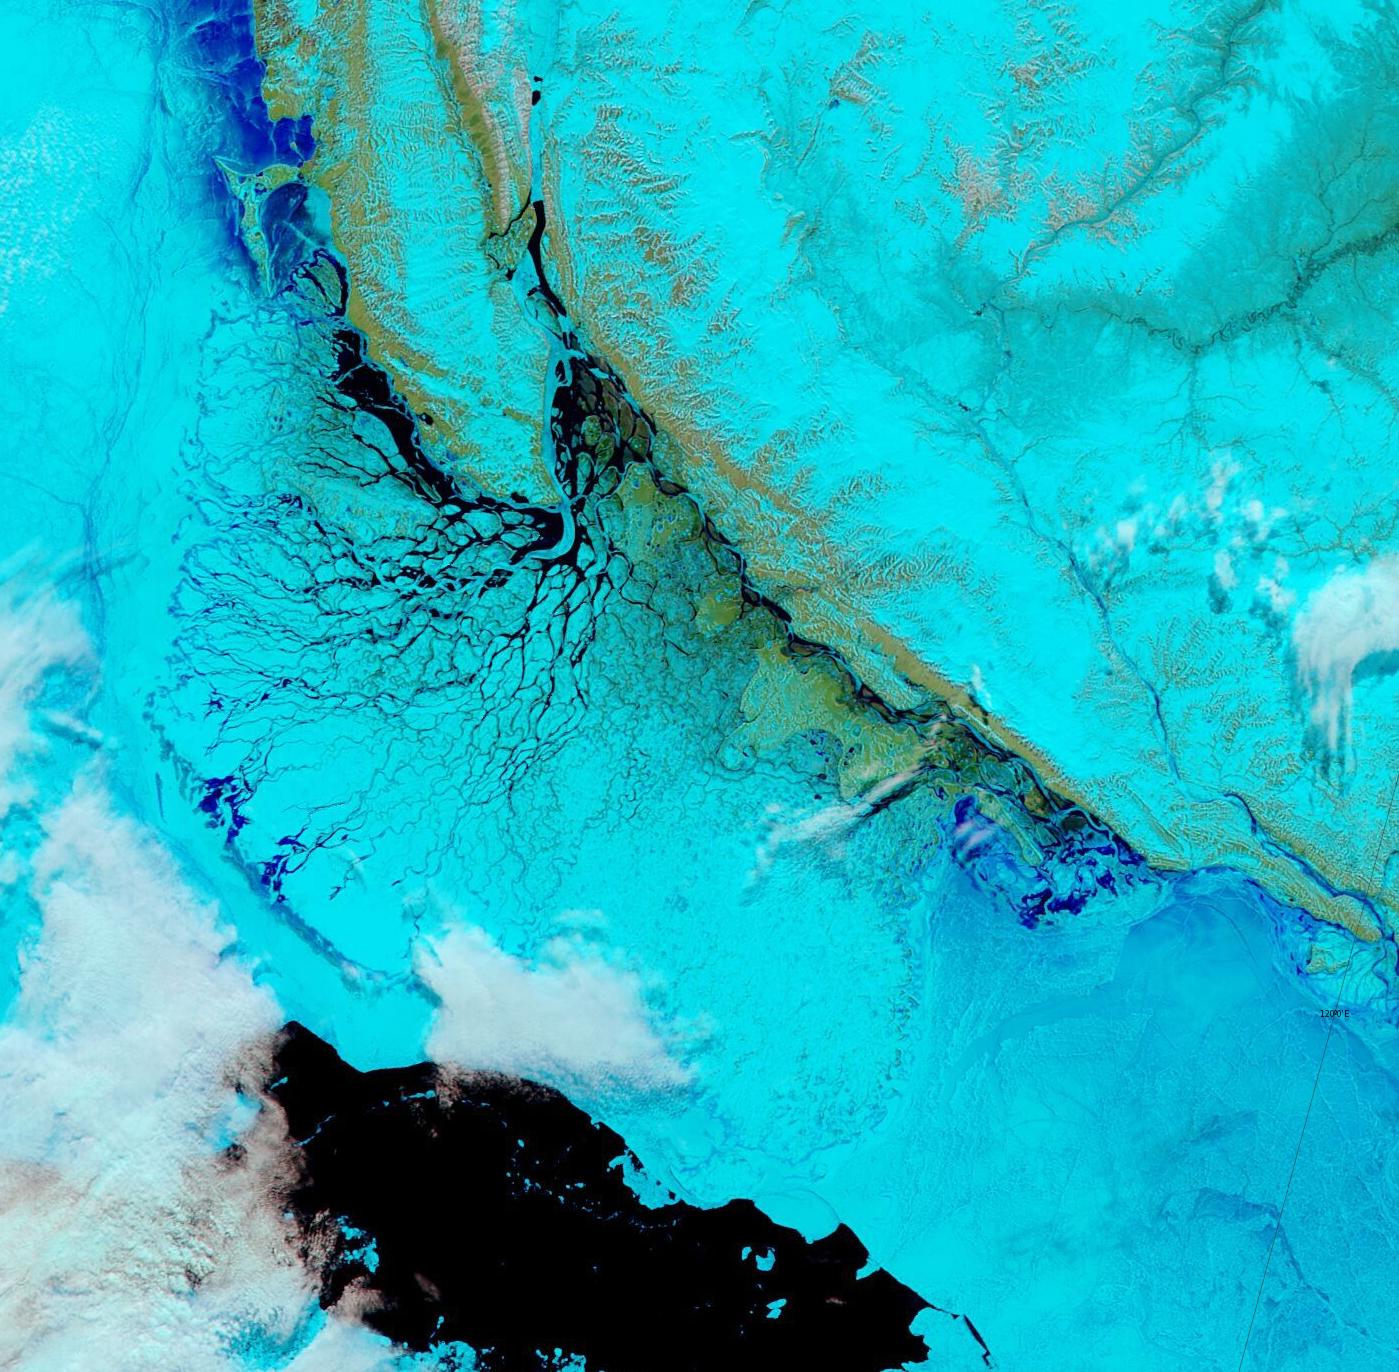
The latest sea ice concentration map from Lars Kaleschke of the Alfred Wegener Institute, based on AMSR2 data, reveals plenty of new ice in the Beaufort Sea, plus a bit more to the north of the Laptev Sea:

The latest sea ice “stage of development” charts from the Canadian Ice Service confirm that, and reveal more new ice that has yet to show up in the AMSR2 data:

[Update – October 11th]

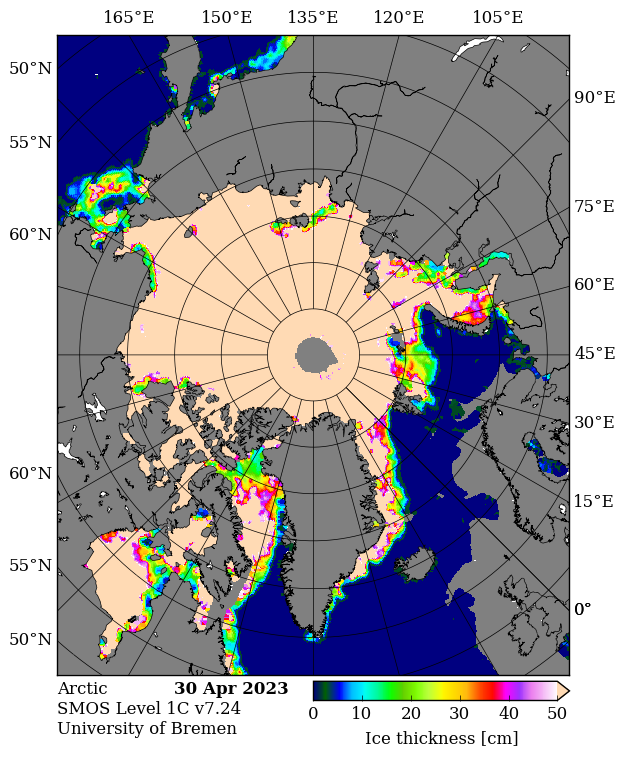
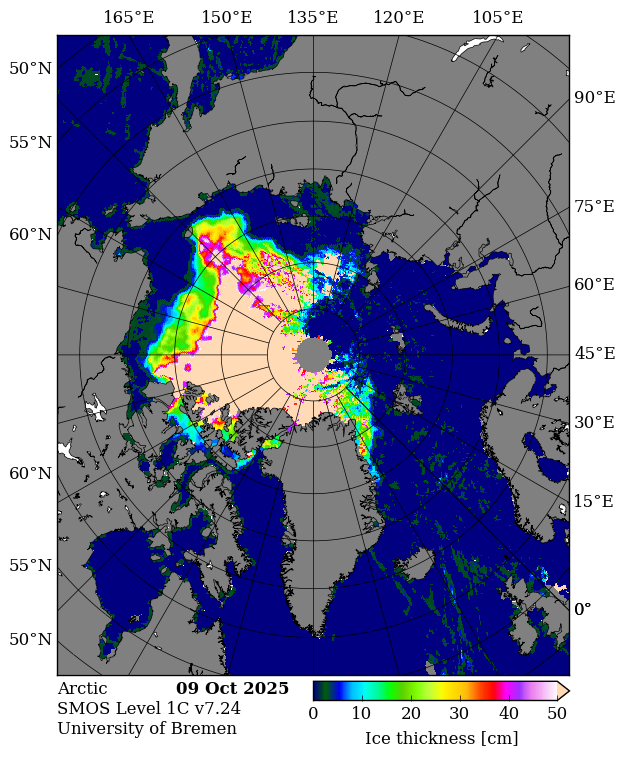
In the continuing absence of PIOMAS gridded thickness data (see below), here’s the latest SMOS/SMAP “thin ice thickness” map:

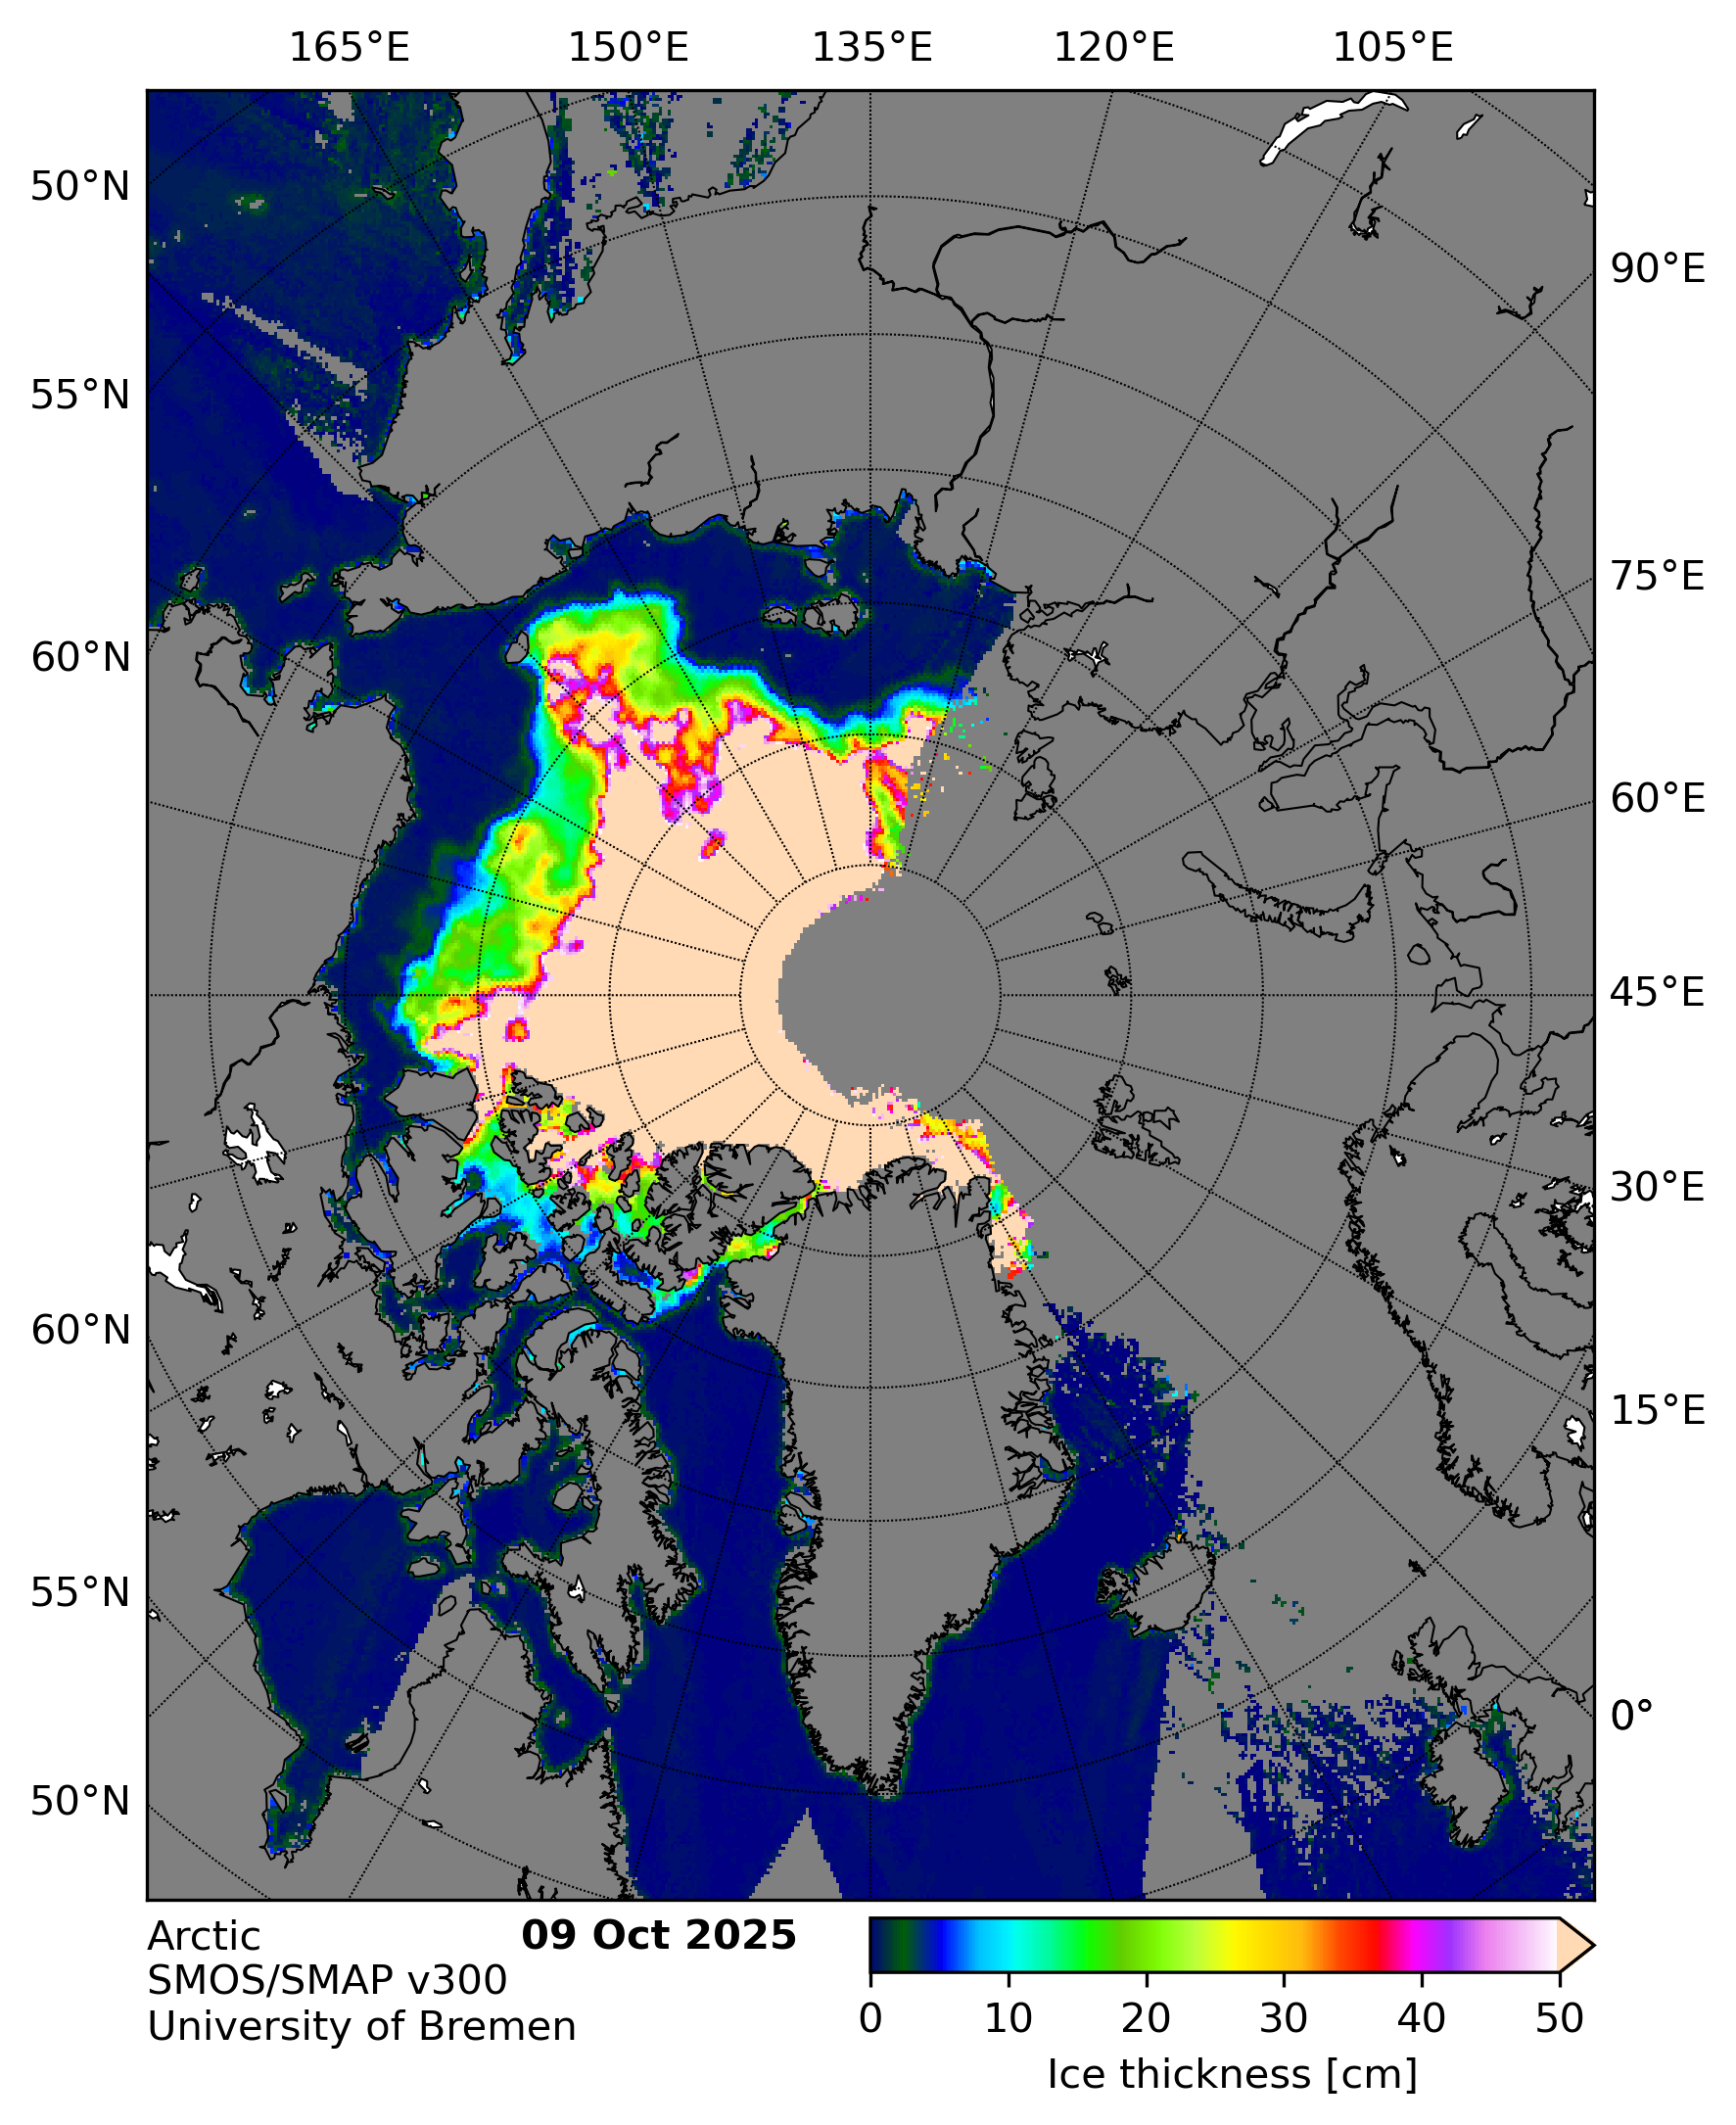
It appears to be badly affected by radio frequency interference on the Atlantic side of the Arctic. Here’s the raw SMOS map:

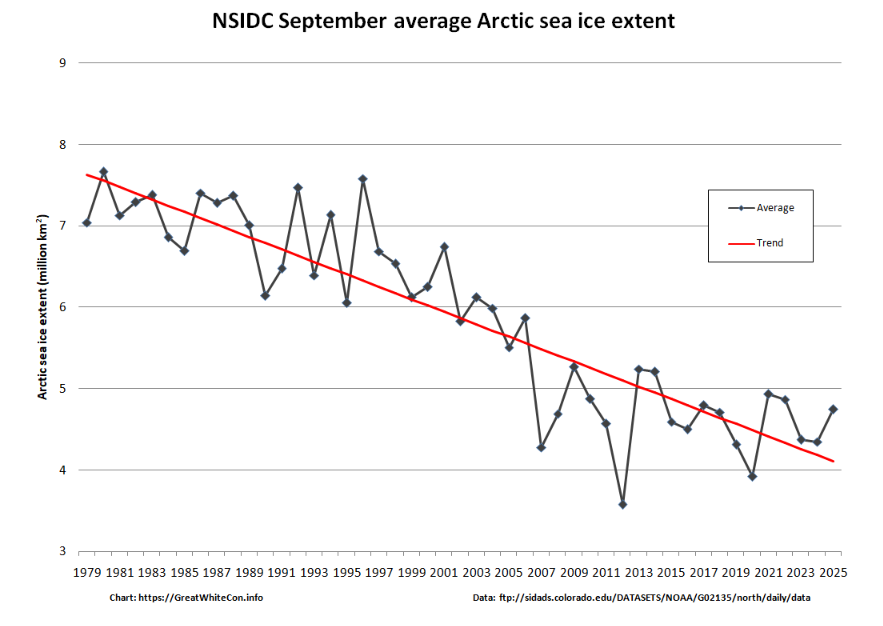
Further to a previous conversation on the subject, here’s the final NSIDC annual average extent graph for September:

As anticipated, 2025 annual average extent has proved to be the lowest in the satellite era.

[Update – October 16th]

I was hoping that the September edition of the NSIDC’s “Sea Ice Today” analysis would have been published by now, but no such luck. Here’s the latest data announcement from the NSIDC:

Effective October 15, 2025, due to non-renewed funding, NSIDC has suspended or reduced several Sea Ice Today tools and services.

Discontinued:

  • New monthly and mid-month analysis posts
  • Sea ice analysis tool
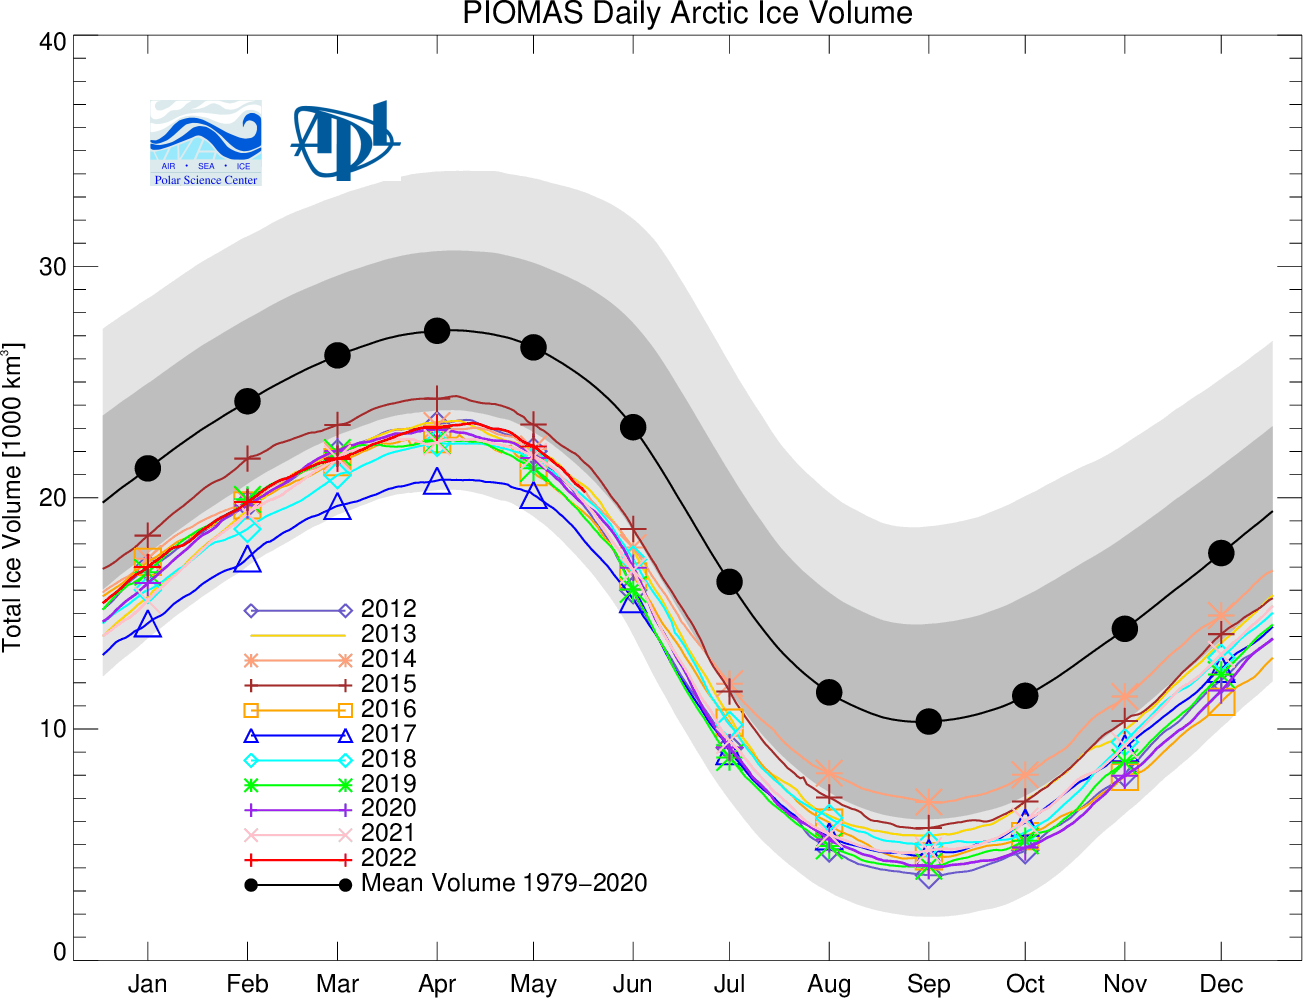
  • Sea Ice Volume
  • Sea ice extent spatial comparison tool 

Persisting:

Previously-published Sea Ice Today analysis posts will remain online. The discontinued Sea Ice Today products will no longer update or be maintained, and will be removed in the next several weeks.

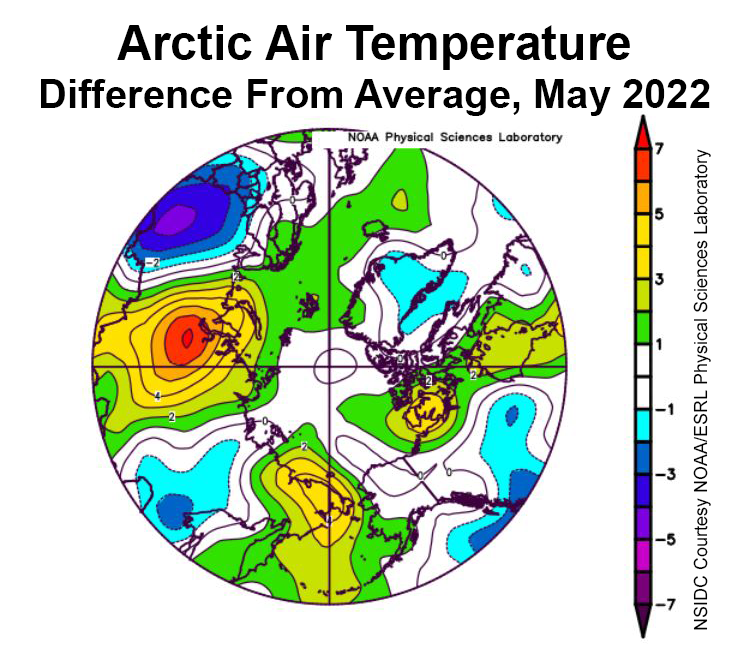
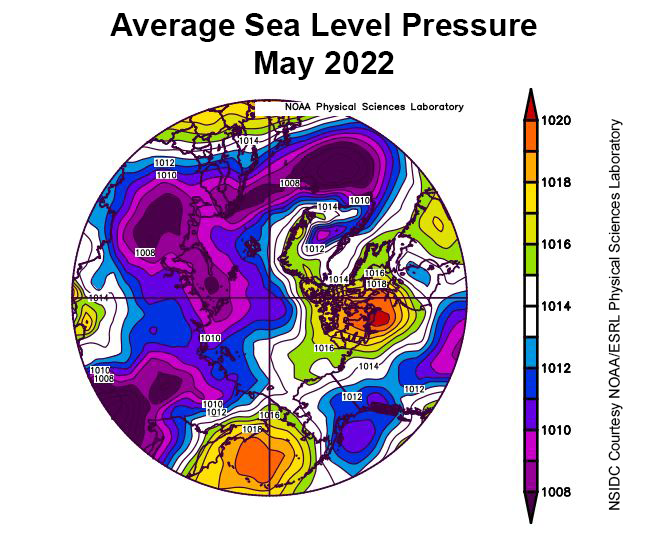
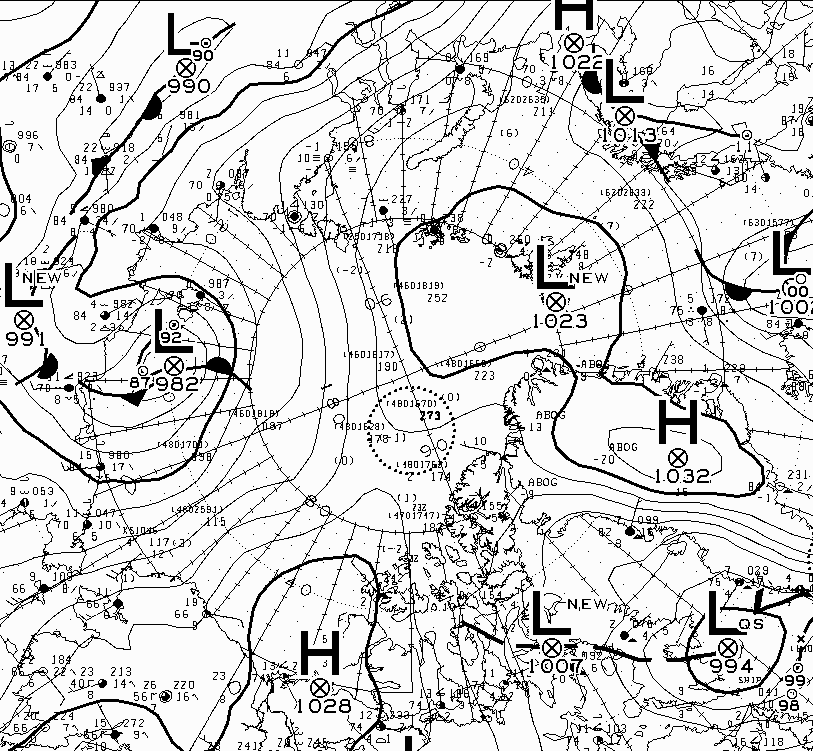
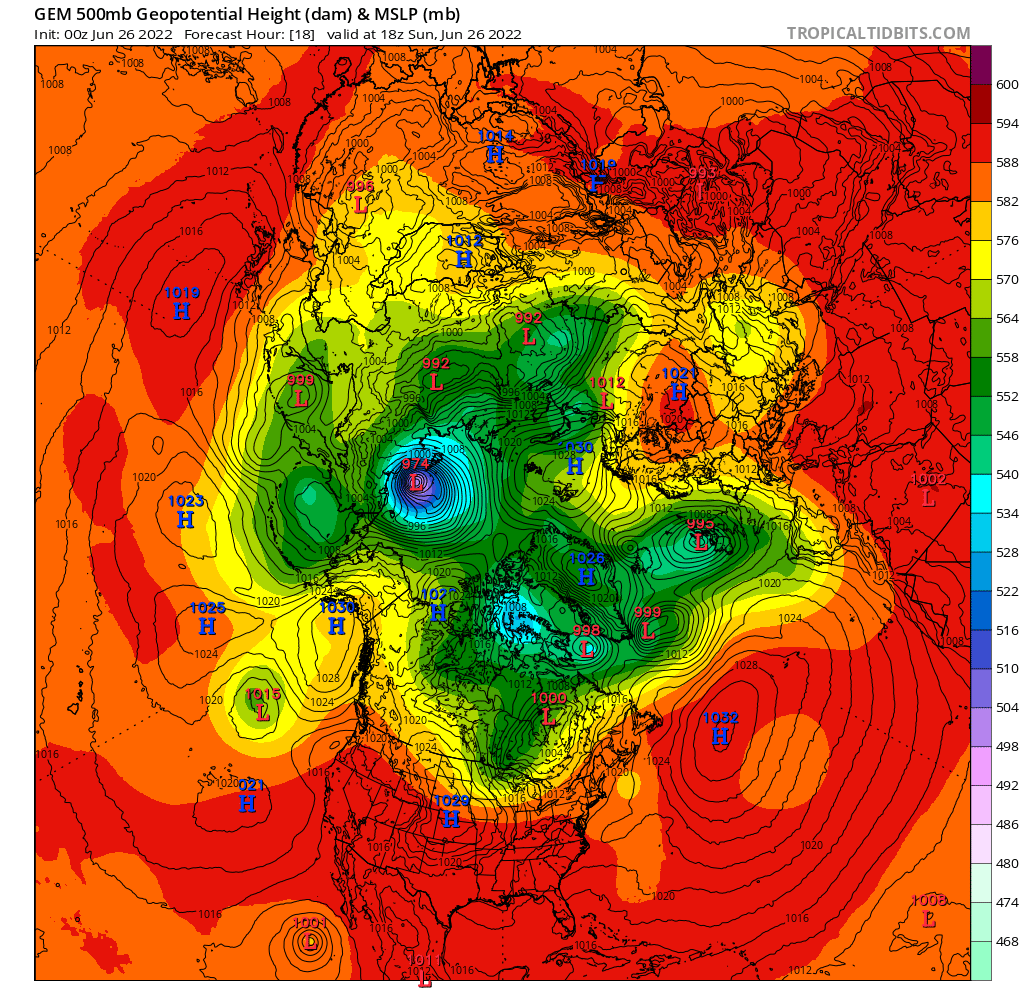
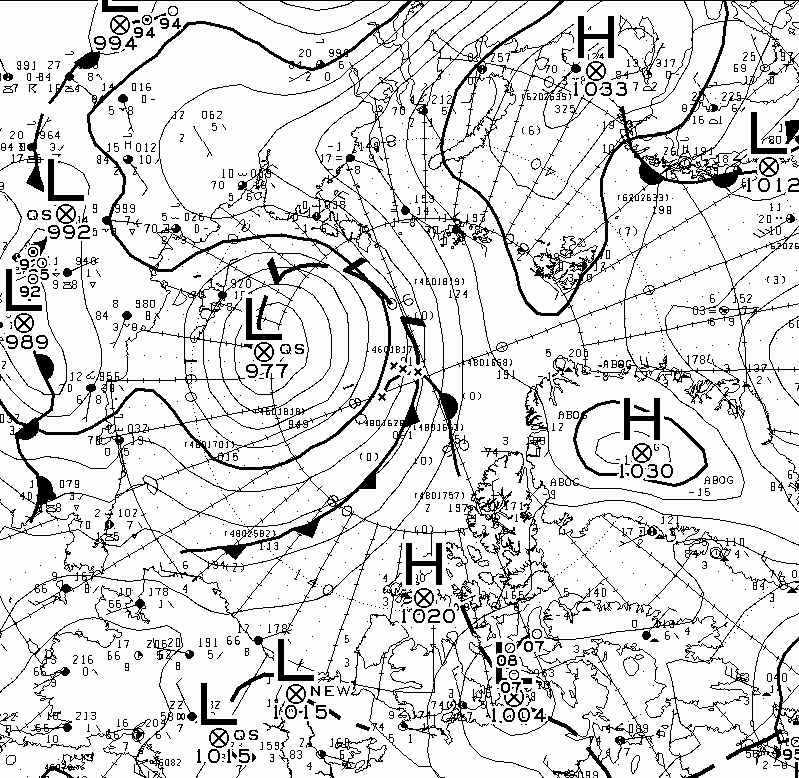
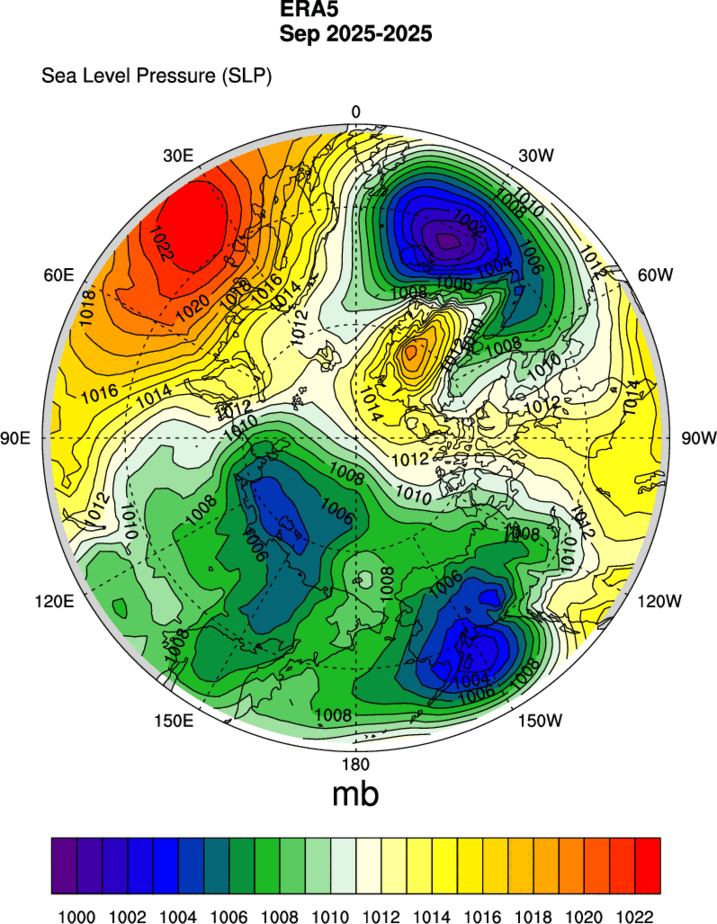
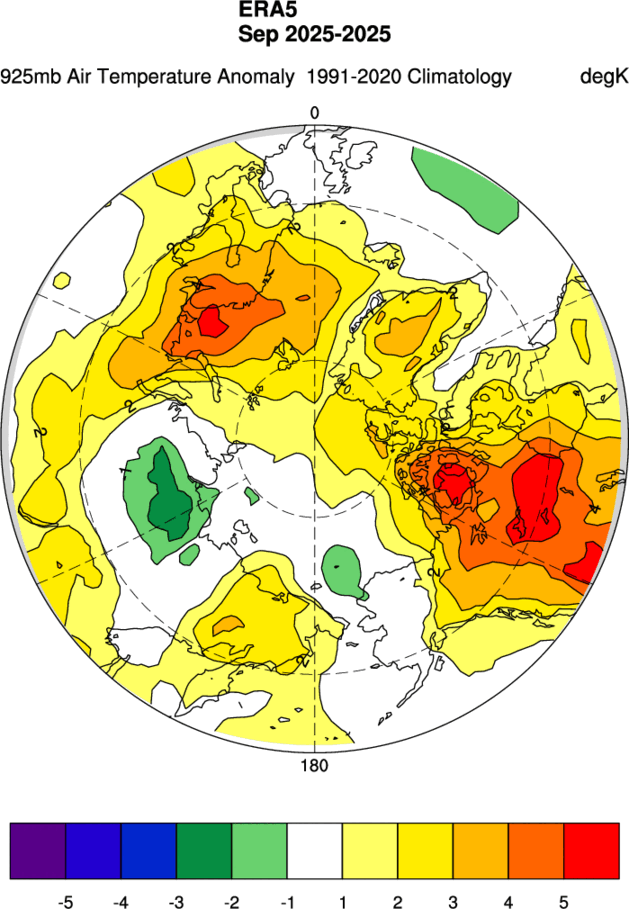
In Sea Ice Today’s absence, here’s the MSLP and 925 hPa temperature maps for September, usually contained in the monthly analysis articles:

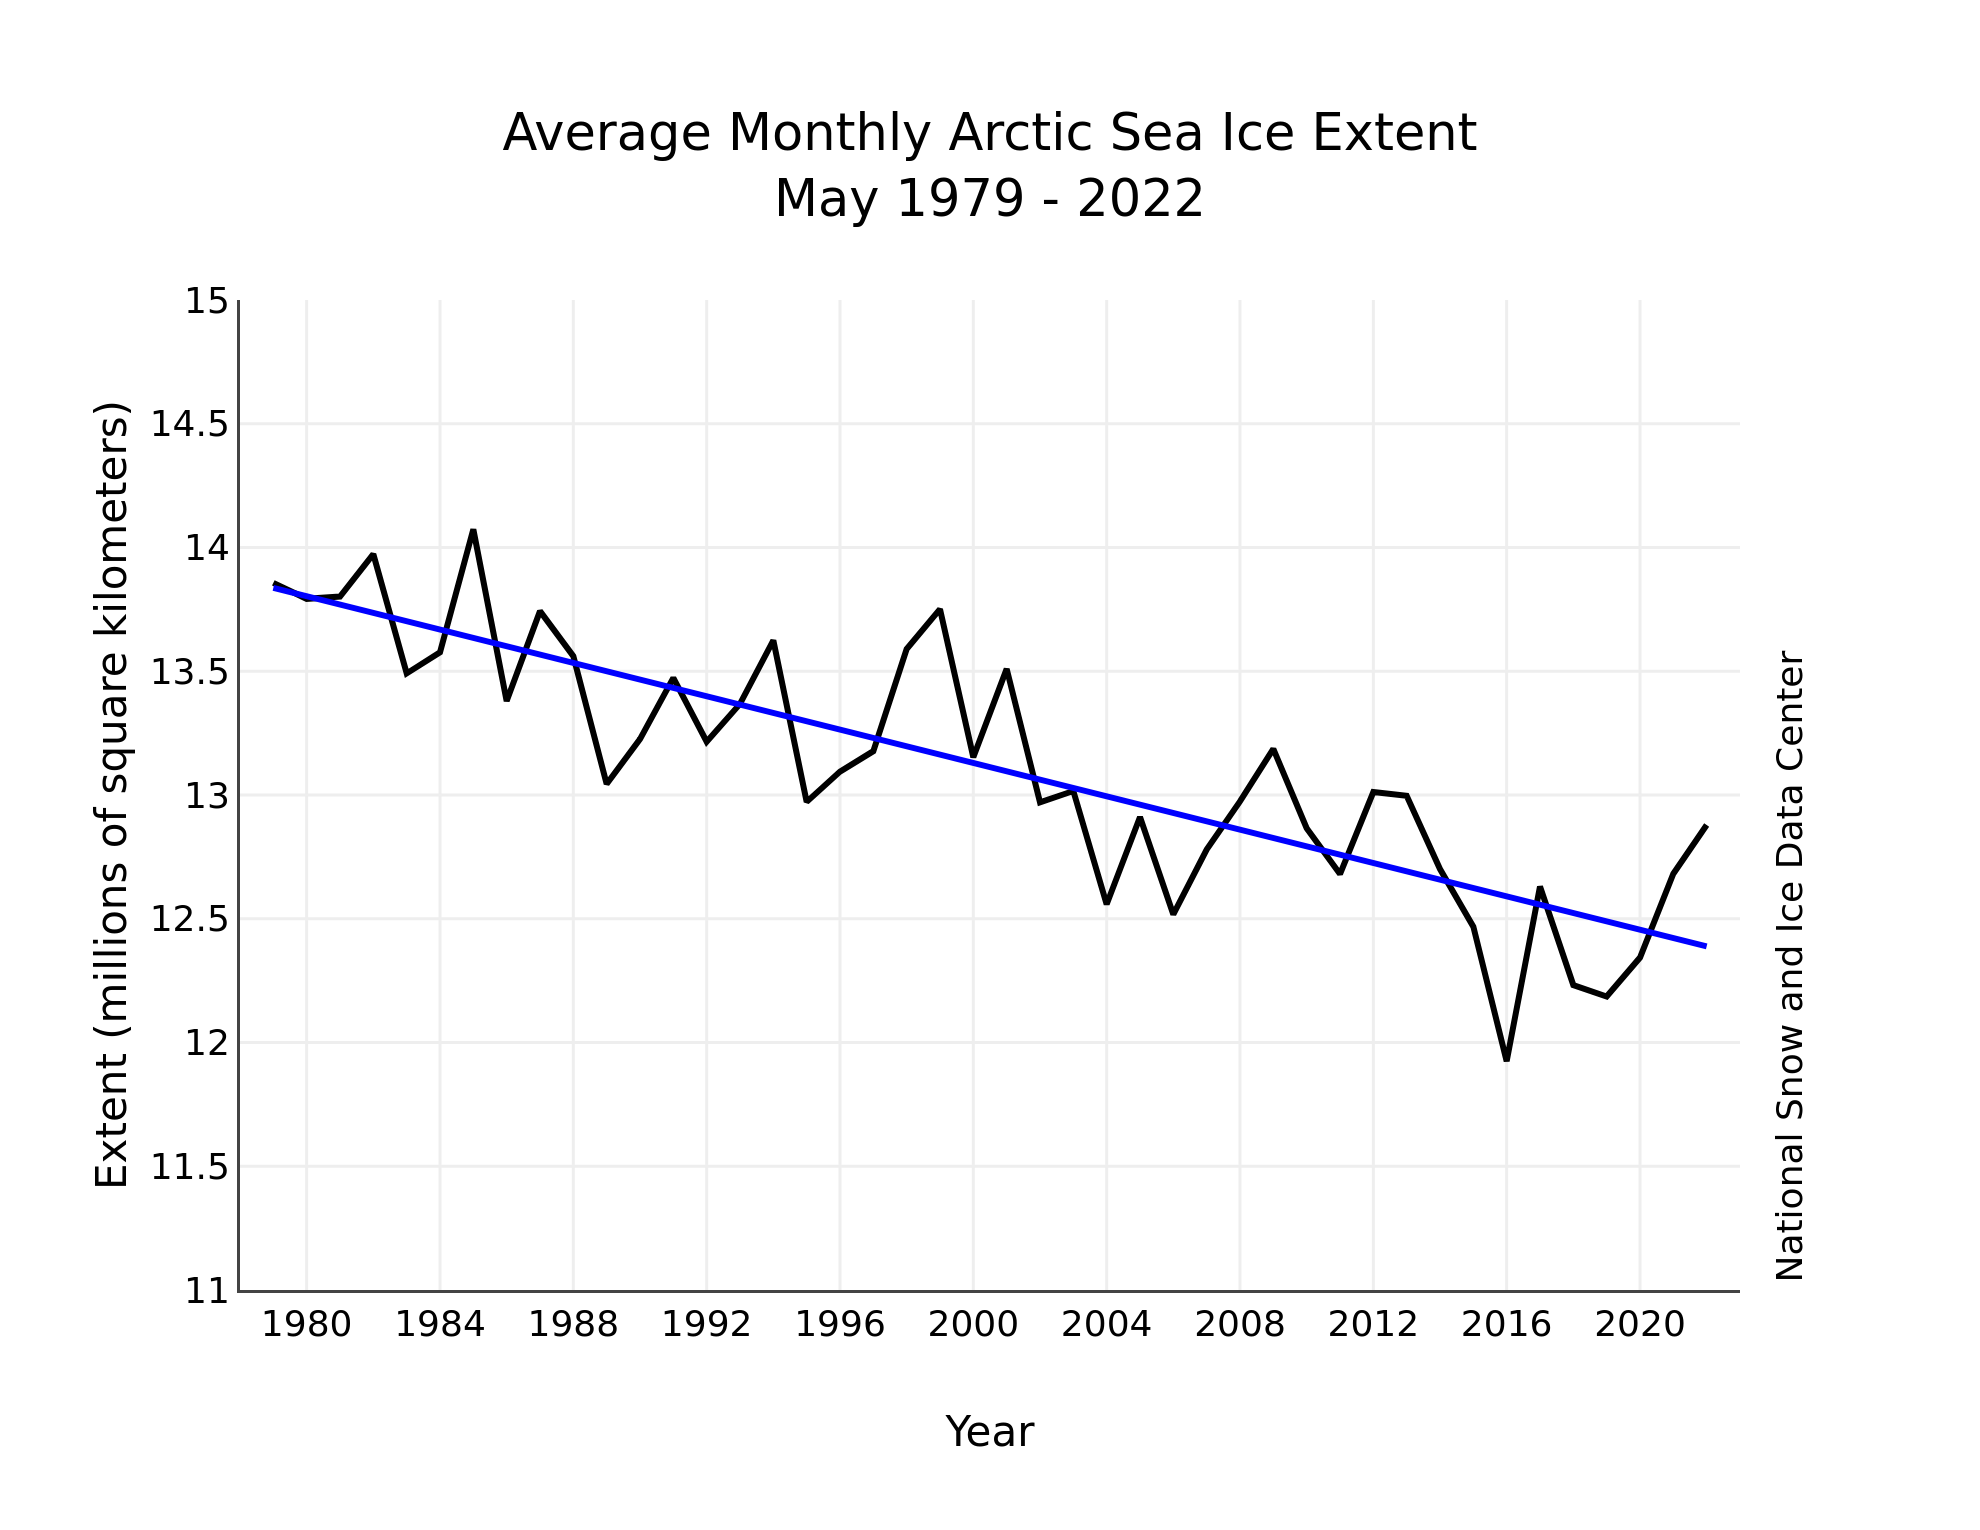
Plus a hastily constructed graph of the monthly average extent for September:

[Update – October 23rd]

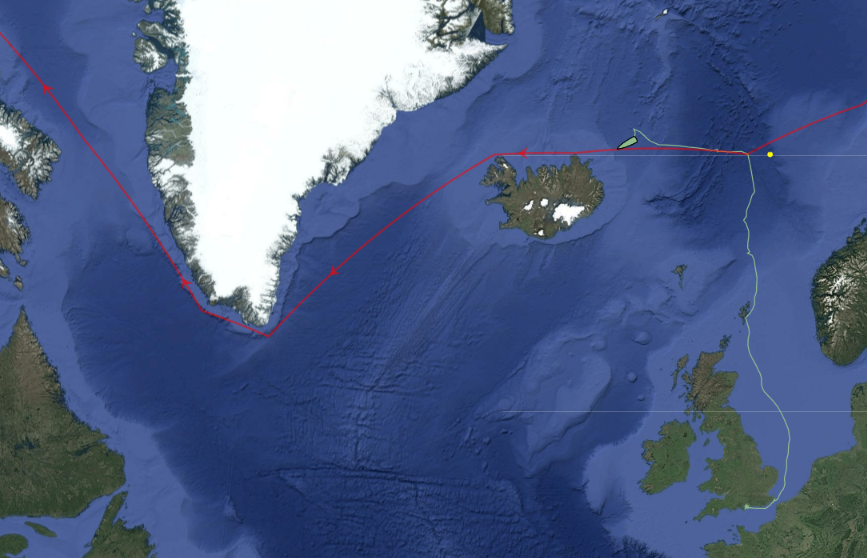
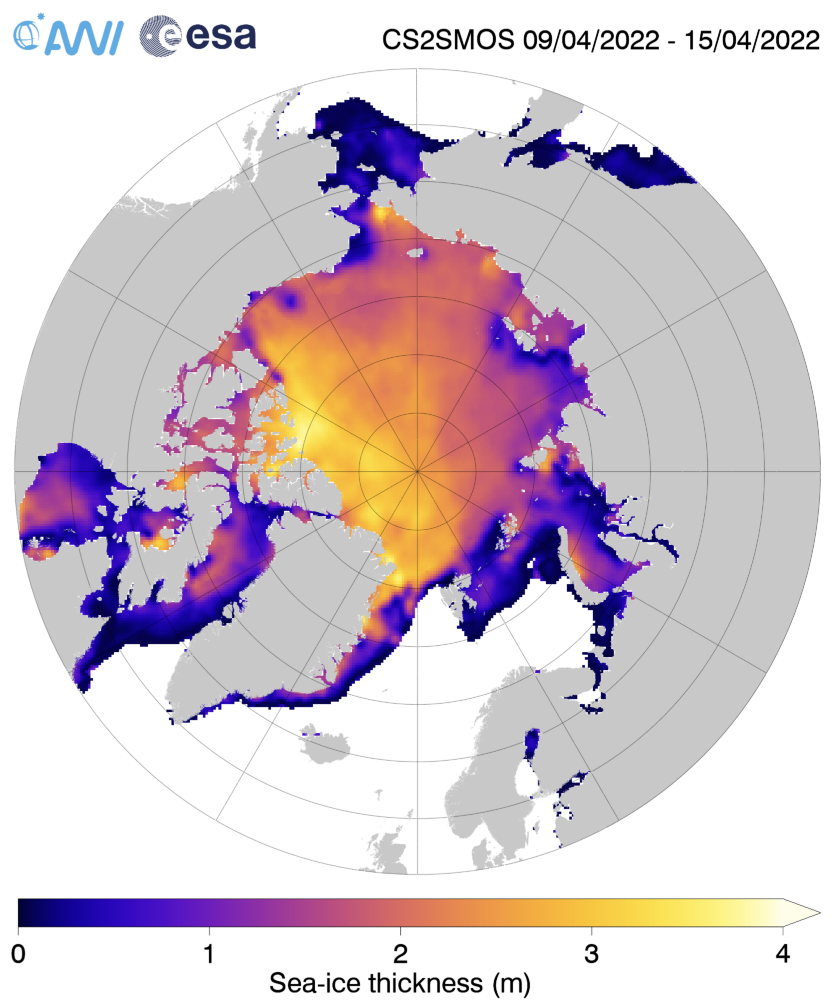
The Alfred Wegener Institute has published the first CryoSat-2/Sentinel 3/SMOS merged Arctic sea ice thickness data of Autumn 2025:

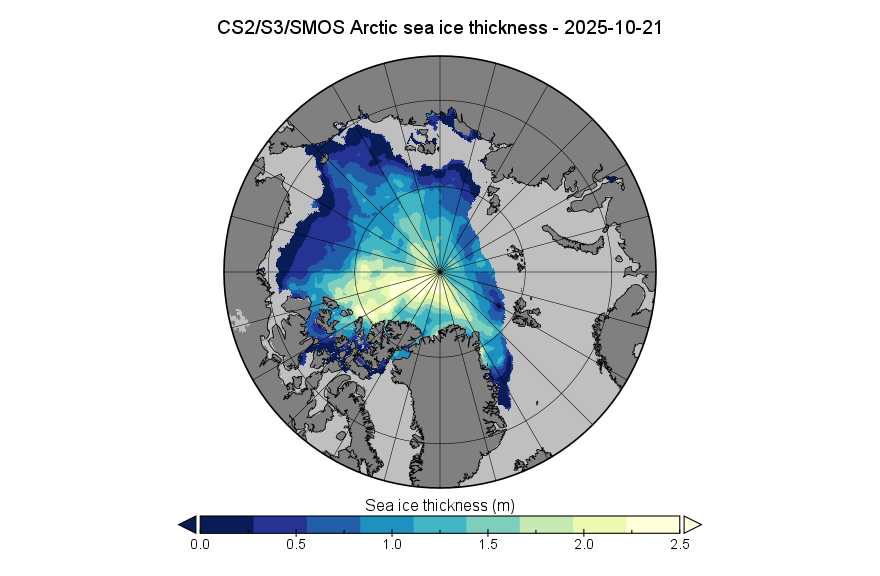
The Arctic sea ice volume derived therefrom is 5.43 thousand km³. The data is accompanied by the following “Product Degradation Warning”:

SMOS input data continues to be affected by persistent and frequent radio-frequency interference (RFI) in the Barents, Kara, and Laptev Seas, resulting in missing thin ice thickness measurements. Consequently, sea ice thickness estimates for this region in the product will rely exclusively on radar altimeter data, which may lead to higher reported values than would have been obtained using SMOS.

[Update – October 27th]

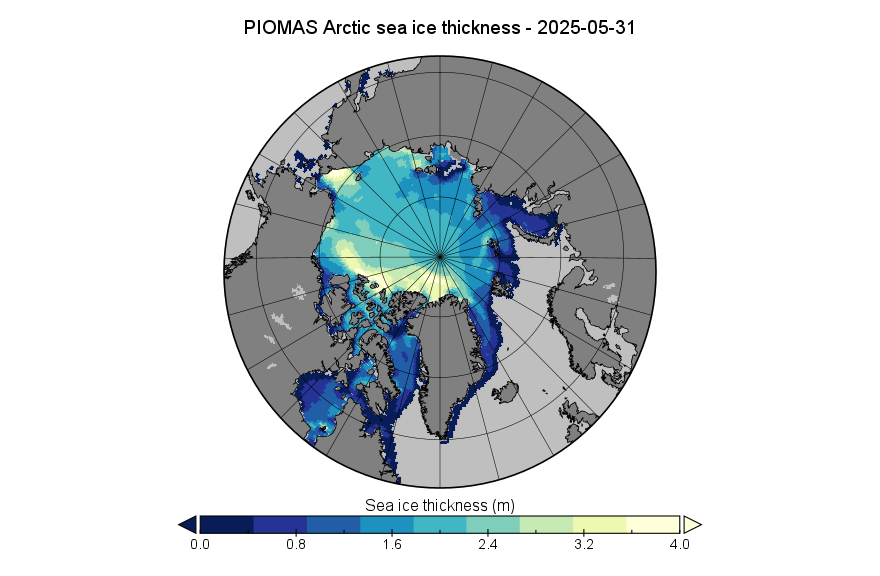
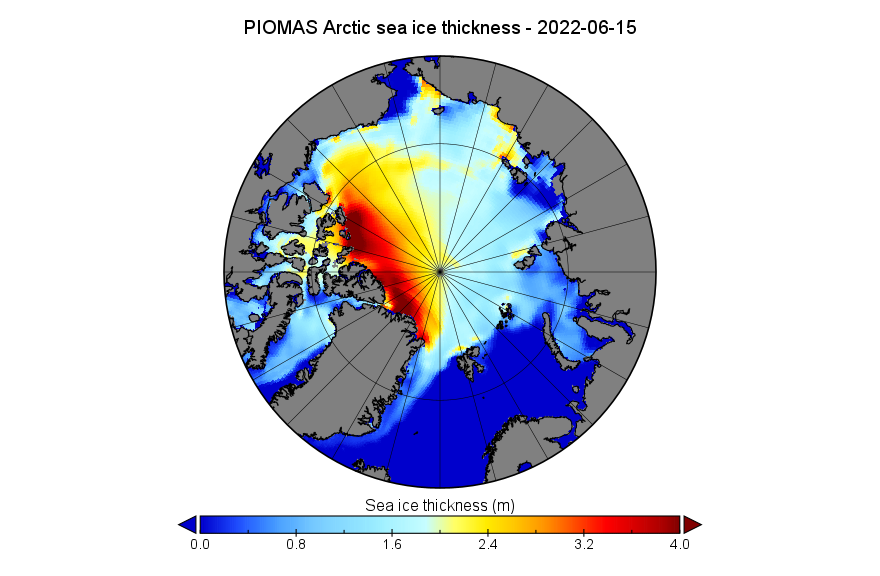
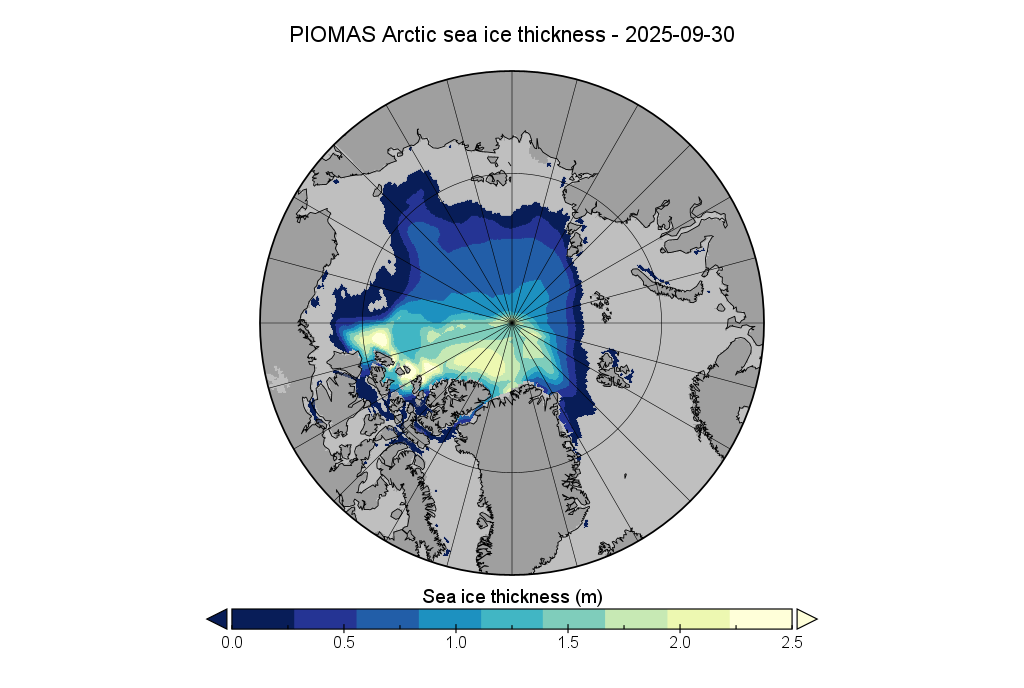
The PIOMAS gridded thickness data for September 2025 has been belatedly released:

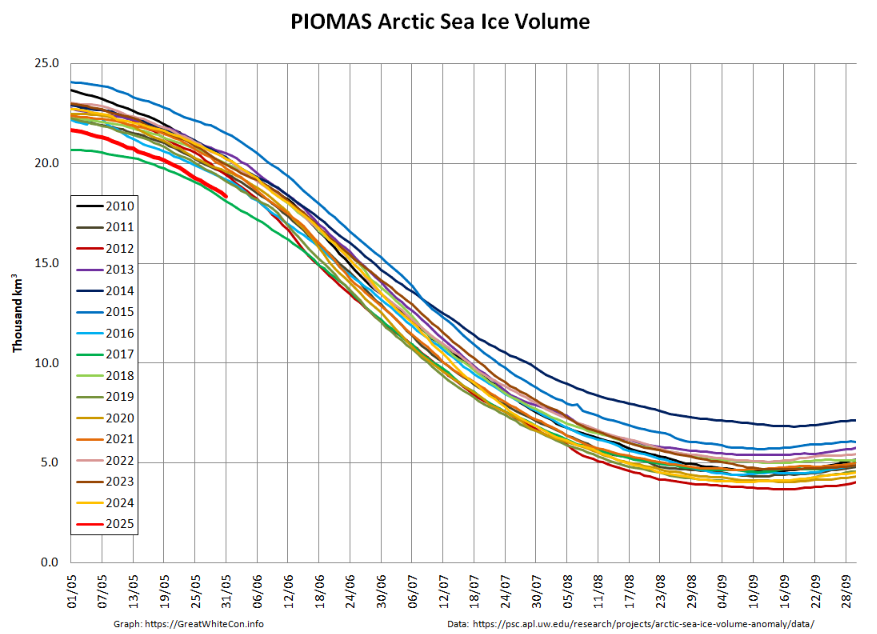
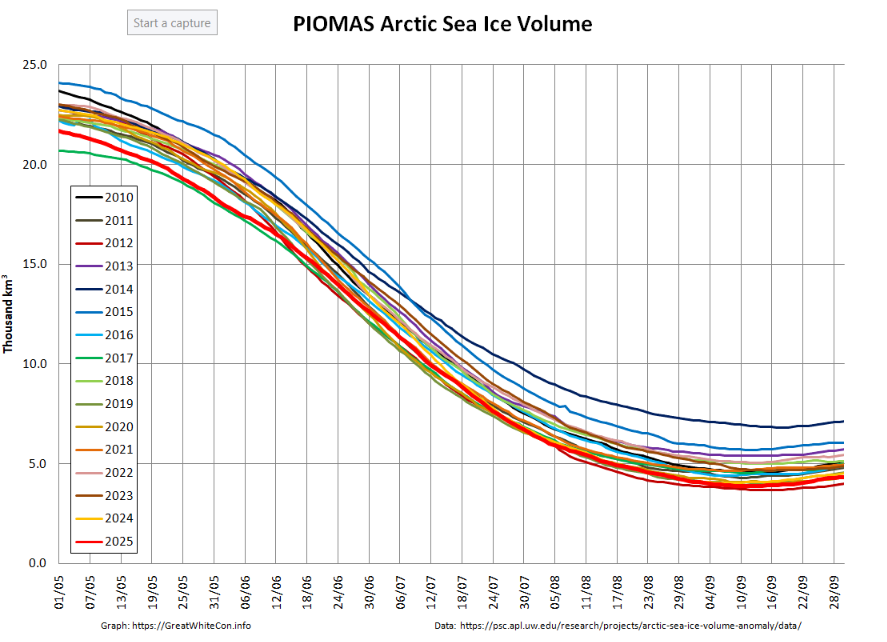
The associated volume graph reveals that the 2025 minimum modelled Arctic sea ice volume was 3.87 thousand km³ on September 12th, which is the 2nd lowest minimum in the PIOMAS record going back to 1979:

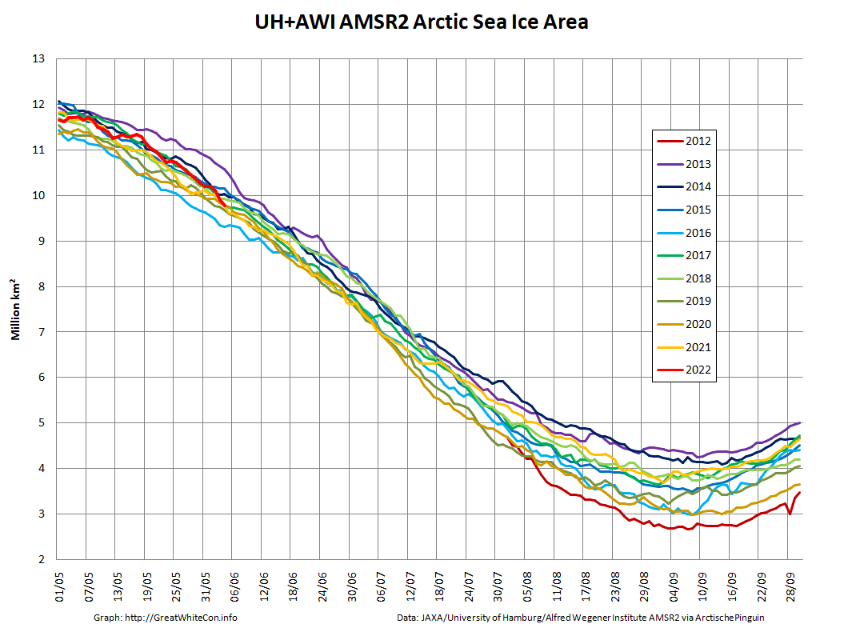
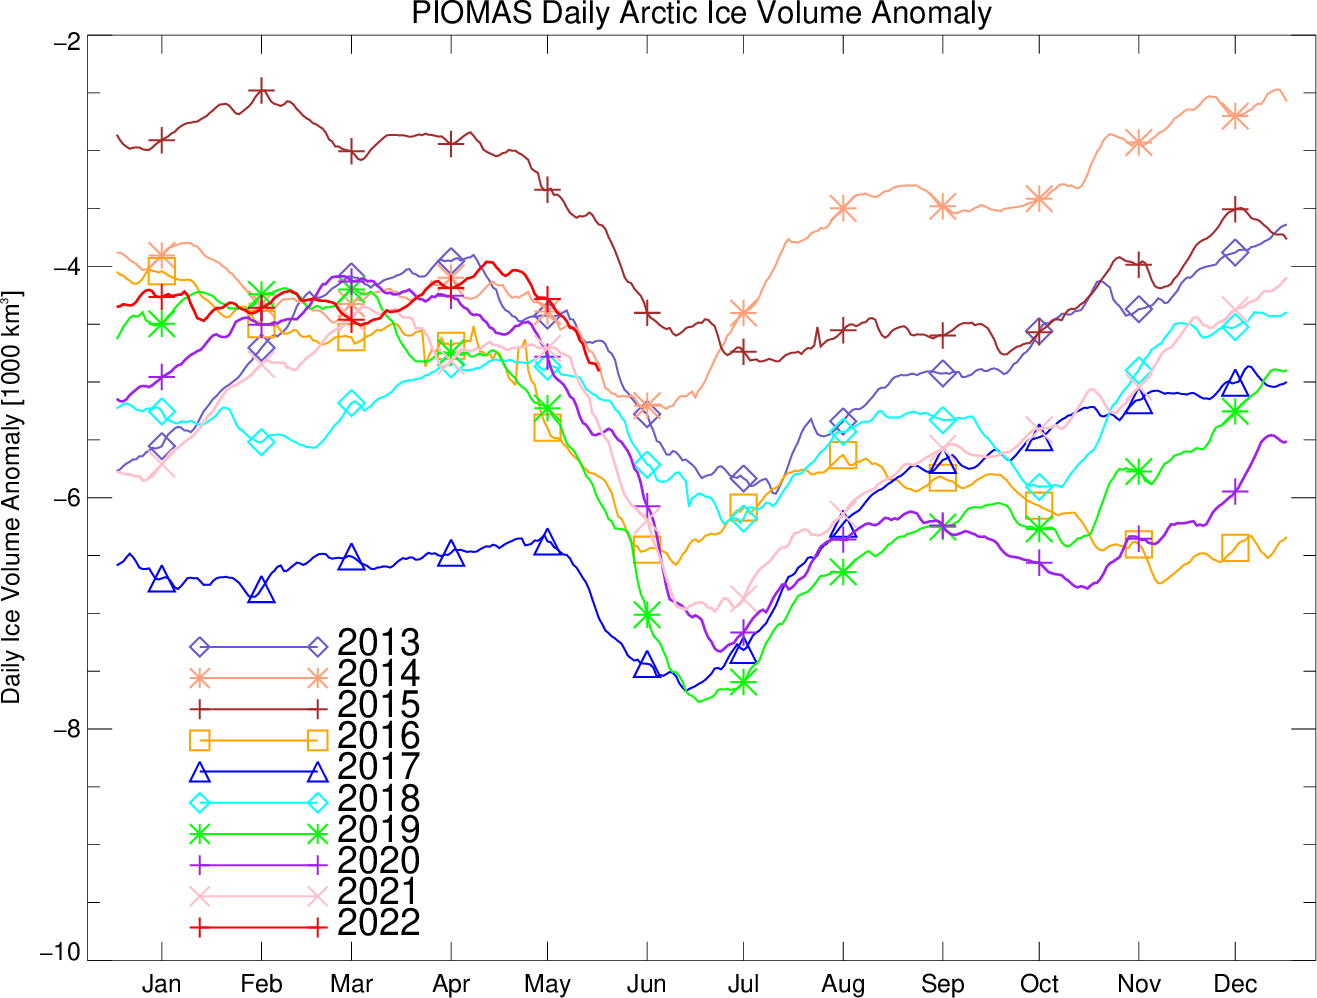
Whilst we’re on the topic of sea ice volume, here’s the latest “measured” volume graph:

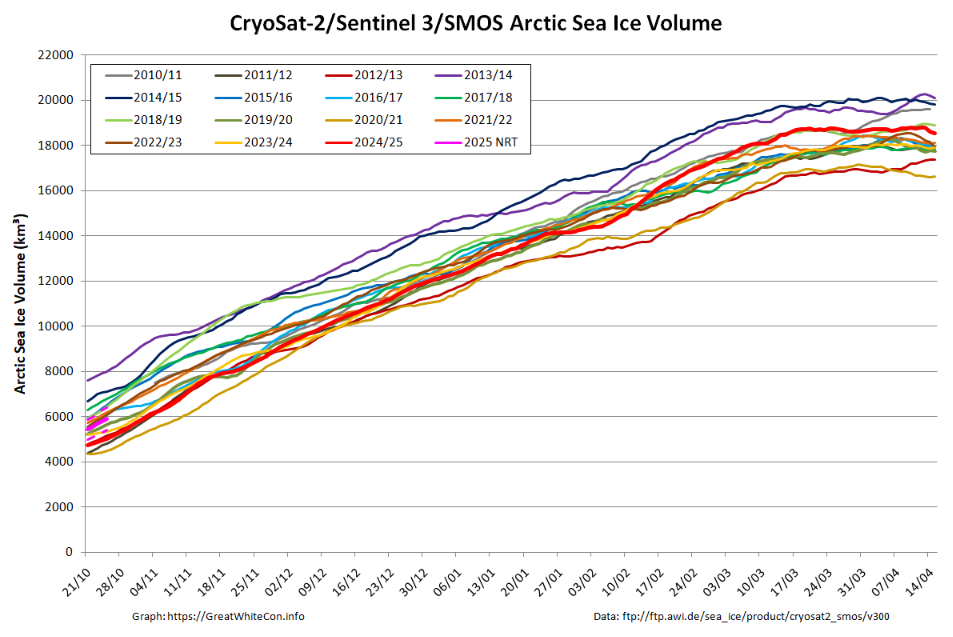
Note the proviso about recent SMOS data above, and also that the version 3.00 data from AWI is currently only available beginning in Autumn 2023. Prior years shown on the graph above are based on version 2.06 data, which amongst other things does not incorporate Sentinel 3 data.
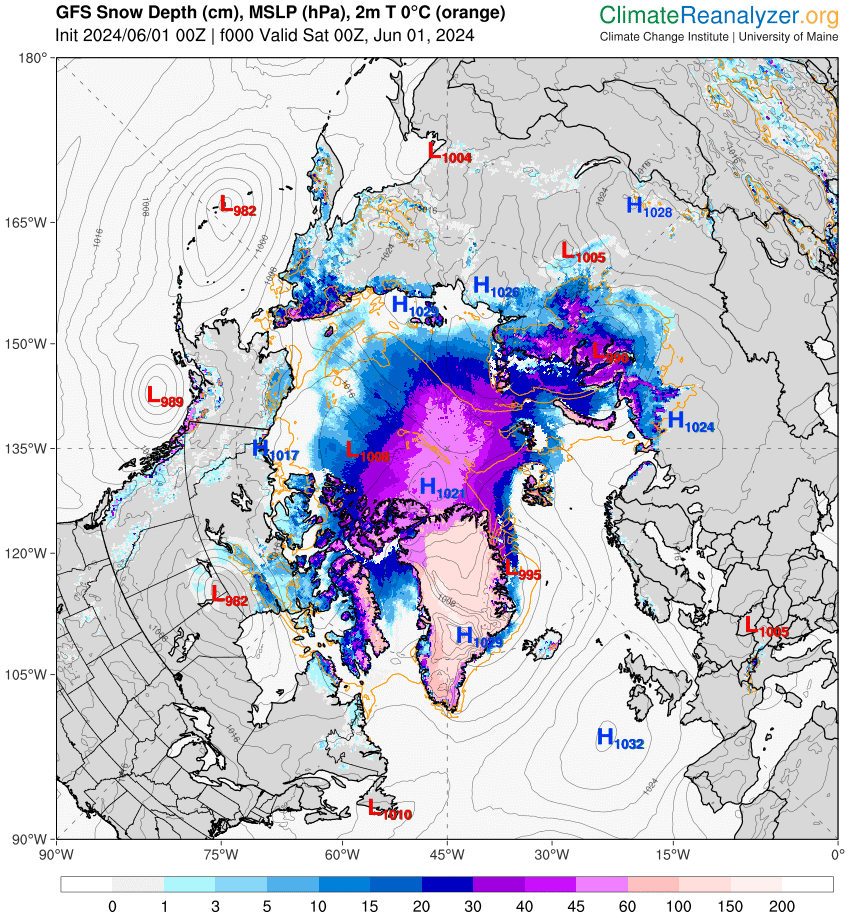
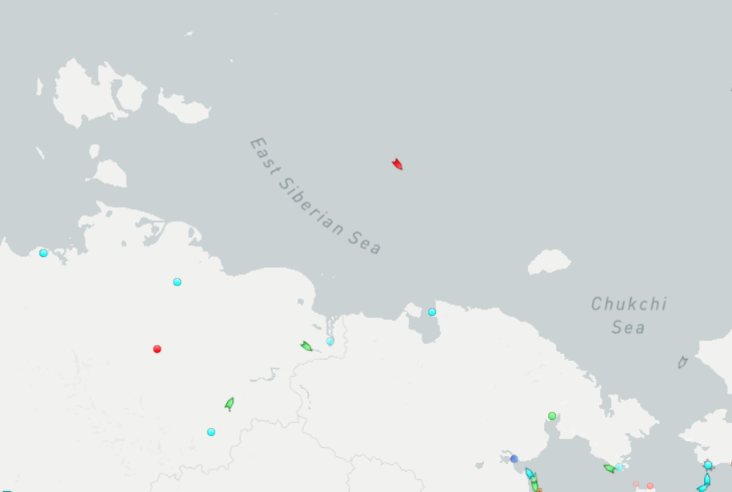
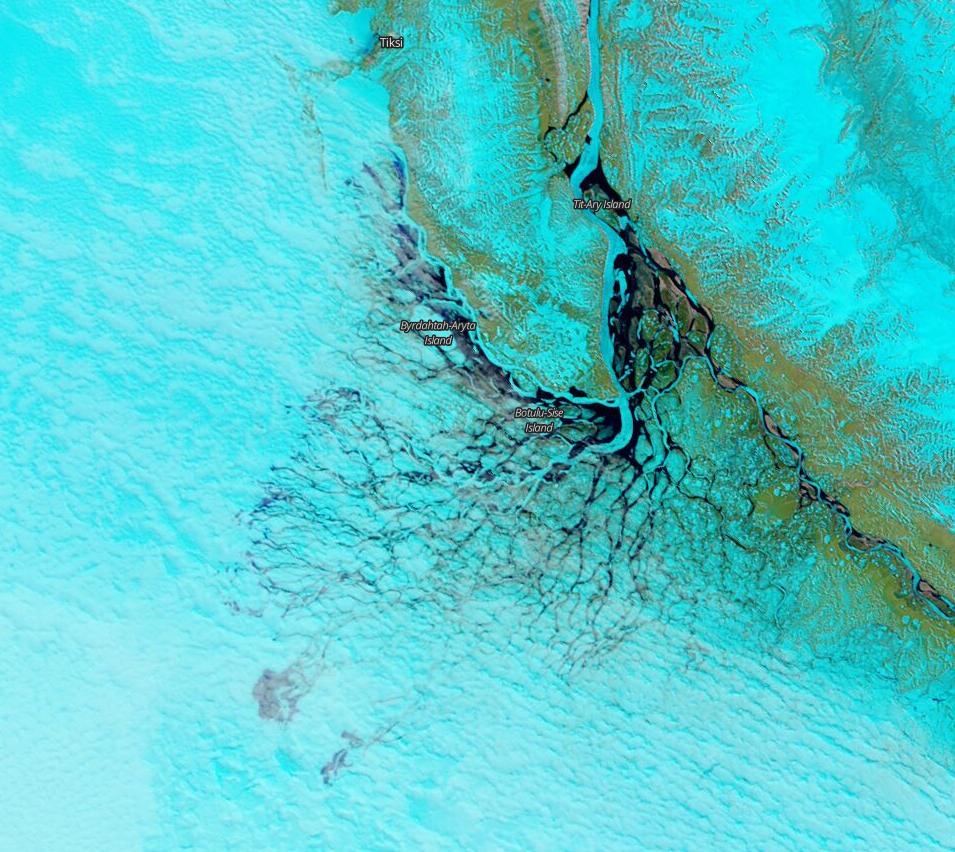
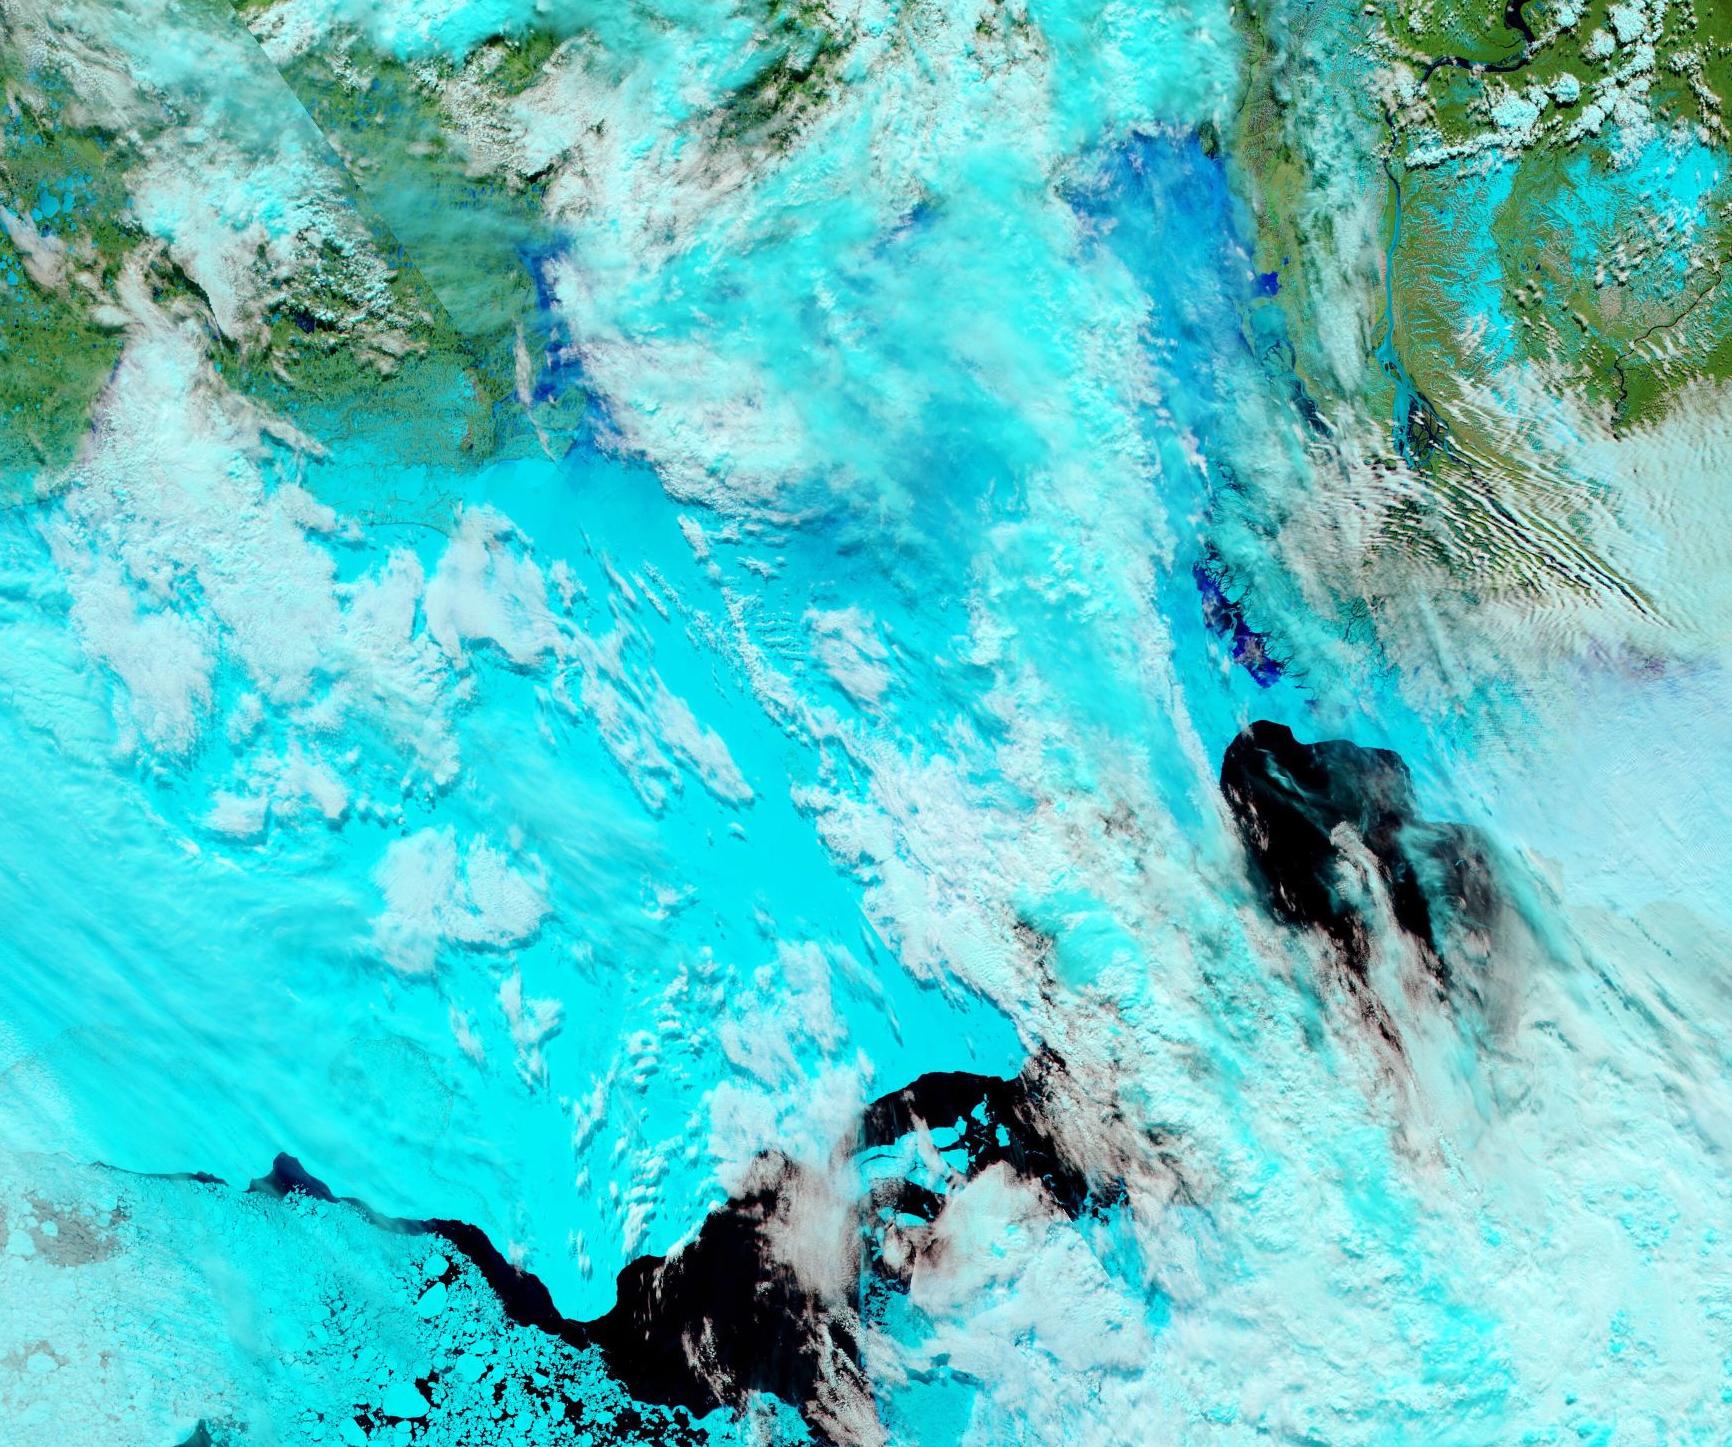
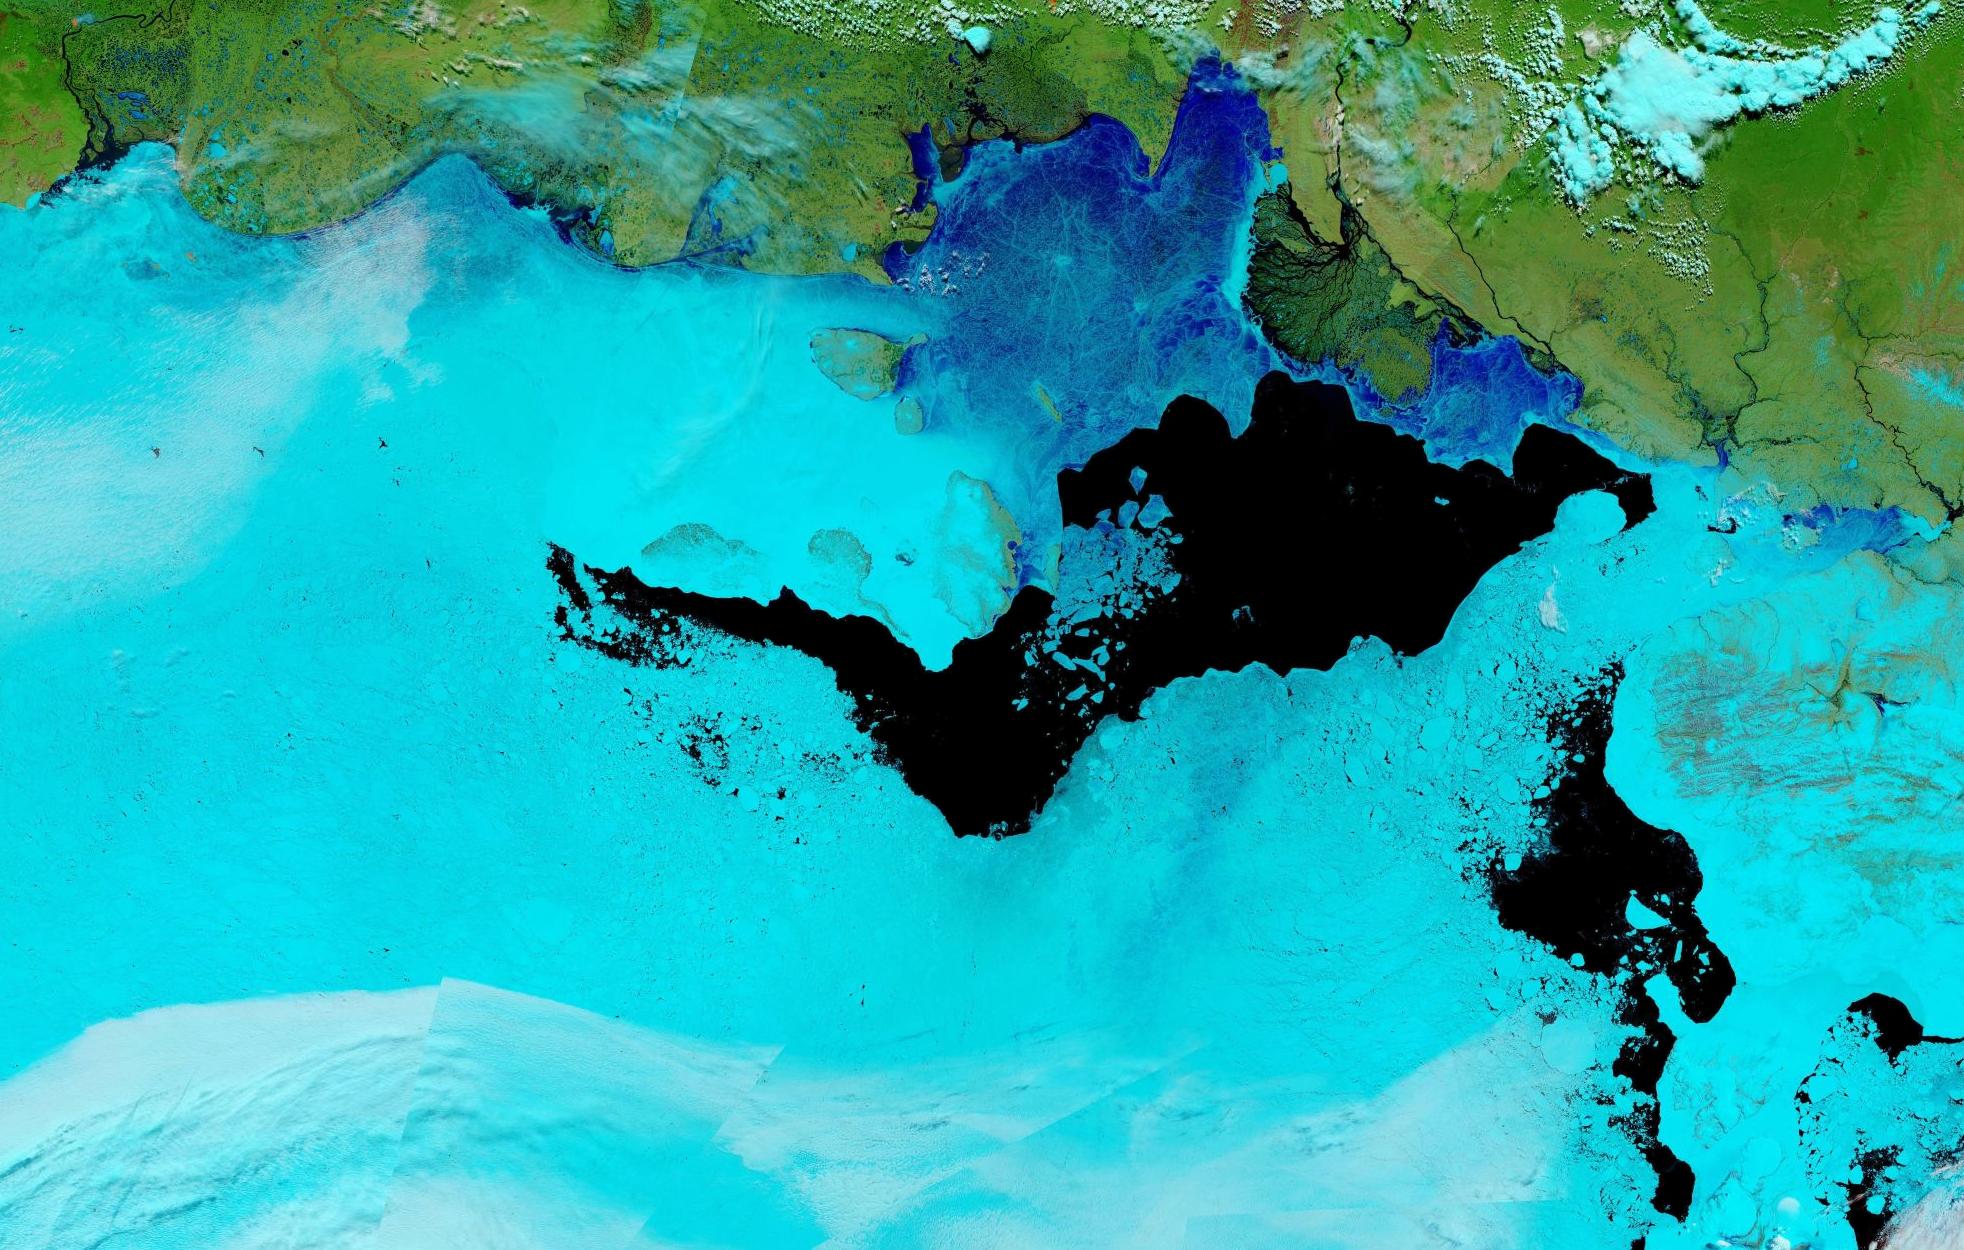
[Update – October 29th]

Much of the Siberian side of the Arctic Ocean has now refrozen:

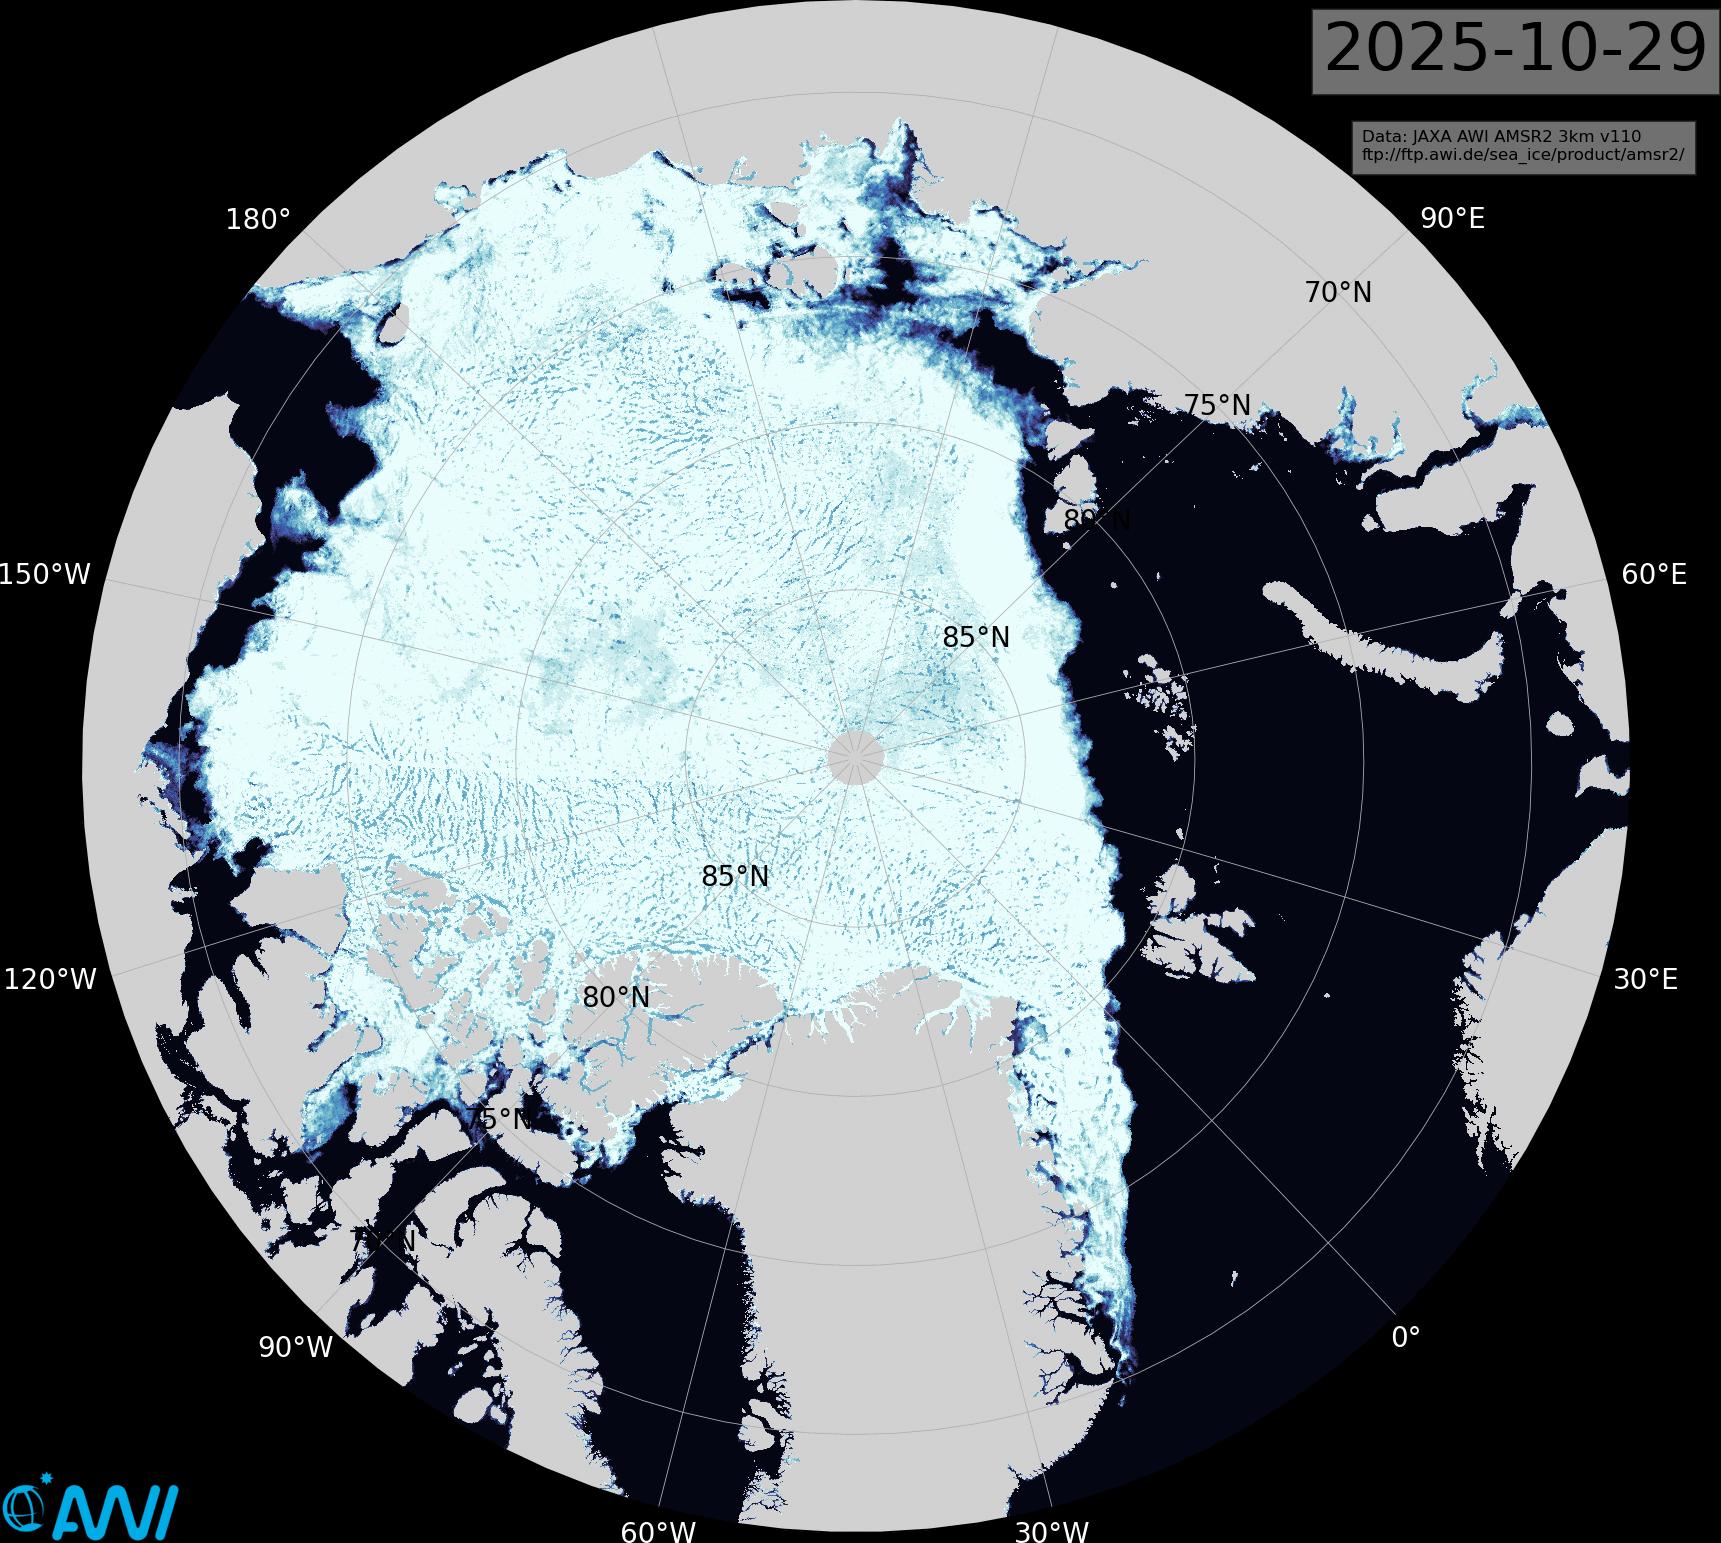
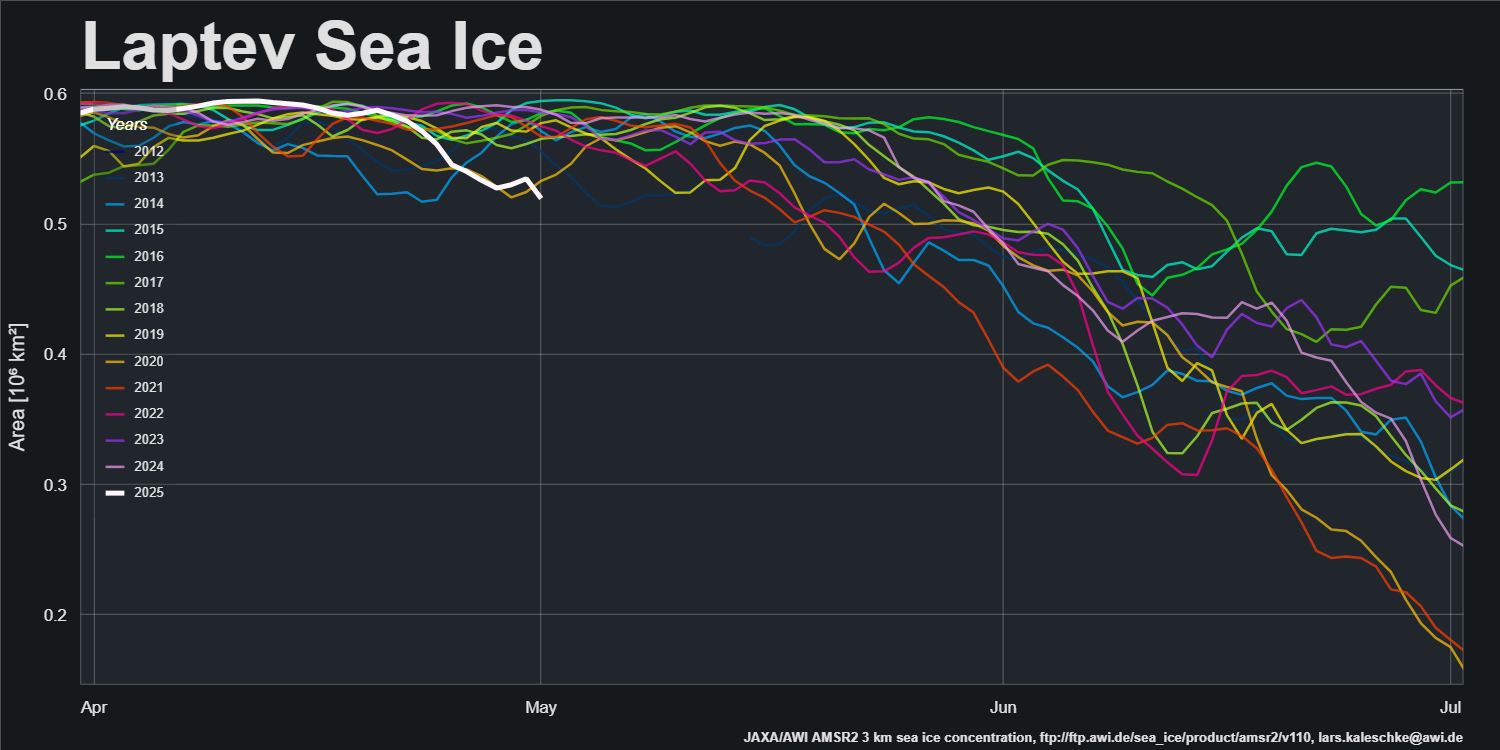
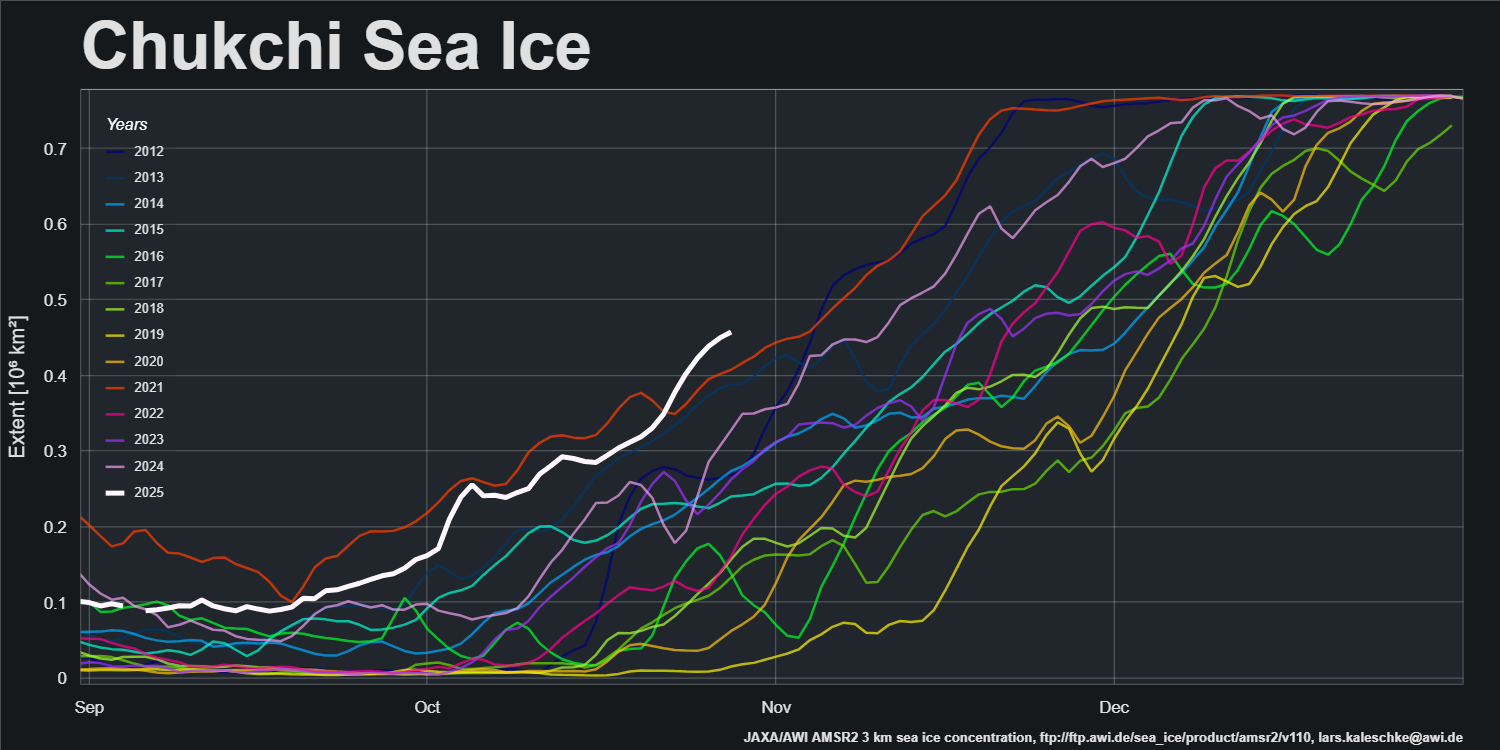
There is a significant difference between progress of the refreeze on the the Pacific and Atlantic sides of the Arctic. Extent in the Chukchi Sea is currently highest for the date in the AMSR2 record:

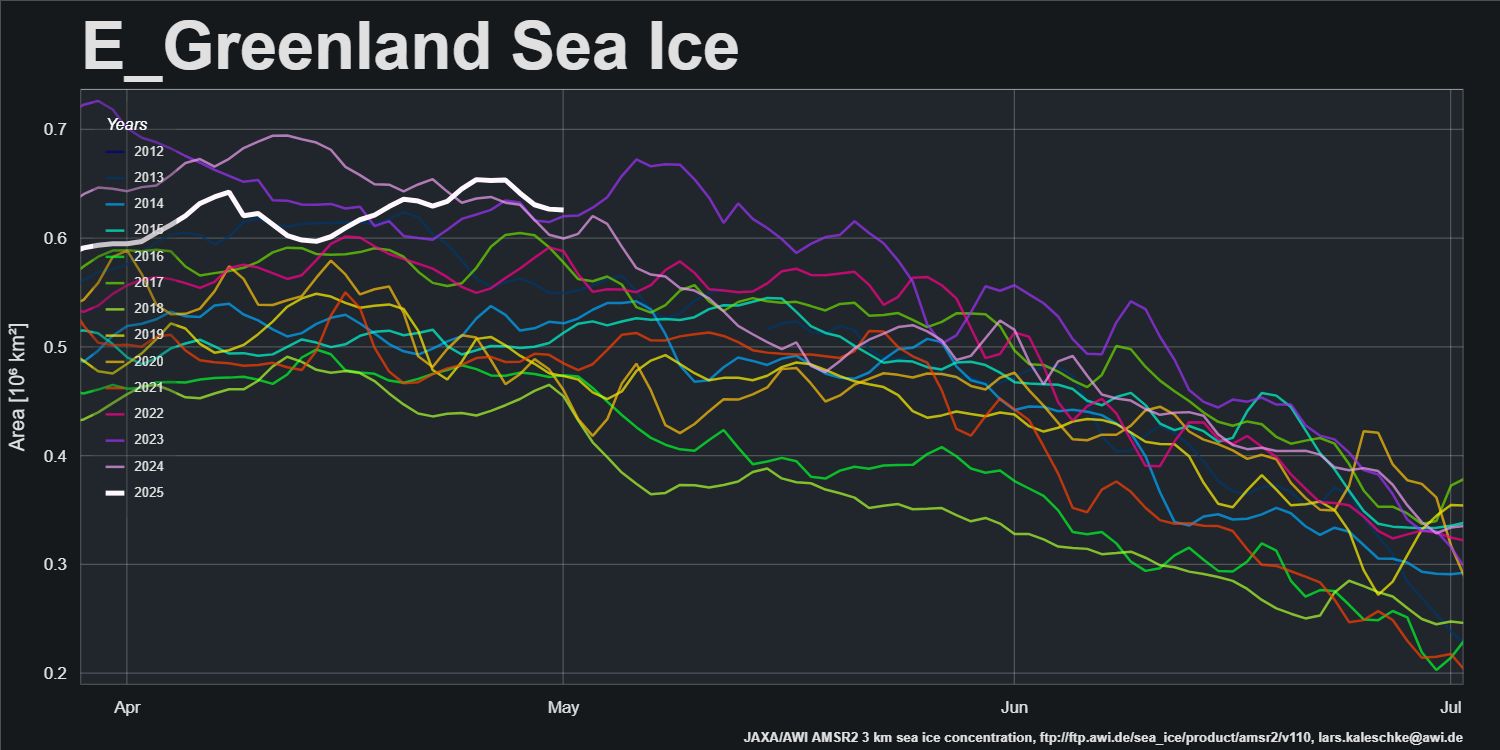
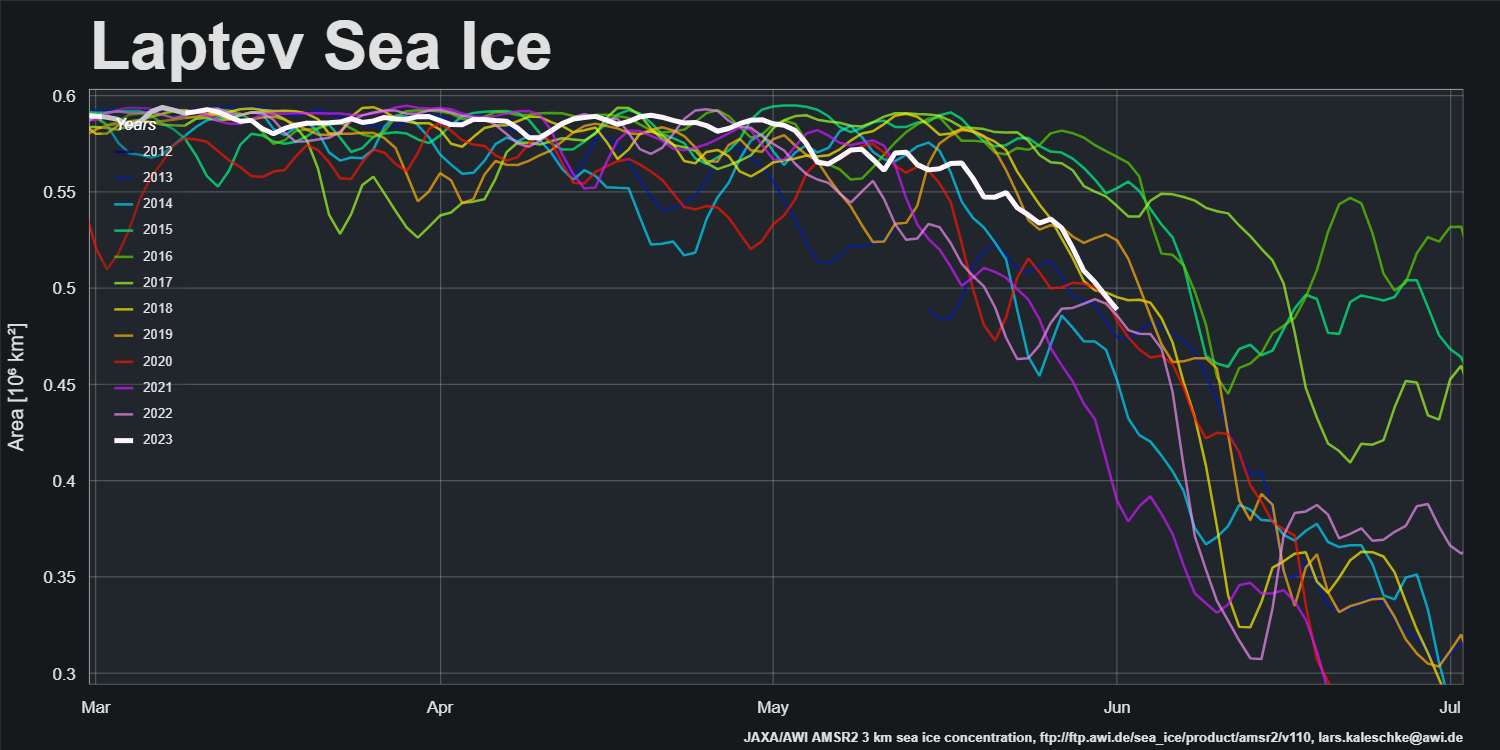
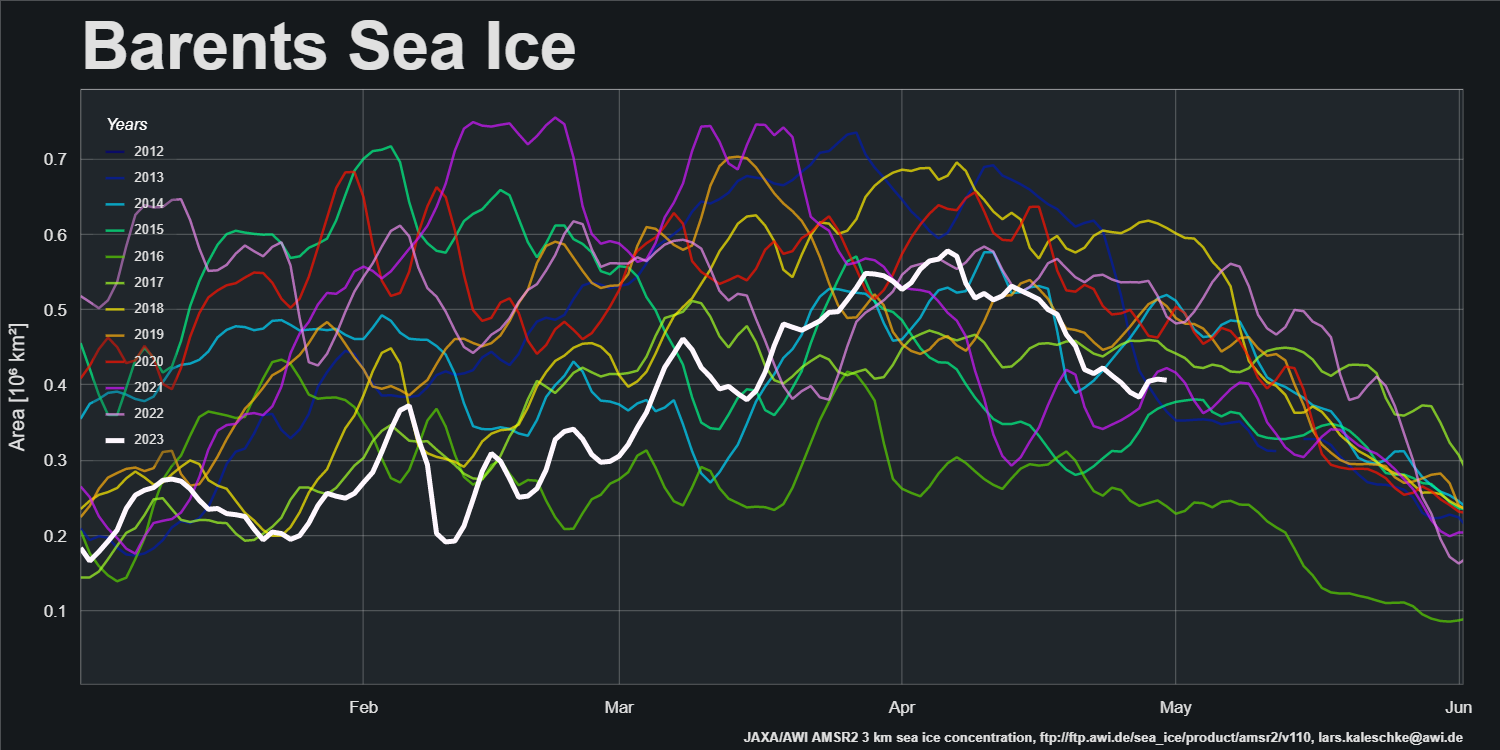
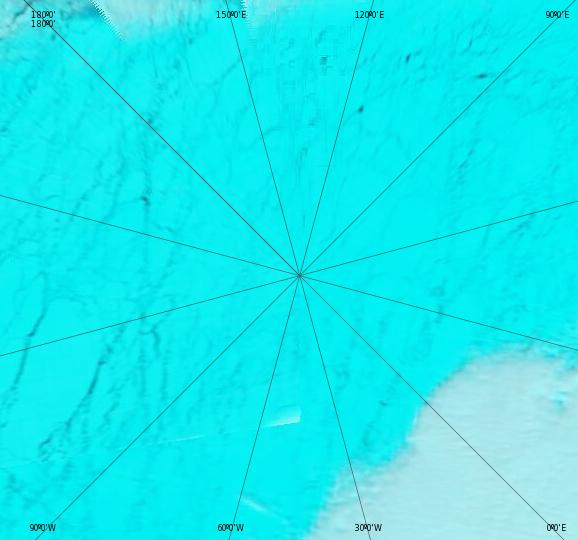
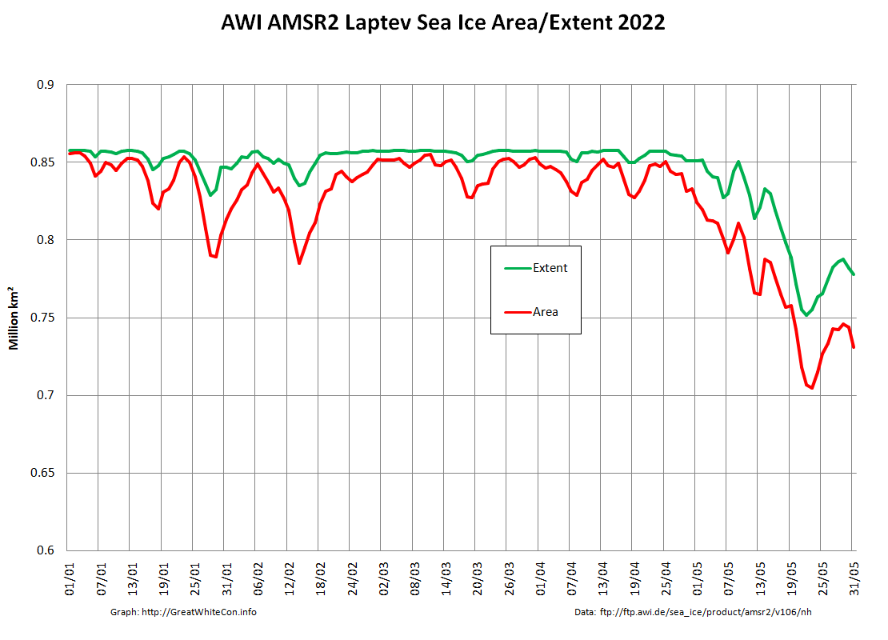
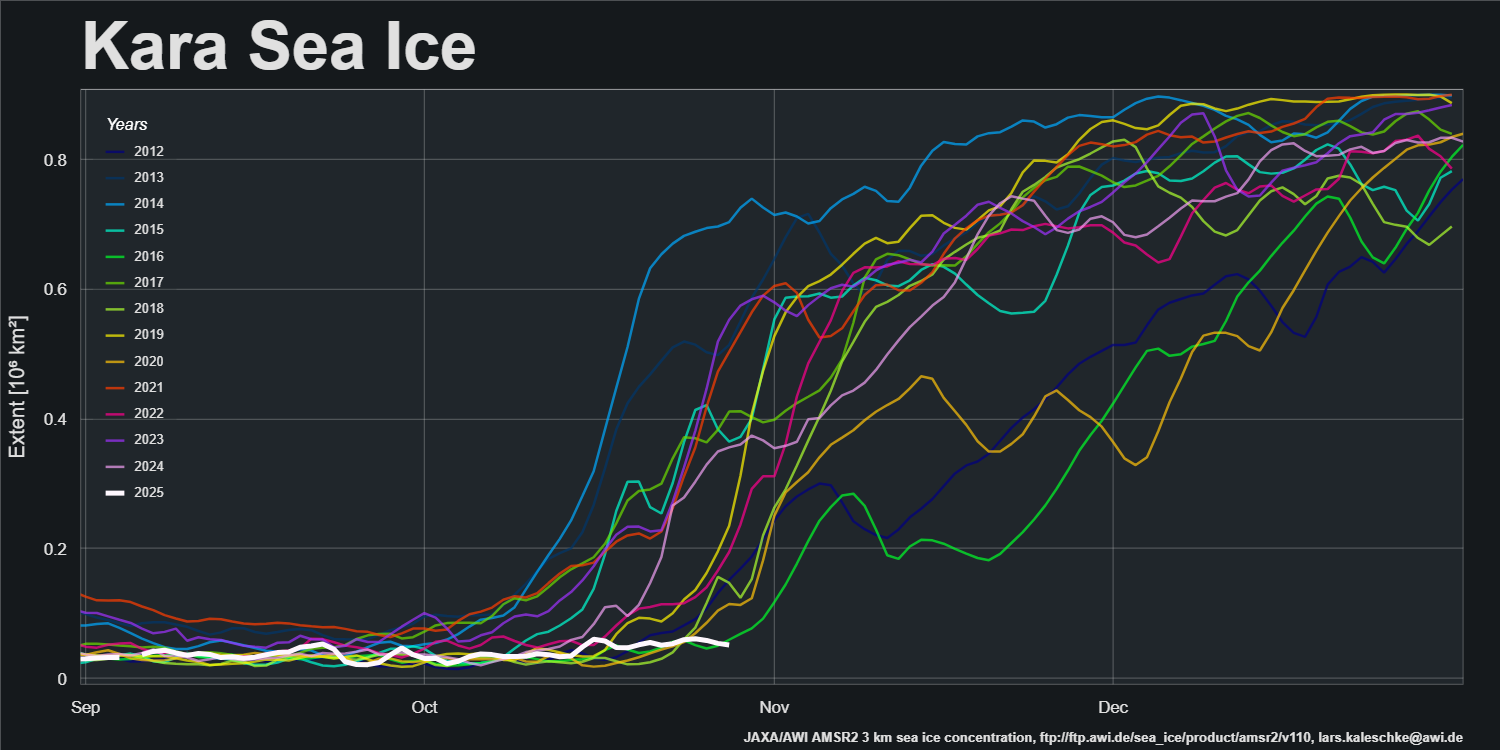
However, refreeze of the Kara Sea has yet to begin, and extent is currently lowest for the date in the AMSR2 record:

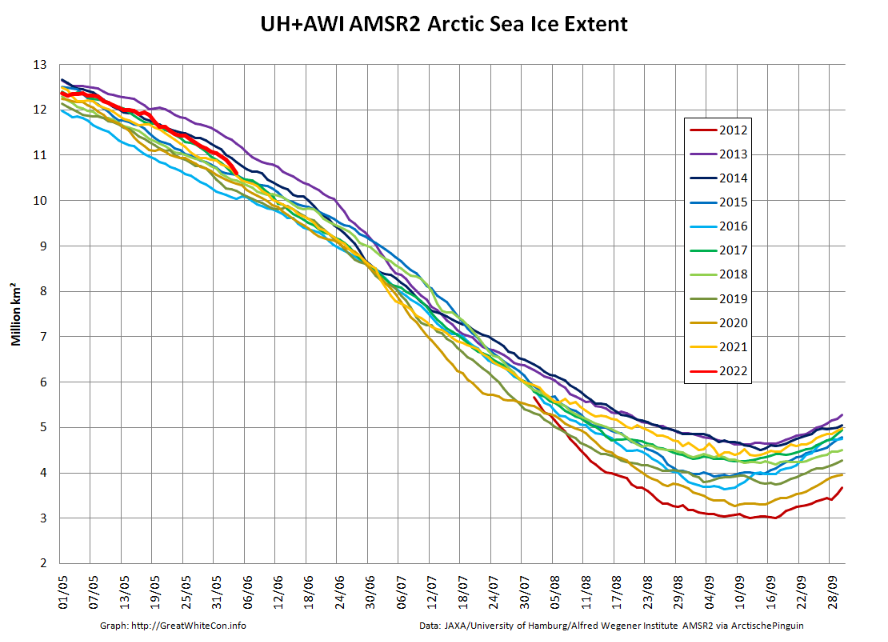
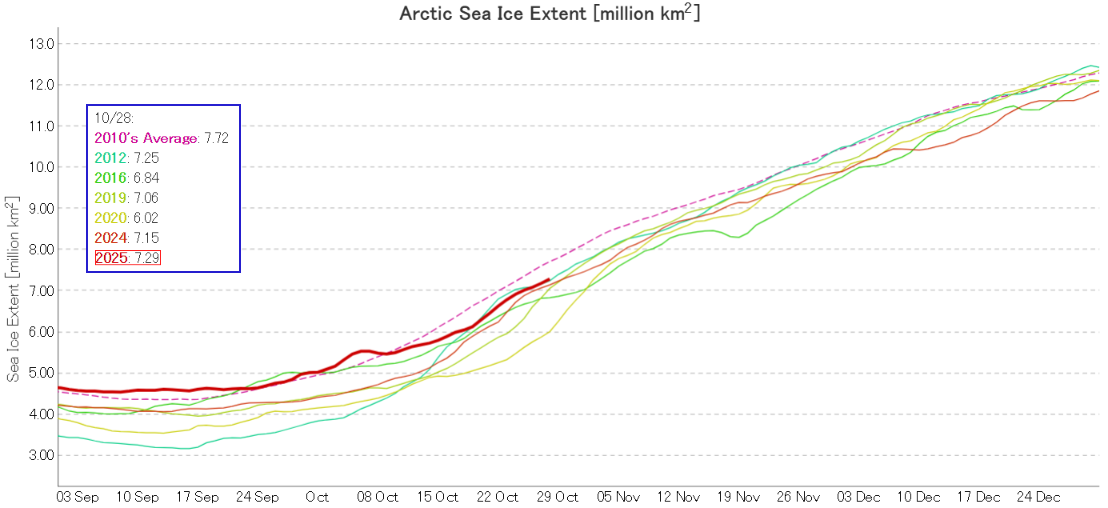
Pan Arctic JAXA/ViSHOP extent is now 6th lowest in the satellite era:

The conversation continues over on the November open thread.

Ella and Yeva Start Circumnavigating the Arctic

I mentioned the start of Ella Hibbert‘s long voyage in her yacht Yeva over on this year’s Northwest Passage thread. Ella and Yeva have now crossed north of the Arctic Circle near Iceland and have begun their attempt to circumnavigate the Arctic in a single summer by sailing past the north of Iceland in a westerly direction:

According to yesterday evening’s update from Ella’s shore team:

Ella’s had a tough time of it today, which is why she hasn’t posted her daily vlog. After days of drifting, she has wind and lots of it.

“35-40 knots, but the wind’s not the issue, it’s the sea state. Massive waves, breaking crests and spray.”

She’s having to run north to take the waves on Yeva’s stern as it was getting too dangerous to sail with them coming over the beam (side-on).

“Having the weight of the Norwegian Sea dumped on me in the cockpit was pretty miserable. The cockpit literally filled like a bathtub with me in it.”

The tracking map above suggests that conditions have moderated and Yeva is back on course for Cape Farewell

Continue reading Ella and Yeva Start Circumnavigating the Arctic

Facts About the Arctic in June 2025

I’ve been away on a “road trip” during the first part of June, so this month’s initial update is a trifle tardy.

After a 100k “break” yesterday JAXA/ViSHOP extent is currently in a tie with 2024 for 4th lowest for the date, and still slightly below 2012.

The PIOMAS sea ice thickness map for May 31st continues to show plenty of thick ice in the Beaufort and Chukchi Seas:

However, the associated volume graph shows the 2025 curve only slightly above the previous low for the date in 2017:

I have recently received a disturbing email from the NSIDC, which reads as follows:

Continue reading Facts About the Arctic in June 2025

Facts About the Arctic in May 2025

JAXA/ViSHOP extent is no longer “lowest for the date”! After “flatlining” for most of April the metric is now in the midst of a close knit group of the other years in the 2020s:

The high pressure area over the Central Arctic persisted through the second half of April, and so did the consequent drift of ice from the Pacific side of the Arctic to the Atlantic periphery:

AWI’s sea ice area for the Greenland Sea is currently “highest for the date” in the AMSR2 record that started in July 2012:

The offshore winds along the Laptev Sea coast have continued, and sea ice area is now “lowest for the date”:

The first signs of a break in the high pressure dominance are appearing. GFS currently forecasts that a low pressure area will enter the Central Arctic, bring above zero temperatures over the Kara Sea on Sunday:

Continue reading Facts About the Arctic in May 2025

Facts About the Arctic in June 2024

The JAXA/ViSHOP web site is currently down, so here is the current OSI SAF extent graph for the end of May:

2012’s “June cliff” is almost upon us, and if 2024’s current trajectory continues extent will cross above 2012 for the first time since February in a week or so.

Here’s the GFS model’s current map of snow depth:

Melt ponds are now visible on the ice in the Laptev Sea:

Continue reading Facts About the Arctic in June 2024

Facts About the Arctic in June 2023

By way of a change, which is allegedly as good as a rest, let’s start the new month with a very pretty and almost cloud free “pseudo-colour” image of the Lena Delta and adjacent areas of the Laptev Sea:

“False colour” image of the Lena Delta on June 1st from the MODIS instrument on the Aqua satellite

Laptev sea ice area decline has been in high gear recently:

Continue reading Facts About the Arctic in June 2023

Facts About the Arctic in May 2023

At the beginning of May AWI’s high resolution AMSR2 extent metric is at the top of the historical range:

After a period of melt in the East Greenland Sea, export of sea ice from the Central Arctic via the Fram Strait has increased recently:

Sea ice area in the Barents Sea peaked in the first week of April and has declined steadily since then:

SMOS data is flowing again, and the gaps have been filled. Here’s the final pre melt ponding map of the spring:

It reveals large areas of thin ice that have recently developed in the Kara Sea. Here’s a pseudo colour glimpse of the region through the clouds:

Continue reading Facts About the Arctic in May 2023

The Northern Sea Route in 2022

On June 17th the Northern Sea Route Administration published the Arctic and Antarctic Research Institute forecast of ice conditions for June to August 2022. Here’s the summary:

“Favorable” conditions in most areas, but “average” in the eastern East Siberian Sea and south west Chukchi Sea.

Traffic along the main Northern Sea Route has already begun. Marine Traffic reveals that the liquified natural gas carrier Nikolay Yevgenov is heading for the Bering Strait and has already sailed north of the New Siberian Islands. He is now entering the “average” ice area in the eastern ESS:

Meanwhile the recently commissioned nuclear powered icebreaker Sibir is patiently waiting in the Vilkitsky Strait:

The Northern Sea Route is evidently already “open” for ice hardened LNG tankers, but not yet for more conventional vessels. Here is the current AMSR2 sea ice concentration map:

Continue reading The Northern Sea Route in 2022

Facts About the Arctic in June 2022

May 2022 proved to be fairly uneventful in the Arctic. High resolution AMSR2 Arctic sea ice extent has remained towards the top of the recent pack:

However Arctic sea ice area has been declining more quickly recently, and compaction is now lowest for the date in the AMSR2 record:

The clouds over the Lena Delta have thinned, to reveal melt water beginning to spread across the fast ice in the Laptev Sea:

“False colour” image of the Lena Delta on June 2nd from the MODIS instrument on the Terra satellite

The clouds have also cleared over the North Pole, to reveal a network of leads:

“False colour” image of the North Pole on June 2nd from the MODIS instrument on the Terra satellite

The Alfred Wegener Institute have recently released the reanalysed CryoSat-2/SMOS sea ice thickness data for mid April:

We now anxiously await the PIOMAS modelled thickness data for May. Meanwhile the AWI data suggest that the thickest ice in the Central Arctic Basin is currently to be found north of Axel Heiberg Island, with the thin ice in the Laptev Sea ripe for further extent reductions:

[Edit – June 5th]

Large areas of the fast ice in the Laptev Sea are now showing evidence of surface melt:

“False colour” image of the Laptev Sea on June 5th from the MODIS instrument on the Aqua satellite

The JAXA ViSHOP web site is still down, so here are the latest “high resolution” AMSR2 numbers for June 4th:

Extent: 10.60 million square kilometers, Area: 9.77 million square kilometers

[Edit – June 9th]

The June edition of the NSIDC’s Arctic Sea Ice News summarises May 2022 as follows:

Average Arctic sea ice extent for May 2022 was 12.88 million square kilometers (4.97 million square miles). This was 410,000 square kilometers (158,000 square miles) below the 1981 to 2010 average, yet it was the highest May extent since 2013.

As was the case for April, sea ice extent was slow to decline, losing only 1.28 million square kilometers (494,000 square miles) during the month.

Within the Arctic Ocean, air temperatures at the 925 mb level (about 2,500 feet above the surface) were near average over most of the region in May, and 1 to 5 degrees Celsius (2 to 9 degrees Fahrenheit) above the 1981 to 2010 average along the coast of the Kara and East Siberian Seas, the East Greenland Sea, and the Canadian Archipelago:

Areas where openings formed within the ice cover were dominated by off-shore ice motion, pushing ice poleward as well as toward Fram Strait. This offshore ice motion is largely driven by a pattern of low sea level pressure over Eurasia coupled with high pressure over the Pacific sector of the Arctic:

[Edit – June 12th]

The Polar Science Center at the University of Washington has released the PIOMAS volume data for May 2022:

Average Arctic sea ice volume in May 2022 was 22,000 km3. This value is the 11th lowest on record for May,  about  2,100 km3 above the  record set in 2017.   Monthly  ice volume was 39% below the maximum in 1979 and 24% below the mean value for 1979-2021. Average May 2022 ice volume was  1.5 standard deviations above the 1979-2021 trend line.

Ice growth anomalies for May 2022 continued to be at the upper end of the most recent decade (Fig 4) with a mean ice thickness  (above 15 cm thickness) at the middle of  recent values.

The ice thickness anomaly map for May 2022 relative to 2011-2020 continues the previous months pattern that divides the Arctic in two halves with positive anomalies in the “Western Arctic” , a strong positive anomaly in the Eastern Beaufort  but negative anomalies in “Eastern Arctic”.

The development of a positive ice thickness anomaly in the Eastern Beaufort appears to be related to anomalous sea ice drift during February that transported ice along the Canadian Coast into the Beaufort. Positive anomalies in the Greenland and Barents Seas seem to be associated with higher than normal  sea ice extent in those areas.

The Terra satellite has a nice clear view of the “Eastern Arctic” this morning, revealing widespread surface melt and continuing break up of the ice in the Laptev Sea:

“False colour” image of the Laptev and East Siberian Seas on June 12th from the MODIS instrument on the Terra satellite

[Edit – June 16th]

Bottom melt has begun on two ice mass balance buoys originally deployed in the Beaufort Sea last autumn.

IMB buoy 551610 is currently located at 78.17 N, 132.8 W:

Buoy 569620 is located at 80.96 N, 142.5 W :

Around 35 cm of snow and 1.8 m of ice to go!

[Edit – June 21st]

Here’s the mid June PIOMAS Arctic sea ice thickness map:

It shows hardly any ice thicker than 2 meters across the entire eastern half of the Arctic Ocean.

[Edit – June 25th]

The snow cover has gone and ice surface melt has begun in the northern Beaufort Sea, where IMB buoy 551610 is currently located at 78.34 N, 130.76 W:

It also looks as though there has recently been preferential solar heating and hence melting around the body of the buoy, as shown in this illustration:

[Edit – June 26th]

A low pressure area has formed over the East Siberian Sea. According to the Canadian Meteorological Centre‘s analysis the central mean surface level pressure had reached 982 hPa by midnight last night:

The CMC’s GEM forecast model suggests that it will bottom out at 974 hPa later this evening UTC and then persist for several days:

[Edit – June 28th]

The June 2022 Sea Ice Outlook has now been published, a few days behind schedule. Neil provides a summary below, but here’s the traditional chart of predictions:

Here’s a bit more detail on the Pan-Arctic sea-ice forecast:

This year’s median forecasted value is 4.57 million square kilometers with quartiles of 4.34 and 4.90 million square kilometers. This is higher than the SIO forecasted value of September sea-ice extent for the past three years (2019–2021), but slightly below the median value of 4.60 million square cited in the 2018 SIO June report. The lowest forecast is 3.41 million square kilometers. Among the four methods that forecast September extent less than four million square kilometers, three are based on dynamical models. Two contributions forecast a record low extent (below 3.57 million square kilometers set in 2012). The highest forecast is 5.20 million square kilometers.

Purely coincidentally the Arctic Sea Ice Forum June poll for NSIDC average extent for September 2022 also had 37 entries. Here are the results:

Meanwhile in the actual Arctic at the end of June 2022 the low over the East Siberian Sea has found its second wind and is deepening once more:

Discussion continues on the new open thread for July 2022.

The 2021 Arctic Sea Ice Minimum Extent

The results of the ARCUS Sea Ice Prediction Network August call have been released, and here is the outlook for the 2021 minimum September mean Arctic sea ice extent:

The median prediction for the mean sea ice extent during the month of September 2021 is 4.39 million km2. According to ARCUS:

As of 22 August 2021, the Arctic sea-ice extent was 5.58 (compared with 25 August 2020 value of 4.43) million square kilometers. Arctic sea-ice extent in 2021 remains well below the climatological median and has closely followed the 2012 values for much of the summer but has diverged to higher sea-ice extent starting in early August. The forecasts continue to support September 2021 mean sea-ice extent being well above the September 2020 value. July sea-ice retreat has been greatest in the Eurasian seas, particularly in the East Siberian Sea, making the 2021 ice edge well north of the long-term median edge in Eurasia. Sea ice retreated since the end of July along the northern coast of Alaska, although the ice edge is near its climatological position, which makes the Beaufort and Chukchi sea ice extent the largest at this time of year since 2006. A tongue of sea ice that has been present all summer continues to extend close to land in the Kara Sea, making the northeast passage likely to remain blocked for the first time in several years. Half the models which provide spatial data to the SIO predict that the tongue is likely to survive.

Now let’s take a look at a range of assorted extent measurements. Here’s the NSIDC’s 5 day average extent:

Continue reading The 2021 Arctic Sea Ice Minimum Extent