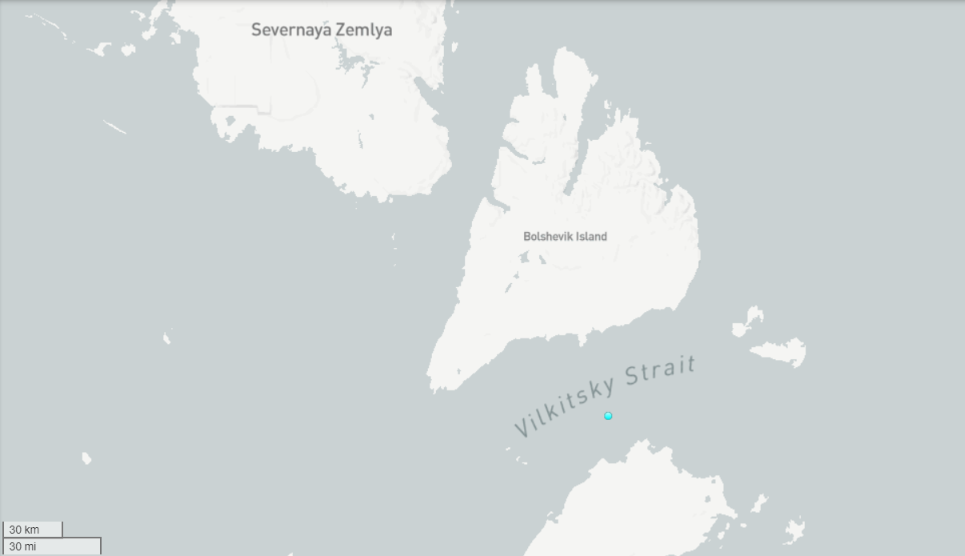
I’m opening the 2025 Northwest Passage thread earlier than usual, because of some news you can read if you scroll down. However, let’s first of all get our bearings with the help of this map of the area:
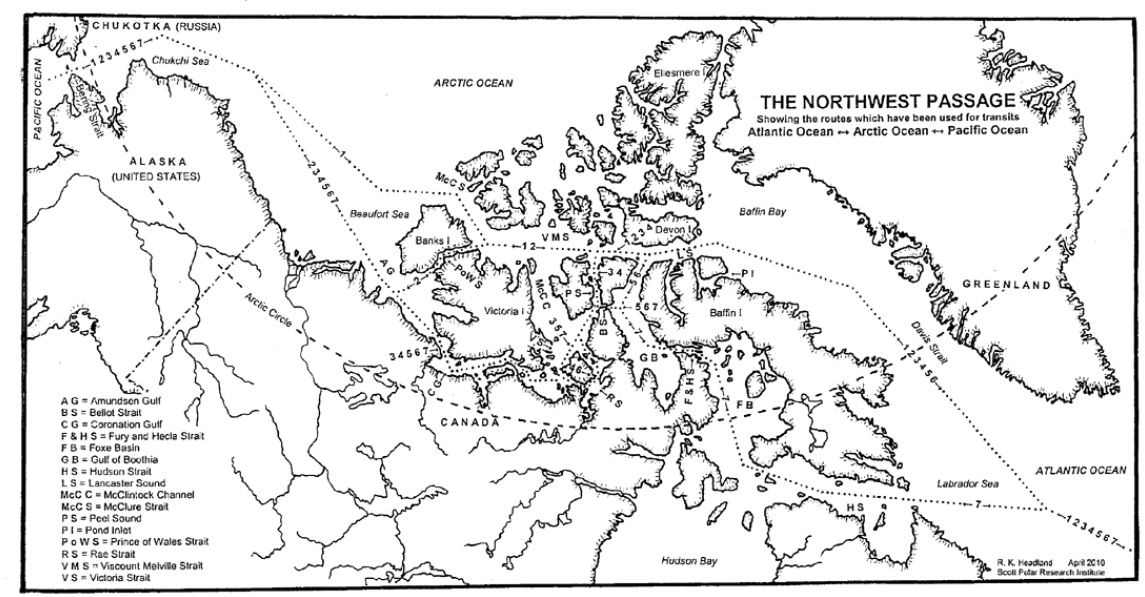
and another map detailing the routes through Canadian Arctic Archipelago that have previously been successfully traversed:
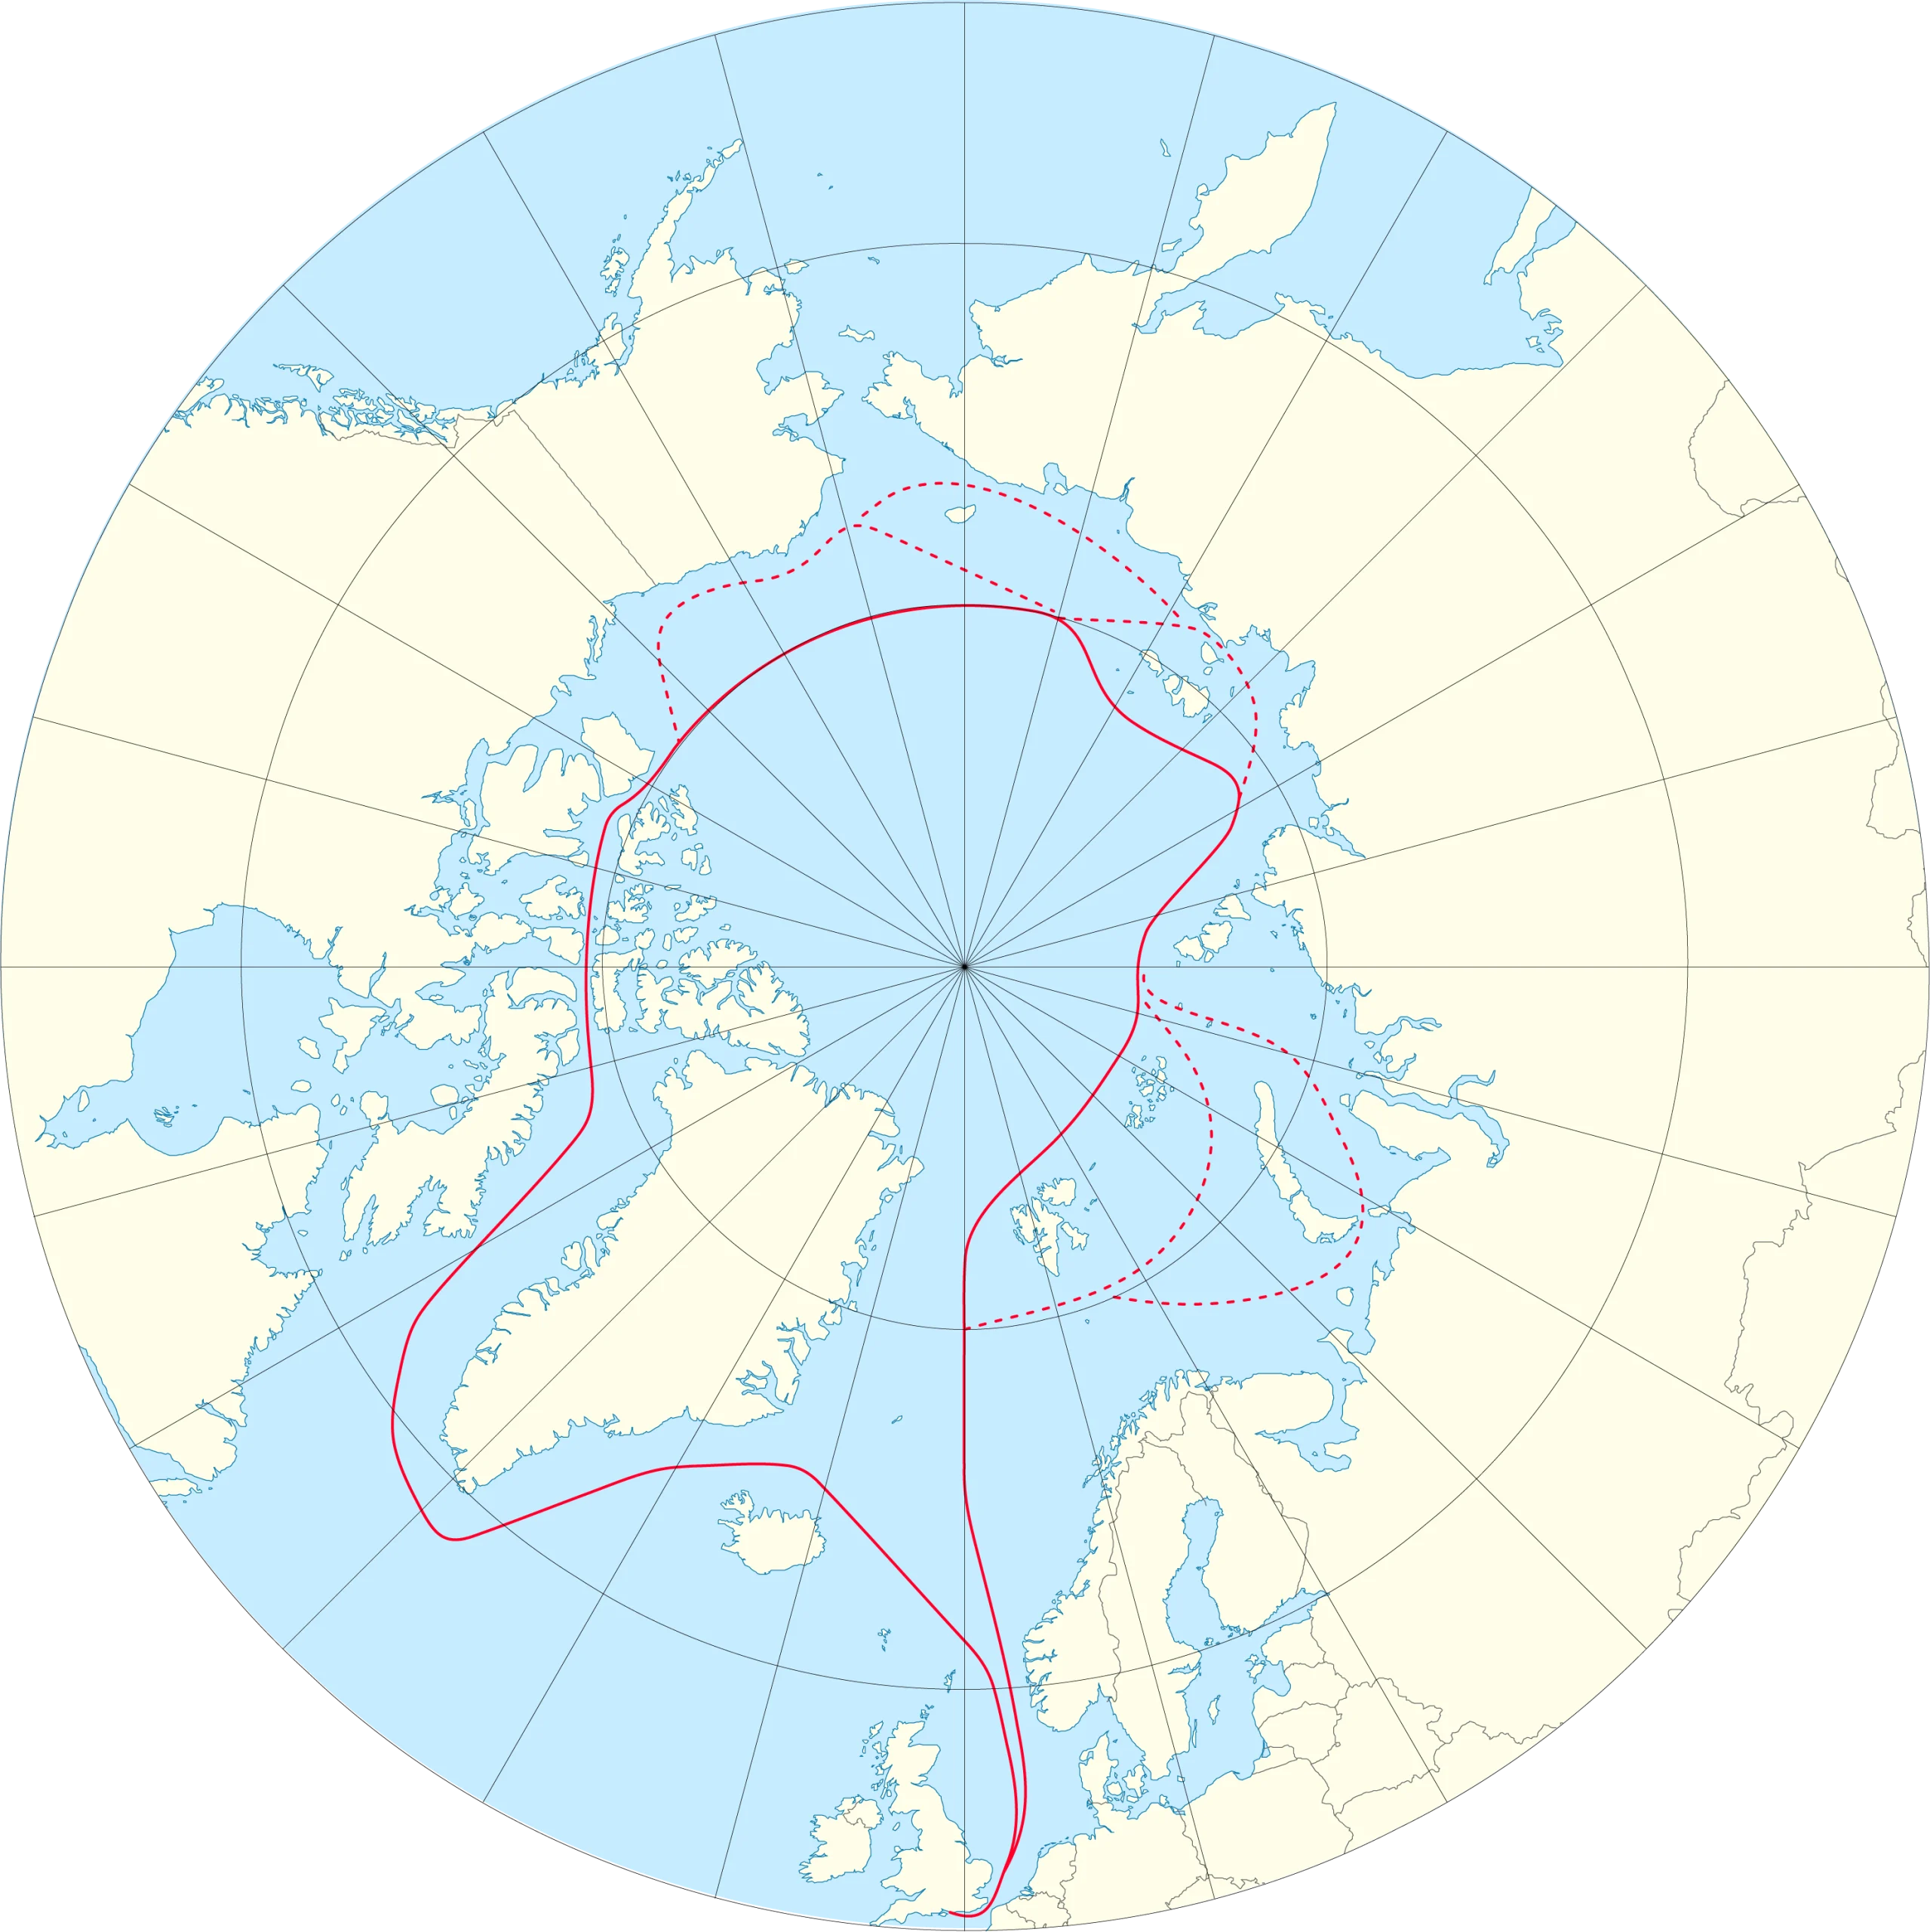
The news I was referring to is that at lunchtime today Ella Hibbert is setting off in her yacht Yeva from Haslar Marina near Portsmouth in southern England for a rather unusual voyage through the Northwest Passage this summer. Here is Ella’s current route plan:
You will note some unusual features. Apparently Ella is intent on taking Route 1 into the Beaufort Sea via McClure Strait. After that she is not heading for the Bering Strait, but is instead taking the route less travelled back to Haslar via the Northern Sea Route. Perhaps even more surprising in this day and age is that Ella has received permission to sail through Russian waters without an ice pilot. She is aiming to complete an entire circumnavigation of the Arctic in a single summer single handed! As Ella puts it, this is “A voyage that should not be possible”:
Ella is hoping to overcome terrifying challenges including icebergs, freezing water and polar bears.
Her journey – which has only recently become possible due to melting polar ice caps – aims to showcase the devastating environmental impact of sea ice decline, both in the Arctic and across the world.
Ella’s voyage also aims to support two charities working tirelessly to protect the Arctic: Polar Bears International and the Ocean Conservancy.
At the end of her voyage, Ella will auction her ship Yeva with proceeds to go to these two charities.
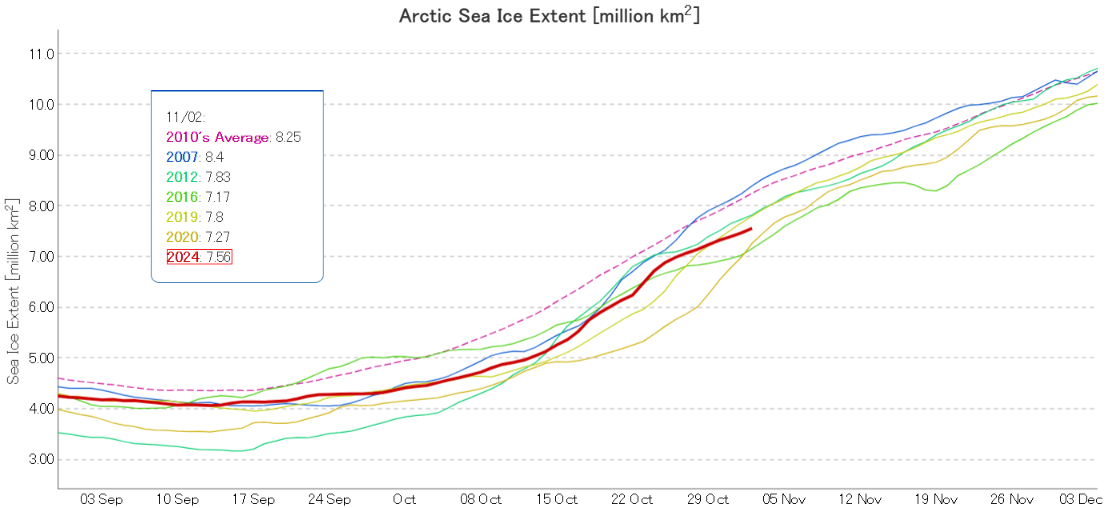
The Laptev and East Siberian Seas have now refrozen. Consequently Arctic sea ice extent is now increasing more slowly, and JAXA/ViSHOP extent is 3rd lowest for the date in the satellite era:
Note the change in scale from previous months, to allow for easier comparison with the “near real time” CryoSat-2/SMOS merged thickness data from the Alfred Wegener Institute:
The JAXA extent graph is currently not updating, so let’s begin this month with the latest AMSR2 sea ice concentration map from the Alfred Wegener Institute. Click the image to see a ~10 Mb animation of the last four weeks:
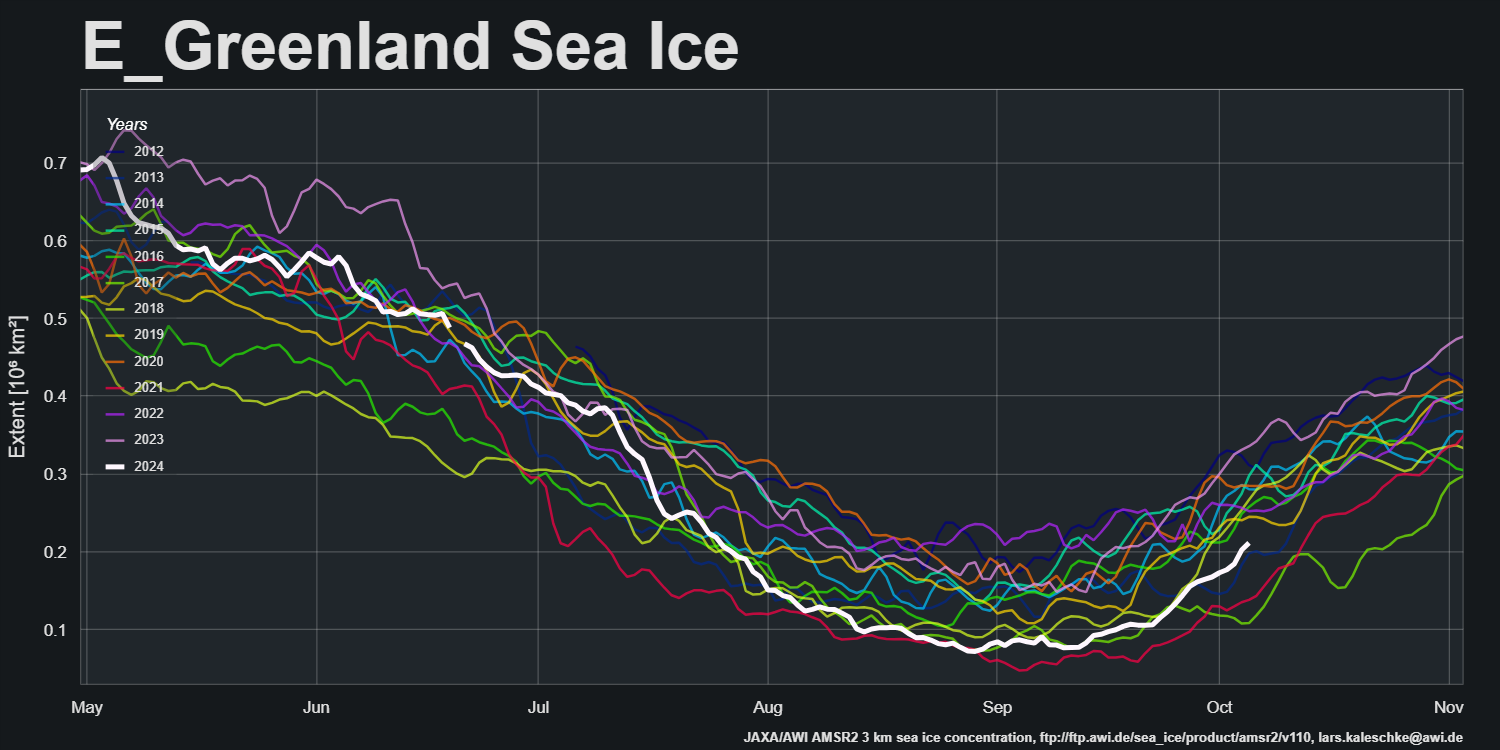
Note in particular the restart of export into the East Greenland Sea via the Fram Strait:
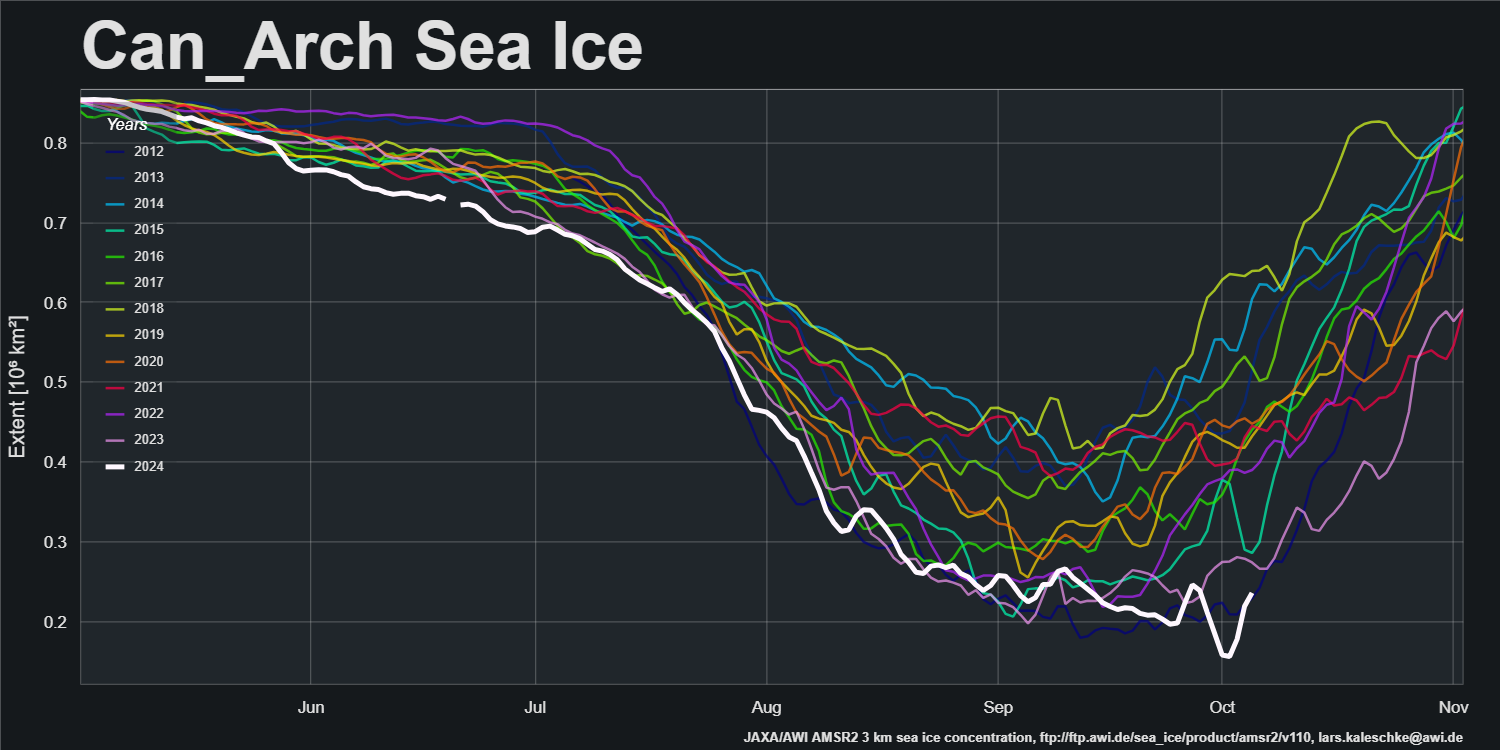
and the movement of ice within the Canadian Arctic Archipelago:
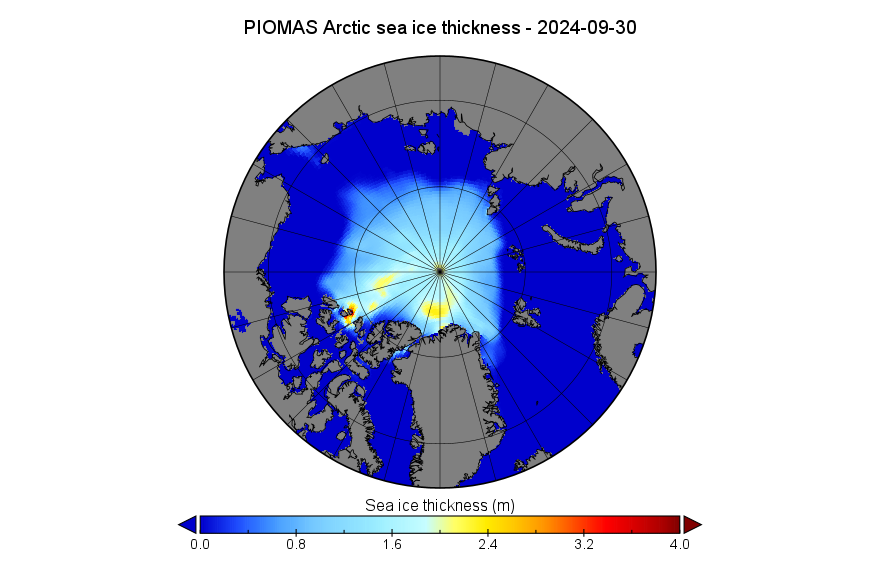
The PIOMAS gridded thickness data for September 2024 has been released:
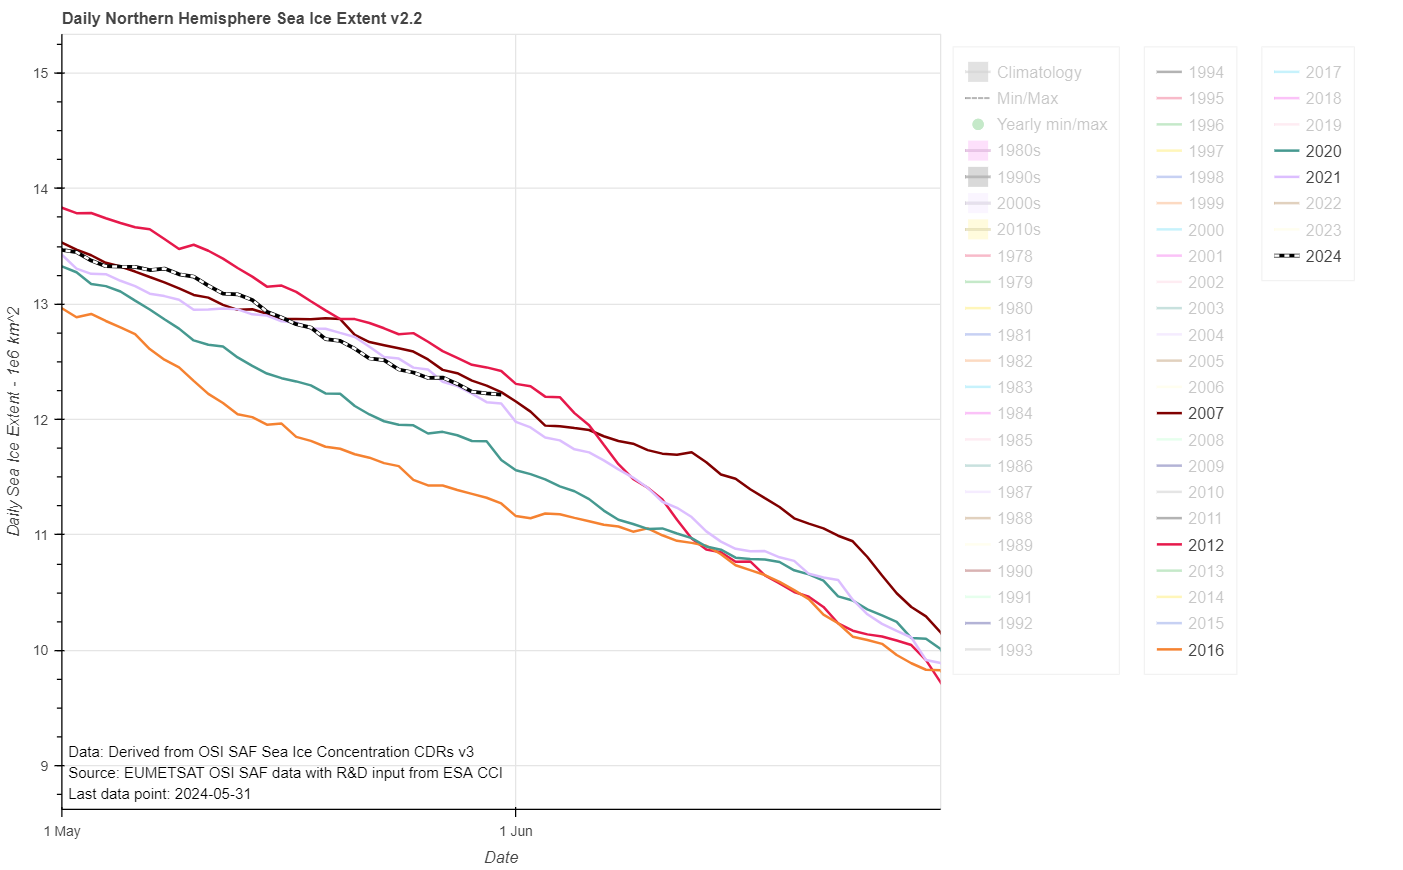
The JAXA/ViSHOP web site is currently down, so here is the current OSI SAF extent graph for the end of May:
2012’s “June cliff” is almost upon us, and if 2024’s current trajectory continues extent will cross above 2012 for the first time since February in a week or so.
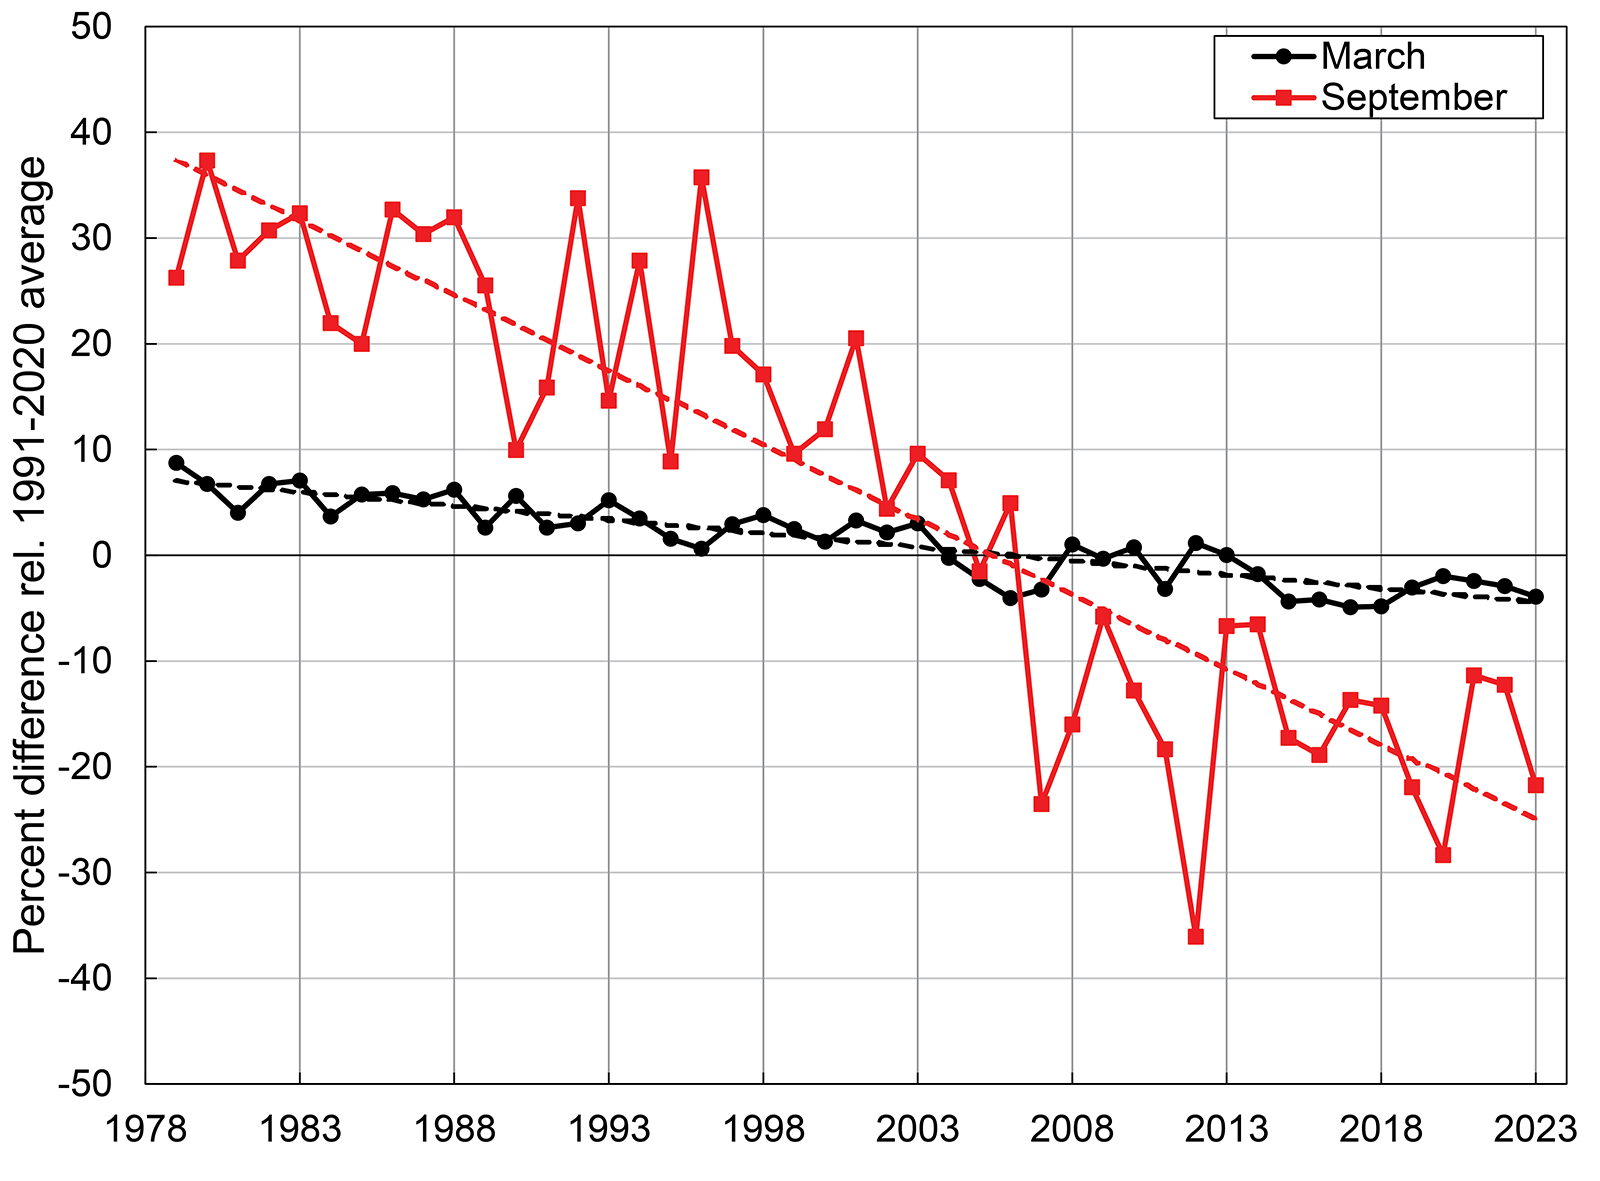
The 2023 Arctic Report Card has been published by the US National Oceanic and Atmospheric Administration (NOAA). All sorts of things are discussed in the report, but sticking to Snow White’s speciality of sea ice here’s an extract:
This satellite record tracks long-term trends, variability, and seasonal changes from the annual extent maximum in late February or March and the annual extent minimum in September. Extents in recent years are ~50% lower than values in the 1980s. In 2023, March and September extents were lower than other recent years, and though not a new record low, they continue the long-term downward trends:
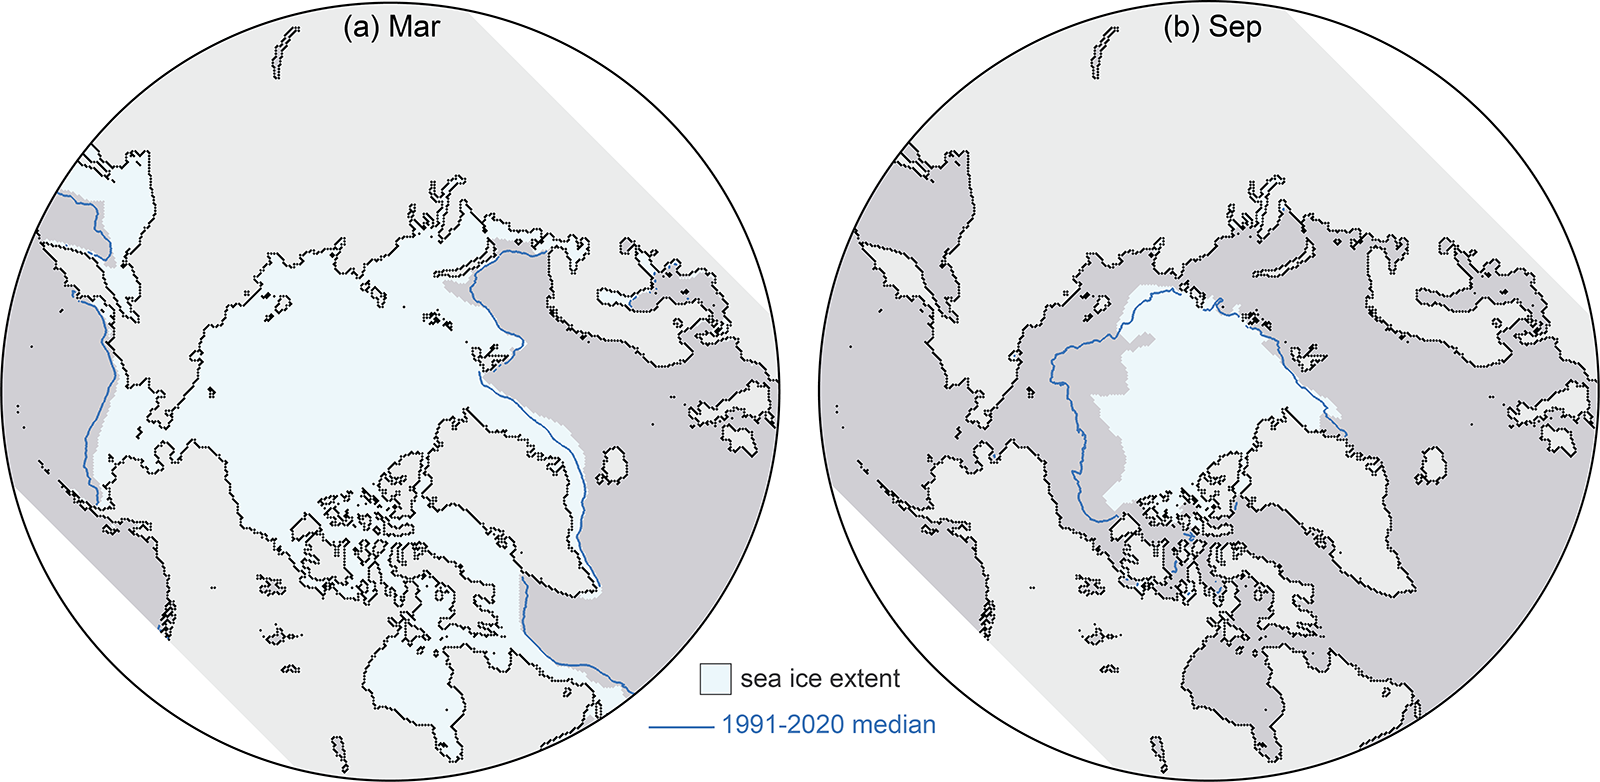
March 2023 was marked by low sea ice extent around most of the perimeter of the sea ice edge, with the exception of the East Greenland Sea where extent was near normal. At the beginning of the melt season, ice retreat was initially fairly slow through April. In May and June, retreat increased to a near-average rate, and then accelerated further through July and August. By mid-July, the ice had retreated from much of the Alaskan and eastern Siberian coast and Hudson Bay had nearly melted out completely. In August, sea ice retreat was particularly pronounced on the Pacific side, opening up vast areas of the Beaufort, Chukchi, and East Siberian Seas. Summer extent remained closer to average on the Atlantic side, in the Laptev, Kara, and Barents Seas
The Northern Sea Route, along the northern Russian coast, was relatively slow to open as sea ice extended to the coast in the eastern Kara Sea and the East Siberian Sea, but by late August, open water was found along the coast through the entire route. The Northwest Passage through the Canadian Archipelago became relatively clear of ice, though ice continued to largely block the western end of the northern route through M’Clure Strait through the melt season. Nonetheless, summer 2023 extent in the Passage was among the lowest observed in the satellite record, based on Canadian Ice Service ice charts.
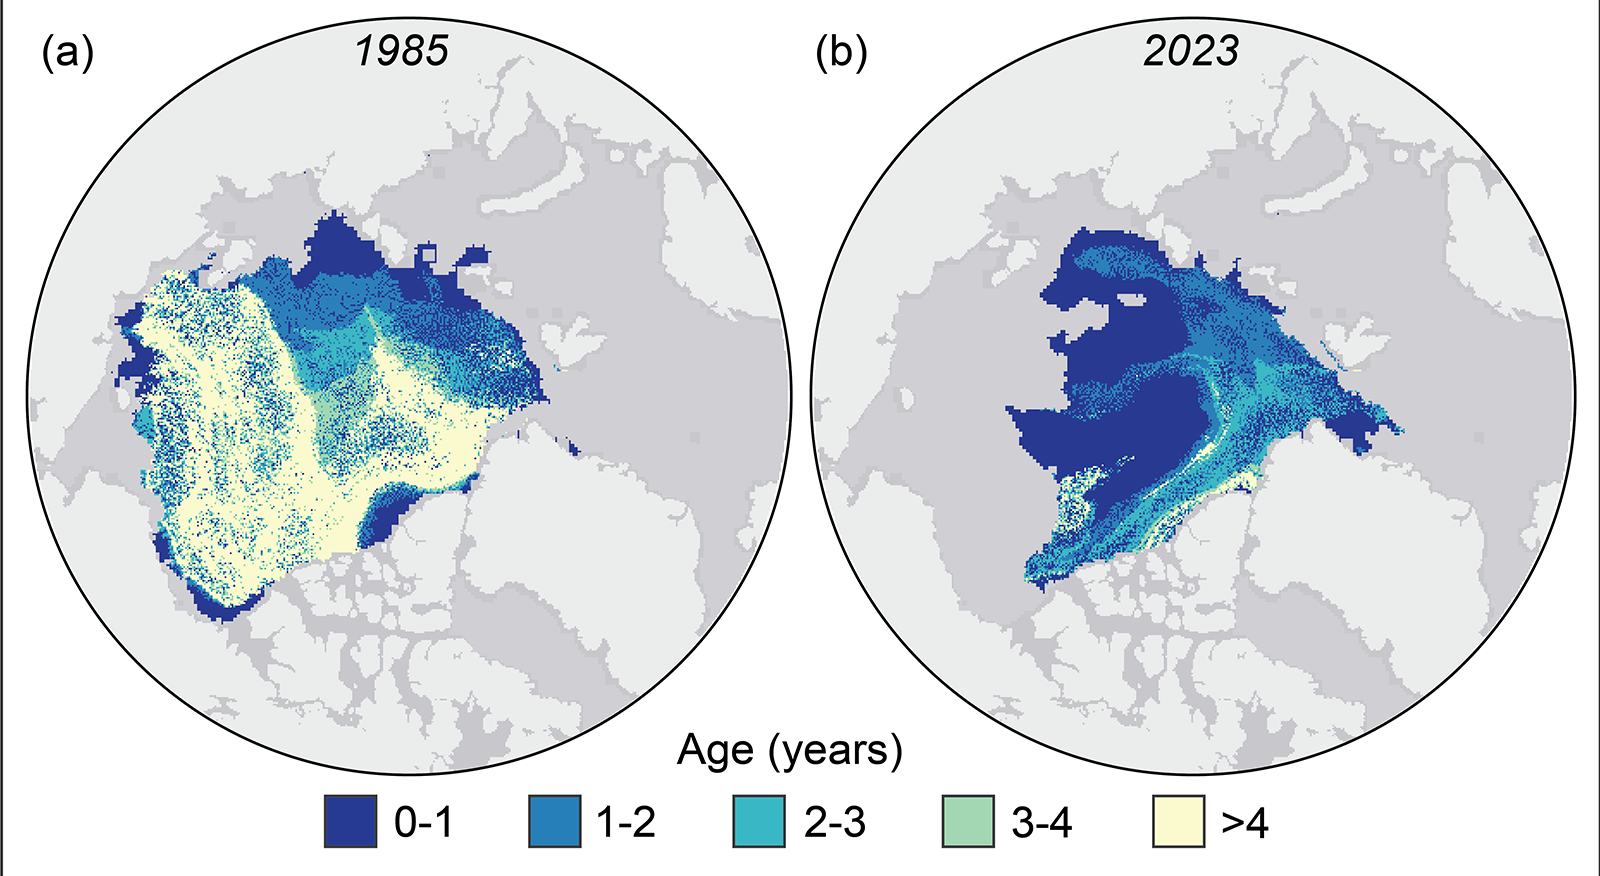
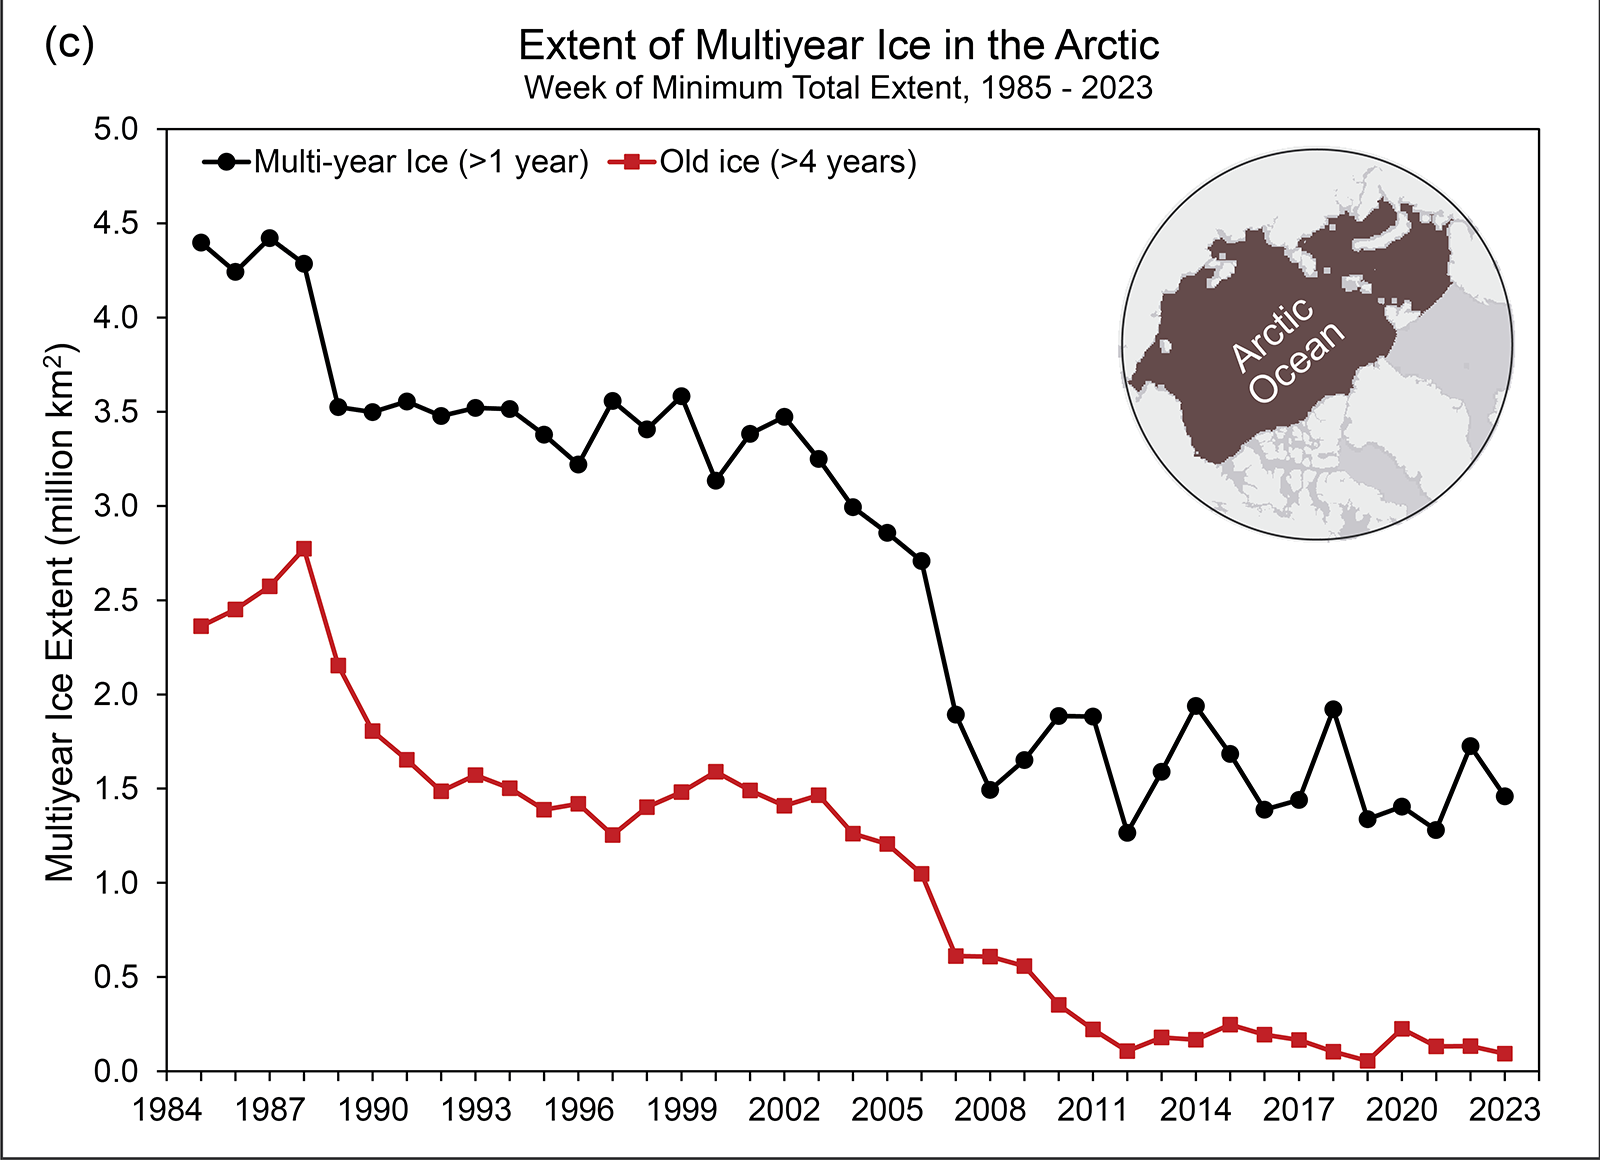
Tracking the motion of ice in passive microwave imagery using feature tracking algorithms can be used to infer sea ice age. Age is a proxy for ice thickness because multiyear ice generally grows thicker through successive winter periods. Multiyear ice extent has shown interannual oscillations but no clear trend since 2007, reflecting variability in the summer sea ice melt and export out of the Arctic. After a year when substantial multiyear ice is lost, a much larger area of first-year ice generally takes its place. Some of this first-year ice can persist through the following summer, contributing to the replenishment of the multiyear ice extent:
However, old ice (here defined as >4 years old) has remained consistently low since 2012. Thus, unlike in earlier decades, multiyear ice does not remain in the Arctic for many years. At the end of the summer 2023 melt season, multiyear ice extent was similar to 2022 values, far below multiyear extents in the 1980s and 1990s:
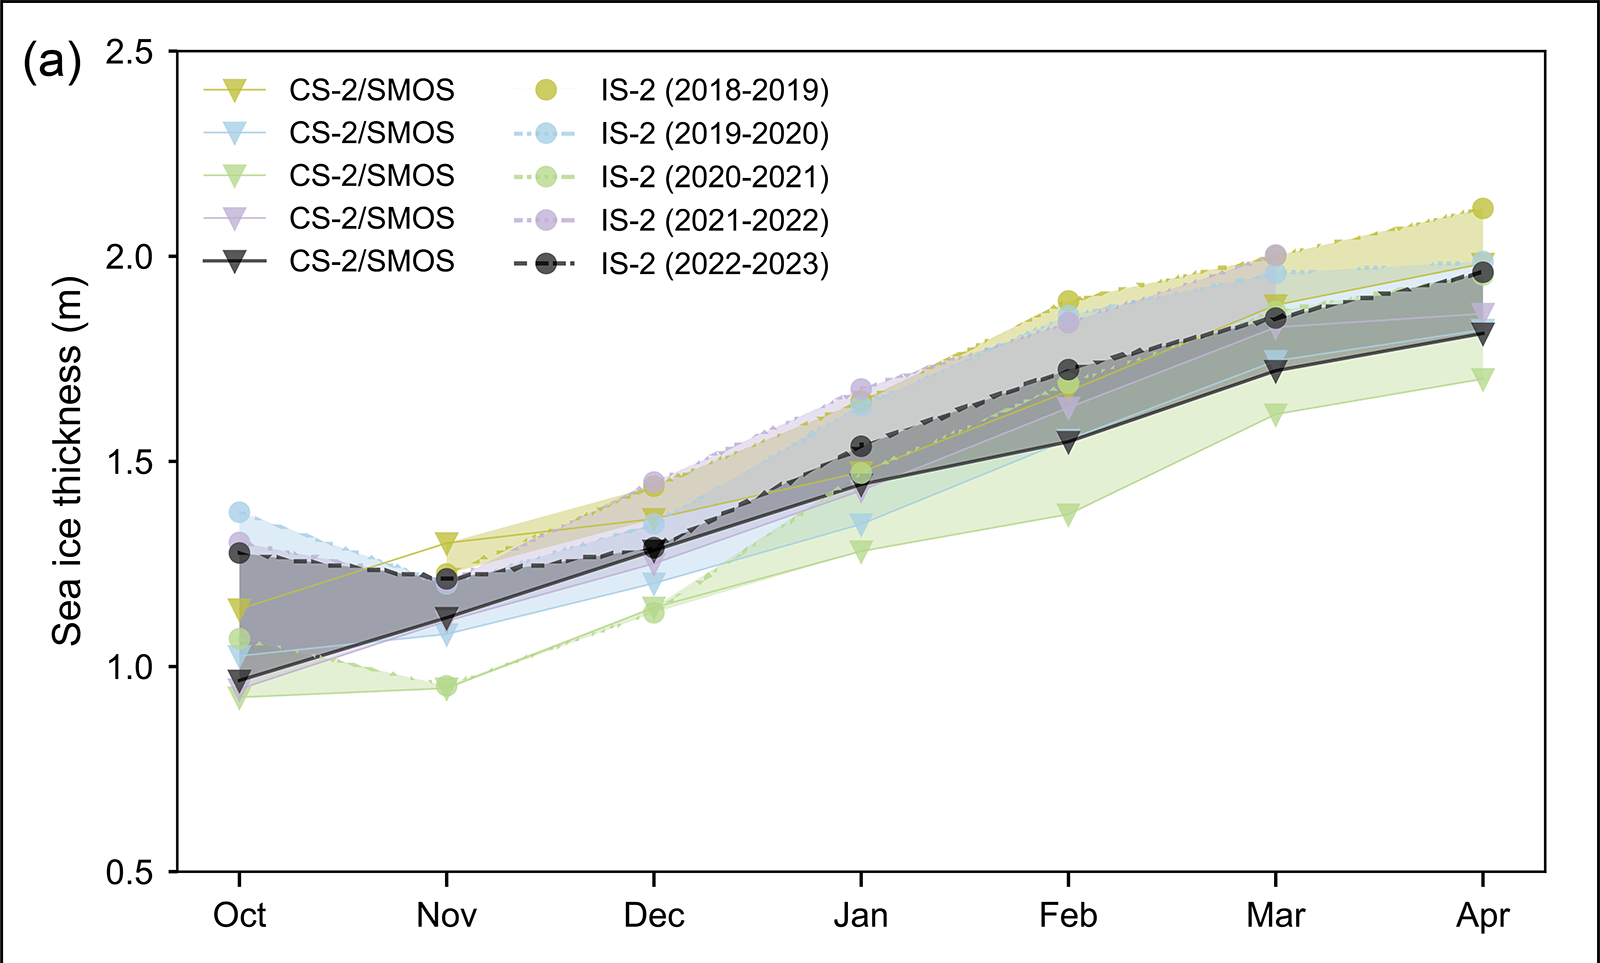
Estimates of sea ice thickness from satellite altimetry can be used to more directly track this important metric of sea ice conditions, although the data record is shorter than for extent and ice age. Data from ICESat-2 and CryoSat-2/SMOS satellite products tracking the seasonal October to April winter ice growth over the past four years (when all missions have been in operation) show a mean thickness generally thinner than the 2021/22 winter but with seasonal growth typical of recent winters:
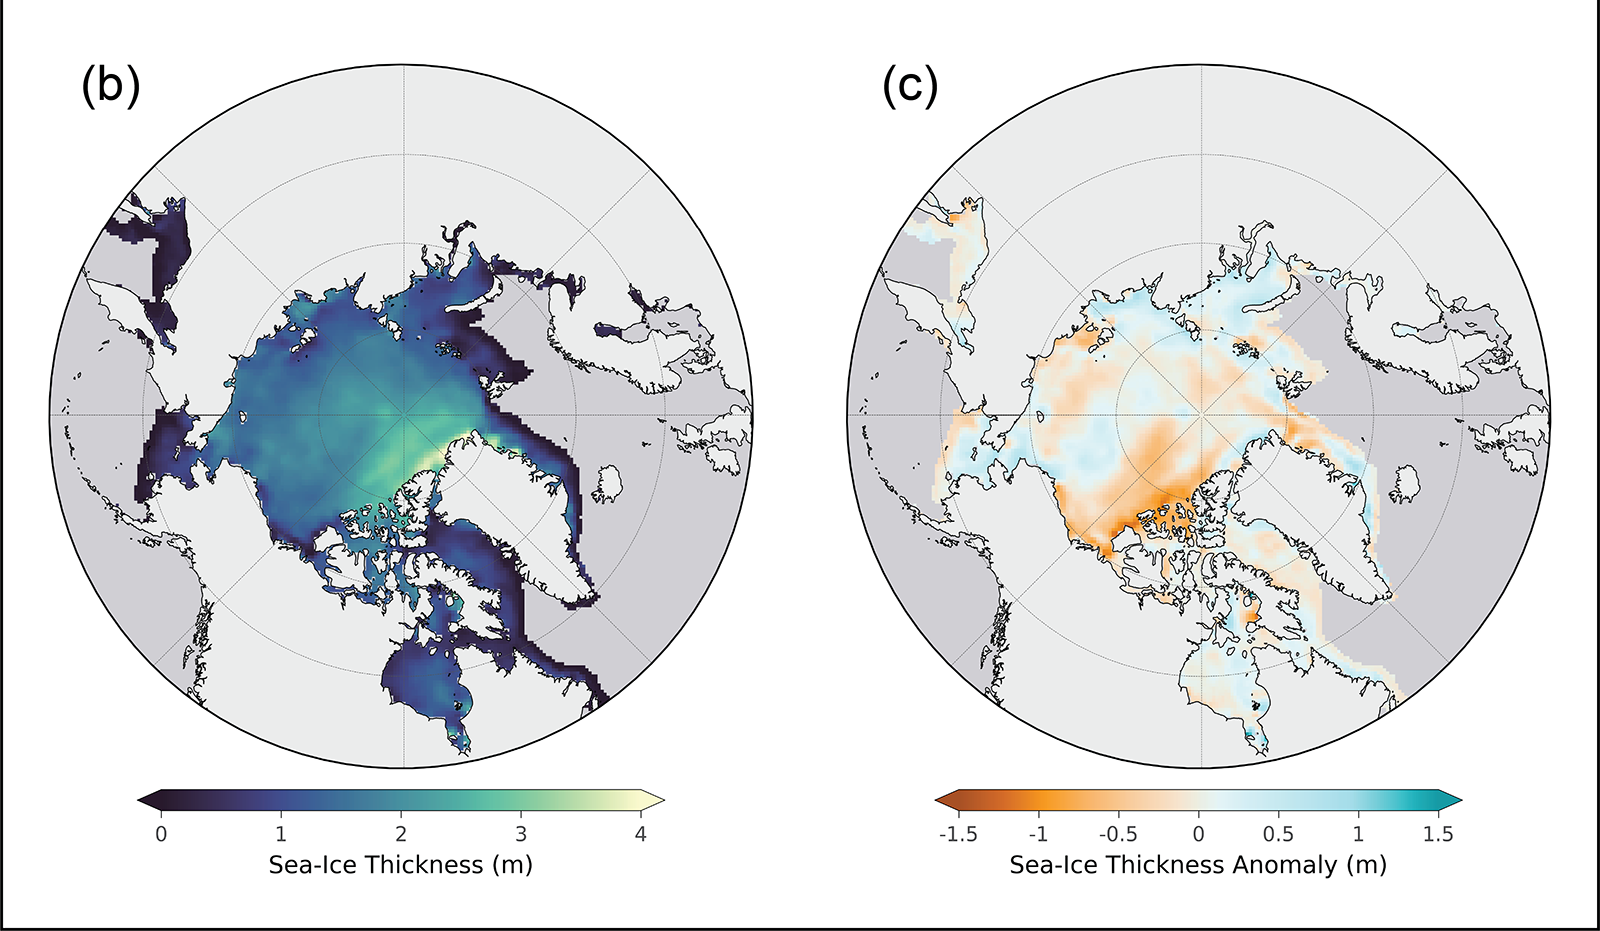
April 2023 thickness from CryoSat-2/SMOS relative to the 2011-22 April mean shows that the eastern Beaufort Sea and the East Siberian Sea had relatively thinner sea ice than the 2011-22 mean, particularly near the Canadian Archipelago. Thickness was higher than average in much of the Laptev and Kara Seas and along the west and northwest coast of Alaska, extending northward toward the pole. The East Greenland Sea had a mixture of thicker and thinner than average ice:
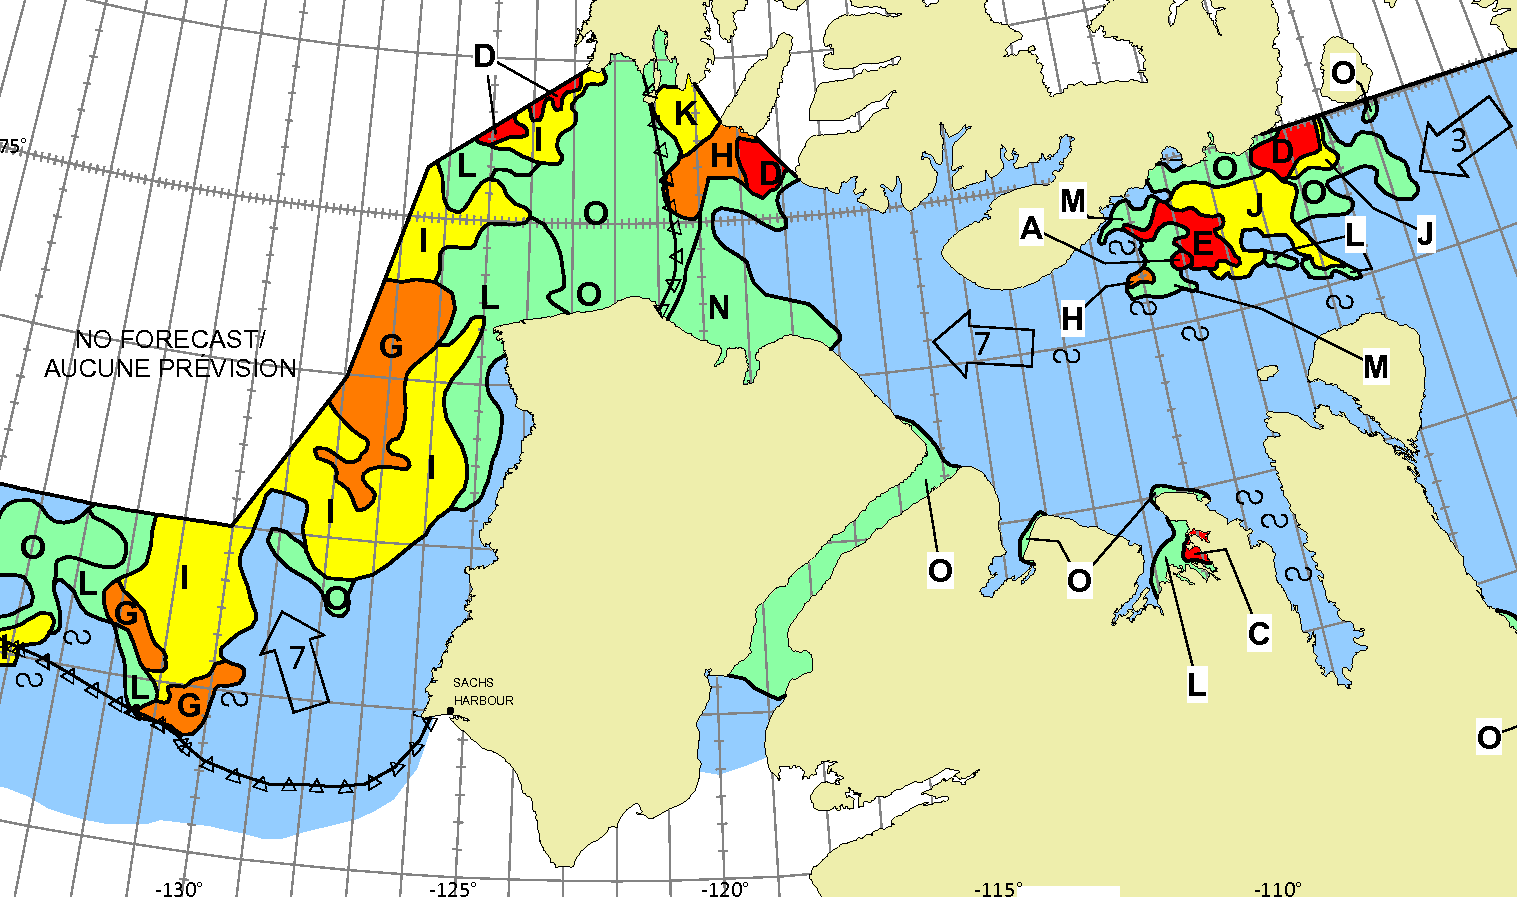
An excellent analysis (IMHO!), but I do have one quibble. I was following events in the Northwest Passage very closely last summer, and according to the Canadian Ice Service on September 1st:
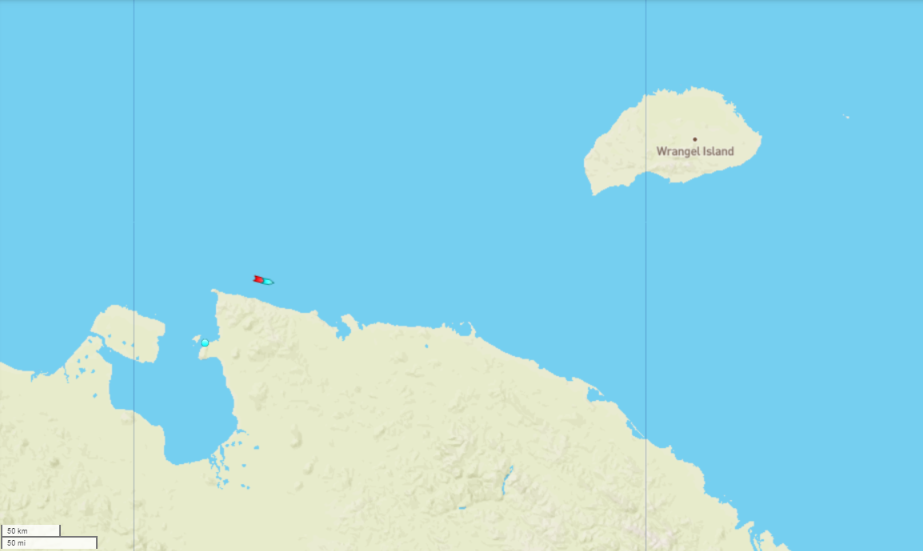
Data from the Northern Sea Route General Administration web site about the current positions of ships voyaging along the Northern Sea Route reveal that the liquified natural gas carrier Fedor Litke is currently following the icebreaker Sibir through the East Siberian Sea, heading for the Bering Strait:
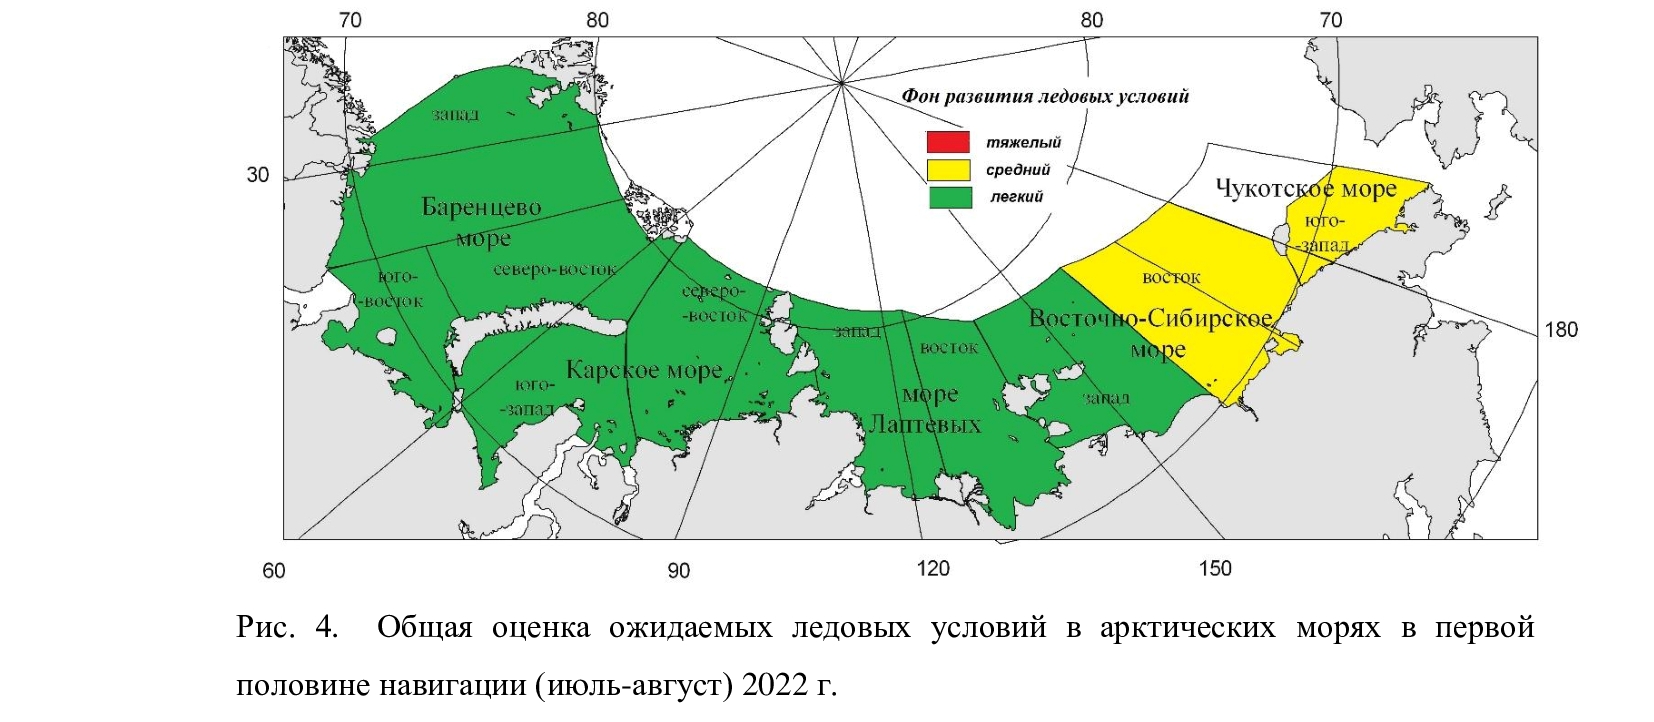
On June 17th the Northern Sea Route Administration published the Arctic and Antarctic Research Institute forecast of ice conditions for June to August 2022. Here’s the summary:
“Favorable” conditions in most areas, but “average” in the eastern East Siberian Sea and south west Chukchi Sea.
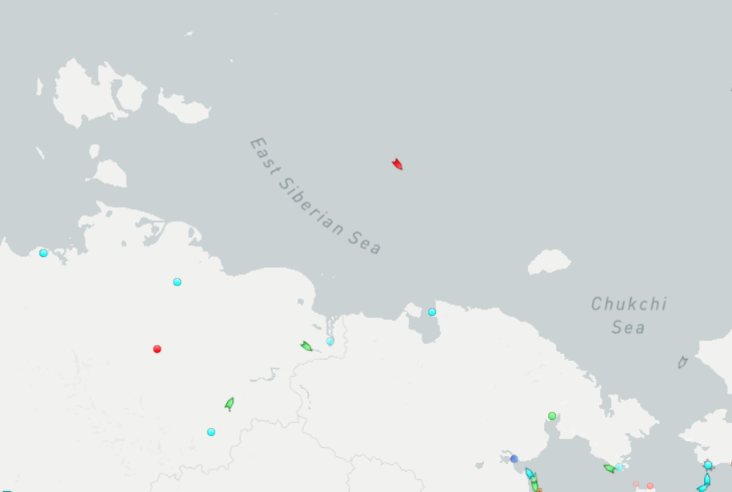
Traffic along the main Northern Sea Route has already begun. Marine Traffic reveals that the liquified natural gas carrier Nikolay Yevgenov is heading for the Bering Strait and has already sailed north of the New Siberian Islands. He is now entering the “average” ice area in the eastern ESS:
Meanwhile the recently commissioned nuclear powered icebreaker Sibir is patiently waiting in the Vilkitsky Strait:
The Northern Sea Route is evidently already “open” for ice hardened LNG tankers, but not yet for more conventional vessels. Here is the current AMSR2 sea ice concentration map:
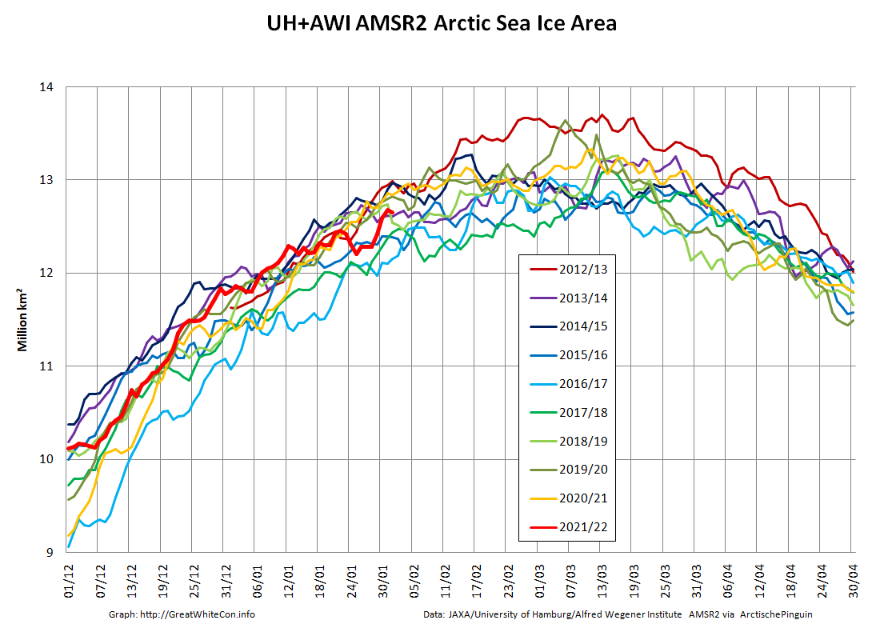
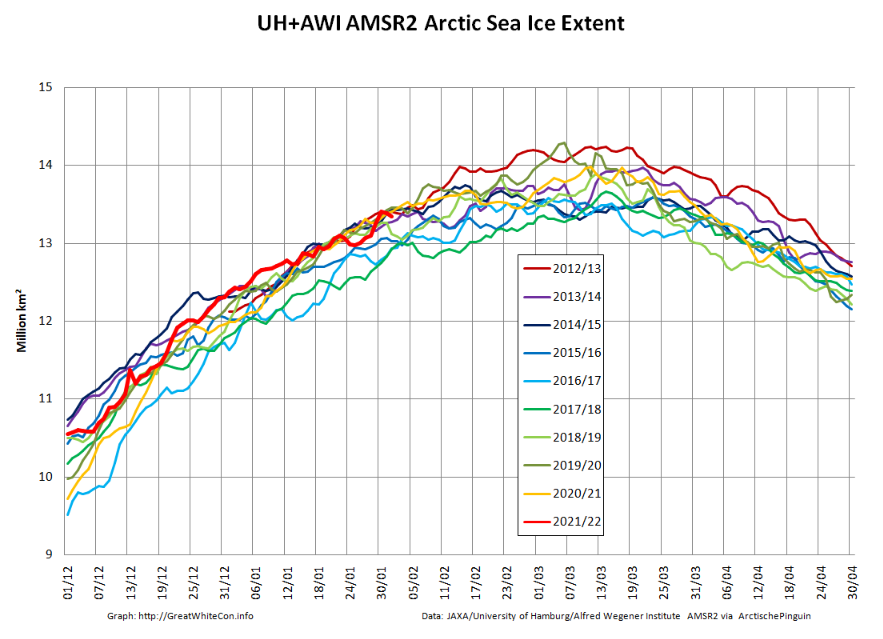
Following the “Great Arctic Winter Cyclone” towards the end of January, here are the latest high resolution AMSR2 area and extent graphs:
The sudden reduction in sea ice area due to the cyclone is very apparent, as is the subsequent refreeze of the affected area. Here’s an animation of AMSR2 concentration revealing more detail:
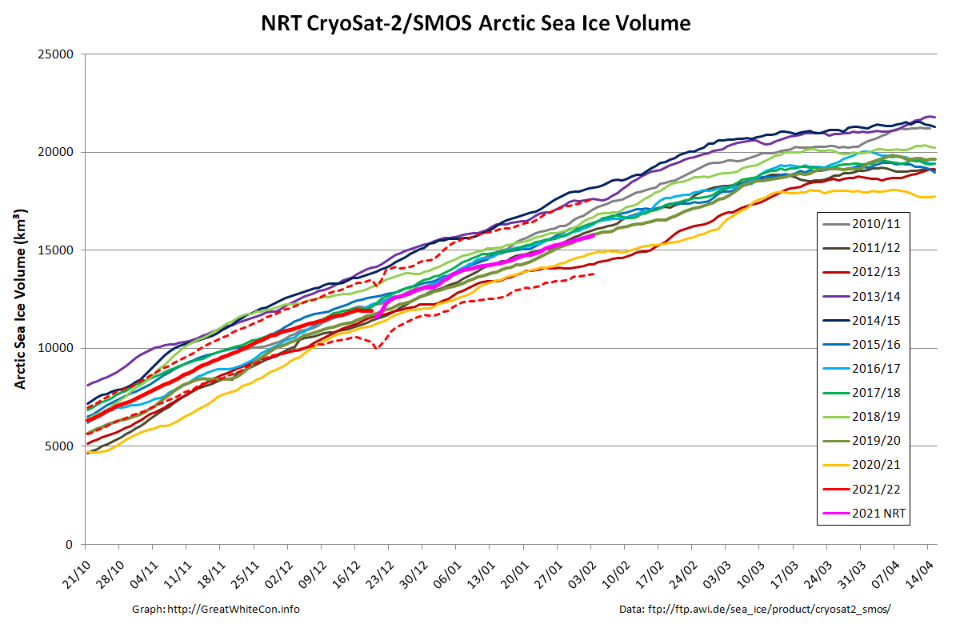
Here too is the latest AWI CryoSat-2/SMOS Arctic sea ice volume graph:
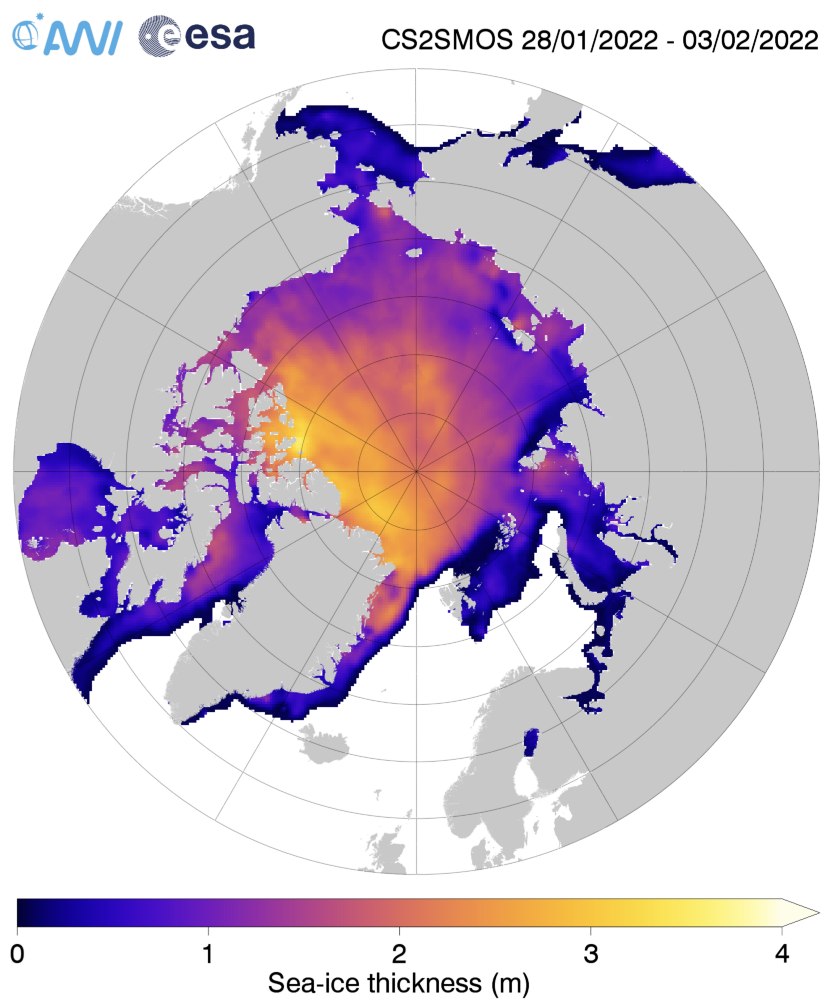
It doesn’t reveal a similar “blip” towards the end of January, suggesting that reduction in area was due to compaction rather than melt. The current AWI thickness map shows the freshly formed ice north east of Svalbard is still very thin:
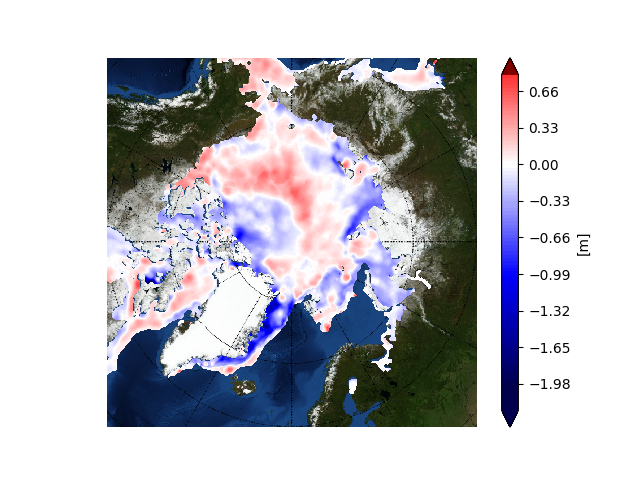
The latest thickness anomaly map from the Finnish Meteorological Institute shows that the ice which was exported from the Central Arctic via the Fram Strait is nevertheless still anomalously thin, although there is now an area of thicker ice north of Greenland:
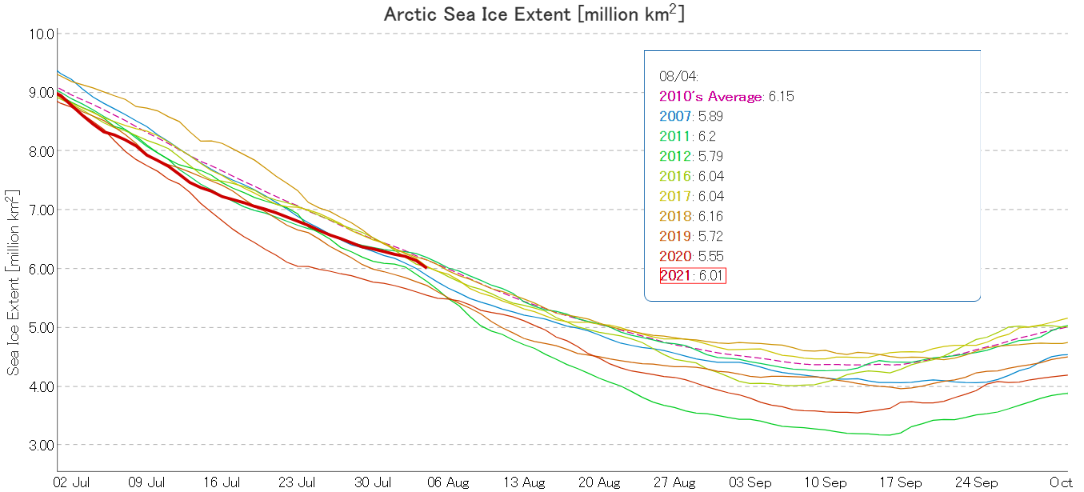
Let’s first of all take a look at JAXA’s flavour of Arctic sea ice extent:
After reaching lowest extent for the date in early July, the weather in the Arctic Basin was stormy, cloudy and cool compared to other recent years until the last few days of the month:
Here’s the same period in 2020 for comparison purposes:
Consequently the rate of extent loss in the second half of July was significantly less than last year.
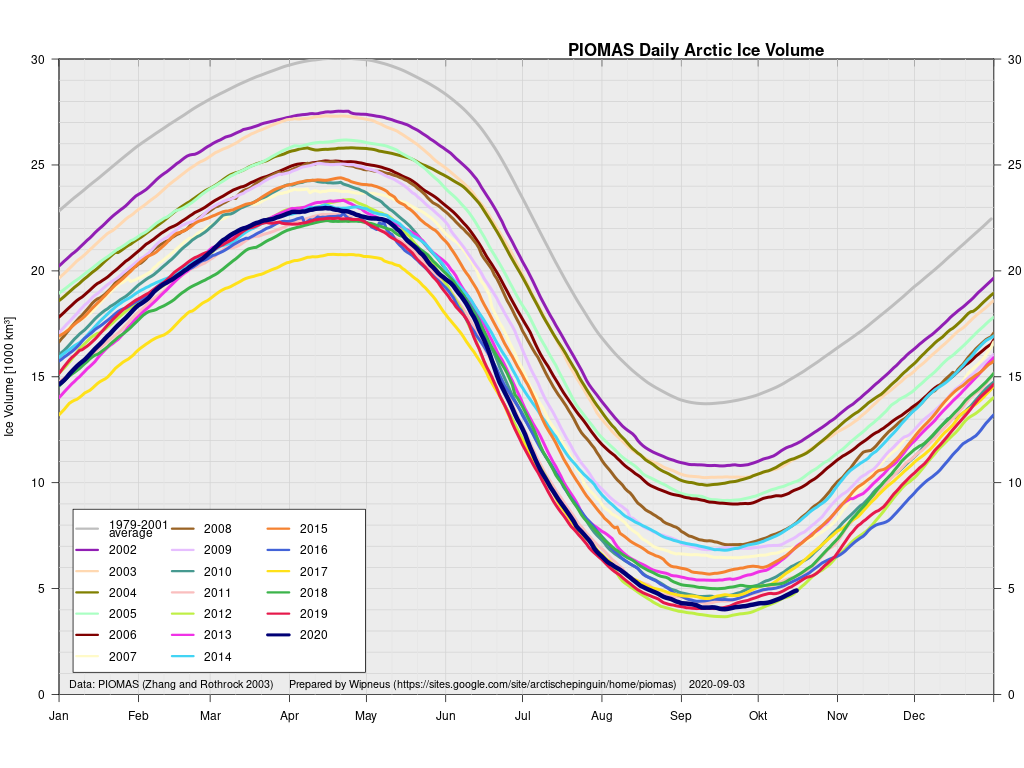
Let’s start this somewhat belated article by looking at Arctic sea ice volume. The mid month PIOMAS gridded thickness numbers have been released to reveal these volume graphs:
Minimum volume for 2021 was 4.03 thousand km3 on September 17th, 2nd lowest in the PSC record.
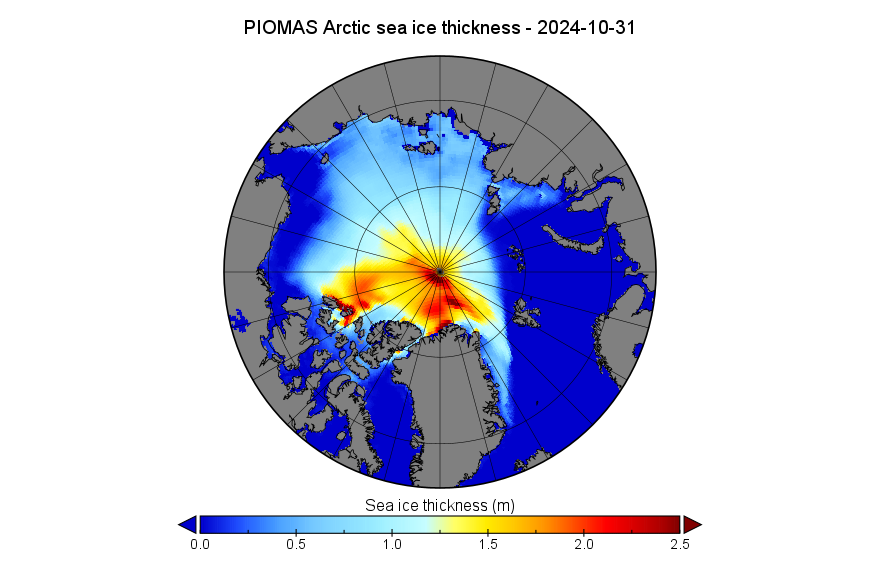
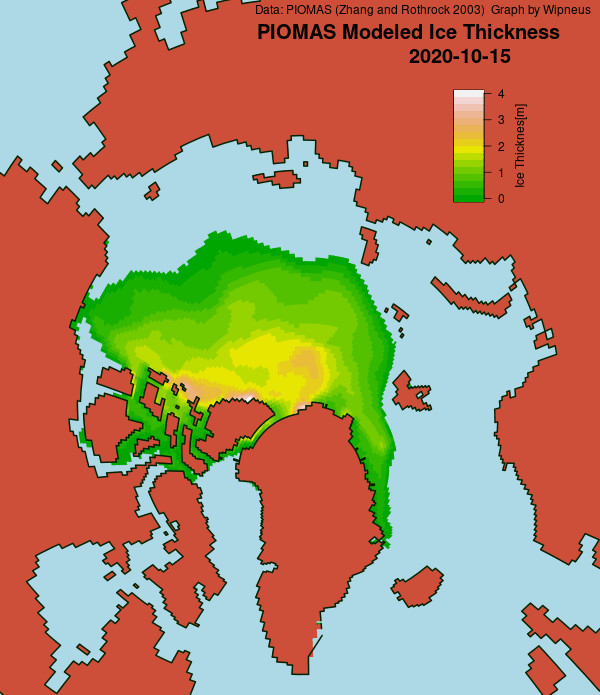
Modelled volume is now in a “statistical tie” with 2012 for lowest on record for mid October. Here too is the PIOMAS thickness map:
Meanwhile for comparison purposes here is the first merged Cryosat-2/SMOS thickness map of the 2020/21 freezing season, hot off the presses at the Alfred Wegener Institute:
This website uses cookies to improve your experience. We'll assume you're ok with this, but you can opt-out if you wish. Cookie settingsACCEPT
Privacy & Cookies Policy
Privacy Overview
This website uses cookies to improve your experience while you navigate through the website. Out of these, the cookies that are categorized as necessary are stored on your browser as they are essential for the working of basic functionalities of the website. We also use third-party cookies that help us analyze and understand how you use this website. These cookies will be stored in your browser only with your consent. You also have the option to opt-out of these cookies. But opting out of some of these cookies may affect your browsing experience.
Necessary cookies are absolutely essential for the website to function properly. This category only includes cookies that ensures basic functionalities and security features of the website. These cookies do not store any personal information.
Any cookies that may not be particularly necessary for the website to function and is used specifically to collect user personal data via analytics, ads, other embedded contents are termed as non-necessary cookies. It is mandatory to procure user consent prior to running these cookies on your website.