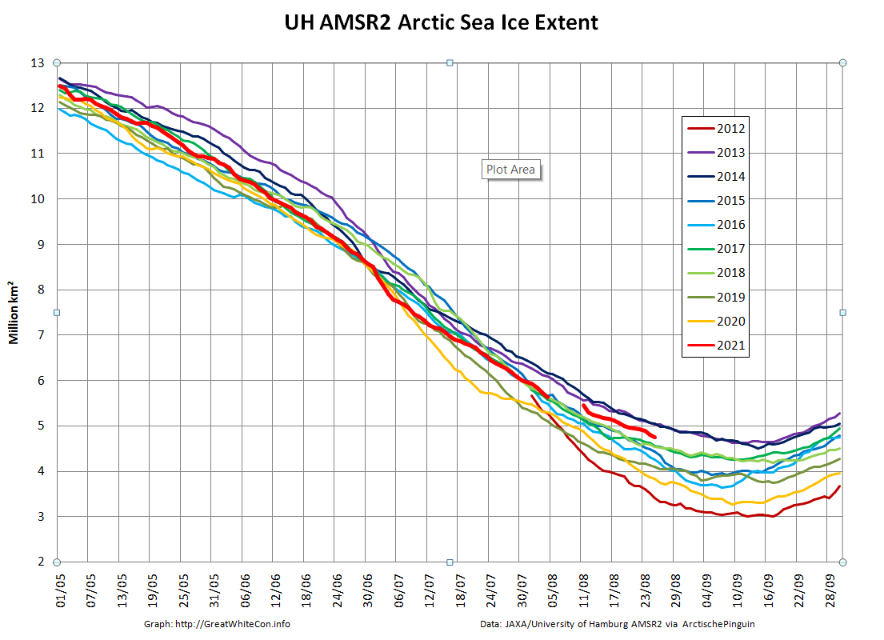
Let’s first of all take a look at JAXA’s flavour of Arctic sea ice extent:
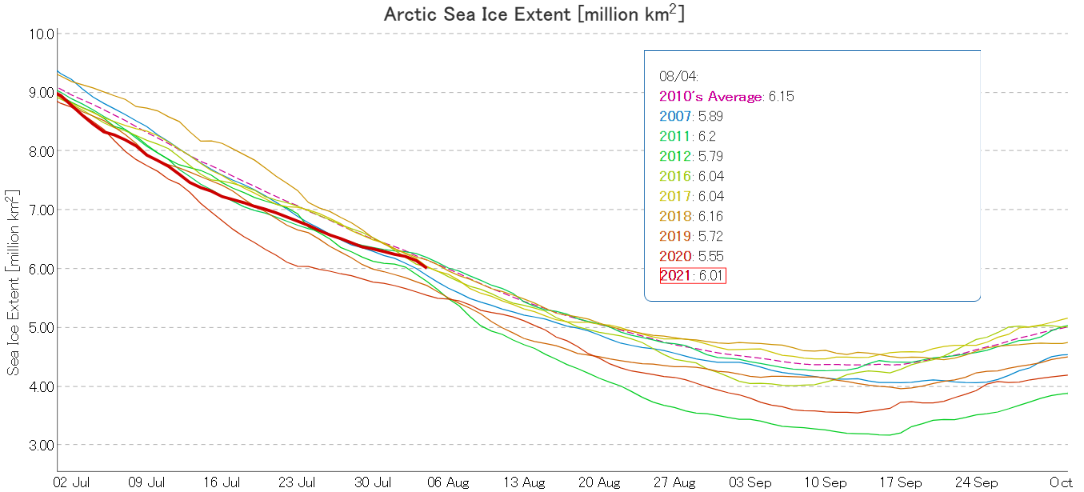
After reaching lowest extent for the date in early July, the weather in the Arctic Basin was stormy, cloudy and cool compared to other recent years until the last few days of the month:
Here’s the same period in 2020 for comparison purposes:
Consequently the rate of extent loss in the second half of July was significantly less than last year.
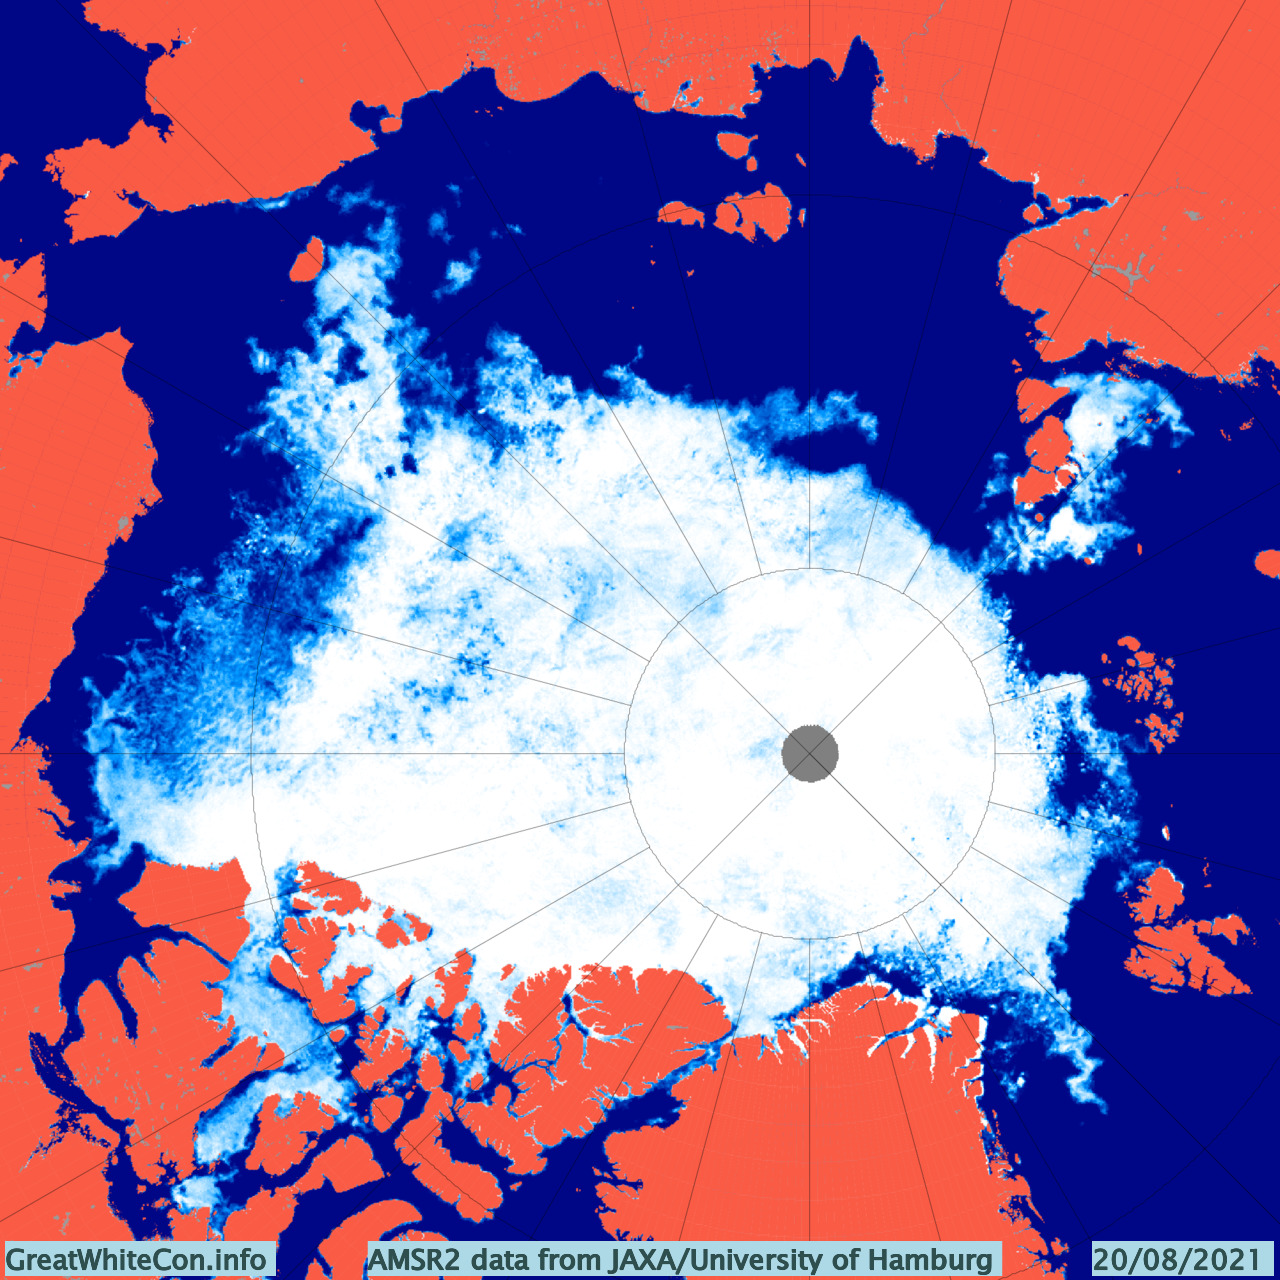
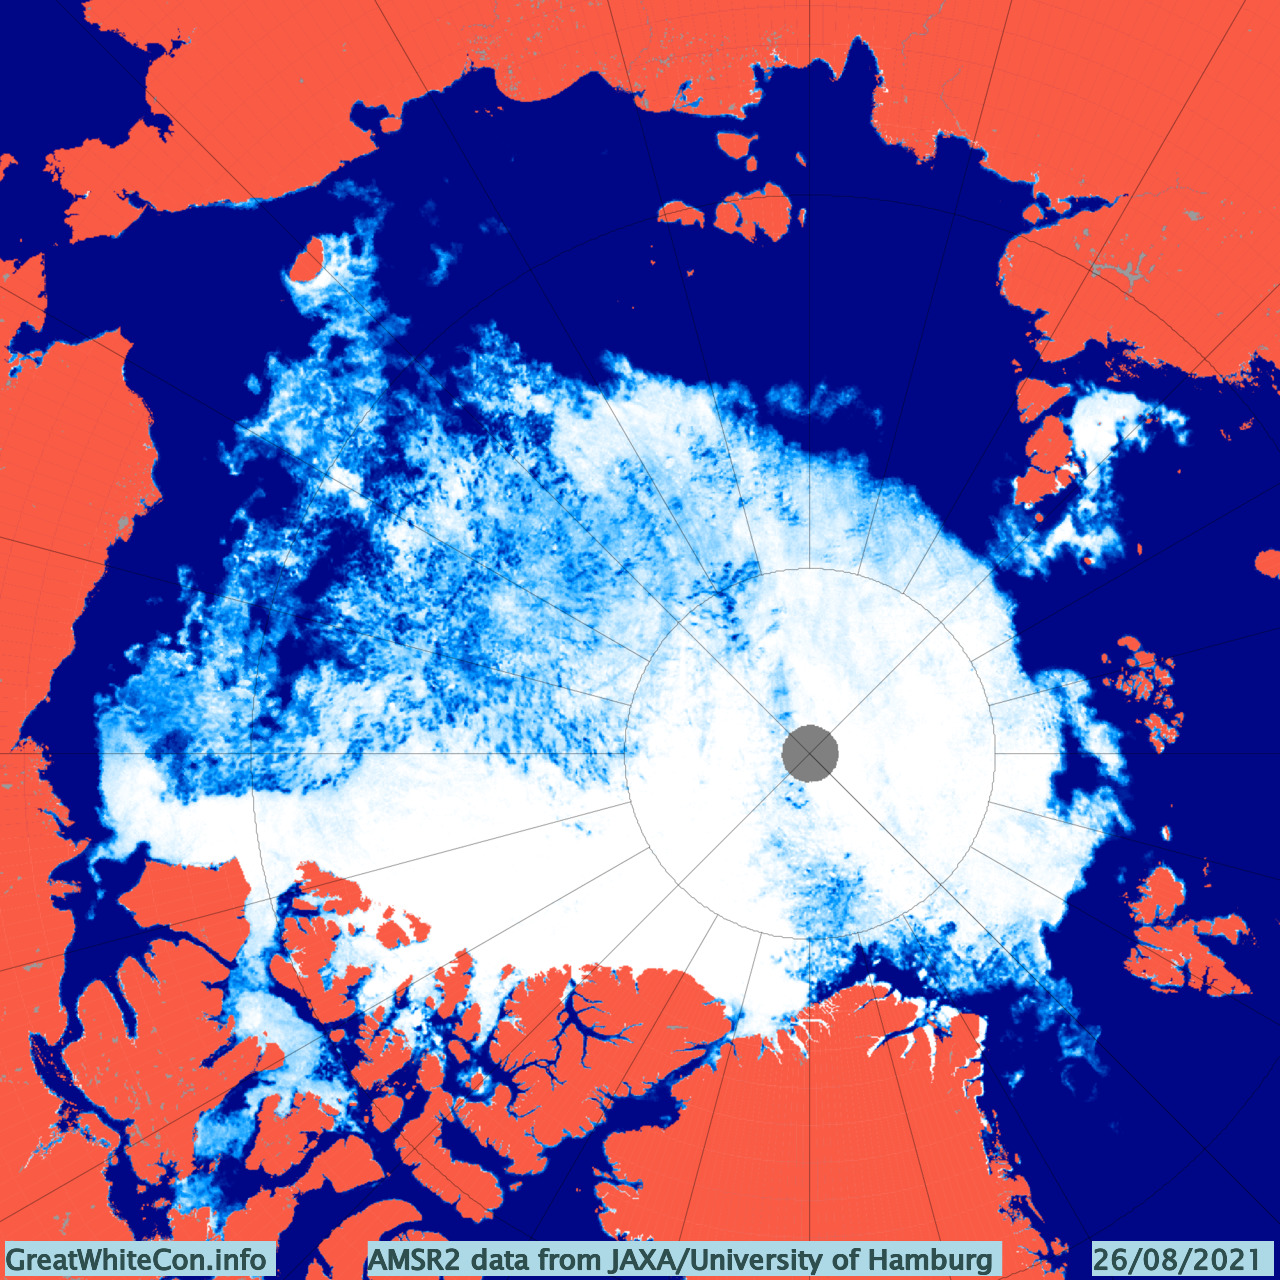
Next let’s take a look at AMSR2 concentration:
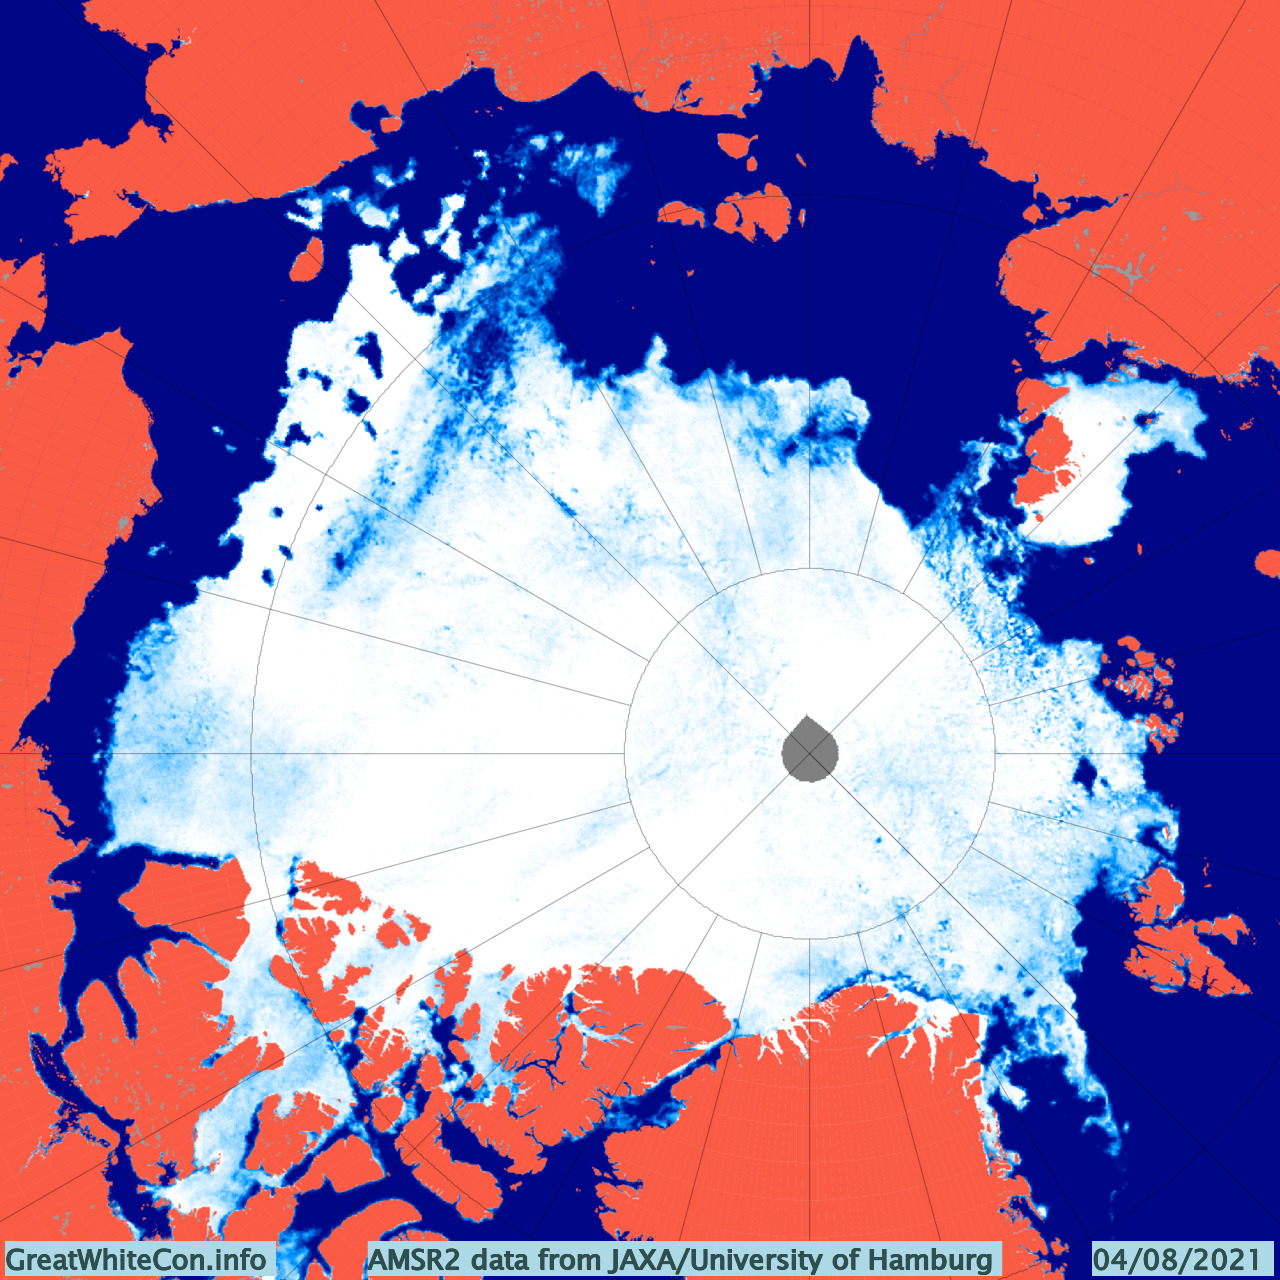
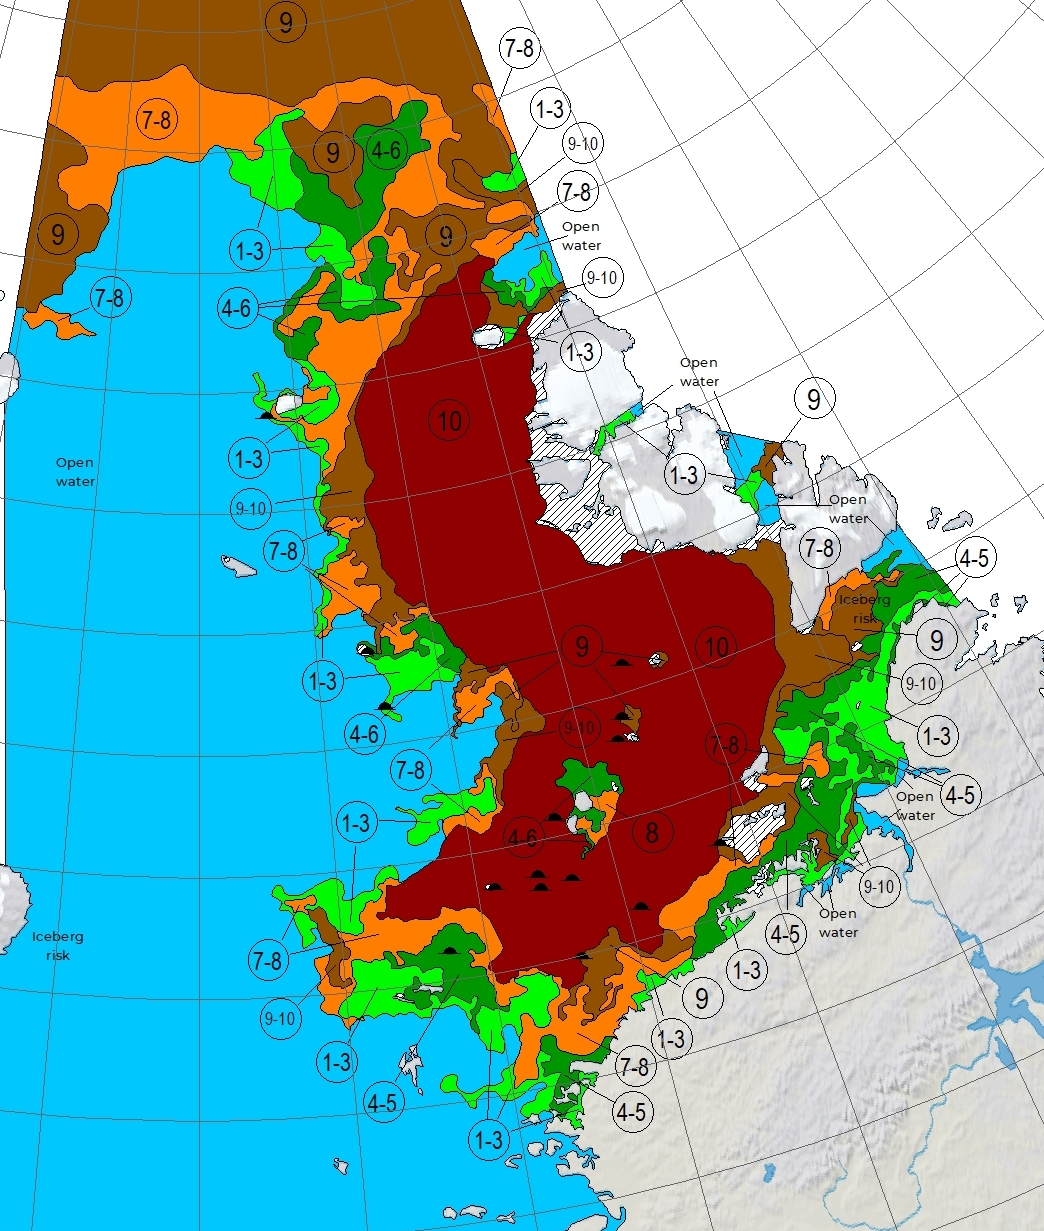
There is still a stubborn patch of ice in the north east Kara Sea. Although AMSR2 suggests that there is now an ice free route through the Northern Sea Route, that has yet to be confirmed by the official Russian maps. This extract is dated August 3rd:
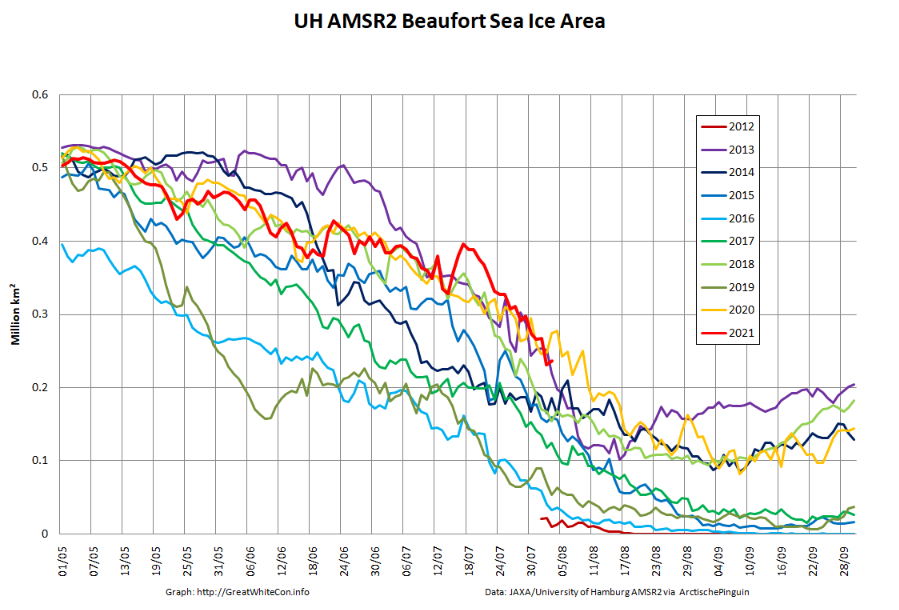
On the other side of the Arctic a large amount of multi-year ice was advected into the Beaufort Sea over the winter:
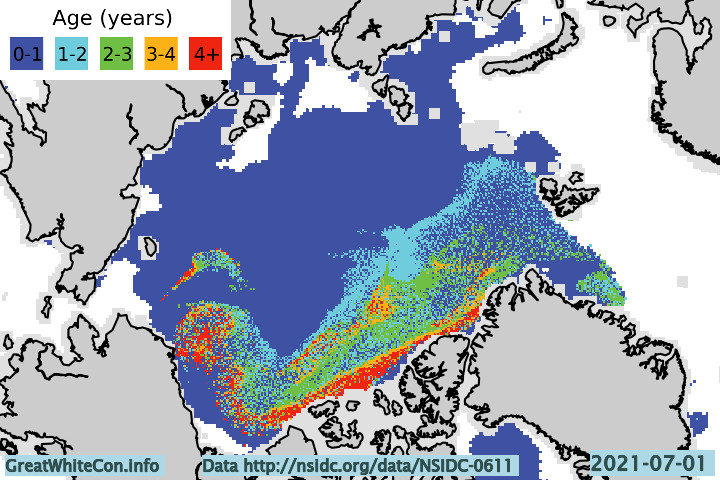
Consequently the melt has been slow so far this summer:
Here’s an image revealing how the 2021 melting season is going on the Pacific side of the Arctic, which displays sea ice thickness and temperature as measured by an ice mass balance buoy currently located at 75.15 N, 167.88 W:

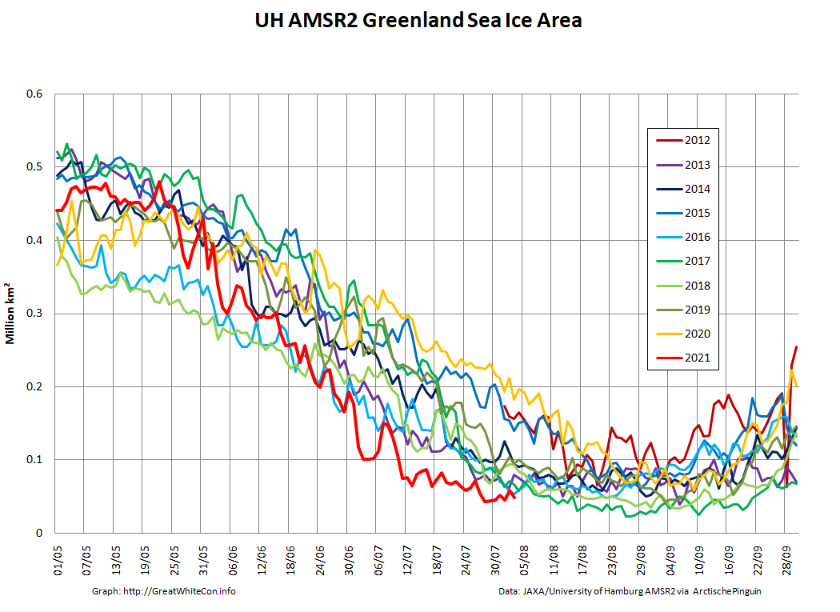
Conversely much of sea ice that was exported from the Central Arctic towards the North Atlantic over the winter has already melted out:
Two recent academic journal paper address those facts. According to “Record winter winds in 2020/21 drove exceptional Arctic sea ice transport” by Robbie Mallett et al.:
Winter 2020/21 was characterised by anomalously high sea-level pressure over the central Arctic Ocean, which resulted in unprecedented anticyclonic winds over the sea ice. This atmospheric circulation pattern drove older sea ice from the central Arctic Ocean into the lower-latitude Beaufort Sea, where it is more vulnerable to melting in the coming warm season. We suggest that this unusual atmospheric circulation may potentially lead to unusually high summer losses of the Arctic’s remaining store of old ice.
whilst according to “Accelerated sea ice loss in the Wandel Sea points to a change in the Arctic’s Last Ice Area” by Axel Schweiger et al.:
The Arctic Ocean’s Wandel Sea is the easternmost sector of the Last Ice Area, where thick, old sea ice is expected to endure longer than elsewhere. Nevertheless, in August 2020 the area experienced record-low sea ice concentration. Here we use satellite data and sea ice model experiments to determine what caused this record sea ice minimum. In our simulations there was a multi-year sea-ice thinning trend due to climate change. Natural climate variability expressed as wind-forced ice advection and subsequent melt added to this trend. In spring 2020, the Wandel Sea had a mixture of both thin and—unusual for recent years—thick ice, but this thick ice was not sufficiently widespread to prevent the summer sea ice concentration minimum. With continued thinning, more frequent low summer sea ice events are expected. We suggest that the Last Ice Area, an important refuge for ice-dependent species, is less resilient to warming than previously thought.
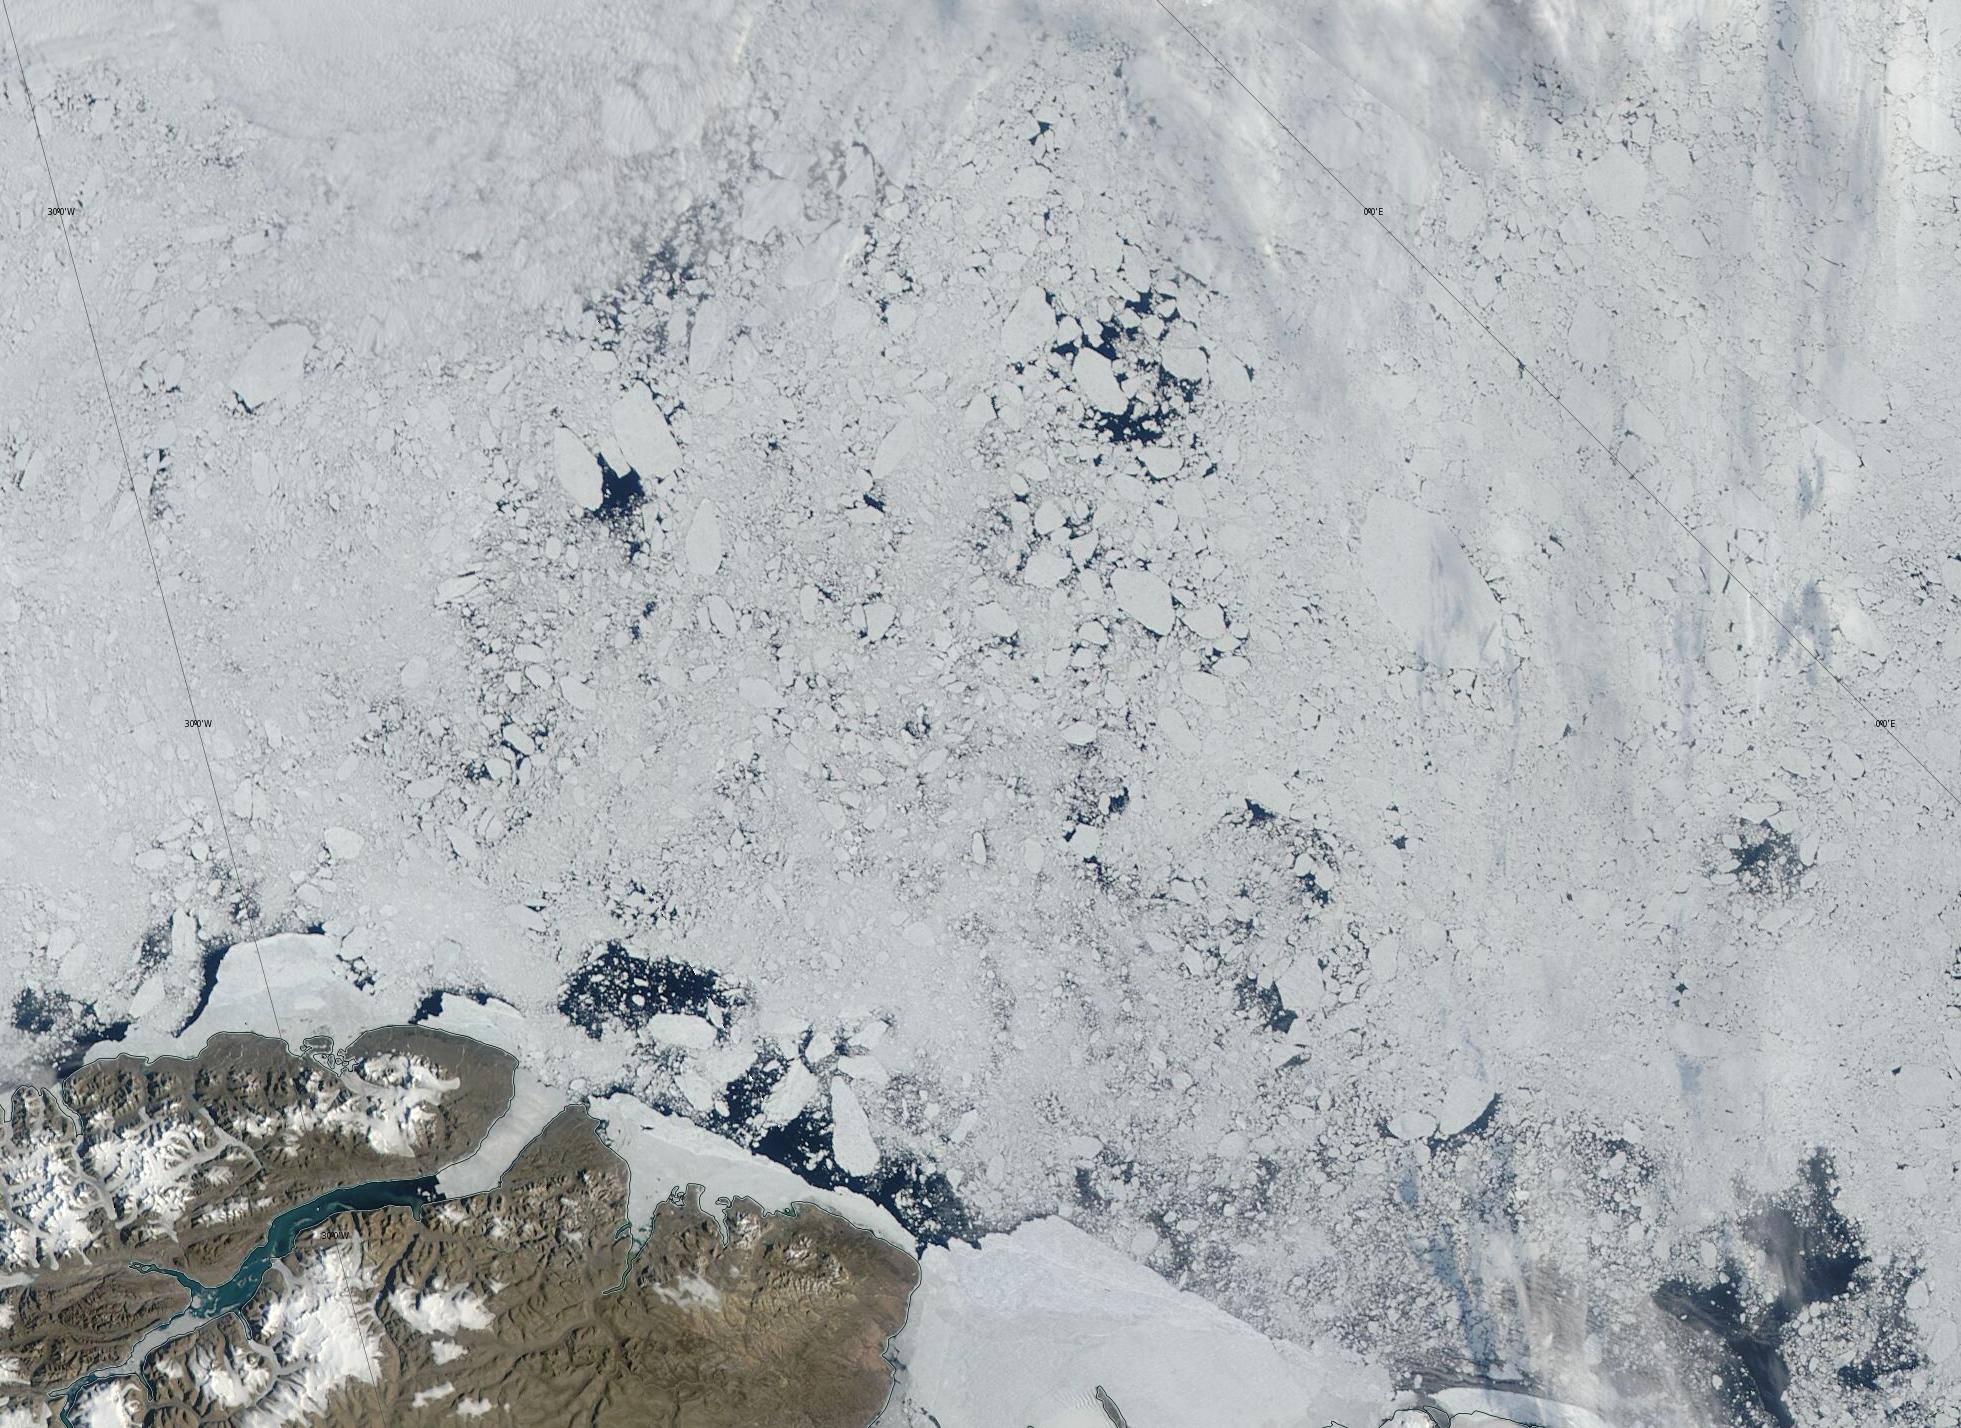
Much the same thing seems to be happening once again in 2021. Here’s a satellite image of the sea ice in the Wandel Sea on August 3rd:
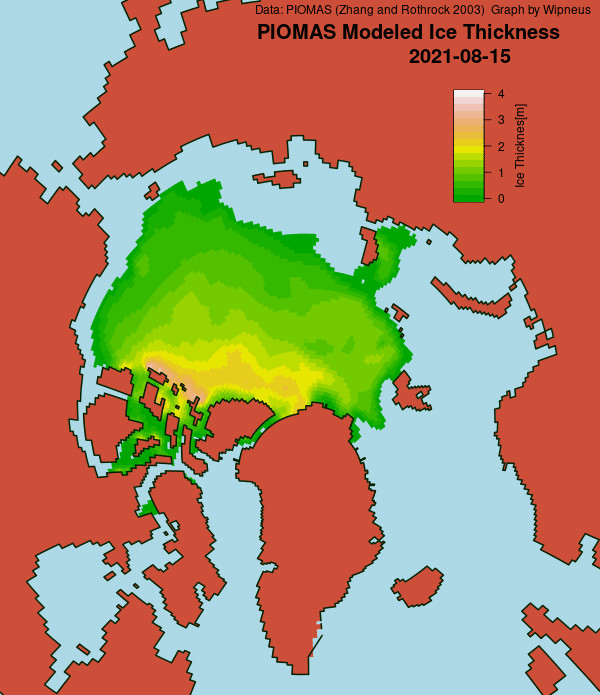
Finally, for the moment at least, here is the latest PIOMAS thickness map:
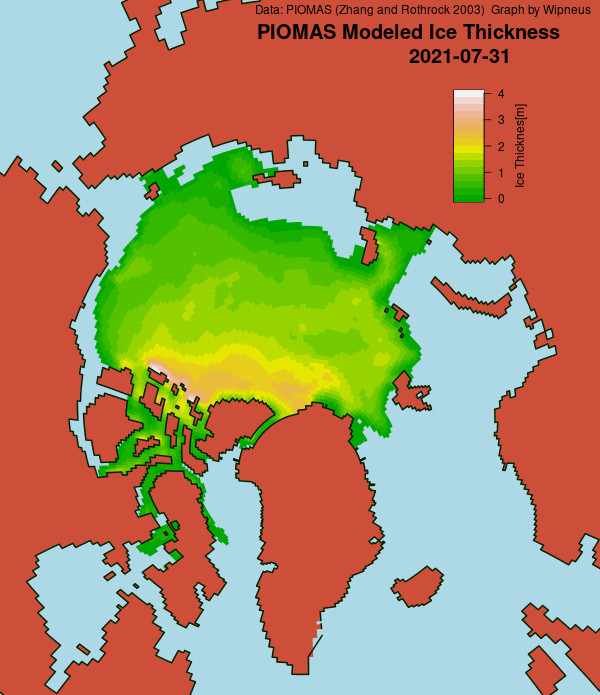
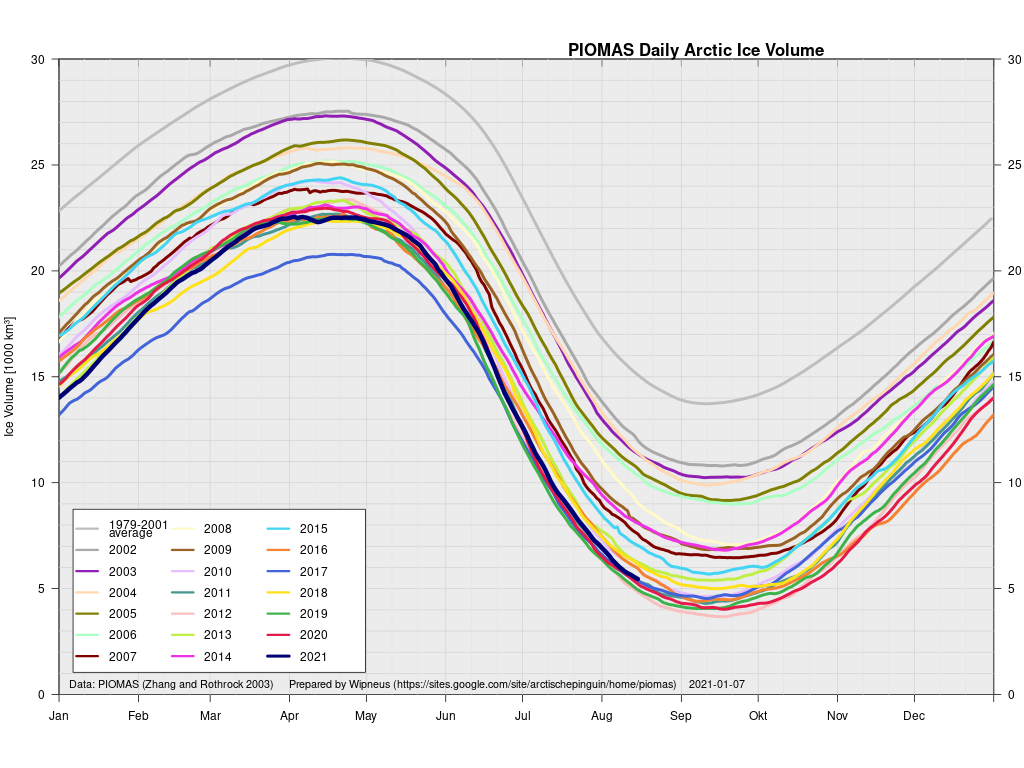
and volume graph, courtesy of Wipneus on the Arctic Sea Ice Forum:

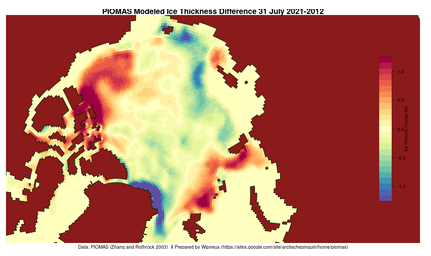
The PIOMAS model shows volume as sixth lowest at the end of July, at 7,057 km³. It also confirms the current lack of thick ice in the Wandel Sea, with the thickest remaining ice now concentrated to the north of the Canadian Arctic Archipelago. Here’s a comparison of thickness with the same date in 2012, the year that went on to produce the lowest annual minimum Arctic sea ice extent and volume in the satellite era :
Here is the current CMEMS/neXtSIM Arctic sea ice concentration forecast for 23:30 on August 13th:
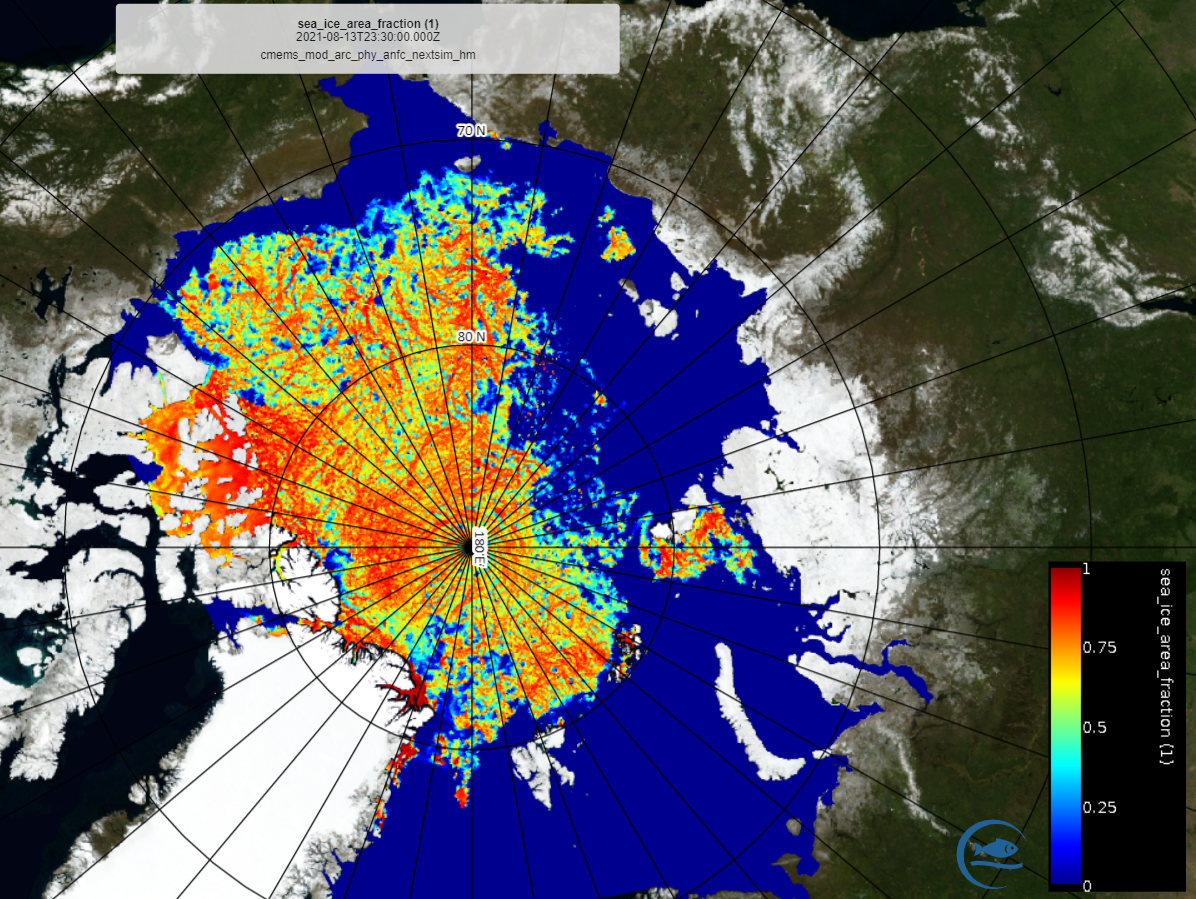
It will be very interesting to discover whether there is in fact open water all the way to 86° N in a weeks time.
[Edit – August 21st]The mid month PIOMAS gridded thickness numbers have been released:

With a month or so to go to the 2021 Arctic sea ice volume minimum, 2021 is currently 6th lowest in the PIOMAS record.
Here too is the latest AMSR2 concentration map, which reveals large areas of low concentration on the Pacific side of the Arctic:
It also reveals that despite the earlier CMEMS forecast open water has yet to reach 85 N, although the ice free area north of Greenland is heading that way.
[Edit – August 27th]As August draws to a close here’s another look at the recent history of the only remaining fully functional seasonal ice mass balance buoy in the Arctic, which is number 52460 currently located at 74.91 N, 166.39 W:
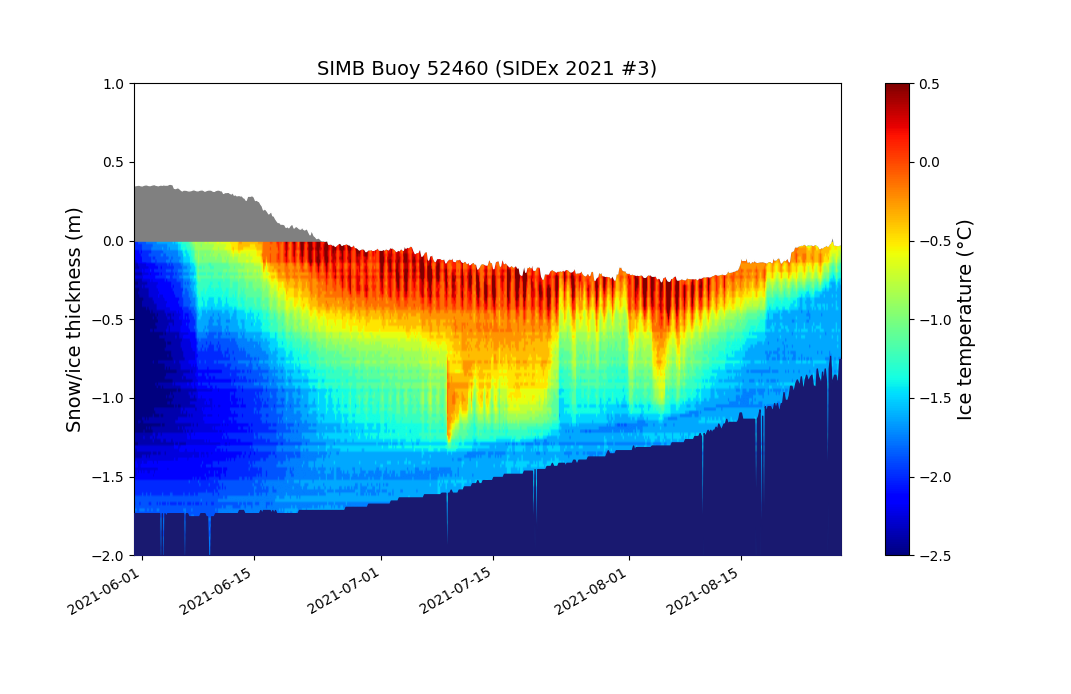
The ice surface appears to have been rising for a while, which means some snow has been falling, or the buoy has slipped in its mounting hole, or a combination of the two. The remaining thickness of fairly solid stuff is ~ 0.66 metres.
The latest AMSR2 concentration map reveals even more low concentration areas than a week ago, including one stretching from Kap Morris Jesup towards the North Pole:
High resolution Arctic sea ice extent appears to be gently declining towards the September minimum:
but a sudden dip in area reflects the low concentration areas visible in the map above:

Watch this space!
The August 6th update of the AARI Kara Sea ice concentration chart shows only a tiny stretch of 4-6/10 concentration along the coast. In my book that counts as “open” for the adventurous!
For the adventurous with a nuclear-powered icebreaker, maybe. For commercial shipping, I think not so much. How’s the Northwest Passage looking this year from your perspective?
The plucky little yacht Northabout would be able to get through that lot with ease. She coped with much worse at this time of year in 2016:
https://GreatWhiteCon.info/2016/08/northabout-meets-some-serious-sea-ice/
Non ice hardened commercial shipping would definitely want to wait a while longer, just in case the wind shifts unexpectedly! For my views on the Northwest Passage please see:
https://GreatWhiteCon.info/2021/05/the-northwest-passage-in-2021
Barring sudden shifts in the wind it won’t be long before it’s “open” for plucky little yachts. However due to Covid-19 restrictions there aren’t any in the vicinity this year.
It is Summer in Northern Hemisphere, therefore a lot of melting is expected.
I wonder why you did not see Greenland surface mass balance? Greenland is snowy and snow mass is above average on that graph!
Graph from nsidc.org’s greenland-today page.
I am not sure whether you are aware, but in the last decade there were many missions to Arctic in order to prove it is navigable and passages are ice-free and all of those expeditions turned out to meet ‘unexpected ice’…
You yourself said of unexpected ice in Greenland.
Plus, please talk about Antarctic ice because it is well over average, too! And these things don’t get mentioned here. I cannot understand why it is not mentioned total Earth ice mass balance is above recent average.
Where do you get your alleged “facts” from Mountaineer?
I also wonder why you didn’t mention Greenland total ice mass balance? As discussed here recently, and here’s a graph thereof:
FYI, here too is an up to date 2021 Greenland SMB graph:
Did you miss the reference to a successful Arctic circumnavigation by a small yacht via the Northern Sea Route and Northwest Passage in the summer of 2016 just above? If so please see also:
https://GreatWhiteCon.info/tag/northabout/
From the shiny new IPCC AR6 WG1 Summary for Policymakers:
Do you disagree with that assessment for some strange reason?
Dear Mr Hunt,
The reference for the image in my last post is (sorry, I usually don’t try posting links as they get rejected in most websites when added to comments):
Those are beautiful graphs, thanks for posting. I fear you did not get the best available (longer) datasets.
You see, the paper is not reviewed yet however it is no big deal to read some it and decide for yourself what is reasonable or not.
The first figure shows the draft version Results; the following is mass balance record graph.
There is a lot of variability through recent history (since the start of the series), but “Surface mass balance has decreased from a high of ~450 Gt yr-1 in the 1860s to low of ~260 Gt yr-1 in the 2010s”.
That mean the declining trend was set Before human CO2 emissions were relevant and also note that the mass peak gain was in 1960s, when humans were releasing some amount of gas. That is not a linear response as stated in IPCC reports (i just got to read the executive summary, not impressed, CMIP6 models perform worse than CMIP5 models, with higher inter-variability).
The fact that other planets of the solar systems such as Mars, Jupiter, Neptune and its moon Triton have been warming exempts human responsibility on earth recent warming.
Please consider Sun cycles and World Ocean Thermal Inertia for data lags.
I agree that Antarctic ice is driven by natural variability that overwhelms any CO2-driven warming, as the IPPC correctly points out. However I don’t agree that CO2 is the (sole?) driver for Arctic warming. Funny molecule, that CO2. The further north it goes, the more effective it is at doing the IPPC’s bidding…
Sorry, should be IPCC.
Don’t forget methane Taylor, and a long list of other “greenhouse gases”. Here’s an extract from the IPCC’s shiny new AR6 WG1 SPM:
Surely you must have heard of “Arctic amplification” by now? If not, please see:
https://earthobservatory.nasa.gov/images/81214/arctic-amplification
It seems links are remove from text.
OK, so reference for the First Image of my First Post is:
1.Nsidc’s greenland-today page
The paper reference in my Second Post is:
2. Greenland ice sheet mass balance from 1840 through next week. Mankoff, 2021
Sorry, peak mass gain was in (maximum of 152 Gt in 1985), not 1960s as I stated. But well, everybody can read the paper.
Hi Mountaineer,
I was aware of where your SMB graph first originated, but I was wondering why the version you posted ended in June? Here’s the latest update:
Strangely enough I first read the Mankoff et al. (2021) preprint some time ago:
https://GreatWhiteCon.info/2021/05/steven-koonins-unsettled-greenland-ice-sheet-science/#comment-461513
Here’s an extract:
If one follows “sun cycles” then surely the Earth’s climate should be cooling at present? It isn’t! What do you suppose will happen to the Greenland ice sheet once most of the sea ice in the Arctic has melted?
Indeed I am a little worried about Mankoff adjusting the data.
I checked his github repo with Greenland data and he admits he should be sharing the unadjusted raw data (300GB), too. However, I did not see many change commits yet on the data set he produced, in fact he actually added peripheral glaciers data recently.
These research projects are not personal, as many scientists like to reckon, so probably difficult to convince Govt serving the raw data and allowing anyone to use it, which is a shame. Where is MOSAIC exped data, it was funded with public money AFAIK so data should be online and public from the first collection day. Also, there is an arctic ice forum which I reckon you are aware, and some technicians working at Polarstern were posting through the Mosaic exped. They denounced really messy science in some aspects. For eg. scientists simply did not know how to interpret ice thickness satellite data when choosing the anchoring floe. Then after abandoning intial plans, they found a lot of unexpected ice. But the point here is ice volume is really hard to measure, although it is one of the most import metrics for modelling forecasts!
I am not sure, Mr Hunt, what would happen if Greenland got warmer but we should check fossil historical records and as far as I am aware historically, Greenland warming is not a bad thing and happened in the past.
I suspect this alarmism of global warming may go on for a long, long as it is not strictly science. It is a good thing there is an upward trend in temp for the next few thousand years, despite some cold periods within.
I have made no money since taking my theoretical position in this debate, no friends. Au contraire! As such, I feel bad science is in this state and debate is reject in most places. If the next decade proves to be no colder as forecasts I am following predict, then I will change my mind and start to get worried about climate change, as a reasonable person. This time is going to be most interesting as this natural change is long due and we, personally, will be able to make a better sense of it all (but I reckon it is all very clear already).
Sea ice volume may be “hard to measure”, but some “Polarstern scientists” are giving it a go. See for example:
https://GreatWhiteCon.info/2021/05/facts-about-the-arctic-in-may-2021/#May-02
Said scientists are also publishing papers about what they discovered during the MOSAiC expedition. See for example:
“Interannual variability in Transpolar Drift summer sea ice thickness and potential impact of Atlantification”
If you’re familiar with the ASIF then surely you’re aware that a lot of MOSAiC data has been publicly available from the start of the expedition? Instructions on how to analyse it yourself are available at, for example:
https://forum.arctic-sea-ice.net/index.php/topic,3013.0.html
A new paper from Thomas Krumpen et al.
“MOSAiC drift expedition from October 2019 to July 2020: sea ice conditions from space and comparison with previous years”
I suggest you consider that the sun’s influence is that of a ‘lagging indicator’. Likely it is cooling, UHI effects (where most of the thermometers are) may be fooling us.
Notice I use words like ‘likely’ and ‘may’ out of respect for IPCC science.
Surely solar irradiance isn’t a mere “indicator”. It provides the vast majority of the Earth’s energy input! Perhaps “control knob” is a more appropriate term?
Meanwhile according to NASA:
I note the ARCUS report is showing an increase in minimum ice this year of 360,000 sq.Km compared to 2020.
https://www.arcus.org/sipn/sea-ice-outlook/2021/july
Note also that VISHOP is showing August sea ice extent is above the 2010’s average
https://ads.nipr.ac.jp/vishop/#/extent
I am hopeful of a modest recovery in Arctic sea ice this year
[Comment moved to a more appropriate location – Mod]
Here’s the current JAXA/ViSHOP extent graph:
Personally I don’t think significant areas of multi-year ice sitting in the Beaufort Sea rather than the Wandel Sea counts as any sort of “recovery”:
Live by the metric, die by the metric, eh Jim?
August is the time I love when the metrics get squirrelly based on the various algorithms and data sources. DMI is well above six and flattening, JAXA at 5.5, MASIE at 5.6, plummeting from 6 a few days ago, and NSIDC at roughly 5.7 with a slower than normal decline and all using the same metric (15%). That’s a 14% spread. Not bad precision for an economic forecast or tomorrow’s weather, but hardly physics.
Any predictions for this year’s minimum?
All metrics using different algorithms and different satellite sensors with different resolutions.
I predict that this year’s extent minimum will be higher than last year’s! Before that it will be interesting to see what happens to the remaining multi-year ice on the Pacific side of the Arctic.
After that it will be even more interesting to see what the post summer return of CryoSat-2 (and maybe even ICESat-2?) thickness measurements reveal.
Bingo! ‘ …metrics using different algorithms and different satellite sensors with different resolutions’. My point exactly. We can measure the speed of light with increasing accuracy over hundreds of years, and the charge on an electron hasn’t changed much since Millikan first measured it over 120 years ago. But in today’s ‘settled science’ we can’t seem to decide the best, most reliable way to measure something that supposedly holds the key to our future on the planet. We can’t even decide it it’s the right thing to try to measure (Area? Volume? Age of ice? Thickness?). I’m not saying important work isn’t being done, or that it doesn’t need doing. I’m just suggesting a bit less hubris in what the data and conjectures suggest about the future.
The physics of the “Greenhouse Effect” is clear enough. See:
https://GreatWhiteCon.info/resources/greenhouse-effect-explanations/
Despite the recent La Niña, according to NOAA:
NOAA’s helpful introduction to the AO points out that:
The corollary being that there are also fewer warm air outbreaks than usual in the Arctic. It’s right to try and measure all of your suggested metrics, and others. Not least because even the latest CMIP6 climate models still seem to have difficulty getting the Arctic sea ice past right, let alone the future:
https://doi.org/10.1029/2019GL086749
You may find such uncertainty reassuring. I do not.
Quick update: MASIE at 5.8 today, up from 5.6 yesterday. Did extent really grow by 200 square Km, or did their algorithm(s) just ‘rediscover’ it? That’s what I meant by ‘squirrelly’.
MASIE relies on humans:
https://GreatWhiteCon.info/2016/02/dmi-masie-and-the-sea-ice-index-an-interview-with-walt-meier/
At this time of year wind blown floes can cause extent to switch back and forth across the 15% threshold. No squirrels involved!
At this time of year I peruse assorted ship tracking web sites to see what’s going on in the Northwest Passage.
On this occasion I couldn’t help but also notice a “pleasure craft” sailing around the Kane Basin, part of the Nares Strait between Greenland and Ellesmere Island:
Yes, ‘sailing around’, but not likely ‘through’ Nares Straight, per DMI. However, it’s namesake, Elisha Kane, did sail through in a good sized wooden ship in 1854. Remarkable how little warming there’s been in 160 years, don’t you think?
The North Water Polynya has been around for a very long time. However “anthropogenic global warming” is more recent, and sadly for Sir John Franklin and the crews of his two “good sized wooden ships” the assorted channels through the Canadian Arctic Archipelago are far more ice free these days than they were in the late 1840s:
https://GreatWhiteCon.info/2016/04/the-northwest-passage-in-2016/#comment-214159
Lots of fun to read about ice conditions in the recent past (2016). Any chance Crystal Serenity will make it through this year, even with an icebreaker escort? I didn’t think so.
So natural climate variability has yet again trumped global warming and the ‘death spiral’. Hopefully some research dollars will finally go to understand natural climate cycles and what part (likely small) greenhouse gases play.
You appear as though you’re not following this year’s events in the Northwest Passage? Please see:
https://GreatWhiteCon.info/2021/08/the-2021-arctic-sea-ice-minimum-extent/
“Passengers” are not welcome this year courtesy of Covid-19. However there has already been some “commercial traffic” en route to the Far East.
Natural climate variability hasn’t “trumped global warming”. This year it produced cloudy conditions during the period of peak insolation in the Arctic, as discussed here:
https://GreatWhiteCon.info/2021/07/facts-about-the-arctic-in-july-2021/#comment-460648
and subsequently here:
https://nsidc.org/arcticseaicenews/2021/08/a-change-of-pace-2/
Jim, I’m well aware of the COVID restrictions in Canada preventing NWP cruises this year. I should have asked ‘would’ Crystal Serenity get through vs. ‘will’. To further clarify, per NSIDC commentary today, the NWP is choked with ice for ‘all routes’ but the icebreaker USS Healy is attempting a west to east passage for research purposes. Not exactly 2016 conditions, likely we will look back fondly on that year.
Anyone would think you have an agenda Taylor!
The Northwest Passage isn’t currently “choked with ice for all routes” as you put it. The sealift is proceeding according to plan with icebreaker assistance. Albanyborg has completed a full passage from east to west and Atlanticborg isn’t far behind. Sea ice coverage across the NWP is highly variable:
However the trend is down as it is for the Arctic as a whole:
We’ll likely look back fondly on 2016 because there was still some thick multi-year ice left to chase Northabout along Lancaster Sound:
Strait, not Straight, darn autocorrect…
Snookered by Tambora. I learned something new as well.
“The British could not have known then, of course, that Tambora had caused the Arctic to melt, and that the climatic impacts of a tropical eruption persist for no longer than three years. The Arctic refroze just in time for the arrival of Britain’s first polar expedition under Captain John Ross in 1818. Years of fruitless, icebound sallies into the polar seas culminated in the tragic Franklin expedition of the 1840s, when all hands were lost, and the heroic age of British Arctic exploration came to an end.”
The two Grinnell expeditions that Elisha Kane took part in, endeavouring to establish what happened to Franklin’s expedition, were similarly fruitless. During the second expedition the brig Advance became icebound at Rensselaer Bay, in the southeast of what is now known as the Kane Basin, for two winters before being abandoned.
Unlike Franklin’s expedition most, but not all, of the crew lived to tell the tale.