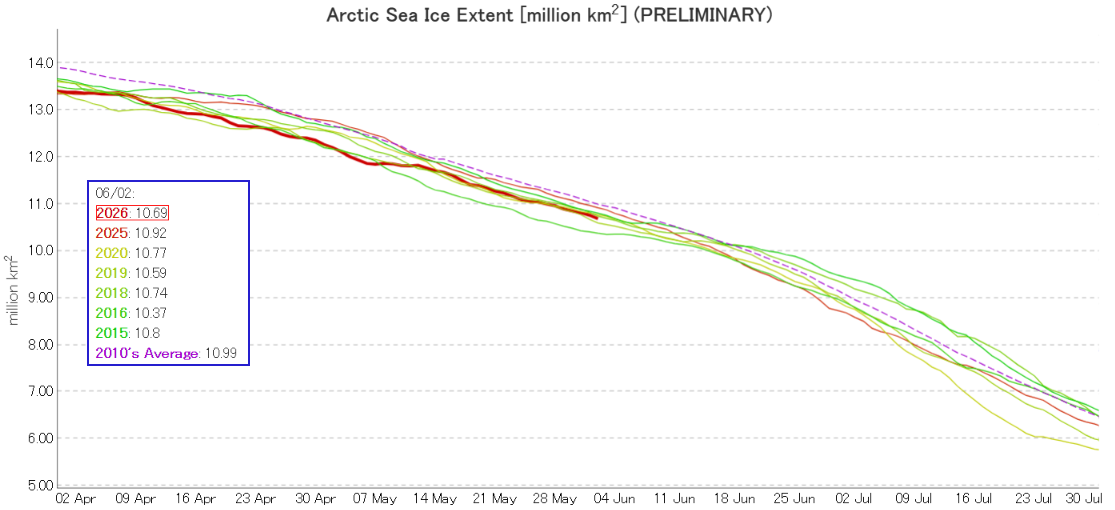
The JAXA/ViSHOP web site is currently undergoing maintenance, but here is how their 2 day average extent graph looked for June 2nd:
Extent was 3rd lowest in the JAXA record, behind 2016 and 2019.
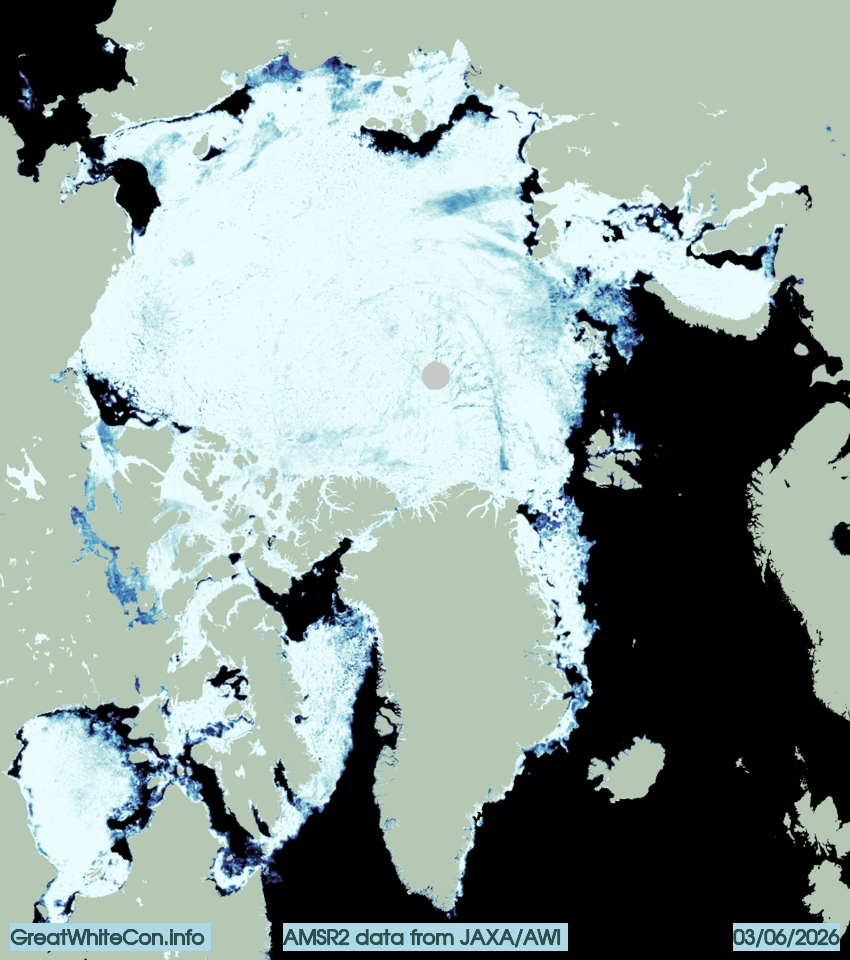
The Alfred Wegener Institute’s sea ice concentration data shows that the Bering Sea is now largely free of sea ice, and the areas of open water in the Beaufort, Chukchi, East Siberian and Laptev Seas continue to expand:
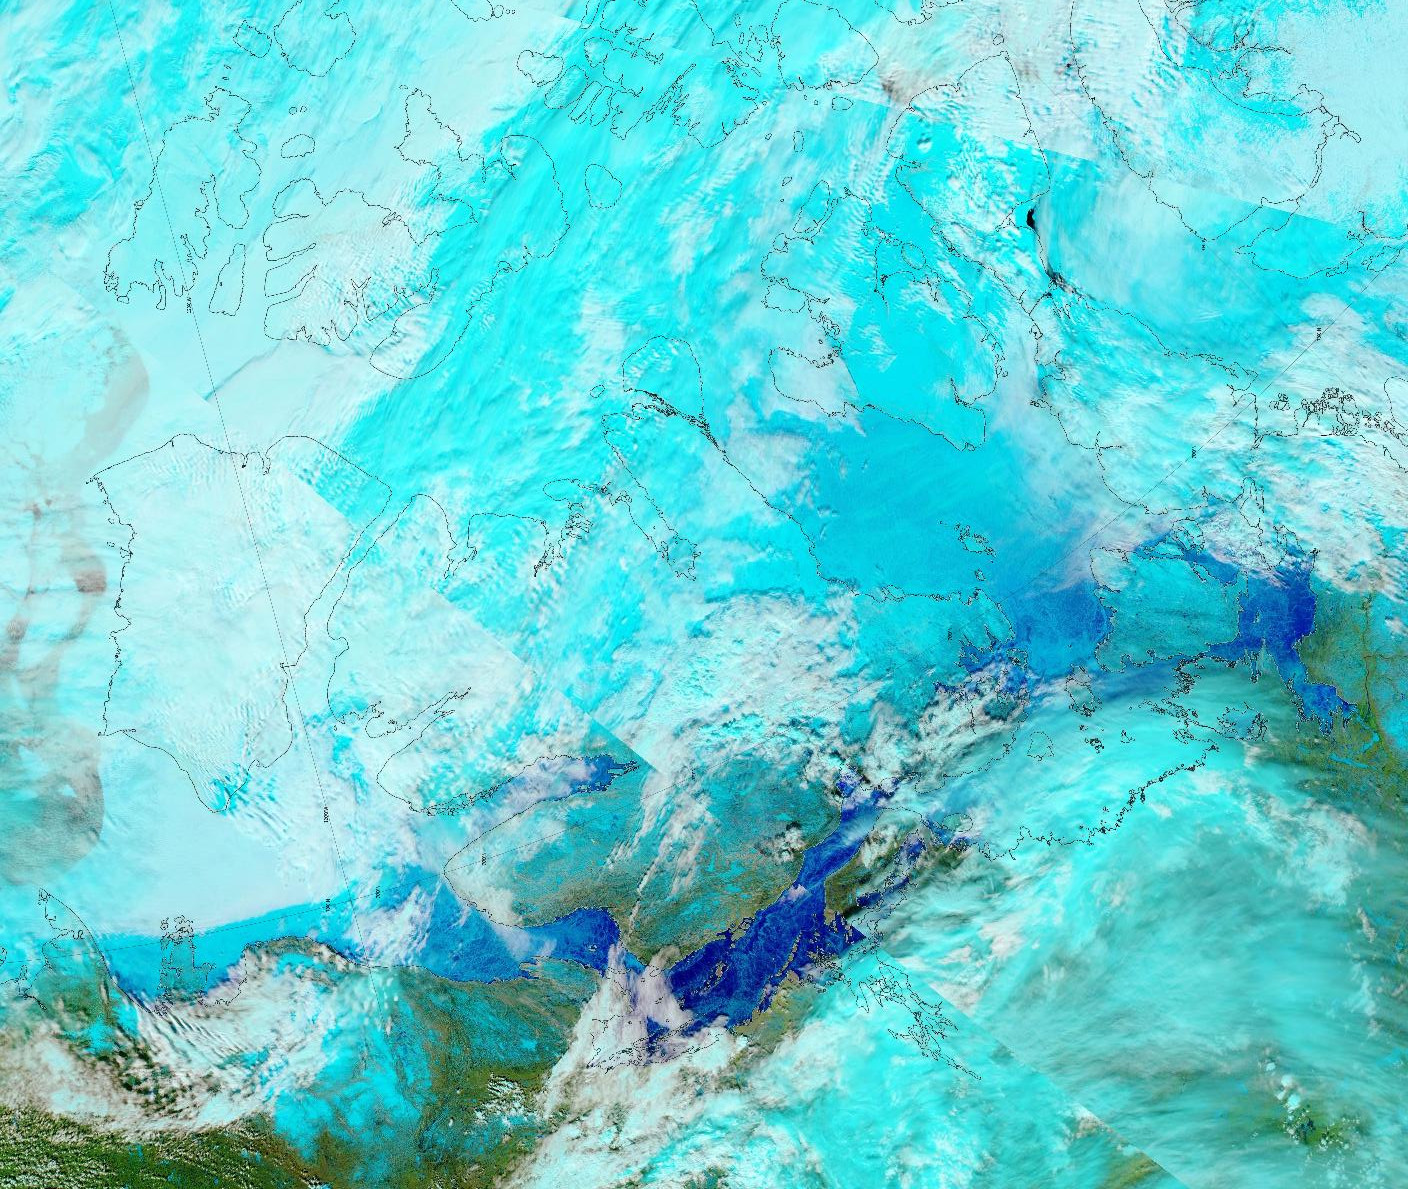
The sea ice concentration map also shows open water in much of Lancaster Sound. Also apparent is the widespread presence of melt ponds along the southern part of the Canadian Arctic Archipelago. Here’s a closer, albeit somewhat cloudy, look:
“False colour” image of the Canadian Arctic Archipelago on June 3rd from the MODIS instrument on the Aqua satellite
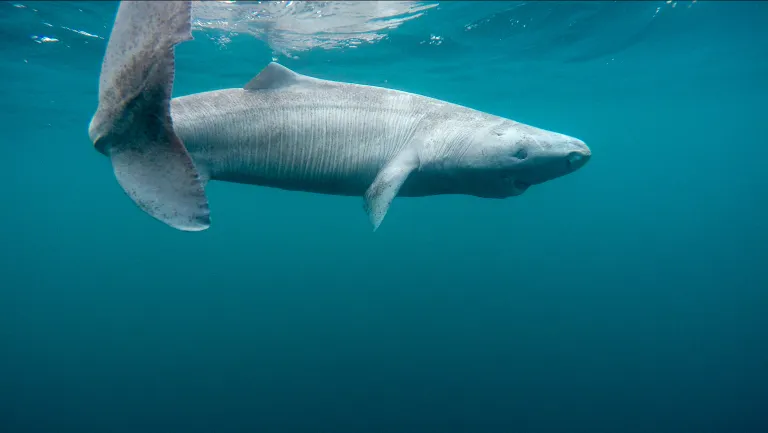
You will no doubt be astonished to learn that shark jumping supremo Tony Heller has just jumped over the entire East Greenland population of this long lived but officially vulnerable species. Without harming a single one!
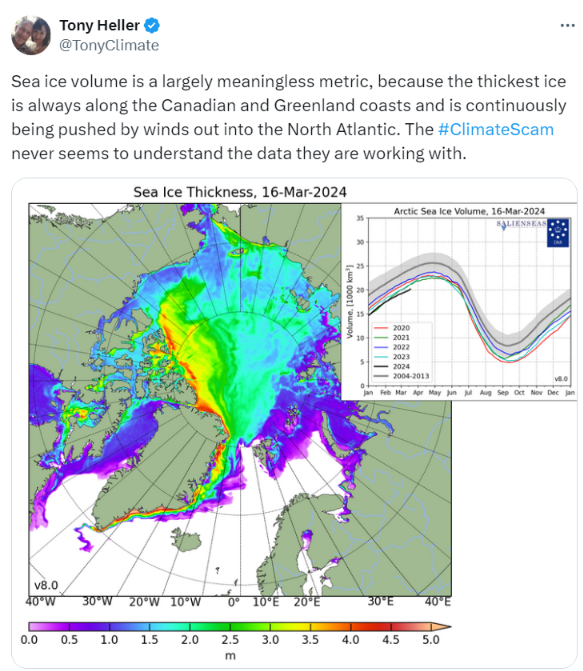
Over on XTwitter “Steve”/Tony was recently shown this video which graphically reveals the declining age of the sea ice in the Arctic Ocean:
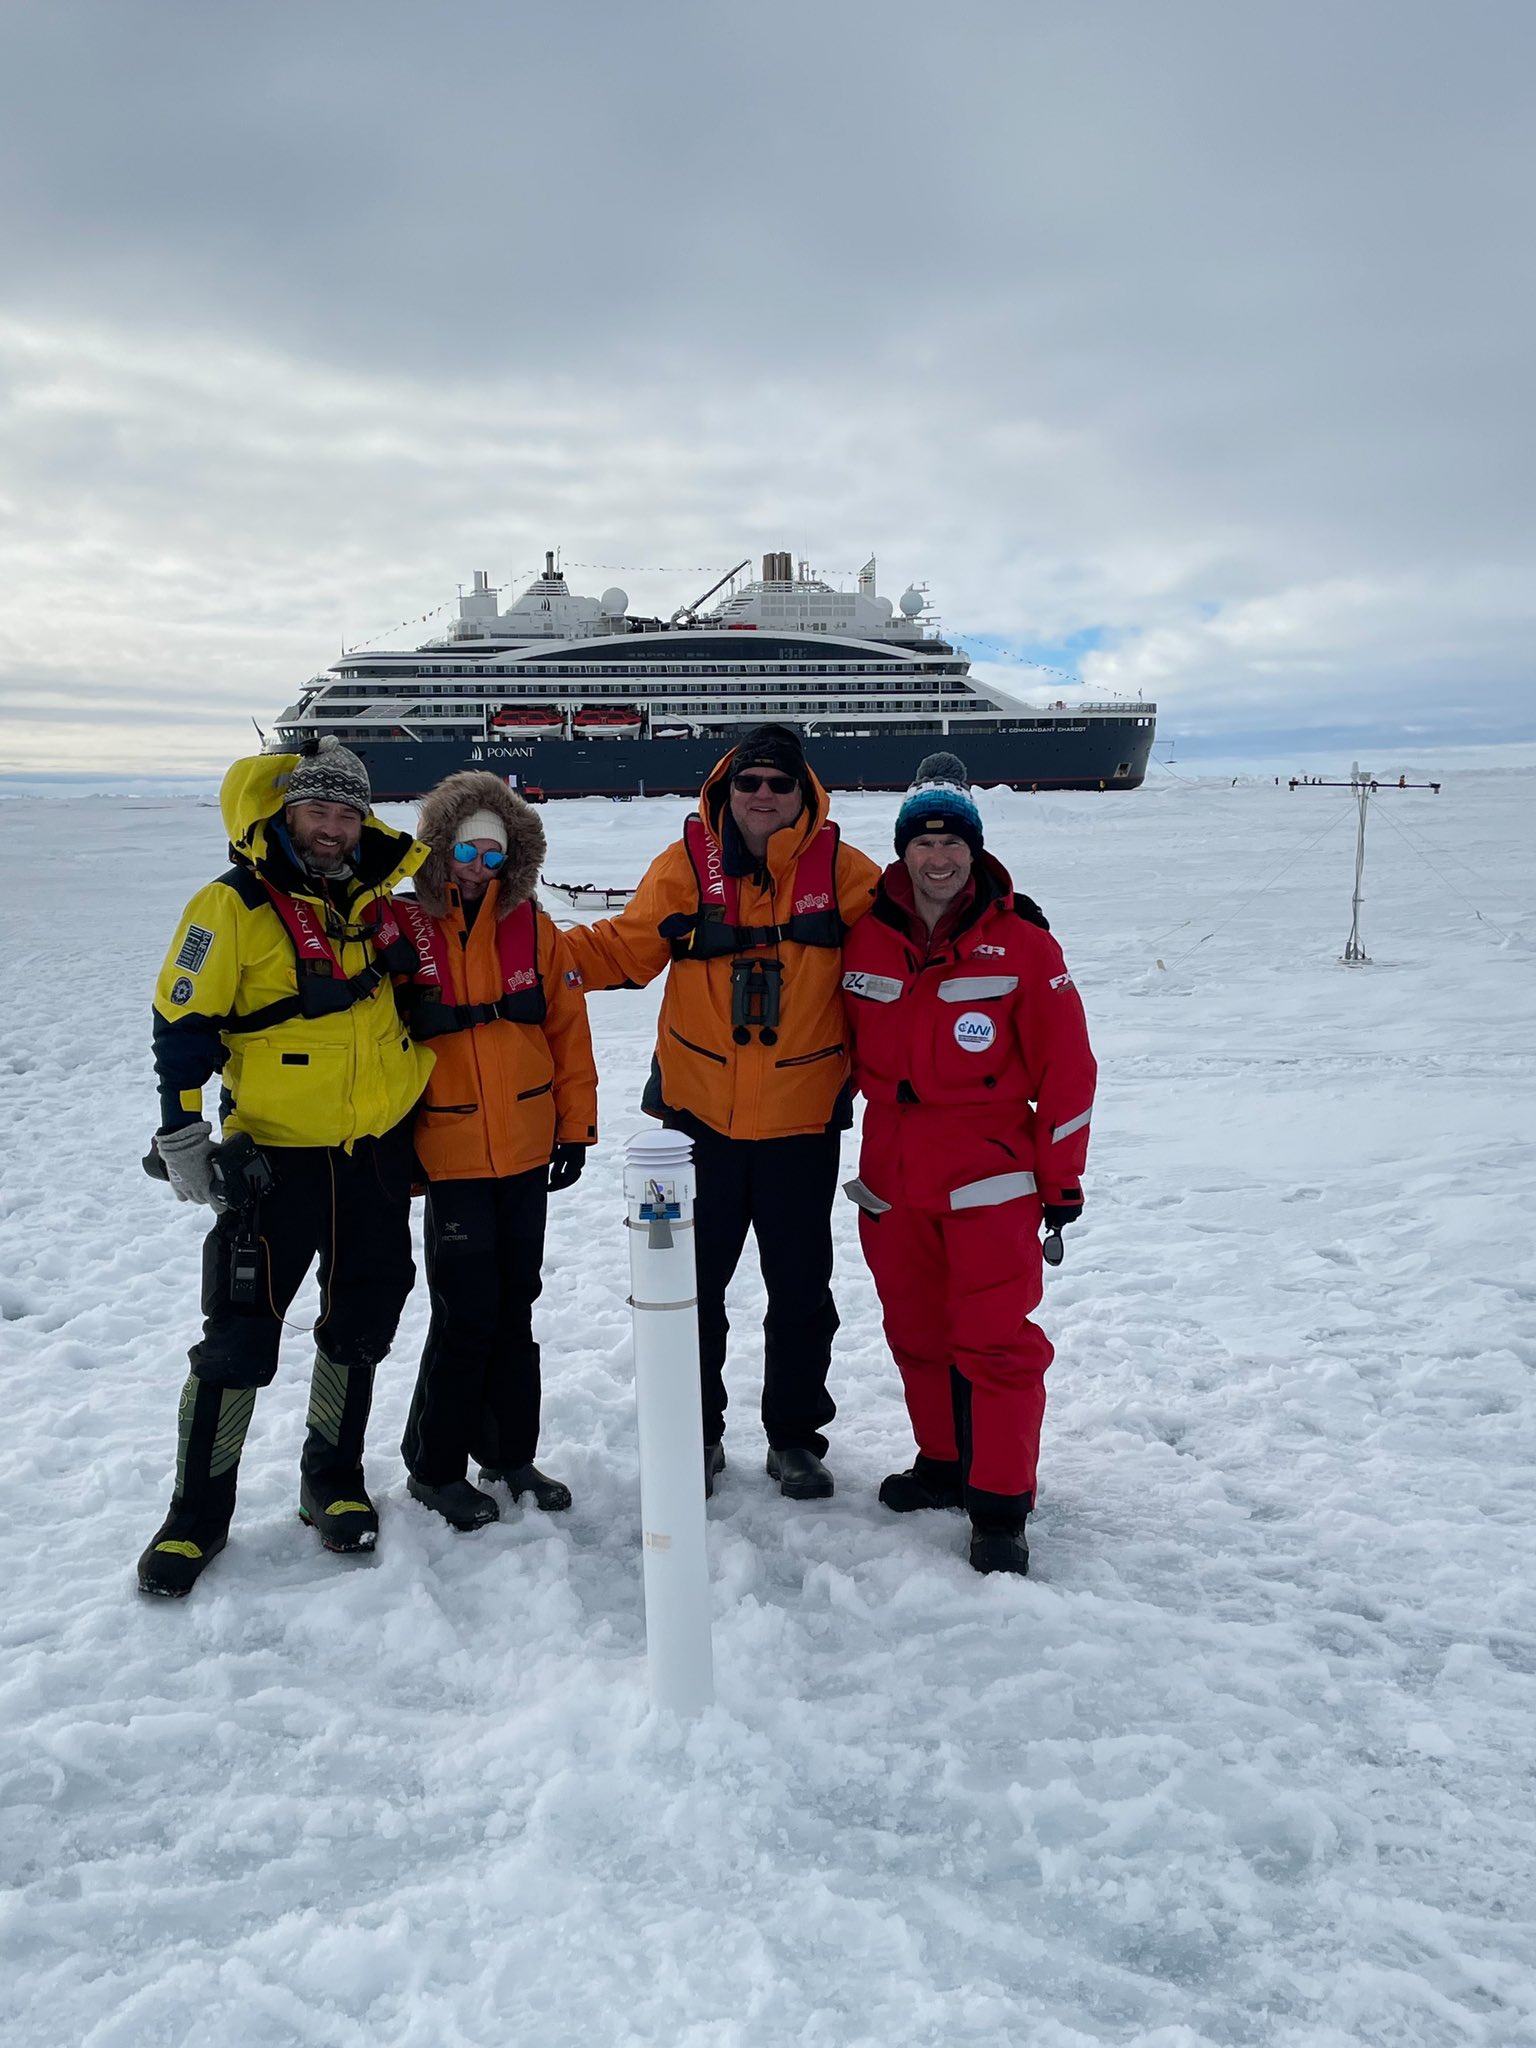
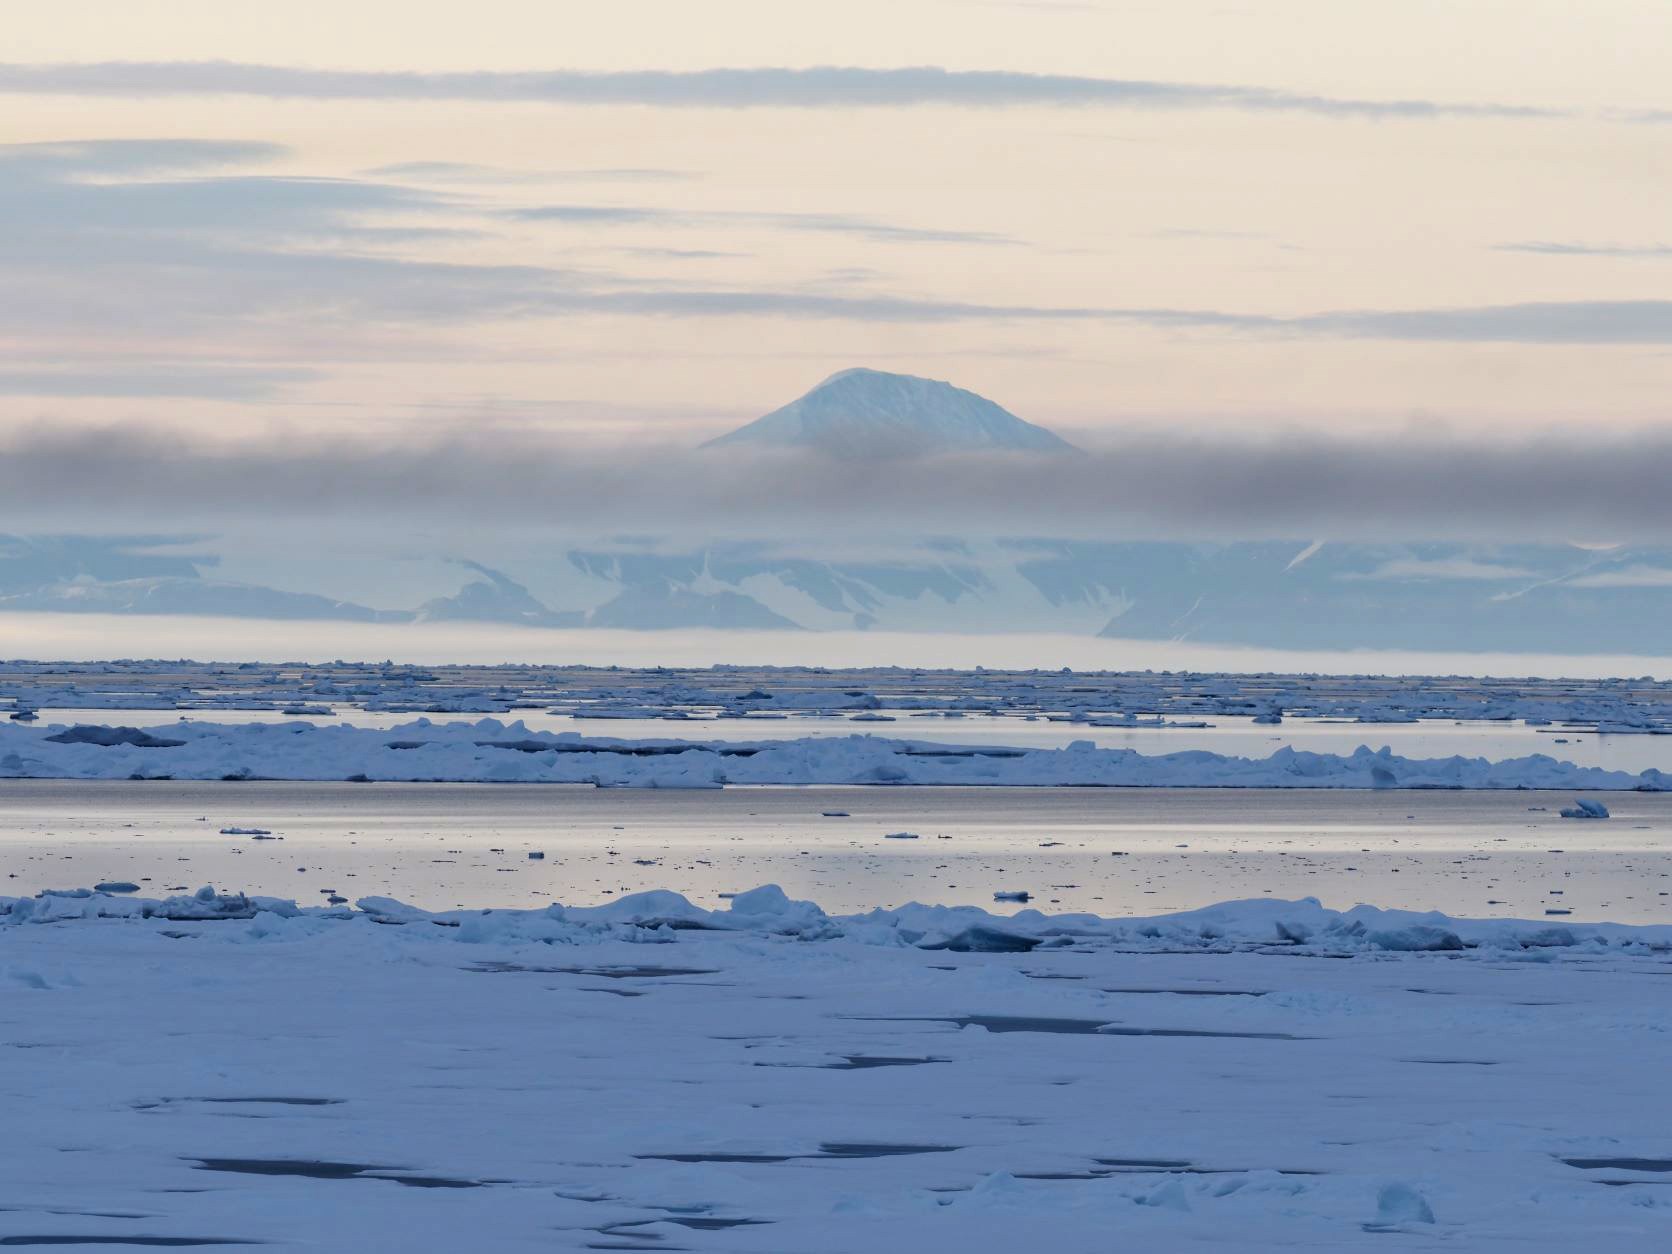
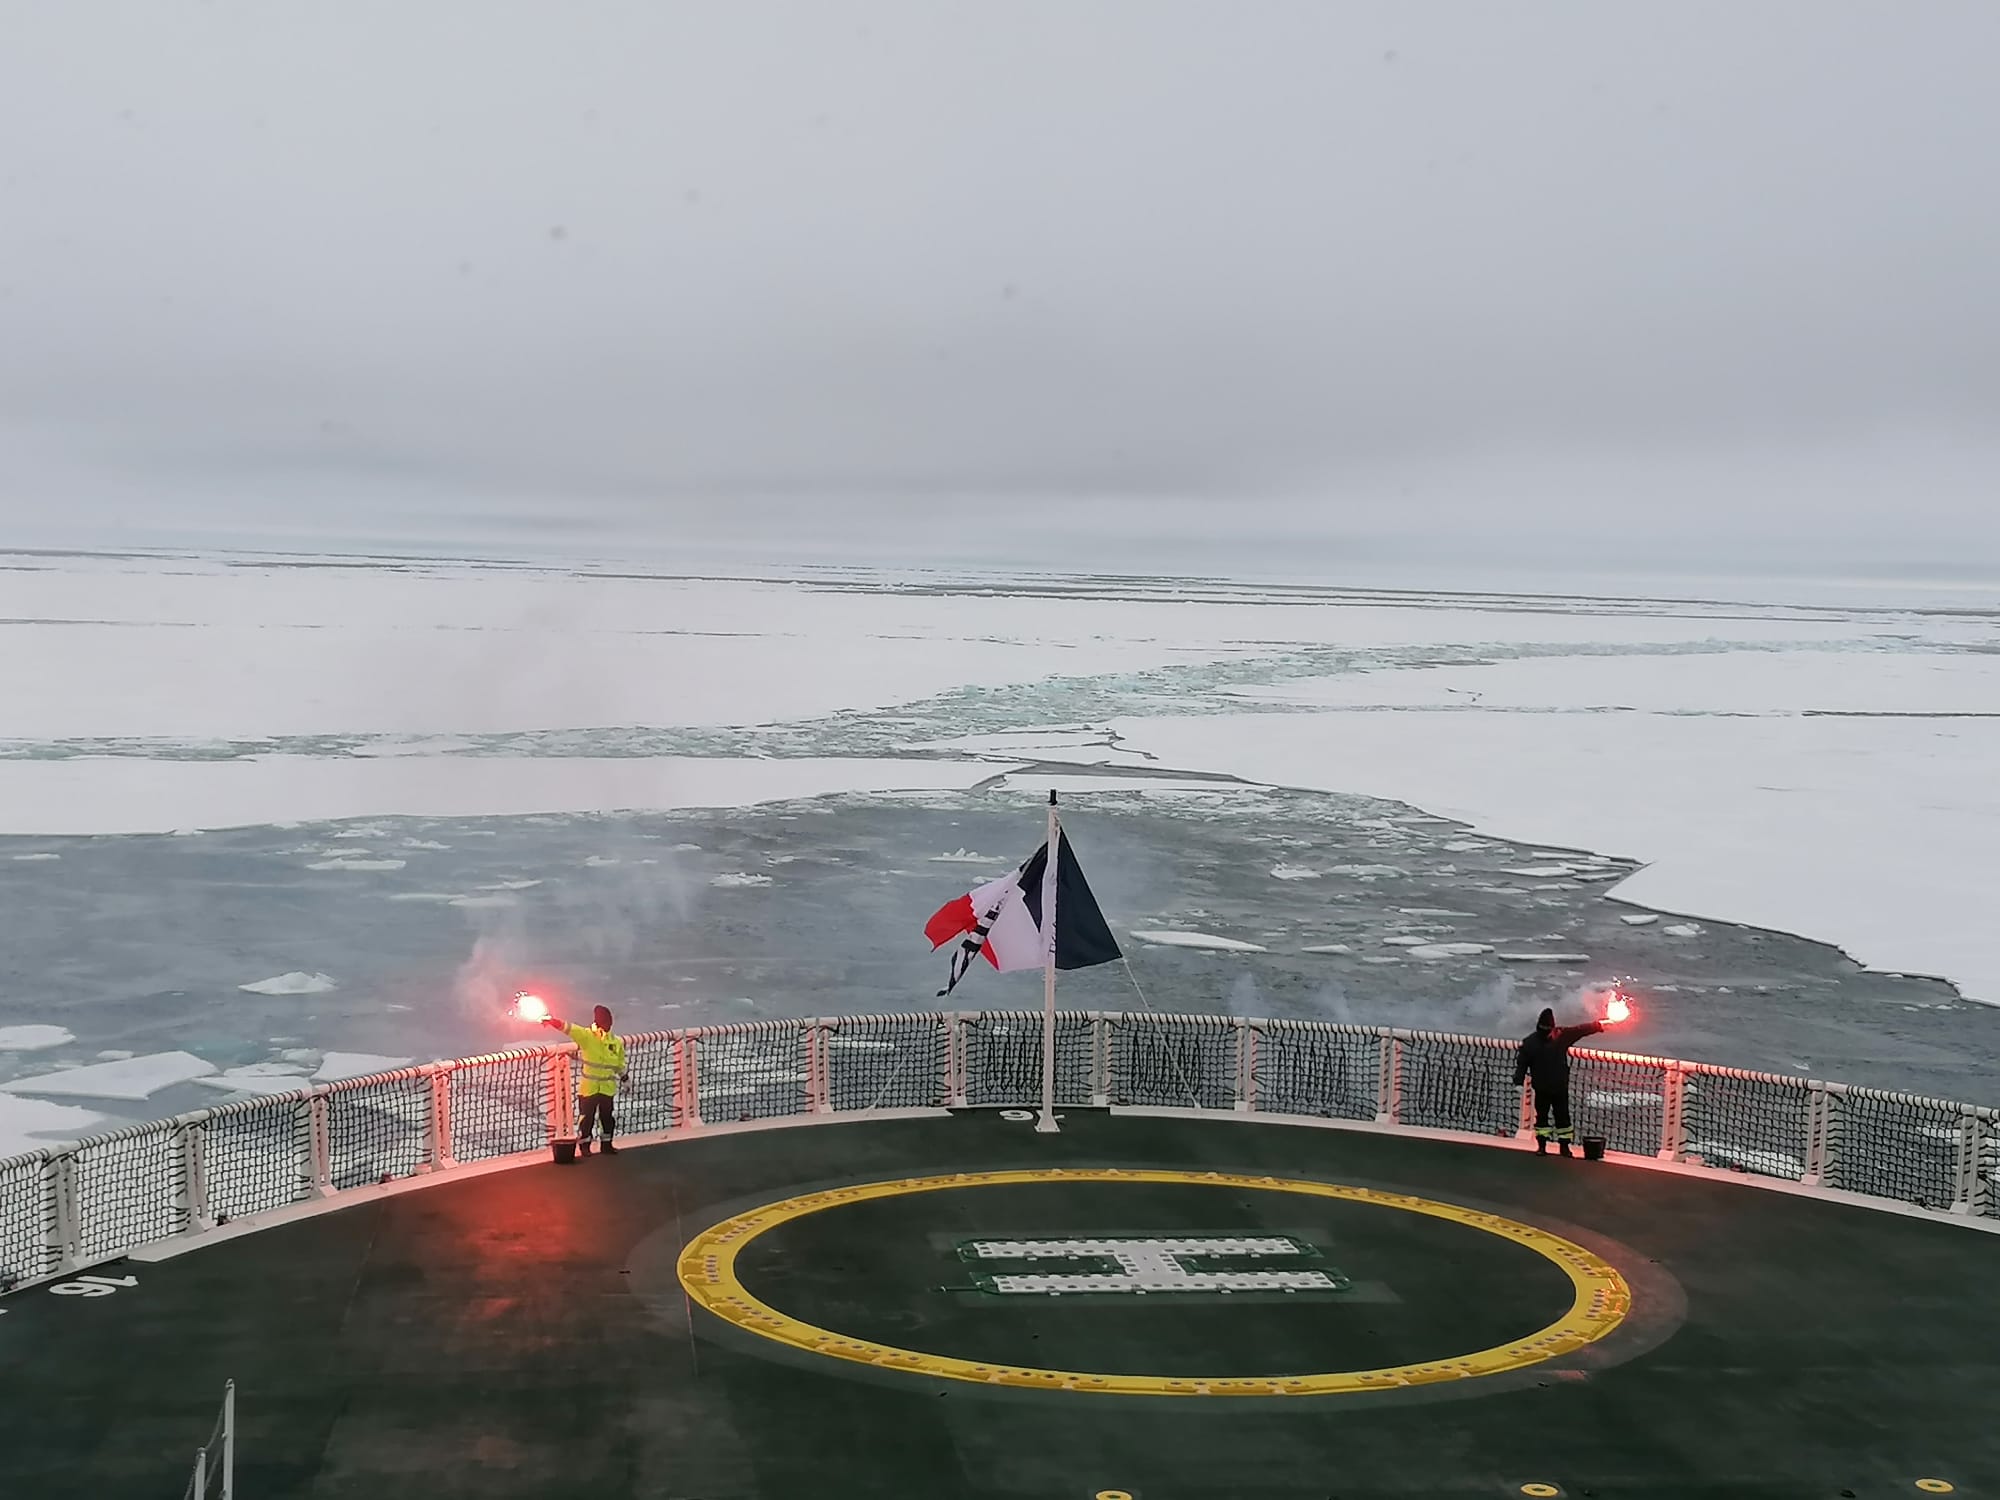
After a long hiatus courtesy of the demise of the annual Barneo ice camp and the Covid-19 pandemic we are pleased to be able to report that an ice mass balance buoy has once again been installed on a floe in the vicinity of the North Pole. Here’s the evidence:
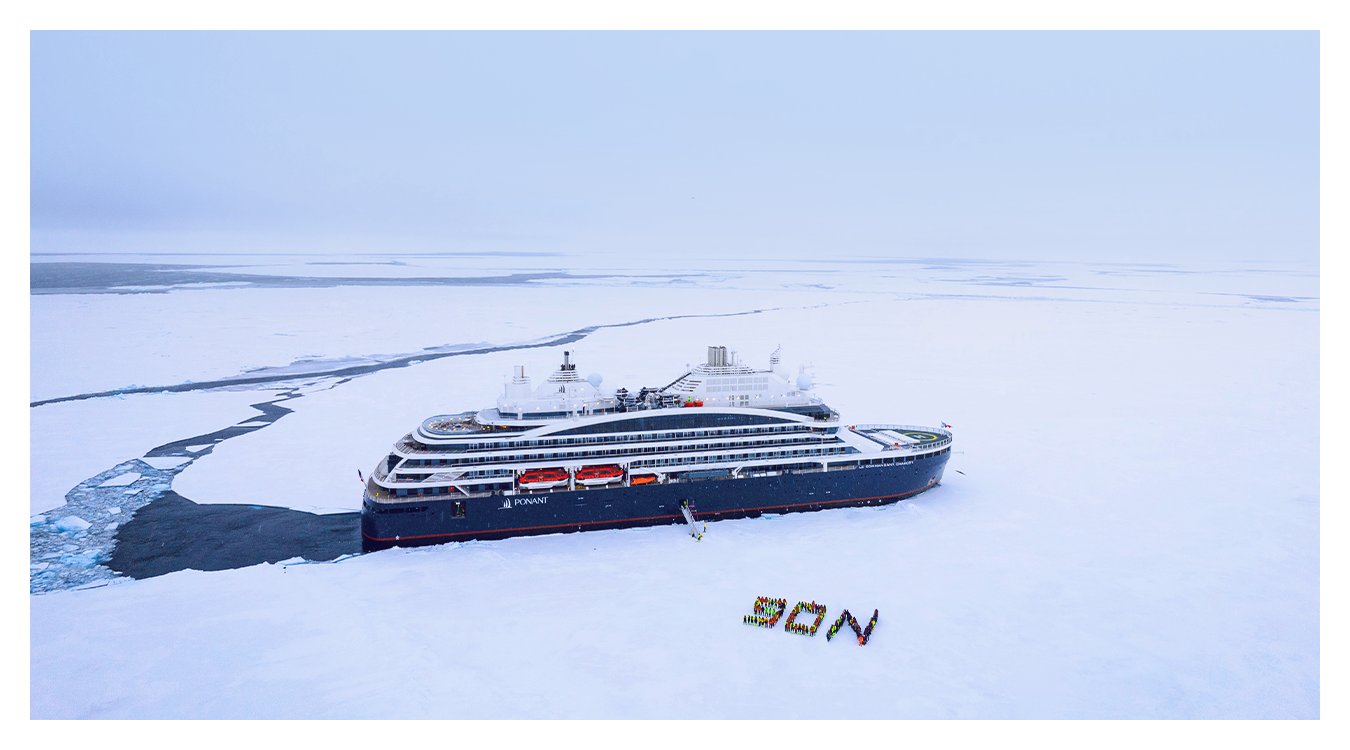
The ship in the background is not a traditional research icebreaker. It is Ponant Cruises’ Le Commandant Charcot, one of a number of new ice hardened cruise ships voyaging across the Arctic Ocean and adjacent seas. Le Commandant Charcot reached 90N on July 13th:
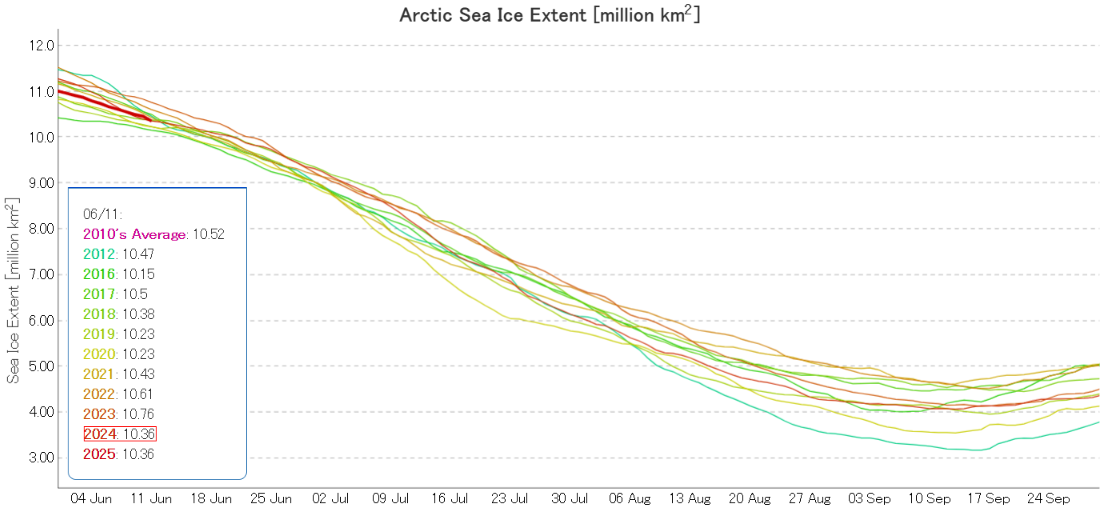
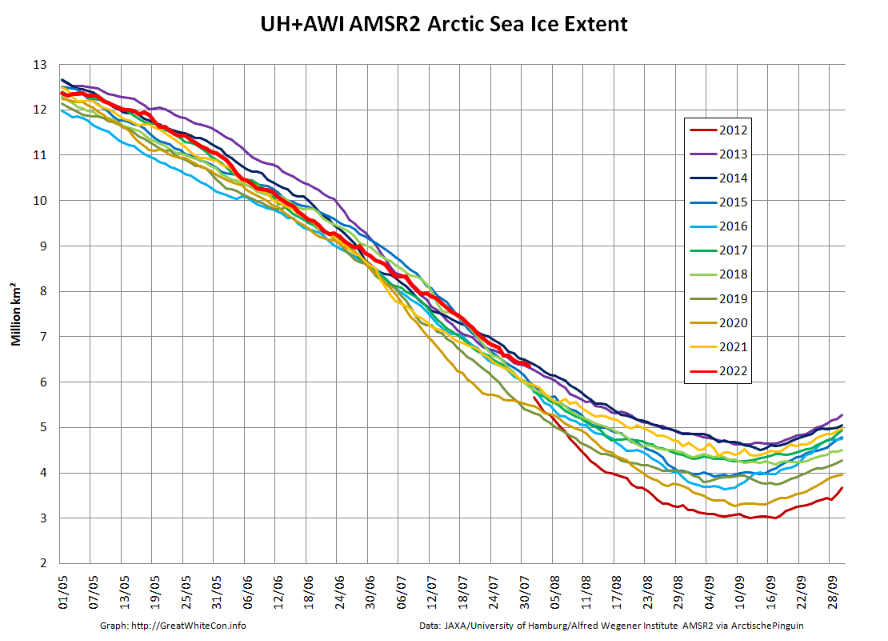
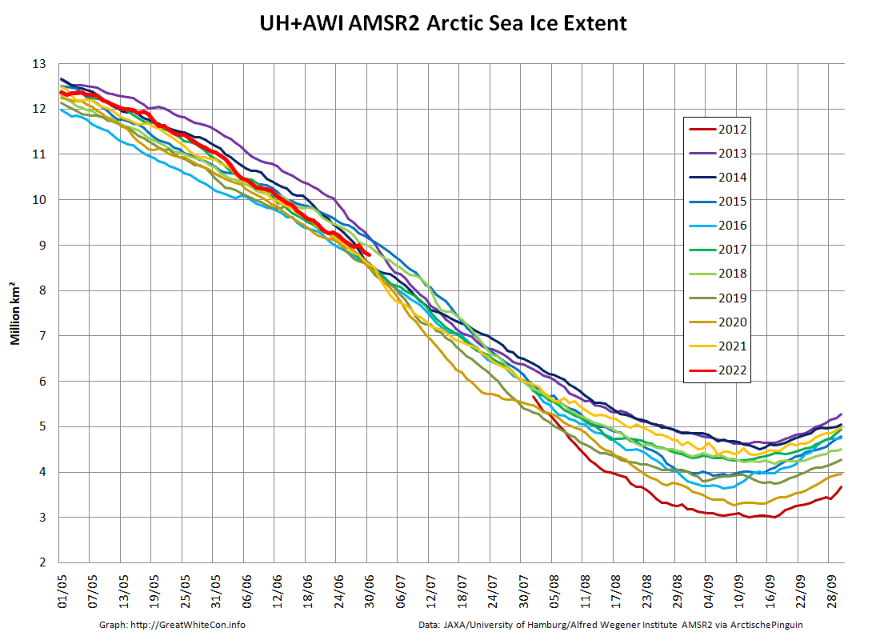
After a relatively rapid decline at the beginning of June Arctic sea extent is now very close to the 2010s average:
Both 2020 and 2021 began relatively rapid declines of their own at the beginning of July, so it will be interesting to see if 2022 follows suit.
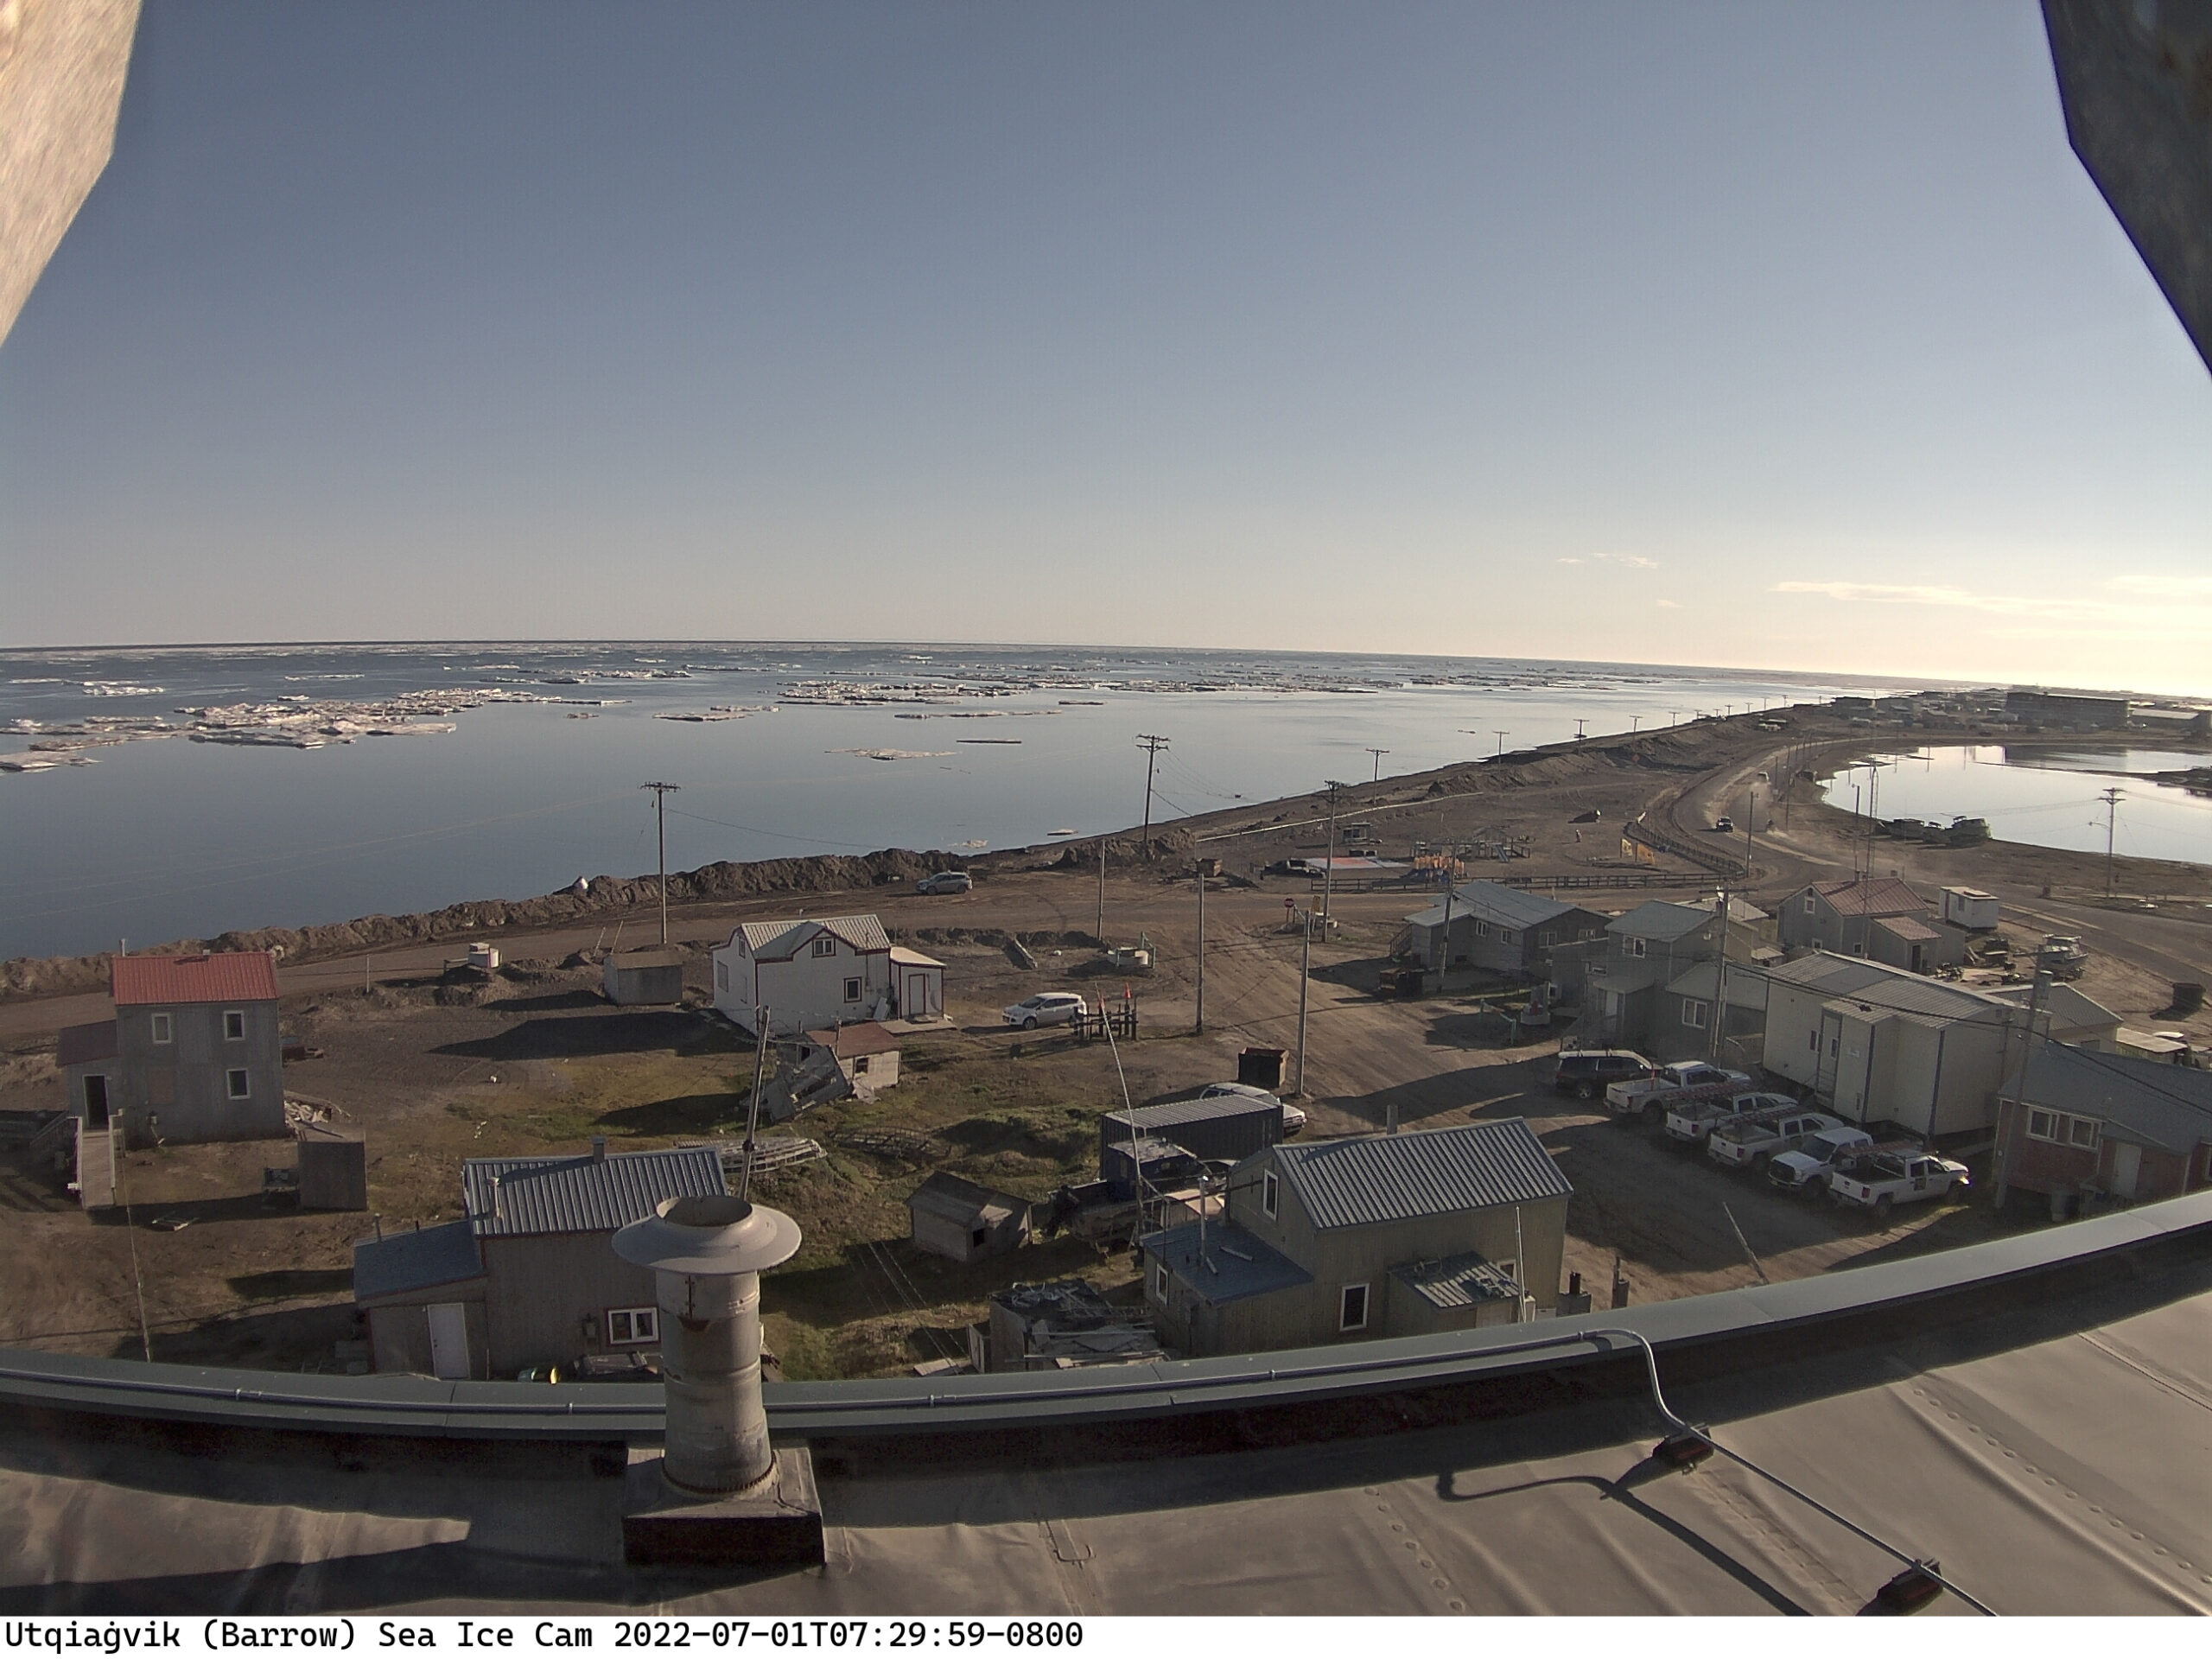
Most of the fast ice off Utqiaġvik has recently disappeared:
Meanwhile further out into the Chukchi Sea the sea ice looks to be in poor shape at the moment, with surface melting apparent across the entire region:
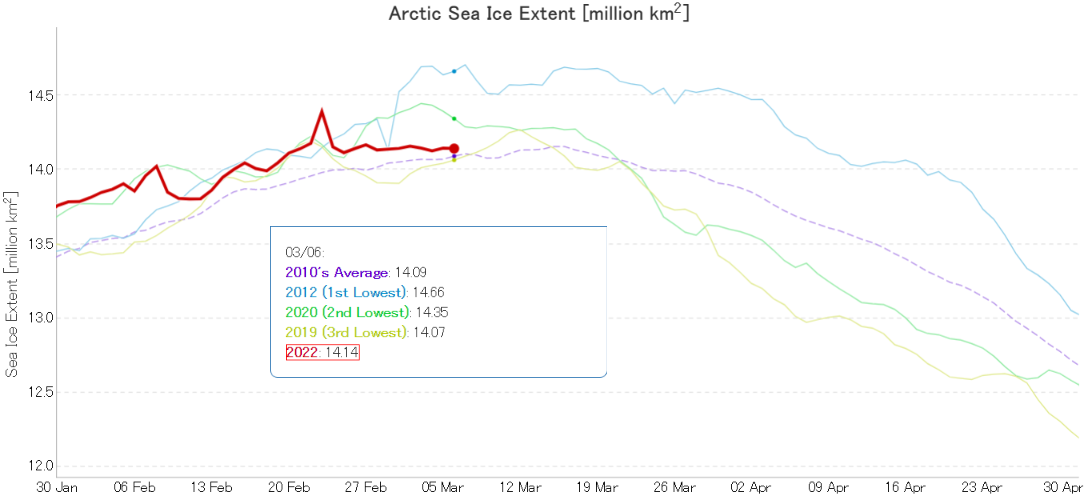
For detailed analysis of Arctic sea ice extent over the next few weeks please see the 2022 maximum extent thread. However to get the new open thread going here is the current JAXA/ViSHOP extent graph:
It’s looking more and more as though the real maximum for 2022 occurred close the false peak on February 23rd.
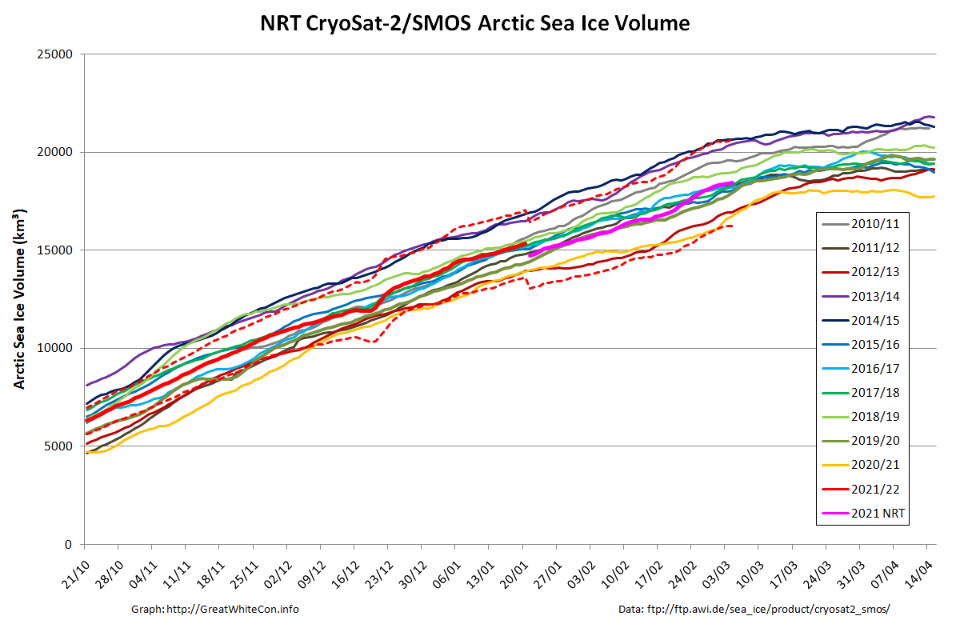
Arctic sea ice volume will keep increasing for a while longer. Here is the current AWI CryoSat-2/SMOS volume graph:
The recent “flat line” in extent is in part due to recent events on the Pacific periphery of the Arctic. Take a look at this animation of AMSR2 sea ice concentration:
The gap varies depending on how the wind blows, but there is still evidence of open water (or very thin ice) along the shore of the Beaufort and Chukchi Seas. Here’s the Mackenzie Delta and the adjacent Beaufort Sea on March 5th:
A detailed dissection of the 2021 minimum of various Arctic sea ice extent metrics can be found on a dedicated thread. All other Arctic news in September will be found below.
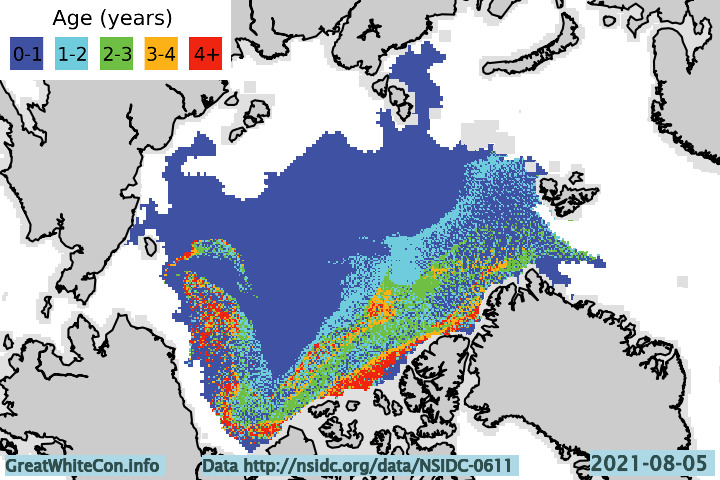
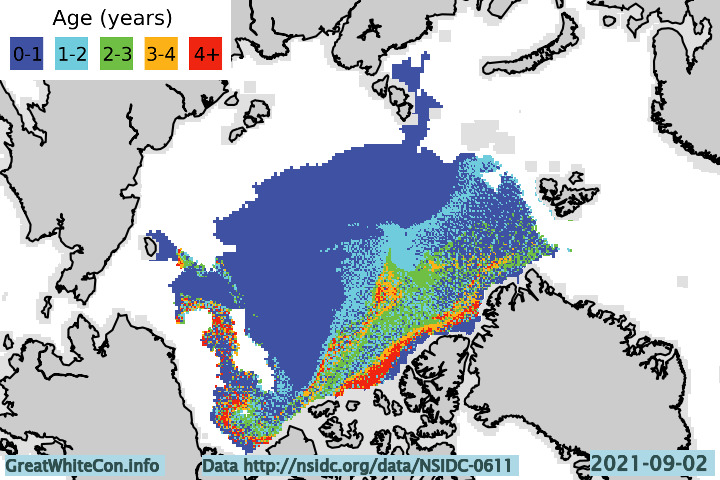
Let’s start with a map of sea ice age at the beginning of August:
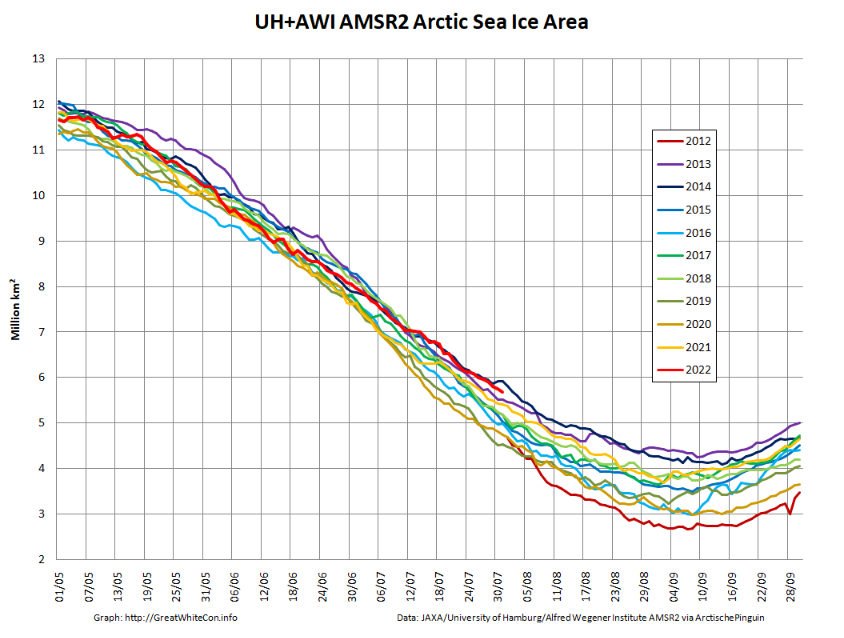
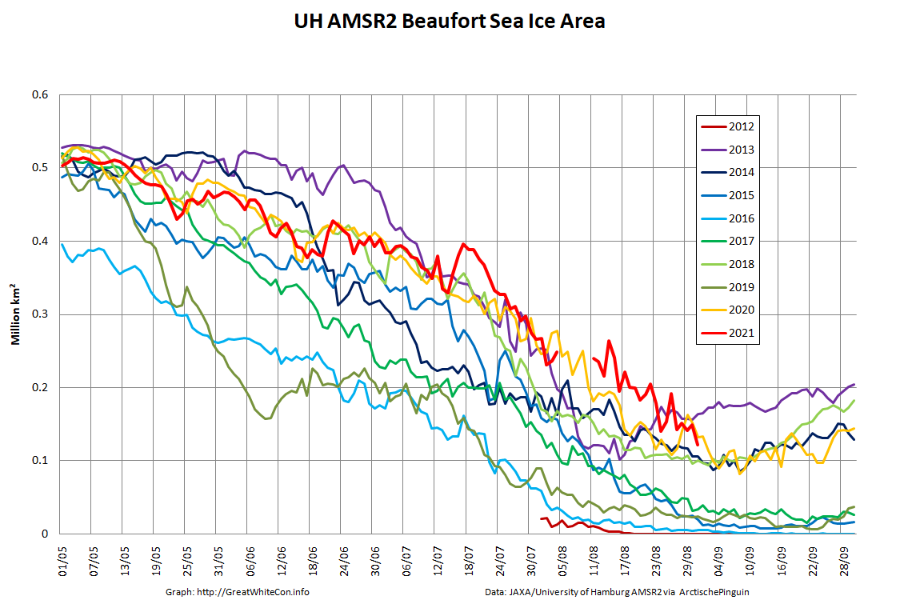
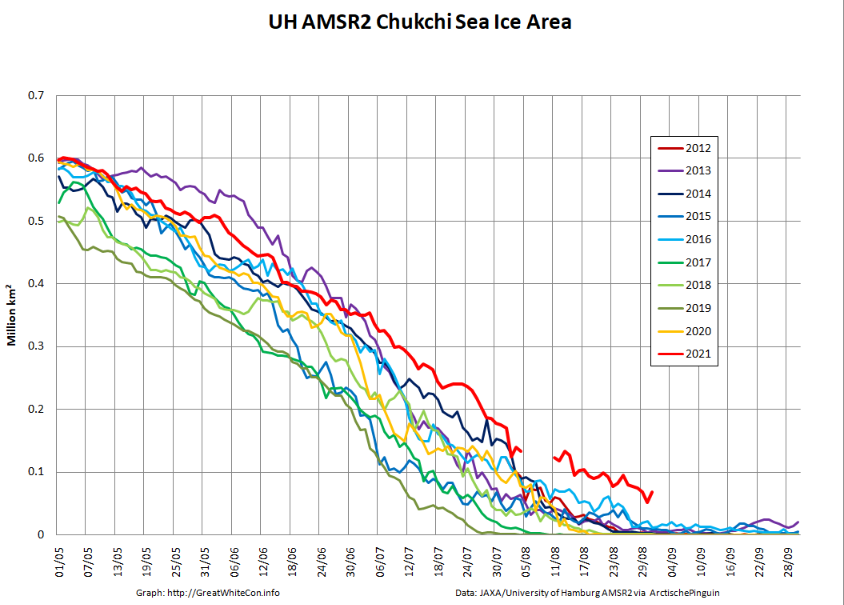
Firstly notice the absence of 3+ year old ice off the coast of north east Greenland. Also visible is a band of 4+ year old ice across the Pacific side of the Arctic Basin, which has slowed melting in the region and explains the following regional sea ice area graphs:
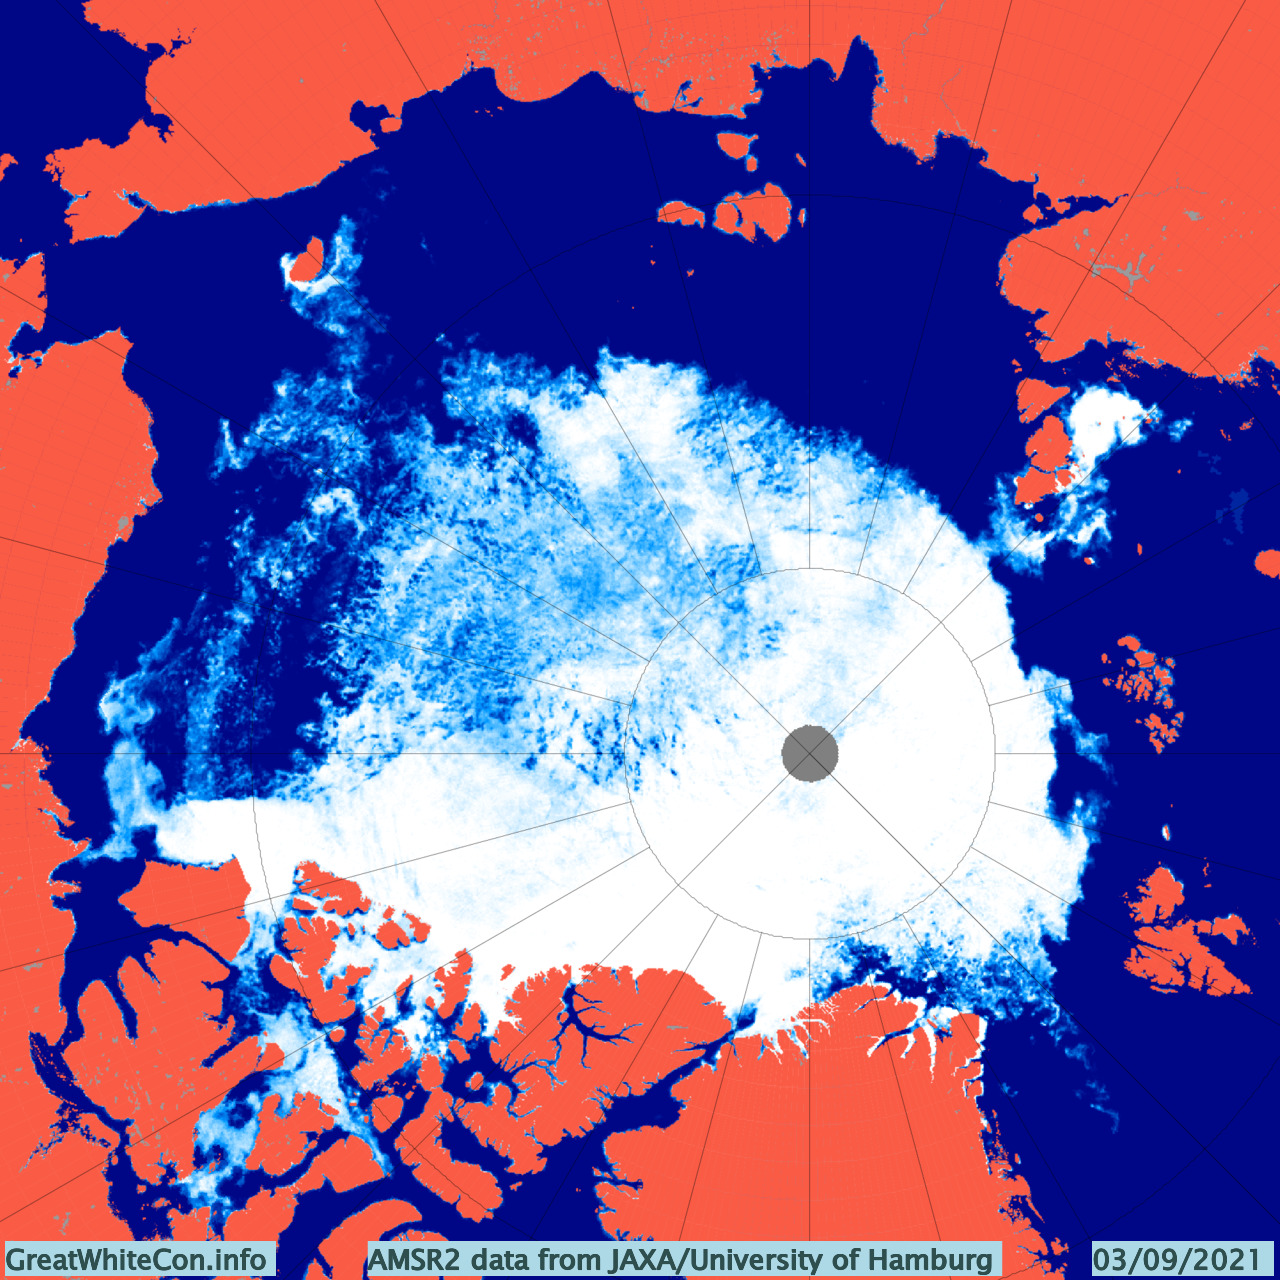
Next here’s the current AMSR2 concentration map:
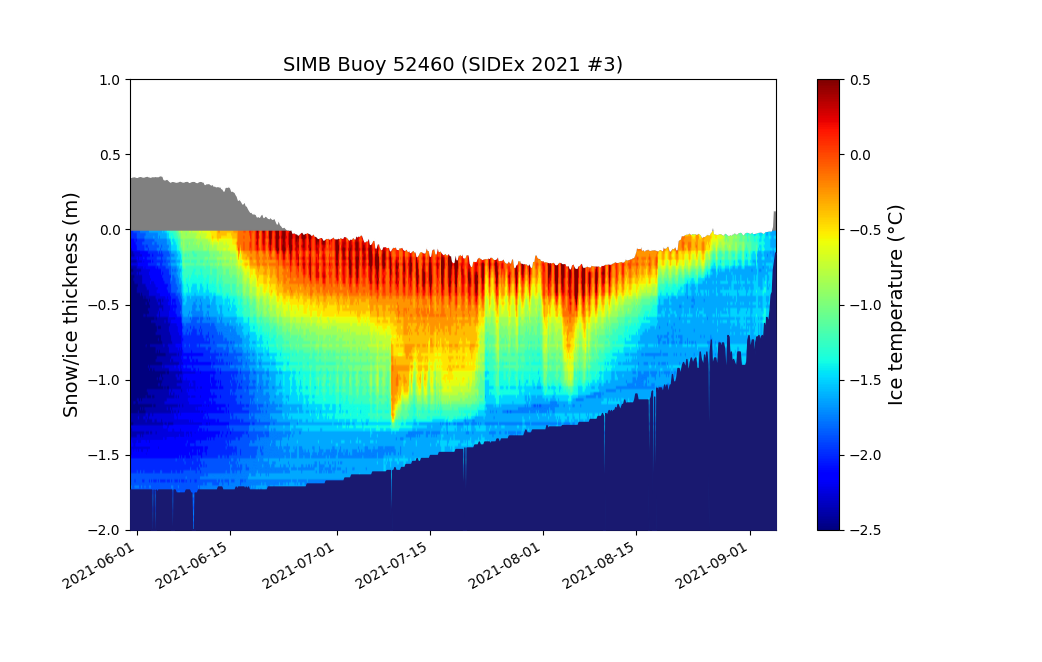
There is currently a large area of open water in the Wandel Sea to the north of Greenland. There is also an arm of old ice across the Beaufort and Chukchi Seas which is still clearly visible, but also visible is the recent reduction in sea ice concentration in the region. By way of explanation, here’s another look at the thickness of an ice floe currently situated to the north of the Chukchi at 74.84 N, 164.29 W, as measured by an ice mass balance buoy:
As the 2021 melting season draws towards its conclusion the floe is experiencing rapid bottom melt. How much longer will this floe and others like it last? Will it survive to become an “old ice” dot on next year’s ice age maps?
[Edit – September 6th]
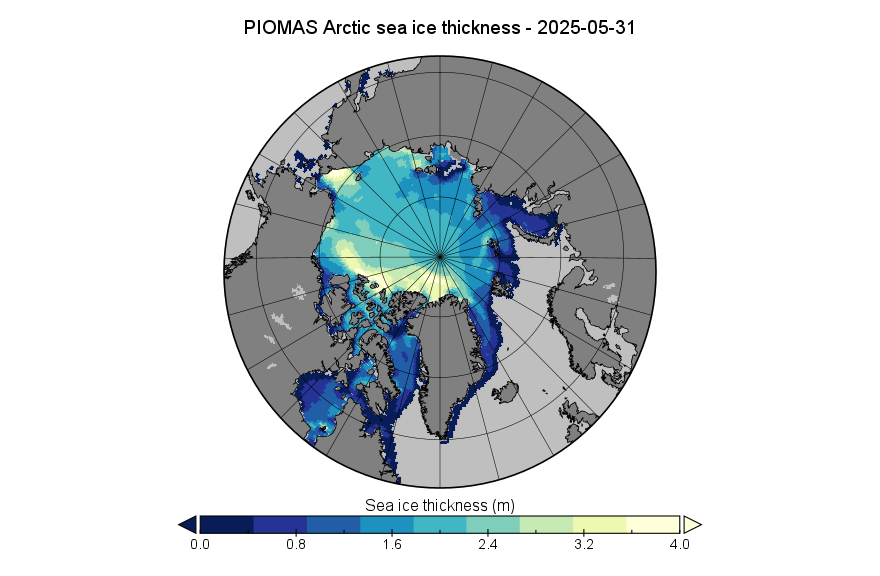
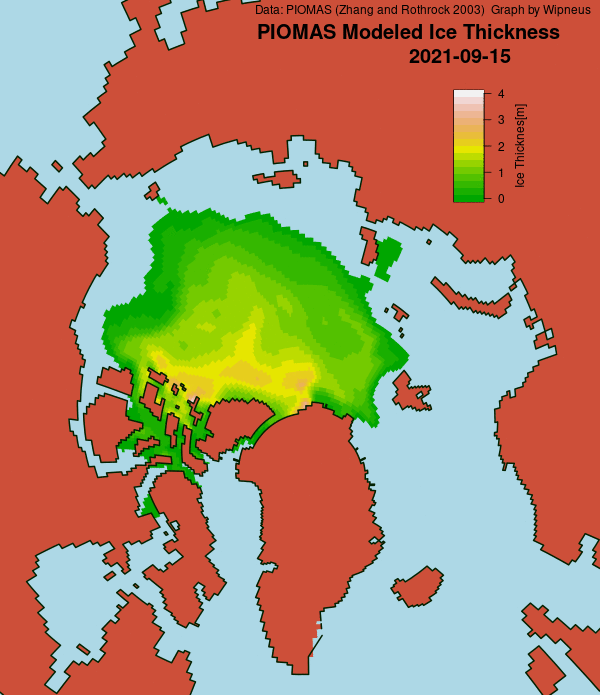
As Wipneus puts it on the Arctic Sea Ice Forum, “PIOMAS has updated the gridded thickness data up to the 31st of August”. Here’s the latest modelled thickness map, which shows the thickest remaining ice located north of the Canadian Arctic Archipelago rather than north of Greenland:
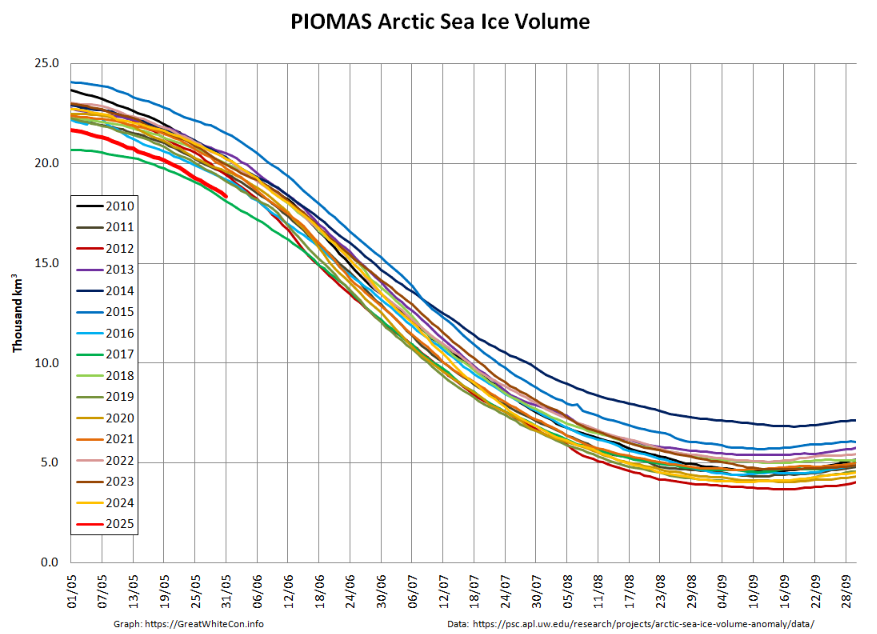
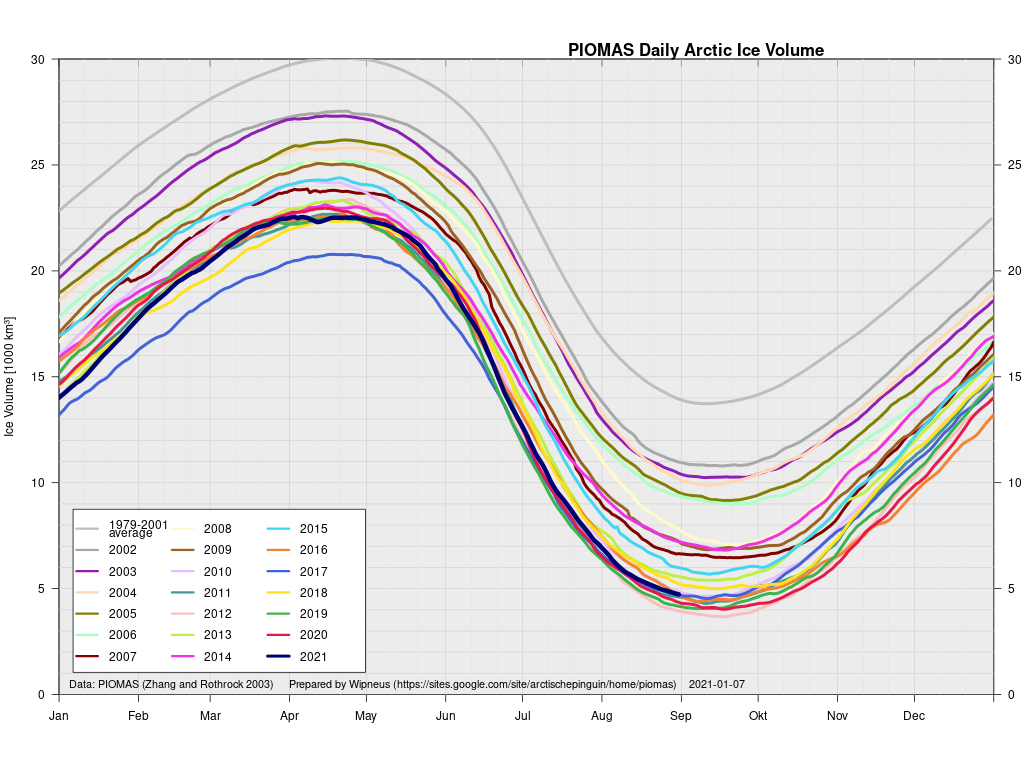
The accompanying volume graph shows 2021 in 7th lowest position, at 4.7 thousand km3:
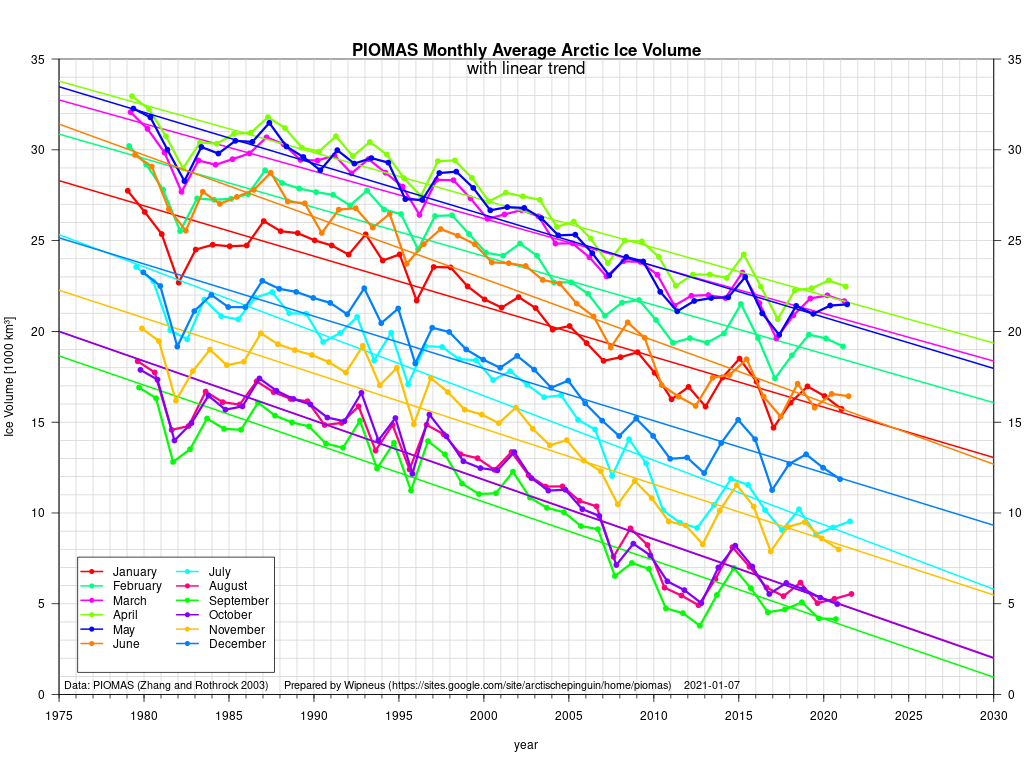
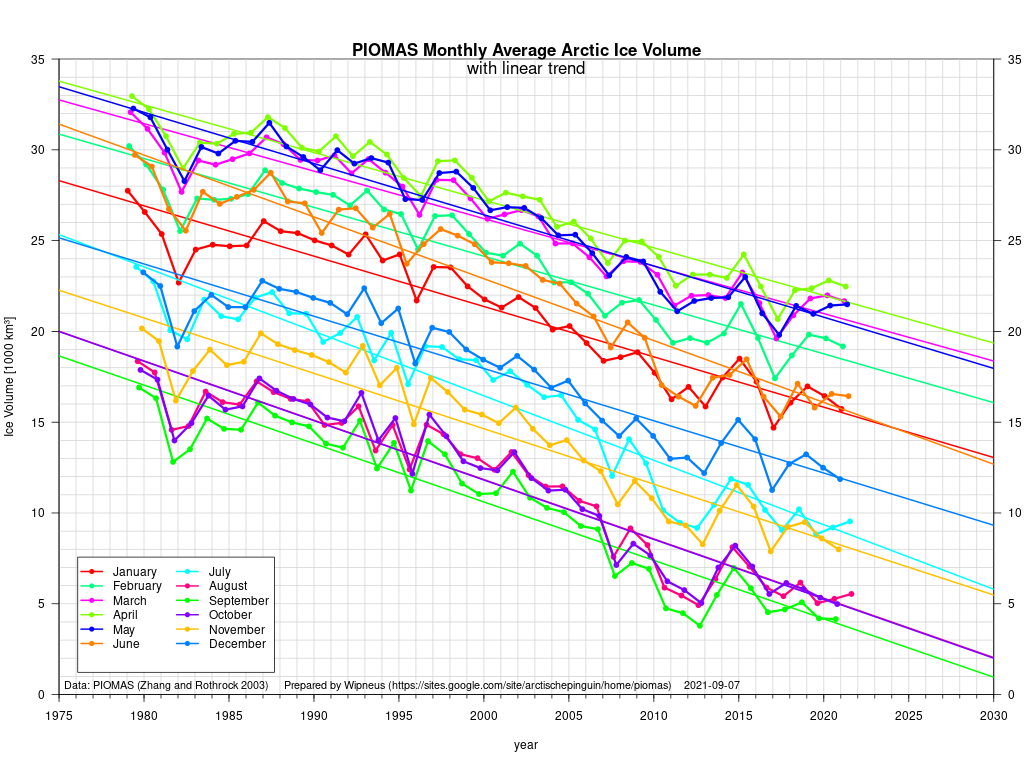
Here too are the current PIOMAS volume trends for each month of the year:
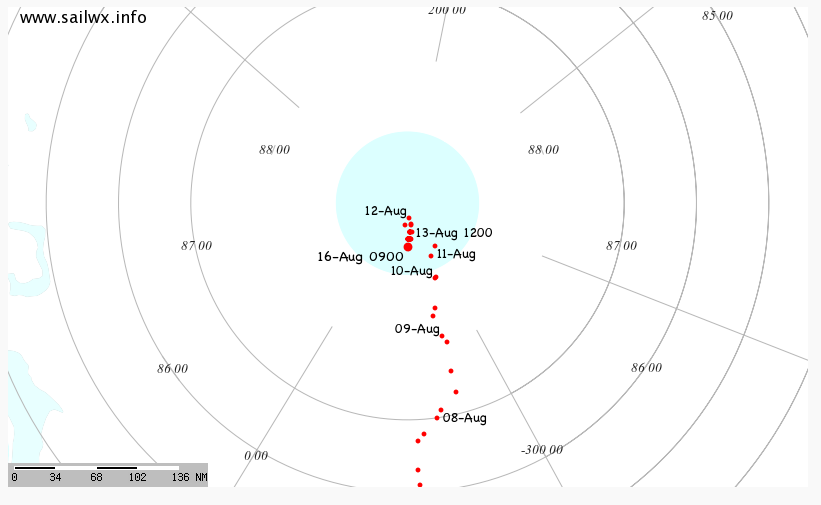
The Swedish icebreaker Oden has recently been exploring the area between northern Greenland and the North Pole as part of the Synoptic Arctic Survey expedition:
Here are the measurements of water temperature it has recorded over the past few days:
Ranging between -0.4 °C and -1.0 °C it doesn’t look as though the 2021 refreeze will be starting in the Wandel Sea just yet.
That shows plenty of old ice still left in the Beaufort Sea. However ice mass balance buoy 52460 now appears to floating free of its ice floe at 75.56 N, 165.99 W:
[Edit – September 14th]
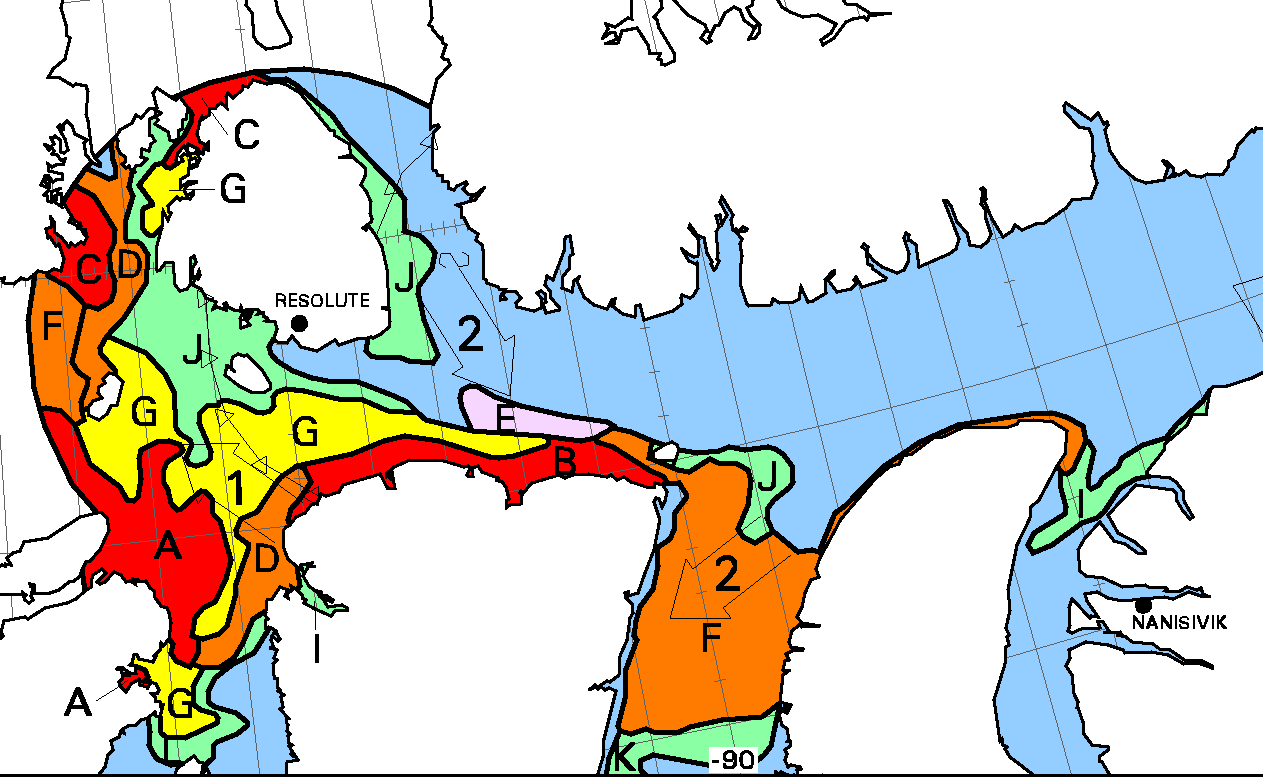
“New ice” has started to appear in previously open water on the Canadian Ice Service charts. See area E south east of Resolute:
Volume calculated from the thickness data currently show that 2021’s minimum was reached on September 7th at 4.64 thousand km3, which is the 8th lowest value in the Polar Science Center’s record.
[Edit – September 23rd]
NASA have just announced a new paper about clouds in the Arctic. Highly relevant given their recent overview of the 2021 melting season!
Clouds are one of the biggest wildcards in predictions of how much and how fast the Arctic will continue to warm in the future. Depending on the time of the year and the changing environment in which they form and exist, clouds can both act to warm and cool the surface below them.
For decades, scientists have assumed that losses in Arctic sea ice cover allow for the formation of more clouds near the ocean’s surface. Now, new NASA research shows that by releasing heat and moisture through a large hole in sea ice known as a polynya, the exposed ocean fuels the formation of more clouds that trap heat in the atmosphere and hinder the refreezing of new sea ice.
The findings come from a study over a section of northern Baffin Bay between Greenland and Canada known as the North Water Polynya. The research is among the first to probe the interactions between the polynya and clouds with active sensors on satellites, which allowed scientists to analyze clouds vertically at lower and higher levels in the atmosphere.
The approach allowed scientists to more accurately spot how cloud formation changed near the ocean’s surface over the polynya and the surrounding sea ice.
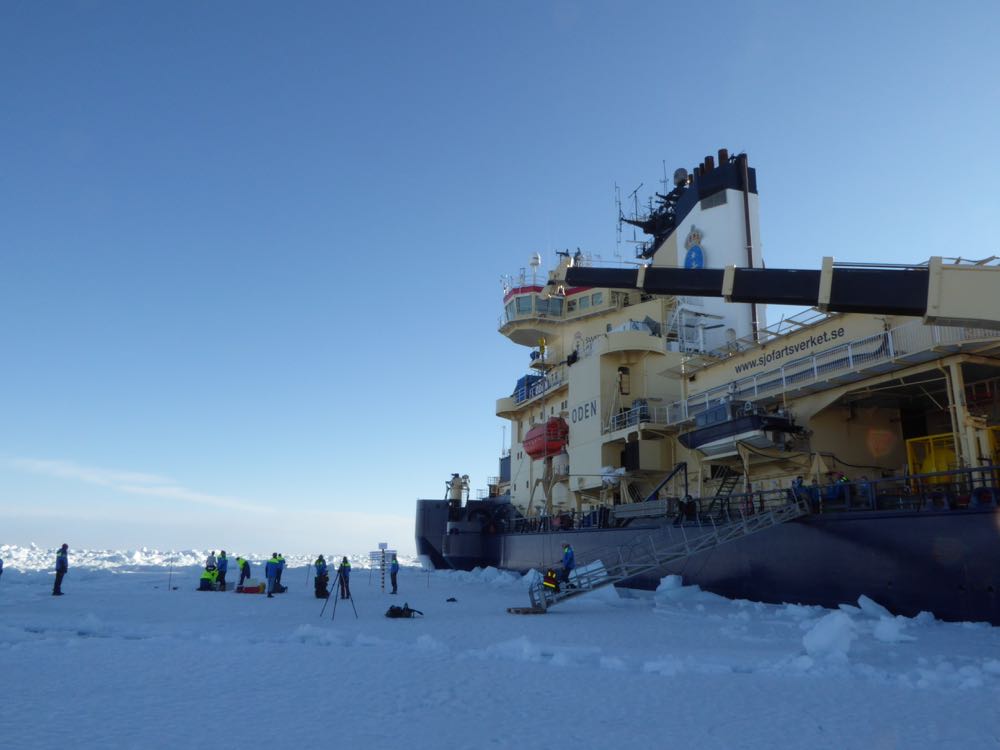
Our regular reader(s) may recall our extensive coverage of the Swedish icebreaker Oden’s visit to the North Pole (AKA Santa’s secret summer swimming pool) in 2016?
We are now able to report that Oden has been back at the North Pole once again, this time somewhat earlier in the season:
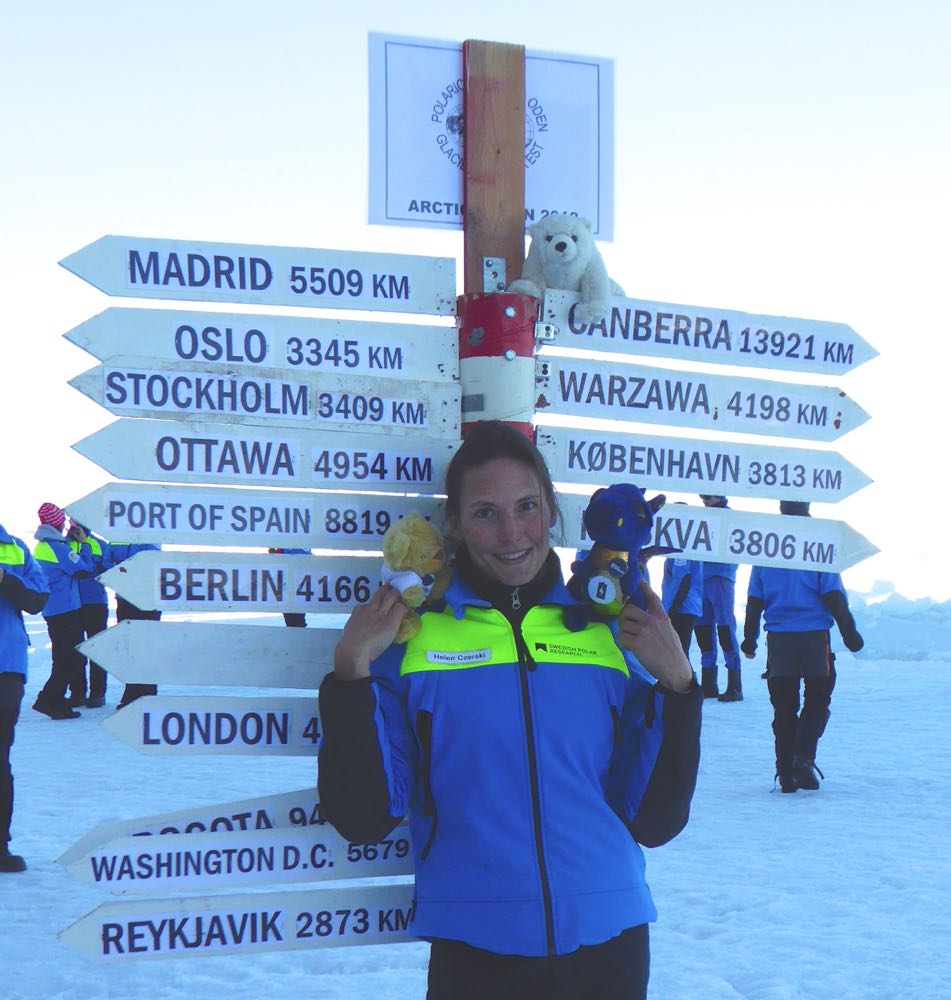
There’s not as much open water to be seen this year, although Oden’s visit is a week earlier than in 2016 so that may not be too surprising? What is perhaps surprising is that this year visiting the Pole wasn’t part of Oden’s plan! According to British physicist and oceanographer (and BBC TV star!) Helen Czerski:
We weren't really aiming for the pole, just to find a good ice floe as far north as possible. But we haven't found an ice floe yet and it looks as though I'll wake up tomorrow morning at the North Pole. Hello to the top of the world! #ArcticOcean2018pic.twitter.com/fDPnua4V6N
We’ll let you know her reply as and when we receive it!
This website uses cookies to improve your experience. We'll assume you're ok with this, but you can opt-out if you wish. Cookie settingsACCEPT
Privacy & Cookies Policy
Privacy Overview
This website uses cookies to improve your experience while you navigate through the website. Out of these, the cookies that are categorized as necessary are stored on your browser as they are essential for the working of basic functionalities of the website. We also use third-party cookies that help us analyze and understand how you use this website. These cookies will be stored in your browser only with your consent. You also have the option to opt-out of these cookies. But opting out of some of these cookies may affect your browsing experience.
Necessary cookies are absolutely essential for the website to function properly. This category only includes cookies that ensures basic functionalities and security features of the website. These cookies do not store any personal information.
Any cookies that may not be particularly necessary for the website to function and is used specifically to collect user personal data via analytics, ads, other embedded contents are termed as non-necessary cookies. It is mandatory to procure user consent prior to running these cookies on your website.