We’ll start the new month in traditional fashion. Here’s the high resolution AMSR2 sea ice extent and area:
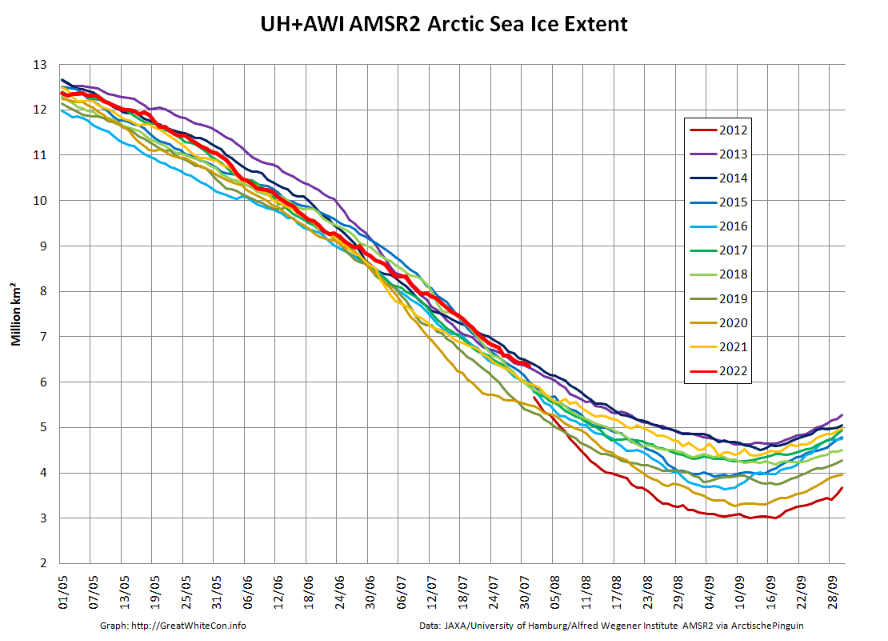
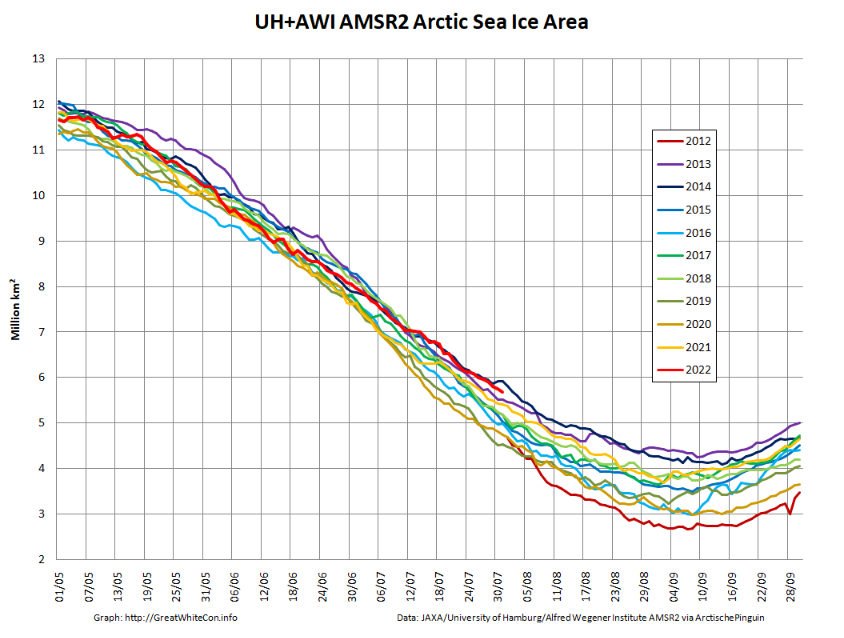
Extent decline in July proved to be somewhat sluggish by recent standards. A week ago I posed the question:
Is 2022 more likely to follow the path of 2012, 2013 or 2016 to this year’s minimum?
At the moment the answer seems to be “2013 Jim!”. However what about the condition of all that ice? Here’s the latest AMSR2 concentration map:
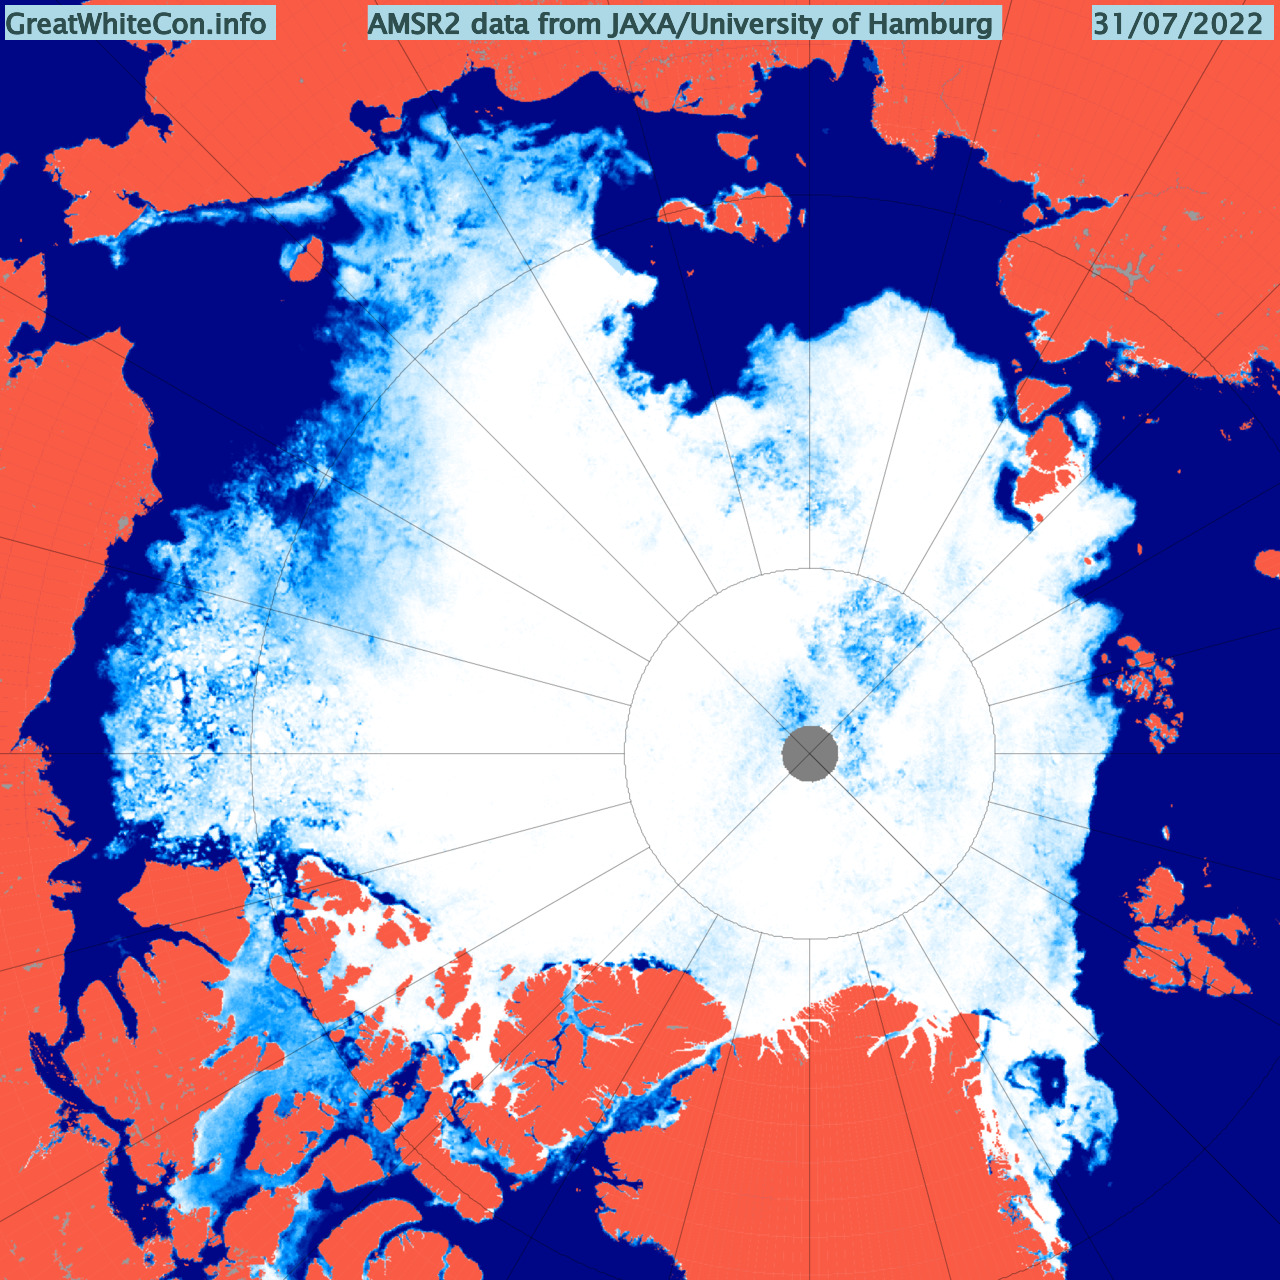
It reveals a large area of lower concentration ice on the Pacific side of the Arctic. There is also, particularly given the location, a large area of lower concentration near the North Pole. Here’s a much closer look at the ice around the Pole:
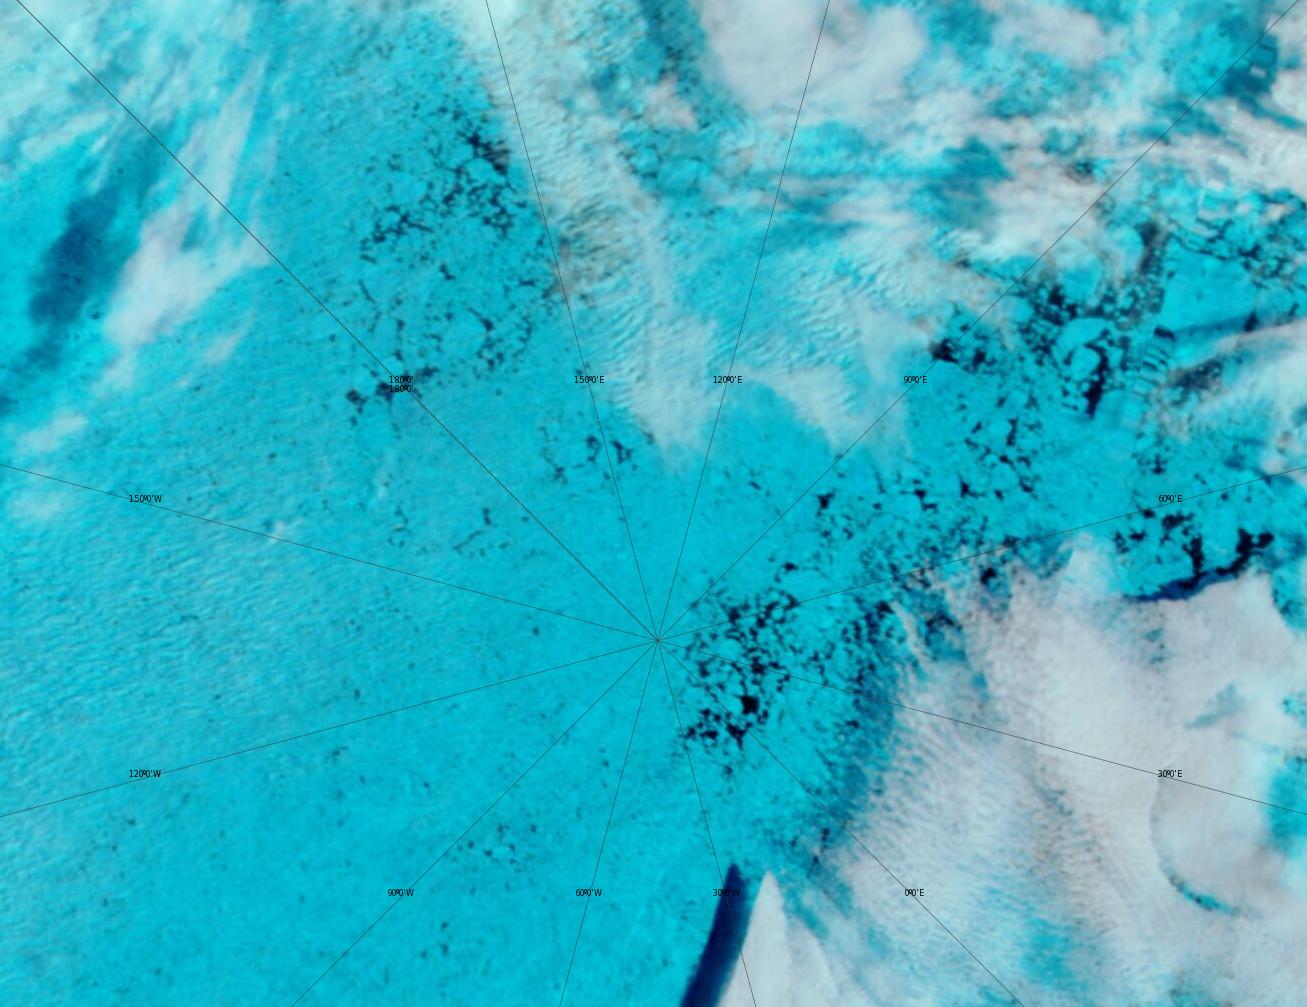
A lot of ice looks vulnerable if the weather becomes unfavourable for ice survival. However whilst low pressure is currently forecast to take over the Central Arctic there is nothing similar to the “Great Arctic Cyclone” of 2012 in sight at the moment.
[Edit – August 16th]The PIOMAS team’s July report has yet to appear on the Polar Science Center web site. However the gridded data was posted at the beginning of August so here is the “unofficial” Arctic sea ice thickness map for July 31st:

Plus PIOMAS volume via Steven/Gerontocrat on the Arctic Sea Ice Forum:
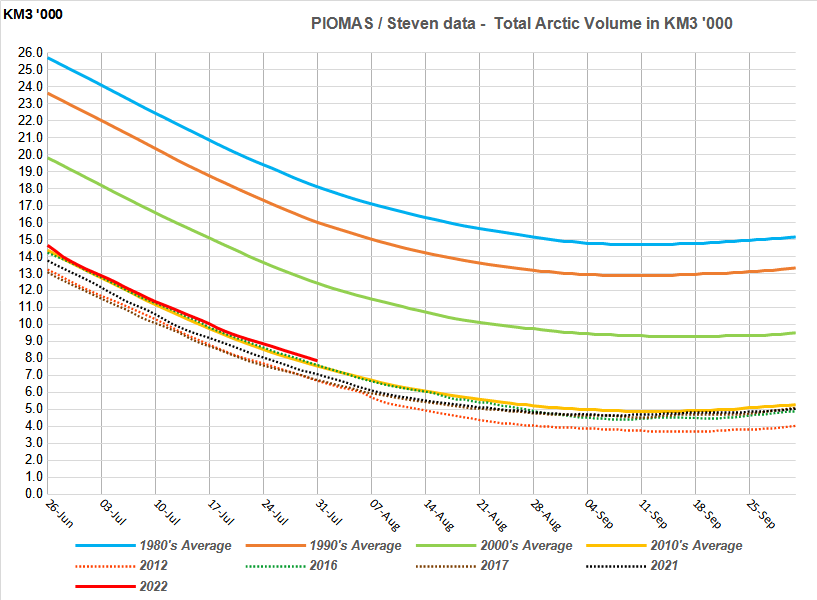
[Edit – August 25th]PIOMAS Volume as at 31 Jul 2022 7,848 km3
Volume is at position #11 in the satellite record
The PIOMAS July report is still conspicuous by its absence. However the mid month gridded thickness data has been released so here is the “unofficial” Arctic sea ice thickness map for August 15th:

Plus the daily volume graph:
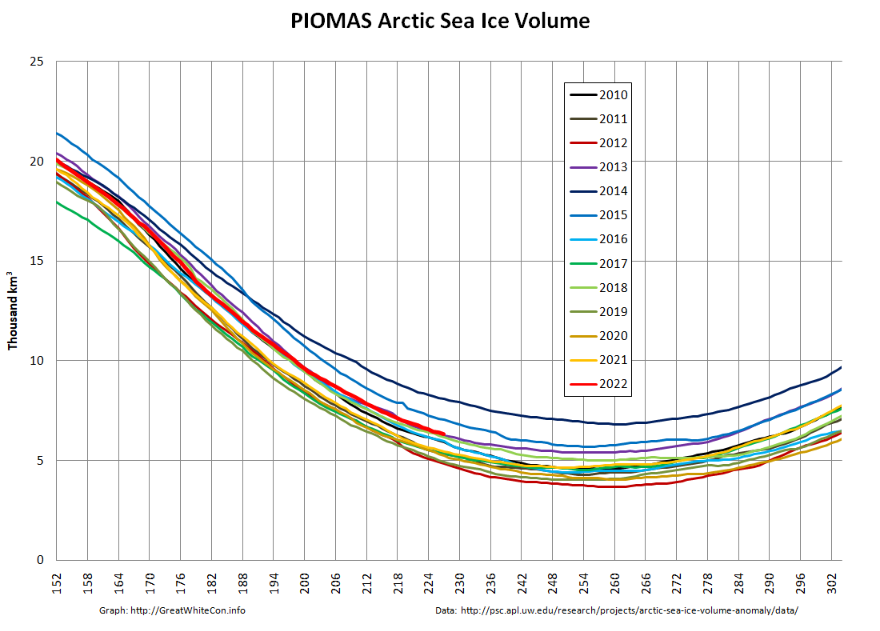
On August 15th volume was 6.312 km3, still 11th lowest in the satellite era.
[Edit – August 27th]The August 2022 Sea Ice Outlook has now been published by the Sea Ice Prediction Network:
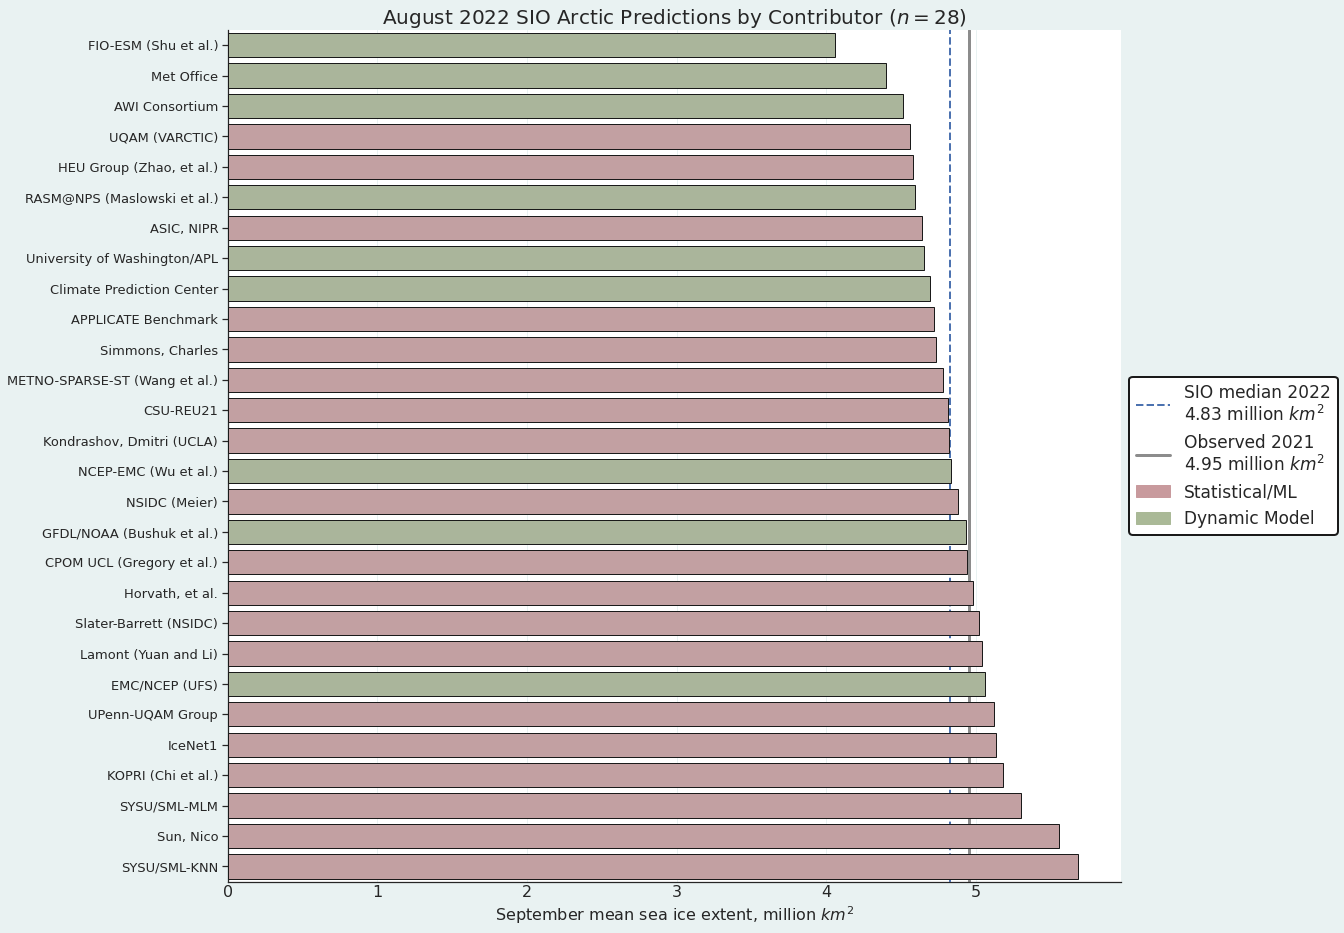
The Pan-Arctic August Outlook median forecast value for September 2022 sea-ice extent is 4.83 million square kilometers, with upper and lower quartile values of 4.6 and 5.0 million square kilometers, respectively. The median of the August submissions is higher than that from July (4.64 million square kilometers) and June (4.57 million square kilometers). Based on the National Snow and Ice Data Center (NSIDC) Sea Ice Index (SII), the Arctic sea-ice extent index is 6.16 million square kilometers, as of 15 August 2022.
As of mid-August, ice extent was lower than normal in most sectors of the Arctic Ocean, with the exceptions being the Beaufort Sea where the ice edge was near normal, and most notably the East Siberian Sea, where ice still extended to the coast. The atmospheric circulation in July to mid-August tended towards cloudier skies and spreads out the ice, both of which can slow the decline in ice extent and result in higher September mean sea-ice extent if such conditions prevail. It will be interesting to see if the mean September sea-ice extent in 2022 is above 5.0 million square kilometers. While none of the July-August median forecasts were 5.0 million square kilometers, nine of the 28 August SIO contributions forecast 5.0 million square kilometers or more for September mean sea-ice extent.
Further news is now available on the September open thread.
Month end sea ice extent for July was well above 2010’s average.
Since August last year it has only been below the 2010’s average once at the end of March!
Jan.31st. 16th.lowest. +333,064 sq.km. above 2010’s average.
Feb.28th. 11th.lowest +116,764 sq.km. above 2010’s average
Mar.31st. 10th.lowest -127,470 sq.km. below 2010’s average
Apr. 30th.14th.lowest +16,886 sq.km. above 2010’s average
May. 31st. 15th lowest +395,097 sq.km. above 2010’s average
Jun. 30th. 10th.lowest +35,744 sq.km above 2010’s average
Jul. 23rd. 11th lowest +222,533 sq.km. above 2010’s average
Aug.1st. 11th.lowest +203,902 sq.km. above 2010’s average
What will happen in August this year?
There will be some surprises!
Here’s the first slight surprise. According to the GWC custom criterion, plagiarised from the CIS many moons ago, the Northwest Passage is “open” for “small craft” remarkably early this year:
https://GreatWhiteCon.info/2022/06/the-northwest-passage-in-2022/#Aug-04
I did try telling you.. ♂️
Don’t count your chickens Matt…
Interesting times! With 4 weeks or less to go, NSDIC indicates that to get to 4.6M km^2, Arctic extent will need to average roughly 500 km^2 a week, or about 70 Km^2 per day through the rest of the melt season. And that’s at a time when insolation is slowing down due to the coming solstice. My bet of 4.5 is looking pretty good now, unless there are some impending massive storms.
I notice our friends at PIOMAS have not weighted in on volume yet, but if DMI is to be believed, 2022 is starting to separate from 2018, but is unlikely to fall below other recent years. The excitement is building!
Jim, did you have a 2022 prediction?
I did indeed Taylor. Way back in April I opined:
Very droll, Jim! So if I understand correctly you’re saying that a key metric of Climate Change depends on the weather. I can’t wait to see that headline in the Guardian!
I believe you, BTW
On a time scale or a few weeks, certainly.. even a year or too!
You misunderstand Taylor!
The “key metrics” in any particular year are highly dependant on that summer’s weather.
The long term trend in volume/extent is nevertheless down. See for example:
It was a joke, Jim
Arctic ice is probably now about the same as it was around 1940.
Welcome Peter,
Do you by any chance have any evidence for that “probable” assertion?
By way of an alternative interpretation, did you know that Henry Larsen in St Roch had to spend the period between September 3rd 1941 and August 4th 1942 in Pasley Bay. Here are a few of the last remaining fragments of sea ice on the southern route through the Northwest Passage, recorded at Pasley Bay earlier today:
Hi Taylor,
August melt rate seems to be slowing down.
Now risen to +407,387 Sq.Km. above 2010’s average.
We can only wait to see what happens in September.
Jan.31st. 16th.lowest. +333,064 sq.km. above 2010’s average.
Feb.28th. 11th.lowest +116,764 sq.km. above 2010’s average
Mar.31st. 10th.lowest -127,470 sq.km. below 2010’s average
Apr. 30th.14th.lowest +16,886 sq.km. above 2010’s average
May. 31st. 15th lowest +395,097 sq.km. above 2010’s average
Jun. 30th. 10th.lowest +35,744 sq.km above 2010’s average
Jul. 23rd. 11th lowest +222,533 sq.km. above 2010’s average
Aug.12th. 12th.lowest +407,387 sq.km. above 2010’s average
Just checked ASIF, we’re about to enter the top 20 lowest minimum (JAXA) of the now 44 year satellite era, no minimum has occurred before September of course!
Looking at the university of Bremen map, there’s still quite a lot of ice could melt out, if the wind blew in from the south!
Another 4 weeks will tell all!
Jim says we must look out for a surprise!
Here’s another one, and it’s not even mid August yet!
Speaking of surprises, does anyone know what’s going on with the PIOMAS folks? They’ve sometimes been late releasing their previous month’s analysis, but never this late (now in second half of following month). DMI shows steady downward trend this month, but no seeming challenge to earlier (and lower) years. Jim, have you heard anything from those folks on our left coast?
Perhaps they’re all on a well earned summer vacation?
However please see above.
Thanks for posting some PIOMAS data, Jim. Interesting to confirm, as does DMI as well, that volume continues to be above 2010s average.
Well, our friends at NSIDC are certainly not on vacation. Their recent post actually estimates that Arctic minimum extent has a 30% chance of being 5M km^2 or more this season, based on historical rates of reduction from this point forward. That would shake up the extent contest quite a bit!
Seems like that ‘rotten ice’ is holding its own, particularly now that 80 degree North temps are back at the freezing point and surface water will begin to skim over. The next (3?, 4?) weeks will be interesting. They are also predicting that the Northeast Passage will not be ice-free this season, although the icebreakers and ice-hardened ships are making it through.
Maybe PIOMAS is delayed due to a broken ‘spin machine’ – I think they’ll need it this season, or doubt might spread through the climate multiverse…
The NSIDC actually say that “For the first time since 2008, the Northern Sea Route along Eurasia may not become ice free.”
Hardly a “prediction” that it “will not be ice-free”?
At least they’ve worked out that “The southern route of the Northwest Passage through the Canadian Archipelago appears to be mostly free of ice” now!
“May not be ice-free” vs. “will not be ice-free”. My mistake, it’s tough to get these guys to actually make a prediction (always the weasel-words). I shouldn’t have pushed them to a commitment, but I’ll make one. Given the current situation, the temperature profile, and the declining isolation, I’ll say it WILL NOT become ice-free this season. I may turn out to be wrong, but unlike much of climate science, My position is falsifiable.
That “arm” of ice in the East Siberian Sea seems to be retreating in the last couple of Bremen maps.
Yes, will be interesting to watch. DMI shows at least one of the arms to be solidly in place, with 2+ meter ice in a band near shore. Rate of reduction in volume is slowing as it gets colder and insolation declines. Next few weeks should be interesting…
Just checked tat eastern Siberian coast situation. GOFS has near-coastal ice at no more than .5 meters, DMI insists it is 2+ meters. Ah, August, when all the algorithms go berserk. You’d think, given the major descrepancy, somebody would go take a look. Maybe they could hitch a ride on one of those fortified tankers?
The official AARI charts now show the ESS section of the NSR to be “open”, albeit still some way from “ice free”:
I guess we should begin to question what’s happening with the July PIOMAS report. In another week it will be time for them to start calculating the August report, and still no sign of July. Did I miss the memo, Jim?
I blinked and missed it too Taylor.
See above.
Thanks for posting the mid-month report, Jim. Looks like 2022 continues above the 2010s average, and DMI has it currently slowing in line with average trends.
Frankly, I’m surprised. I was expecting volume to decrease more, given the reported state of the ice earlier in the season.
The thin peripheral ice has suddenly started to vanish from AMSR2:
Let’s see how long that continues, and what effect it has on PIOMAS’s volume calculations.
The last day of August JAXA about to cross 5 million KM,
Will we have an early or a late minimum!
Here is the current state of play, courtesy of Zack Labe:
IMHO it all depends on the weather!
Nice graphic, Jim. We posted at the same time, so I didn’t have the benefit of this more precise data. Is their a similar chart for NSIDC, which is the metric for the extent contest? JAXA is consistently lower than NSIDC, so I’m not sure how to translate. I know I could do the work myself, but thought you might have it already at hand.
Never mind, Jim, I found what I needed at Zack Labe’s site, thanks for the reference!
See also a new post dedicated to the 2022 minimum extent:
https://GreatWhiteCon.info/2022/09/the-2022-arctic-sea-ice-minimum-extent/
Zake, aswell as you Mr Jimmy White(didn’t he play snooker?!!?- ah maybe it is you?!??), have to be some of the best graphics contributors for climate change over the last decade or more… Your efforts are more than appreciated by generations more than mine I suspect.
Thanks for your kind words, although it is a very long time since I attempted to play snooker!
Both the 2000s average and the 2010s average were roughly mid-month, no reason that I can see, barring a big weather event, why 2022 wouldn’t be in that category, and temps are falling, albeit a bit slower than average. I’m guessing mid month, 14th or 15, so not much chance of an early minimum, and I don’t see anything that would indicate a late minimum. That would take a compaction event, not much melting left to go. Just my two cents, I have neither a crystal ball nor extensive expertise.
BTW, per DMI, the Greenland Surface Mass Balance year closed with a few record accumulation days, and at a significantly above average level of more than 450GT. Combination of more moisture and low temps really built the snow pack, there should be some spectacular calving as all that ice slides downhill and into the sea.
[Embedded image – Mod]
Meanwhile in the DMI‘s new SMB year:
I’ll give you a game next time you’re in Perth, Western Australia!
Also, some good waves here if you’re into that sort of stuff..
I’m into good waves far more than snooker!
My four word combo for wordle starts with “tubes”…it works about 95%!!