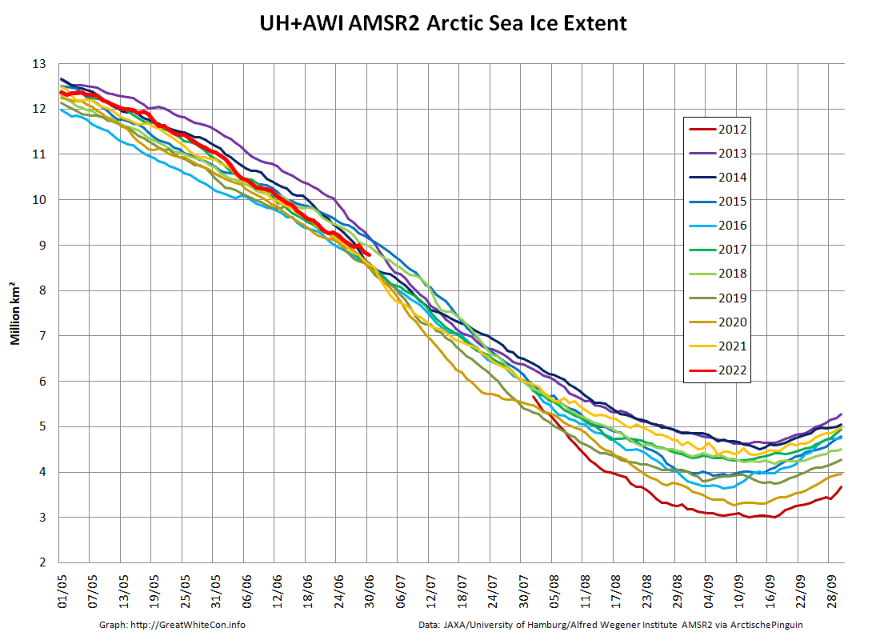
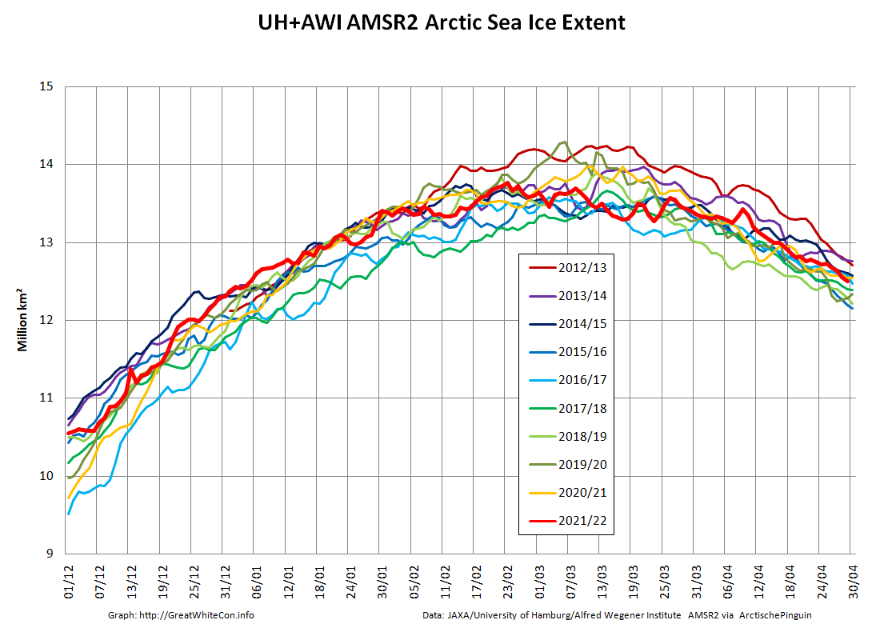
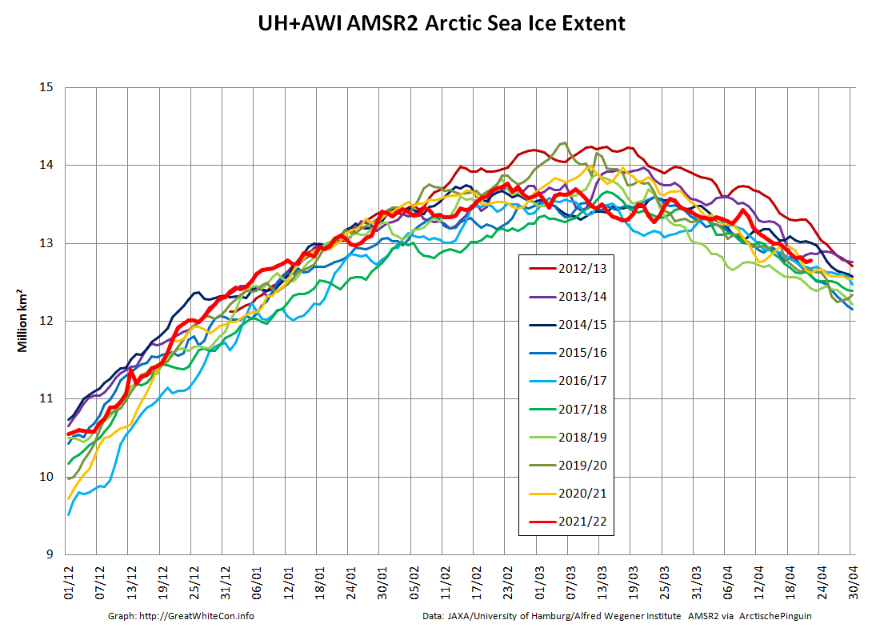
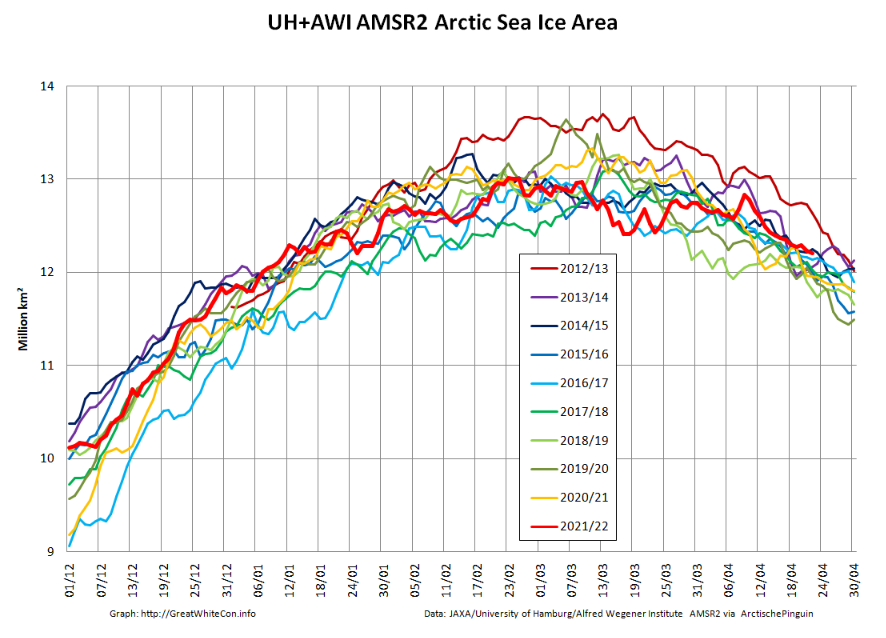
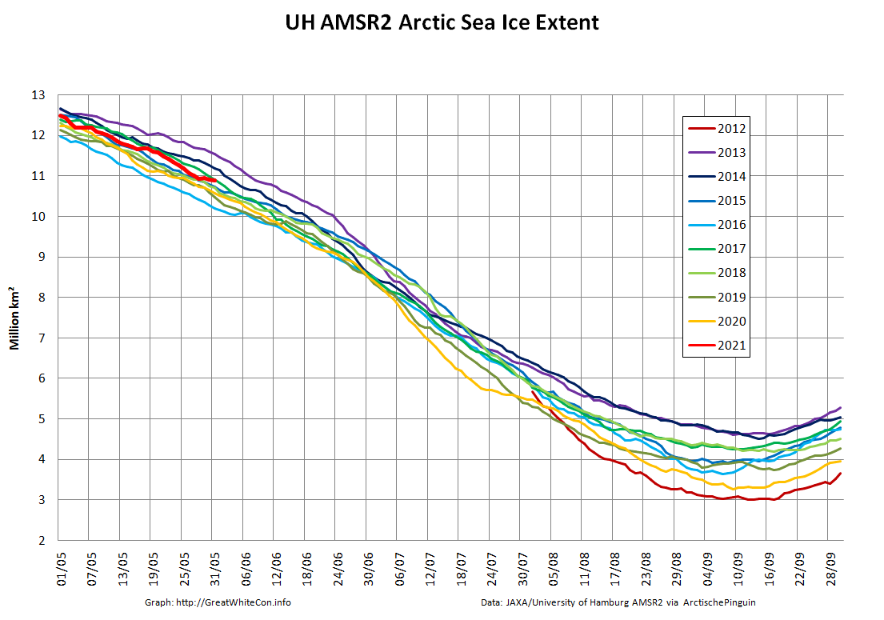
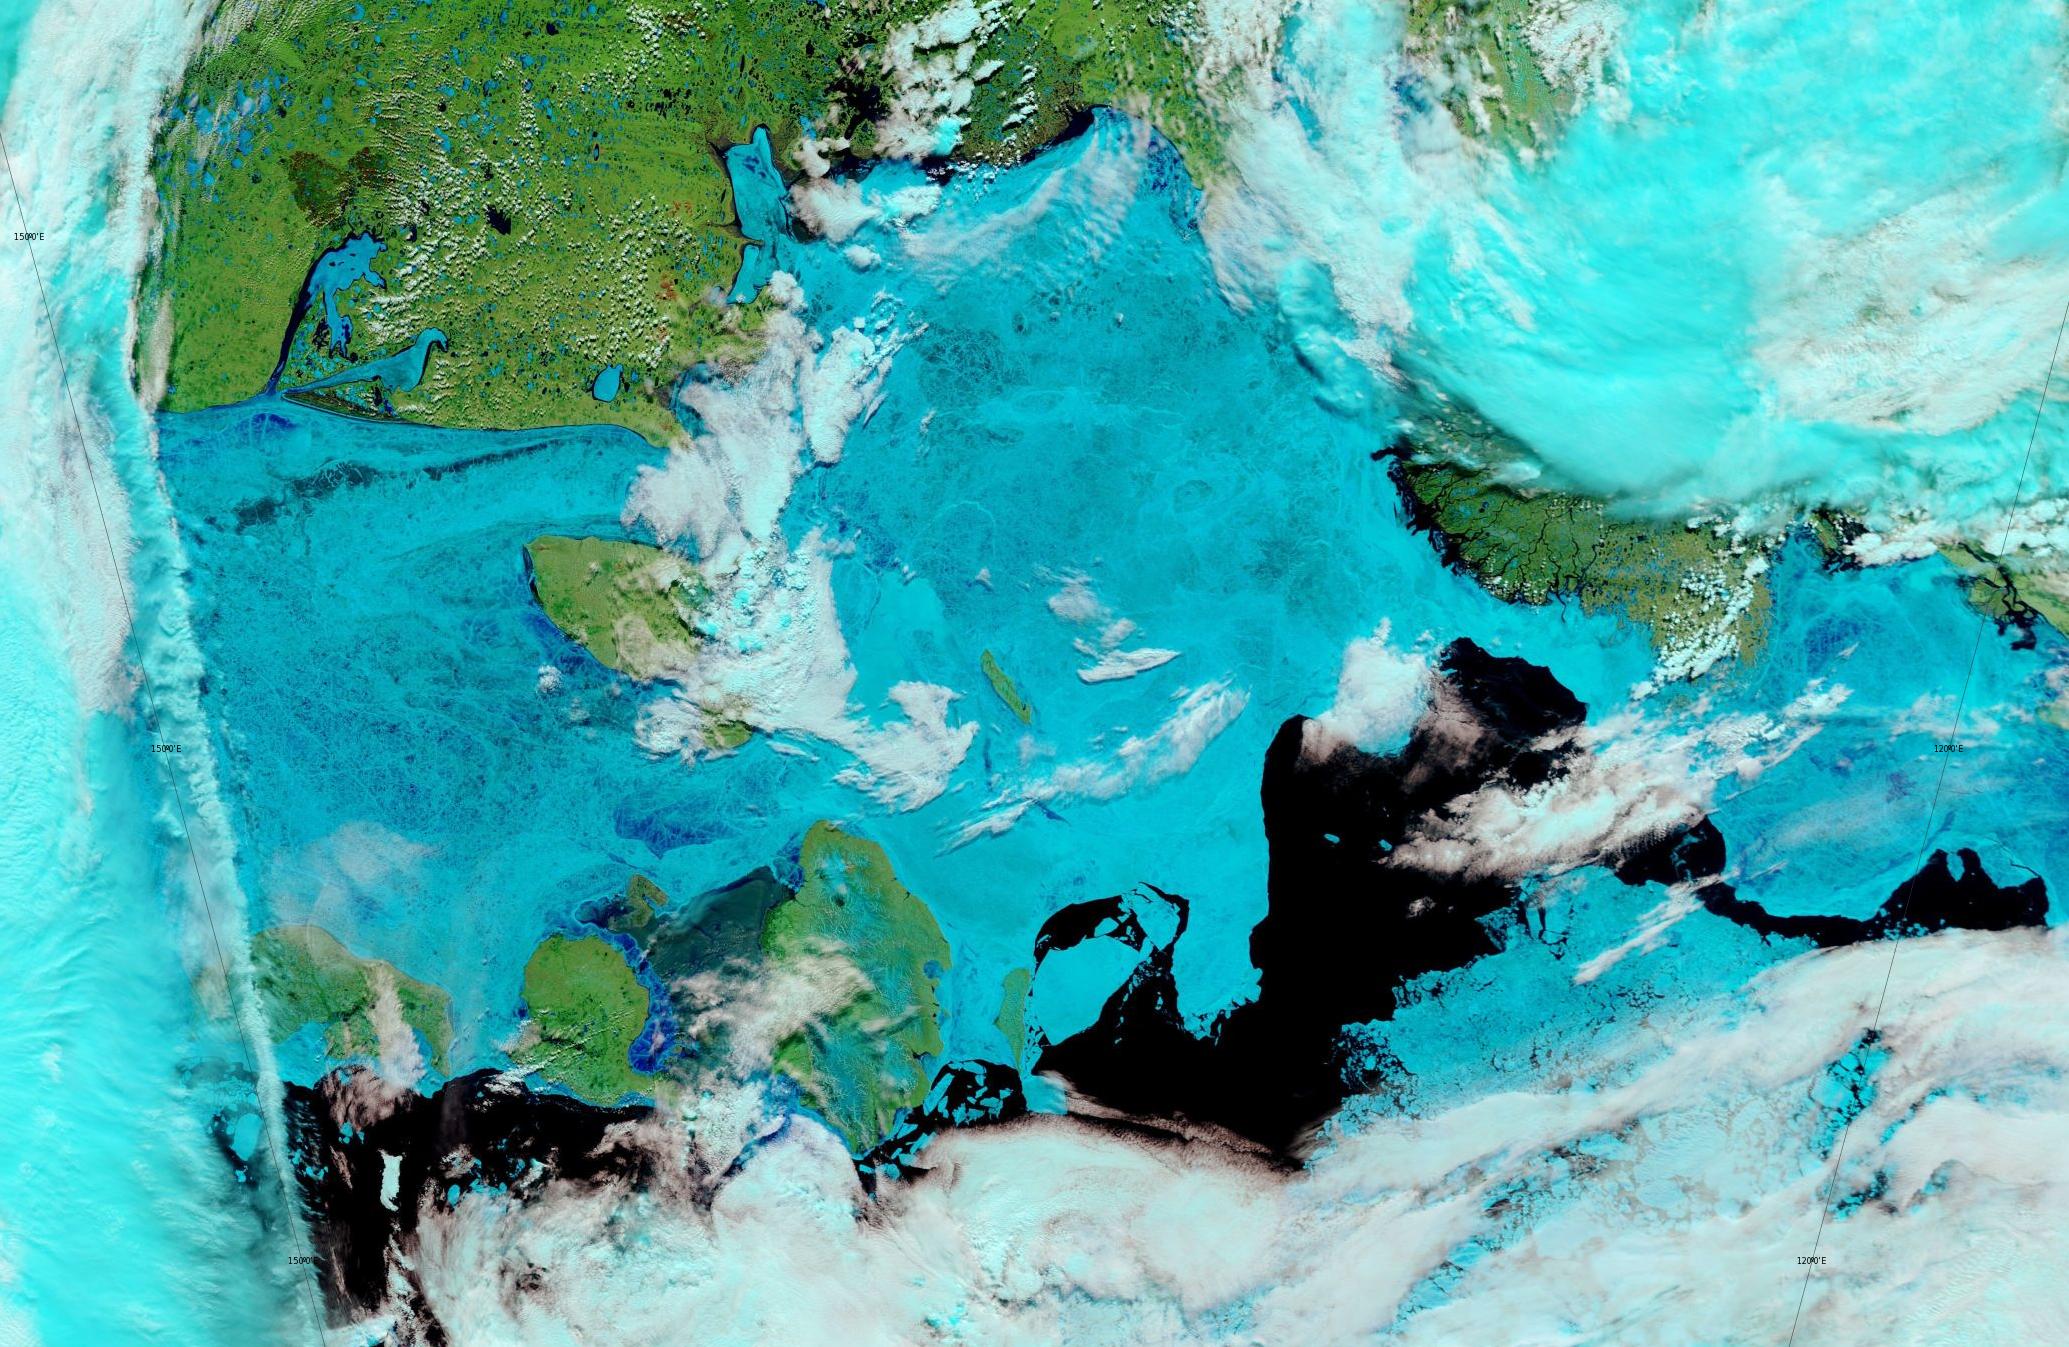
After a relatively rapid decline at the beginning of June Arctic sea extent is now very close to the 2010s average:
Both 2020 and 2021 began relatively rapid declines of their own at the beginning of July, so it will be interesting to see if 2022 follows suit.
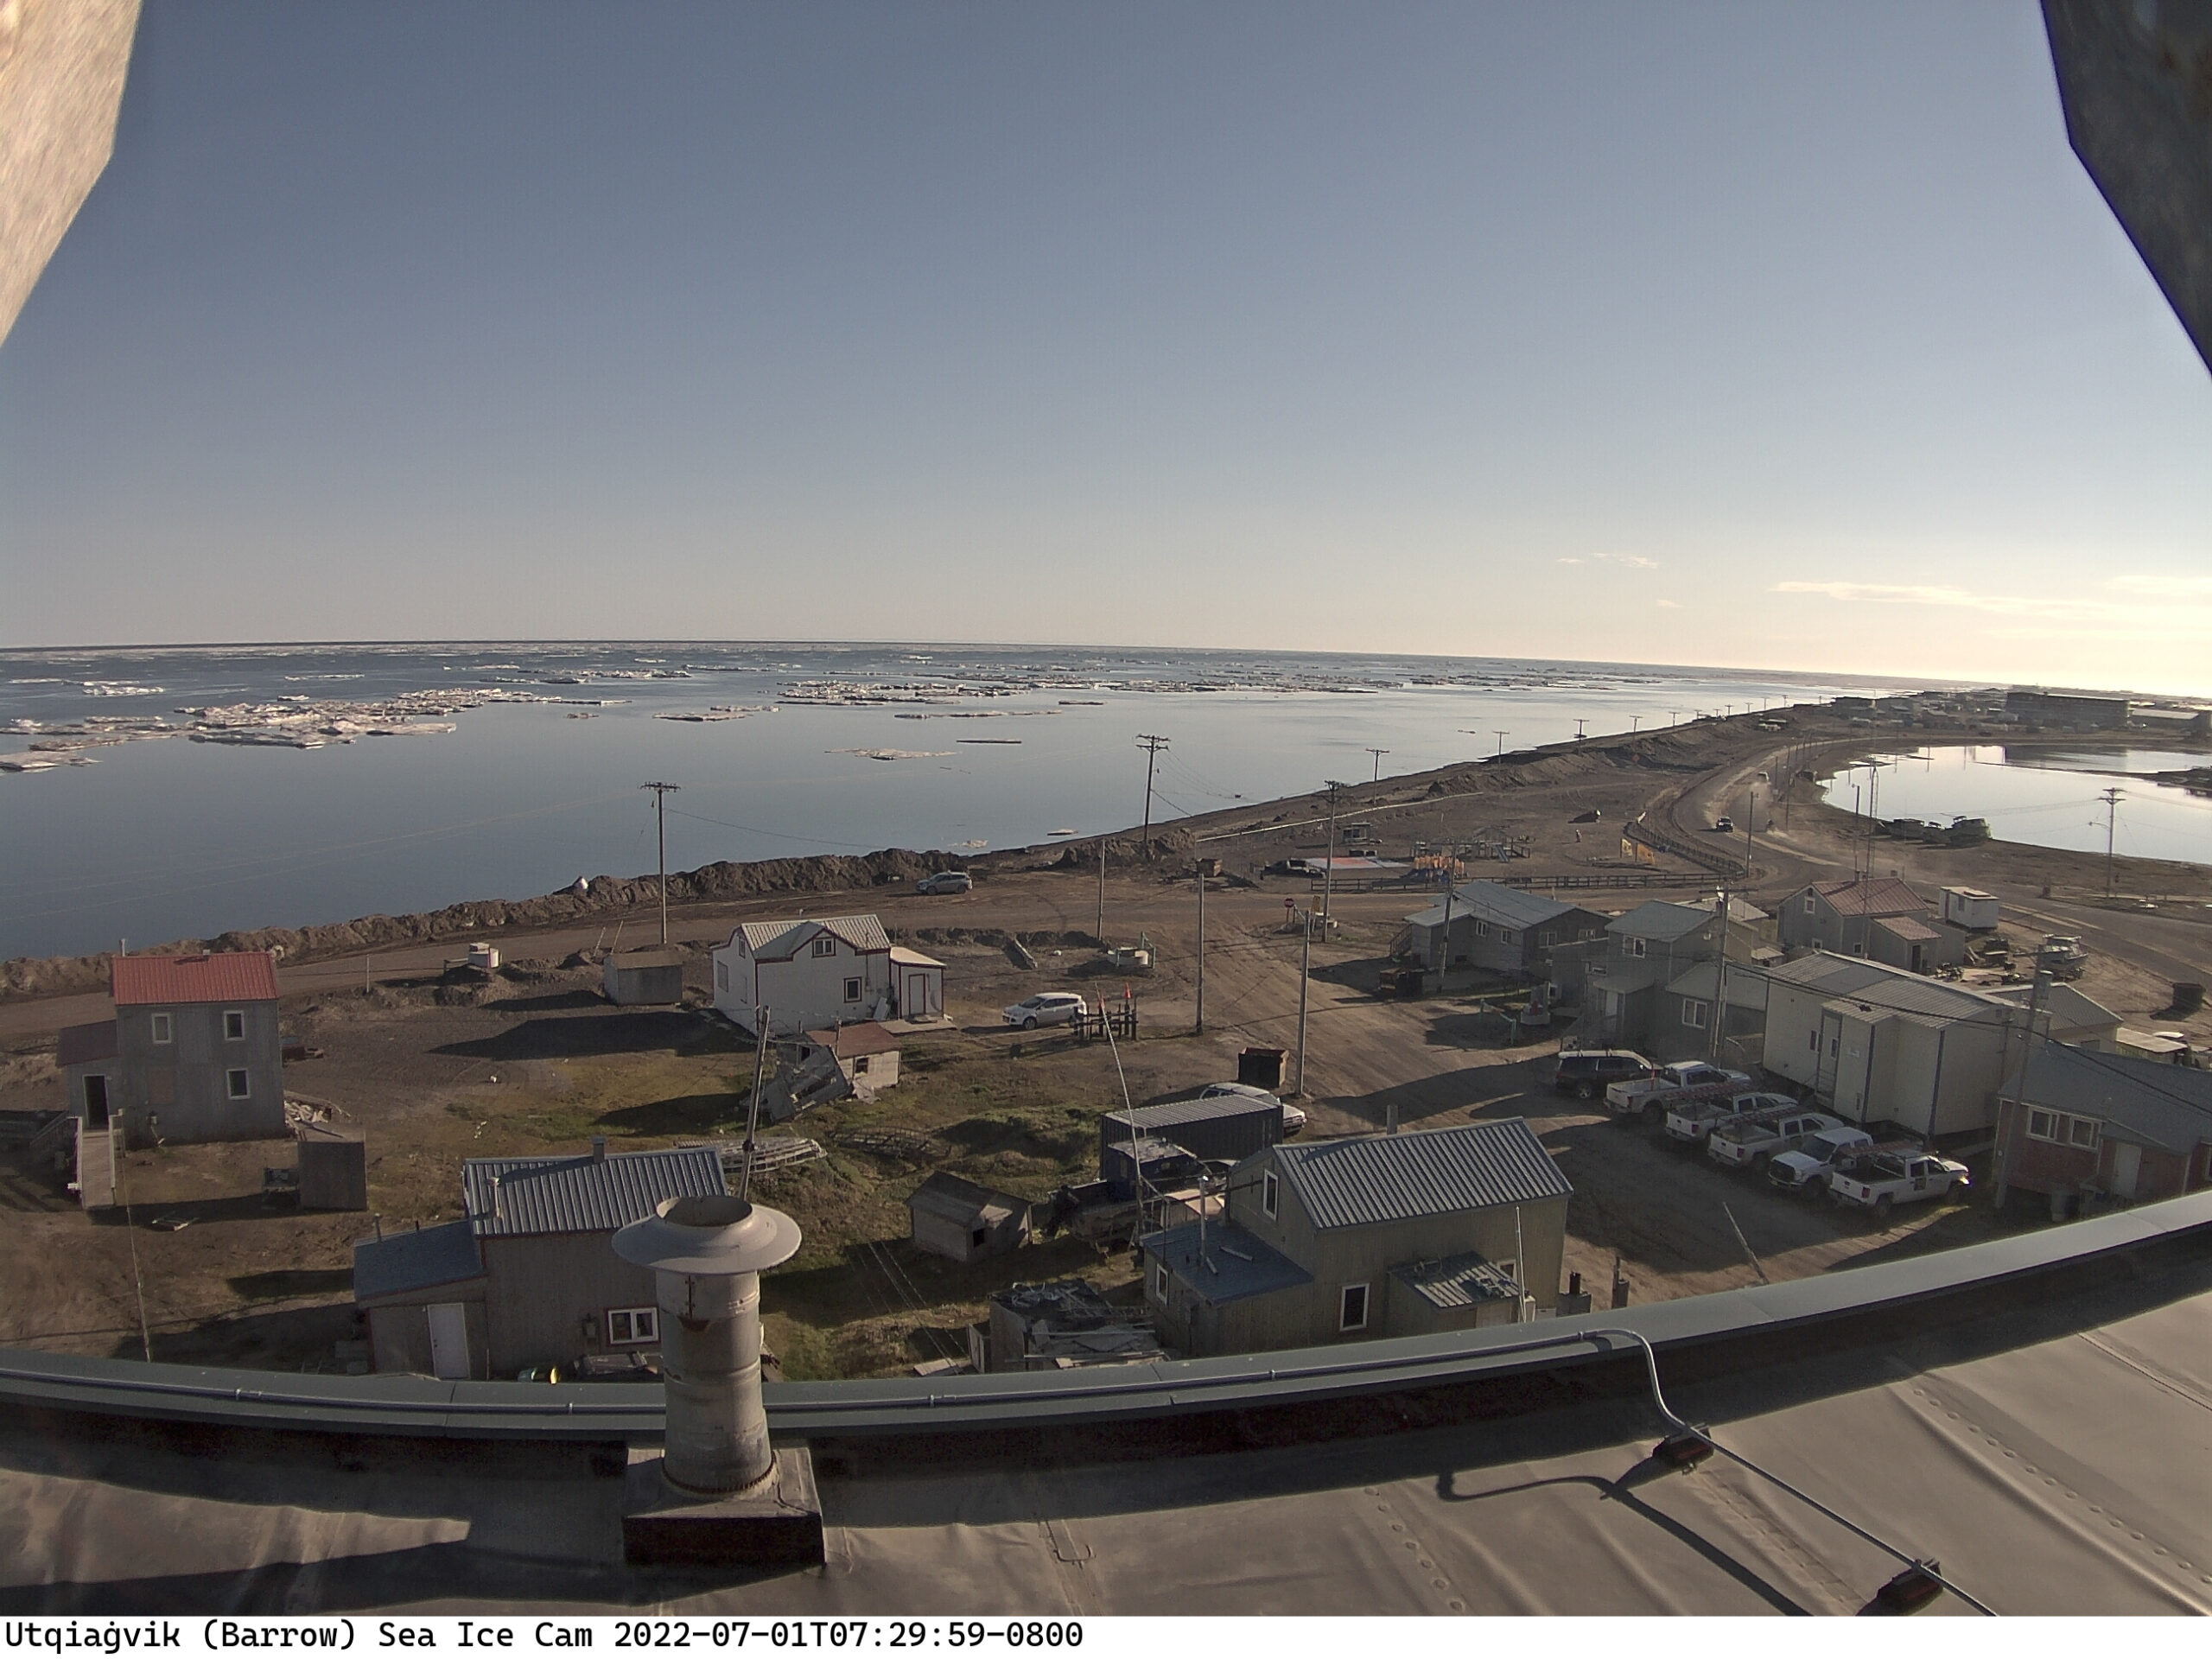
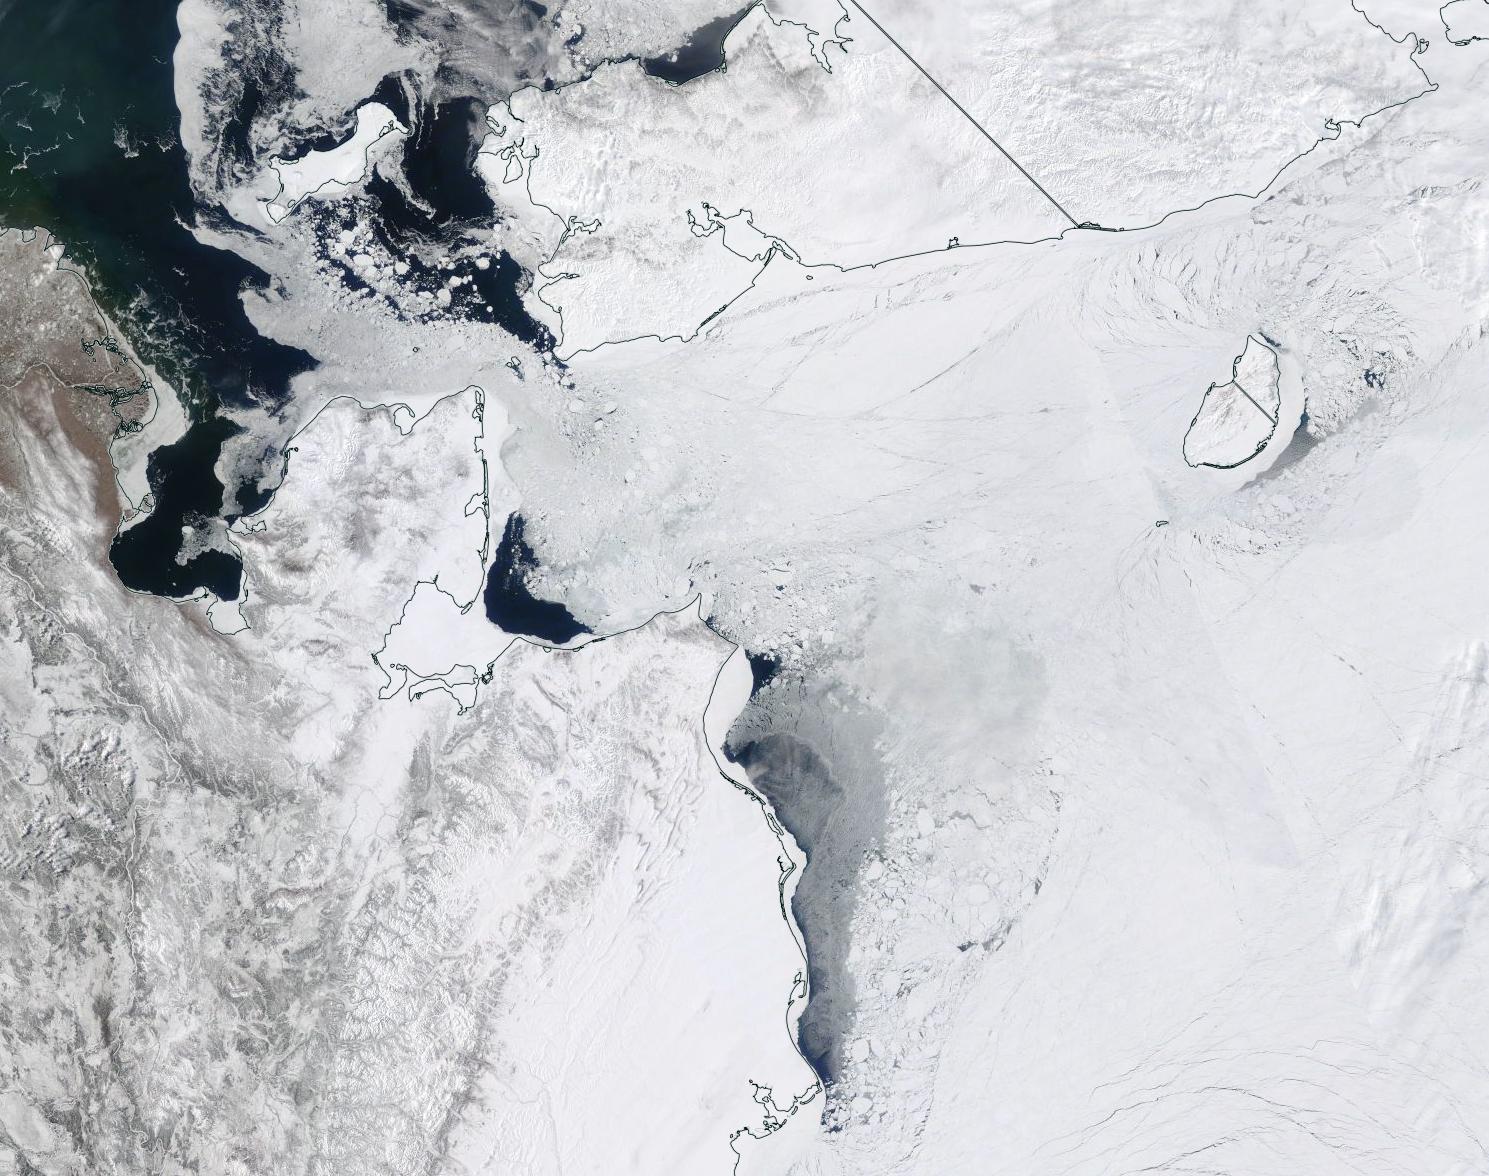
Most of the fast ice off Utqiaġvik has recently disappeared:
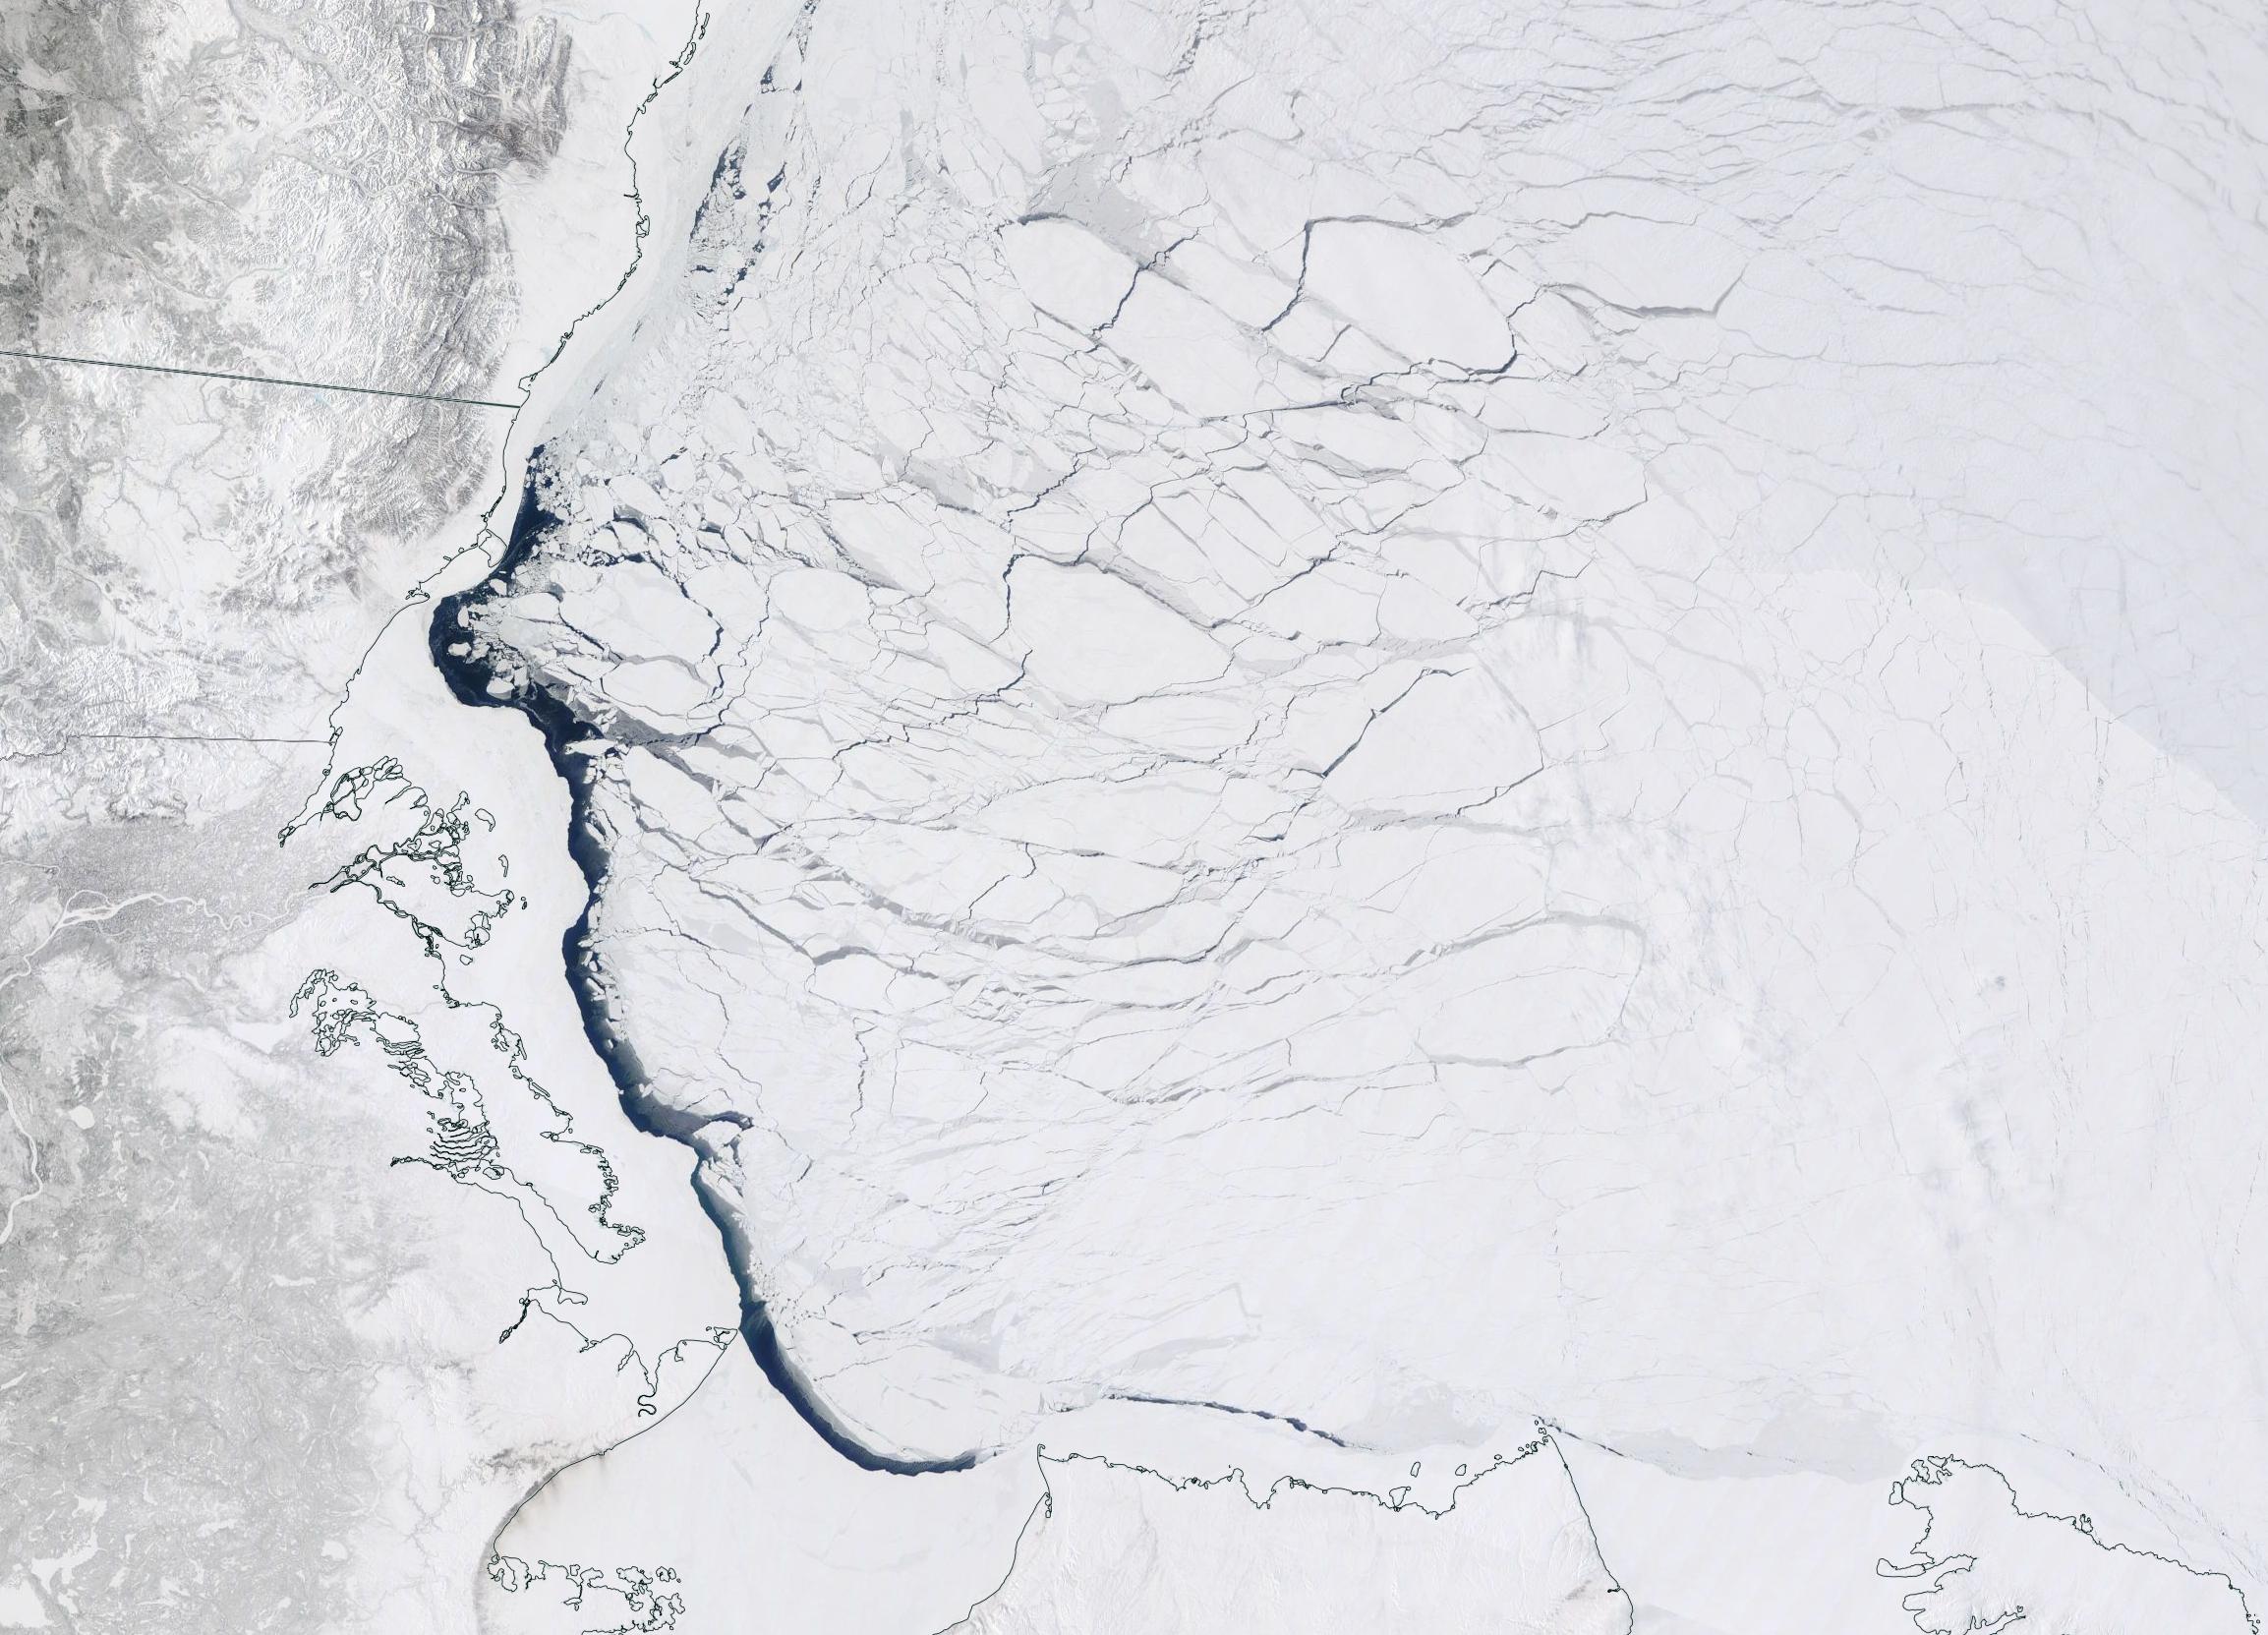
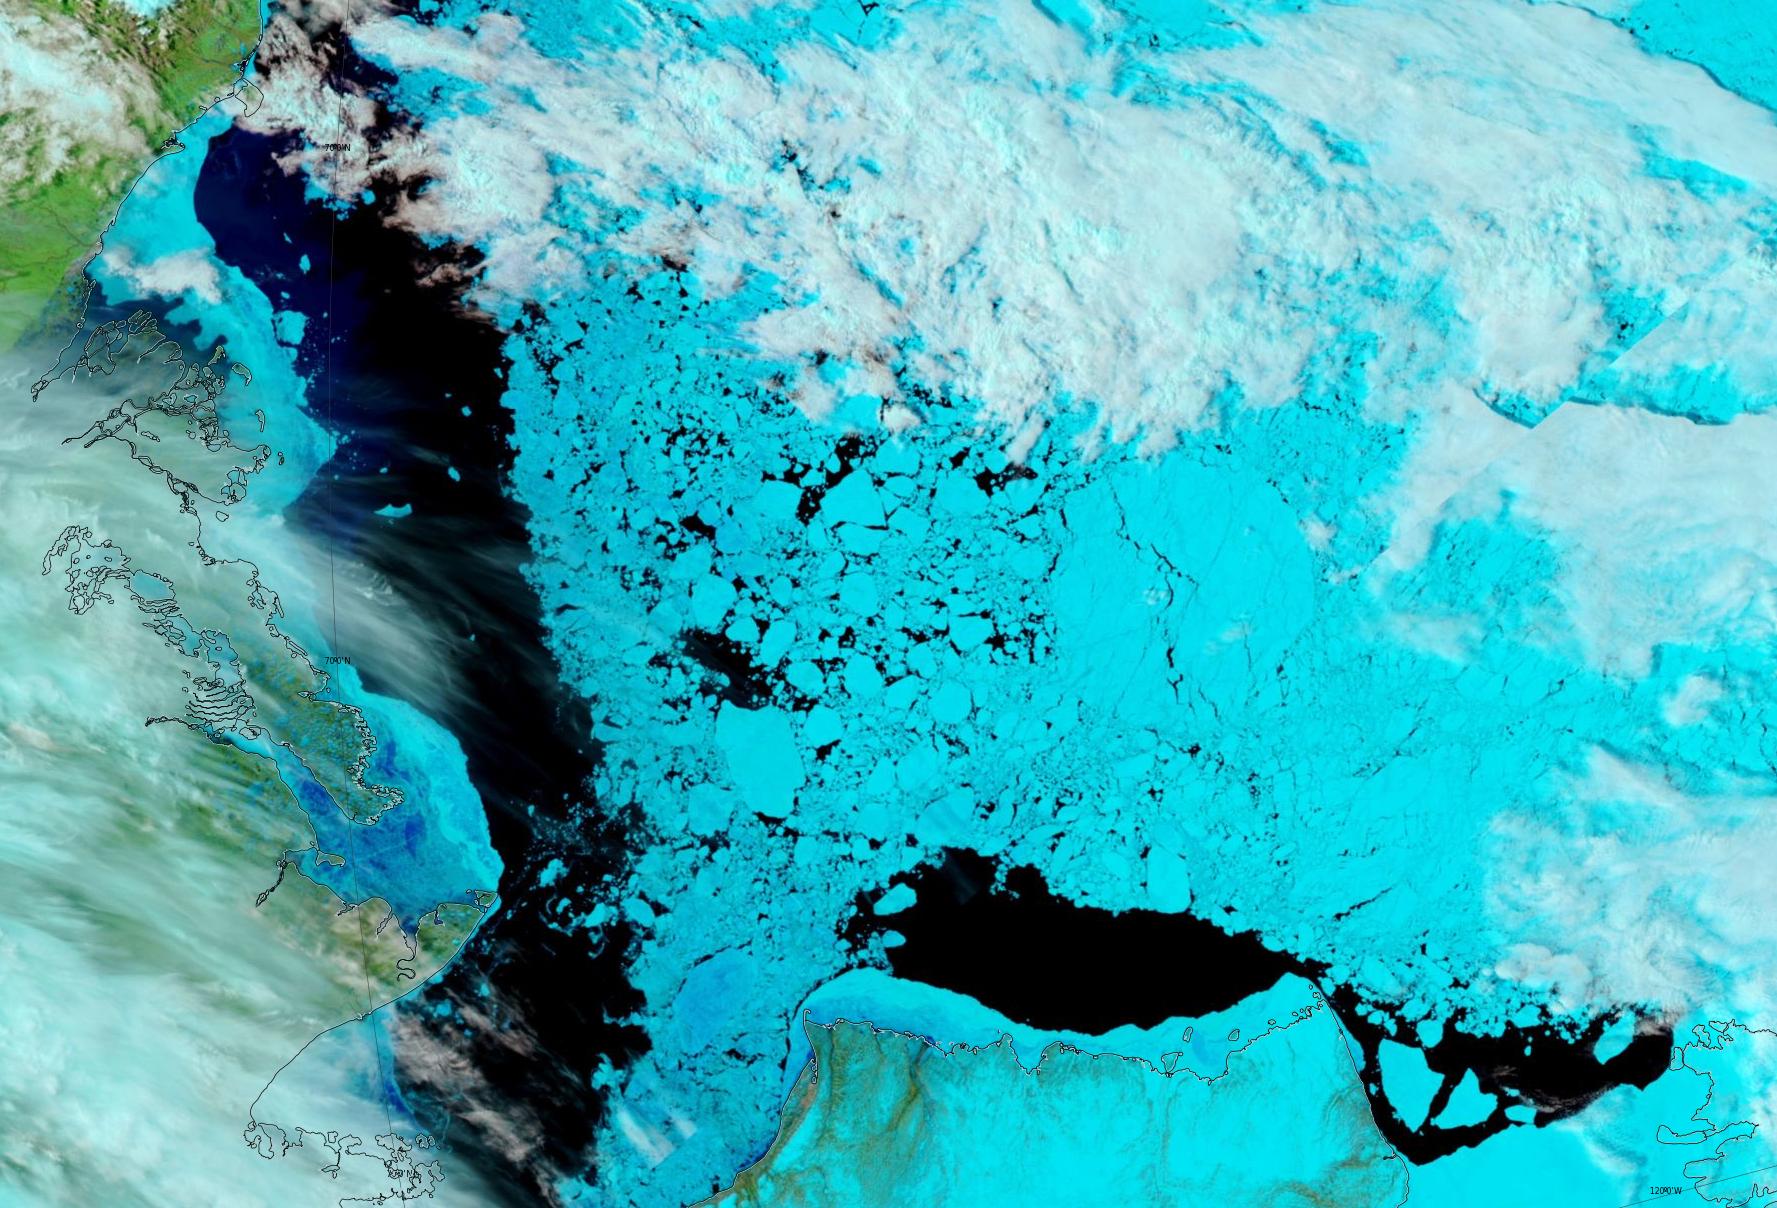
Meanwhile further out into the Chukchi Sea the sea ice looks to be in poor shape at the moment, with surface melting apparent across the entire region:
By way of a change we’ll start the month of May with a closer look at one of the ice mass balance buoys deployed in the Beaufort Sea last Autumn. IMB buoy 569620 was deployed at 78.5 N, 147.0 W on September 3rd 2021, and since then it has drifted to 81.0 N, 147.7 W. Here is the buoy’s record of atmospheric conditions above the ice floe it’s embedded in since then:
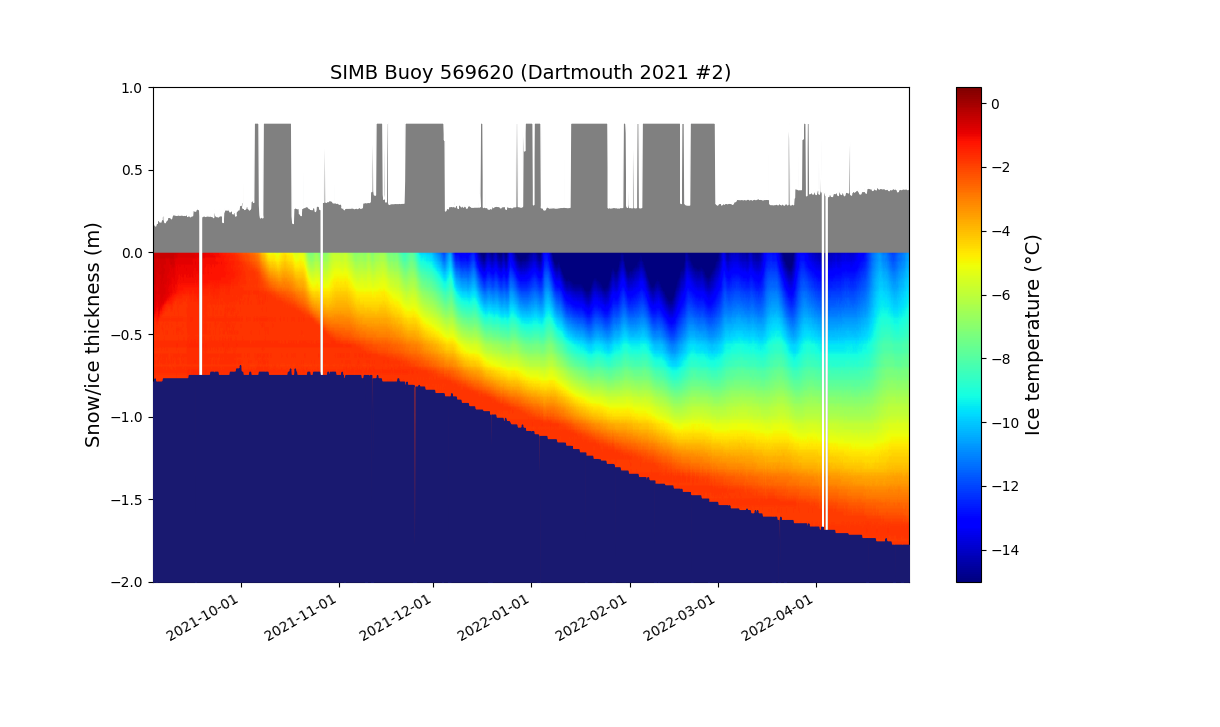
Here too is the buoy’s record of the temperature of the ice floe itself, as well as the thickness of the ice and the snow layer covering it:
There’s a few things to note at first glance. The ice floe continued to decrease in thickness into November. It’s thickness then started to increase, but is currently still less than 2 meters. Also the snow depth has gradually been increasing, and (apart from some data glitches!) is now ~38 cm. Finally, for the moment at least, the ice surface temperature has been slowly warming since mid February and is now ~-11 °C.
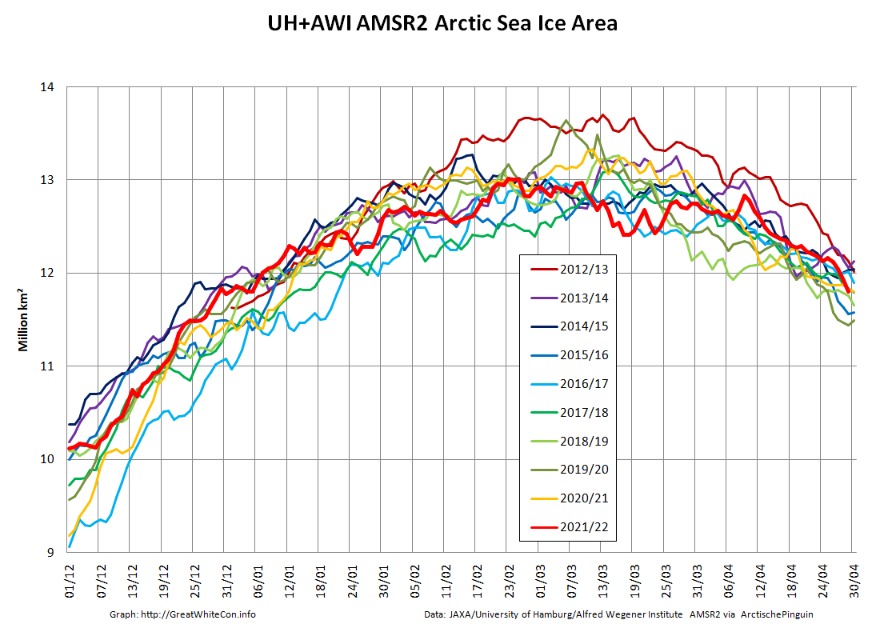
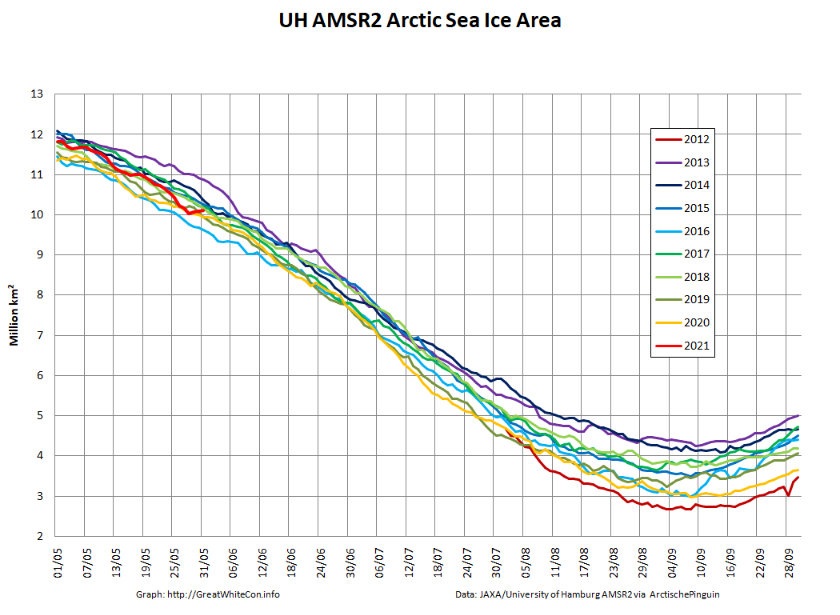
Returning to more familiar territory, high resolution AMSR2 Arctic sea ice area has taken a bit of a tumble recently:
followed less steeply by extent:
Not unexpectedly, the Pacific periphery is currently leading the decline:
[Edit – May 4th]
The Rutgers Snow Lab has updated its northern hemisphere snow cover bar chart for April 2022:
The May edition of the NSIDC’s Arctic Sea Ice News has also just been published. It summarises April 2022 as follows:
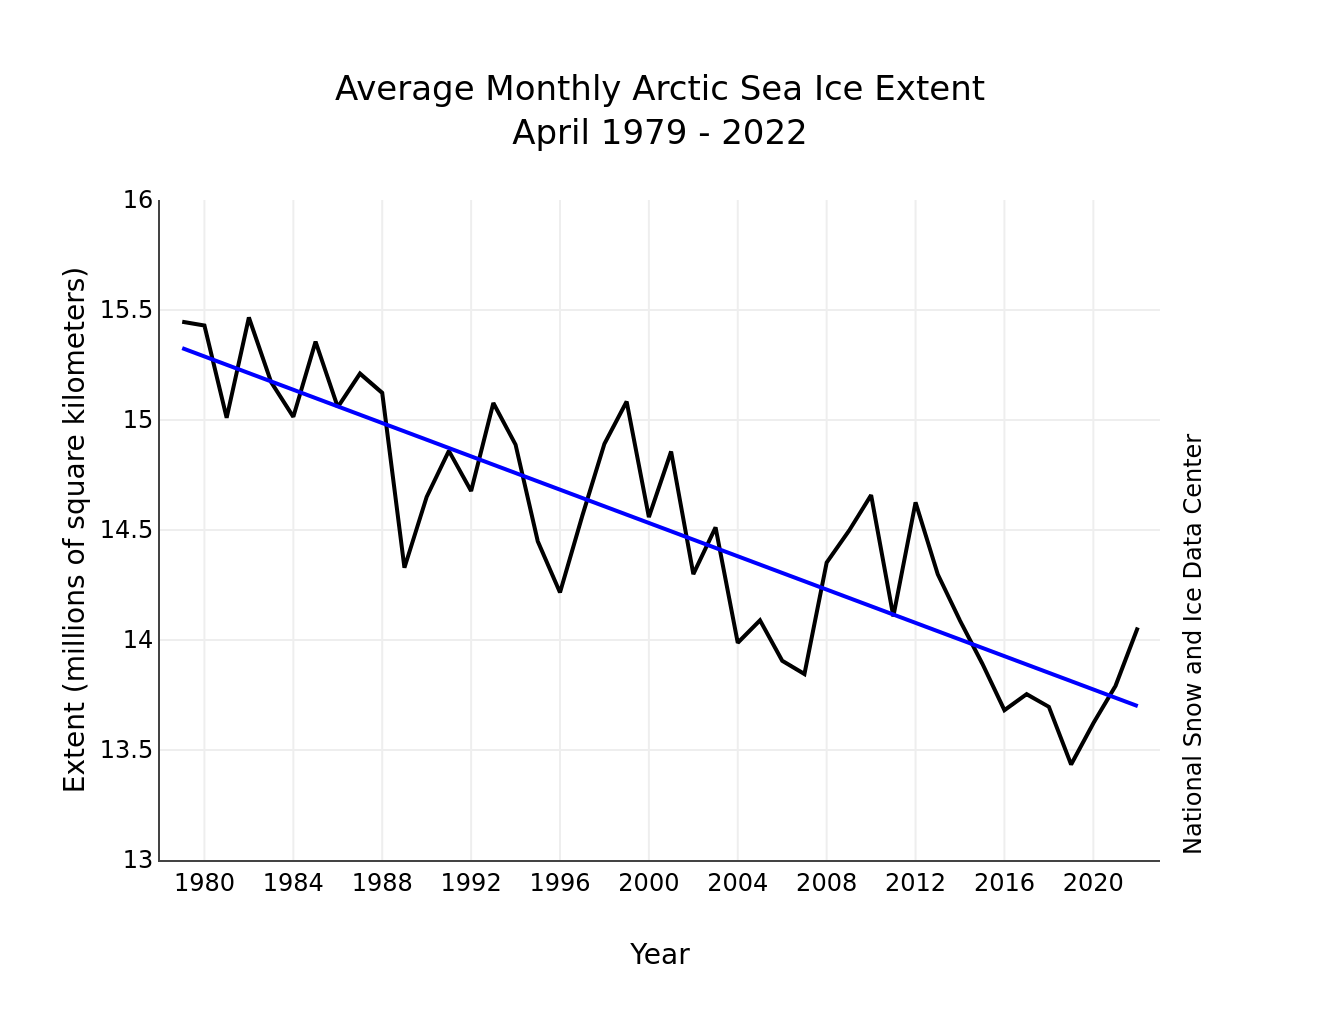
Average Arctic sea ice extent for April 2022 was 14.06 million square kilometers (5.43 million square miles). This was 630,000 square kilometers (243,000 square miles) below the 1981 to 2010 average and ranked eleventh lowest in the 44-year satellite record.
Extent declined slowly through the beginning of the month, with only 87,000 square kilometers (33,600 square miles) of ice loss between April 1 and April 10. The decline then proceeded at an average pace for this time of year through the reminder of the month.
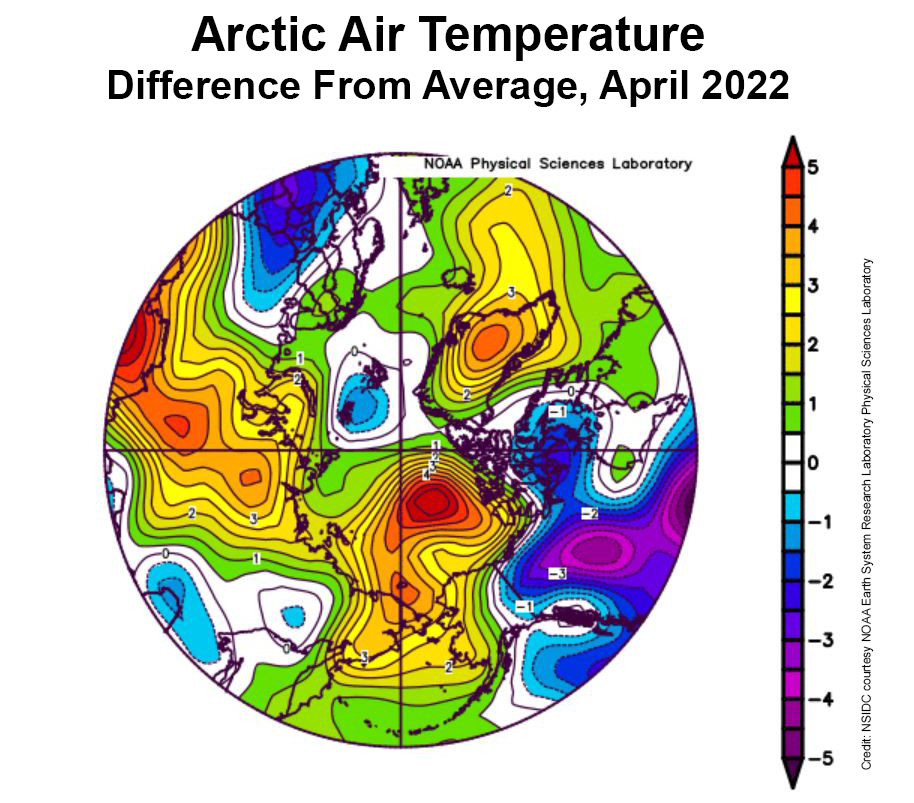
During April, temperatures at the 925 mb level (about 2,500 feet above the surface) over the Arctic Ocean were above average. Most areas were 2 to 3 degrees Celsius (4 to 5 degrees Fahrenheit) above average, but in the Beaufort Sea, April temperatures were up to 5 to 6 degrees Celsius (9 to 11 degrees Fahrenheit) above average:
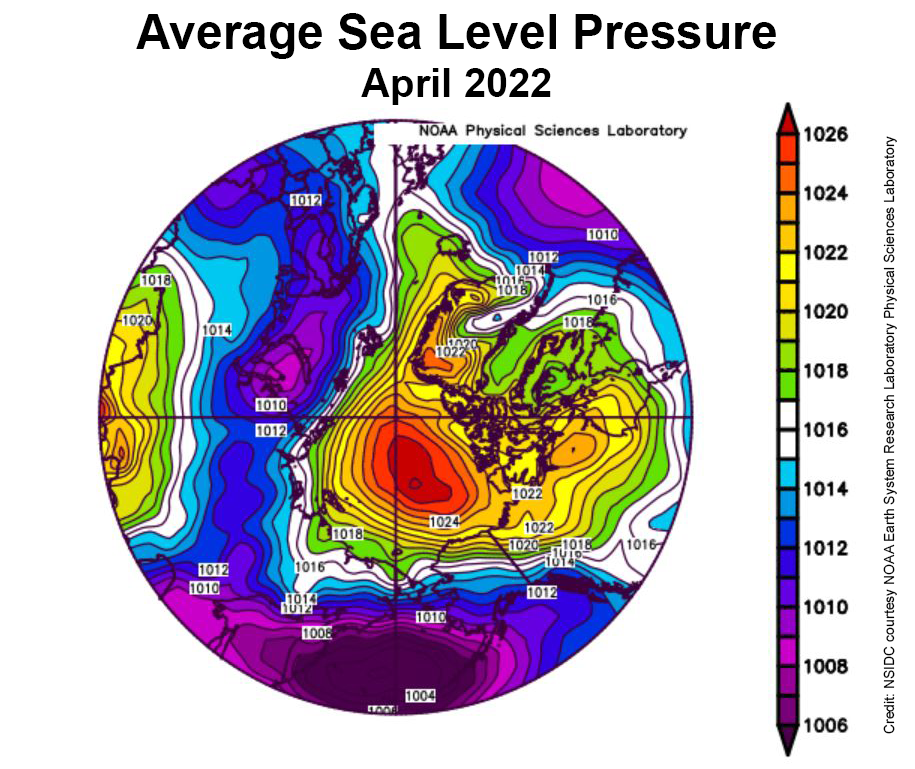
This was accompanied by a strong Beaufort High pressure cell through the month:
The NSIDC’s update also refers to the Chukchi Sea polynya we’ve been keeping an eye on here:
Strong offshore winds over the northwest coast of Alaska led to openings in the ice cover, called polynyas. The first pulse of winds began on March 21. At that time, surface air temperatures were still well below freezing, and the water in the coastal polynya quickly refroze. By April 9, the offshore push of the ice ceased and the polynya iced over completely.
However, starting on April 12, a second round of offshore wind pushed the ice away from the coast, initiating another polynya. Refreezing began anew in the open water areas, but the ice growth was noticeably slower, reflecting the higher surface air temperatures by the end of the month
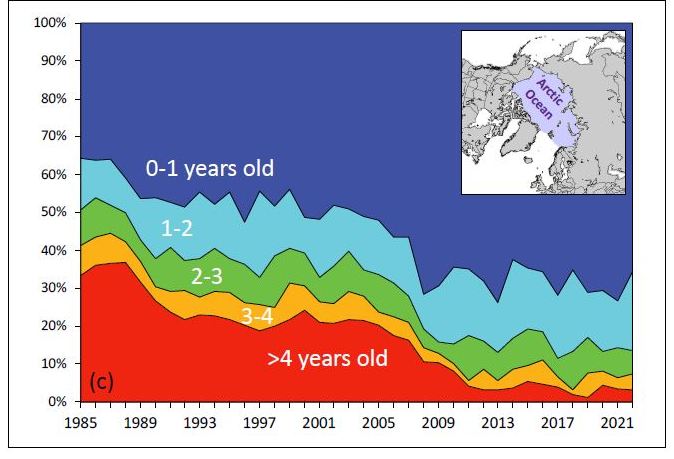
The NSIDC also updated their graph of sea ice age, on this occasion for the week of March 12th to 18th over the years:
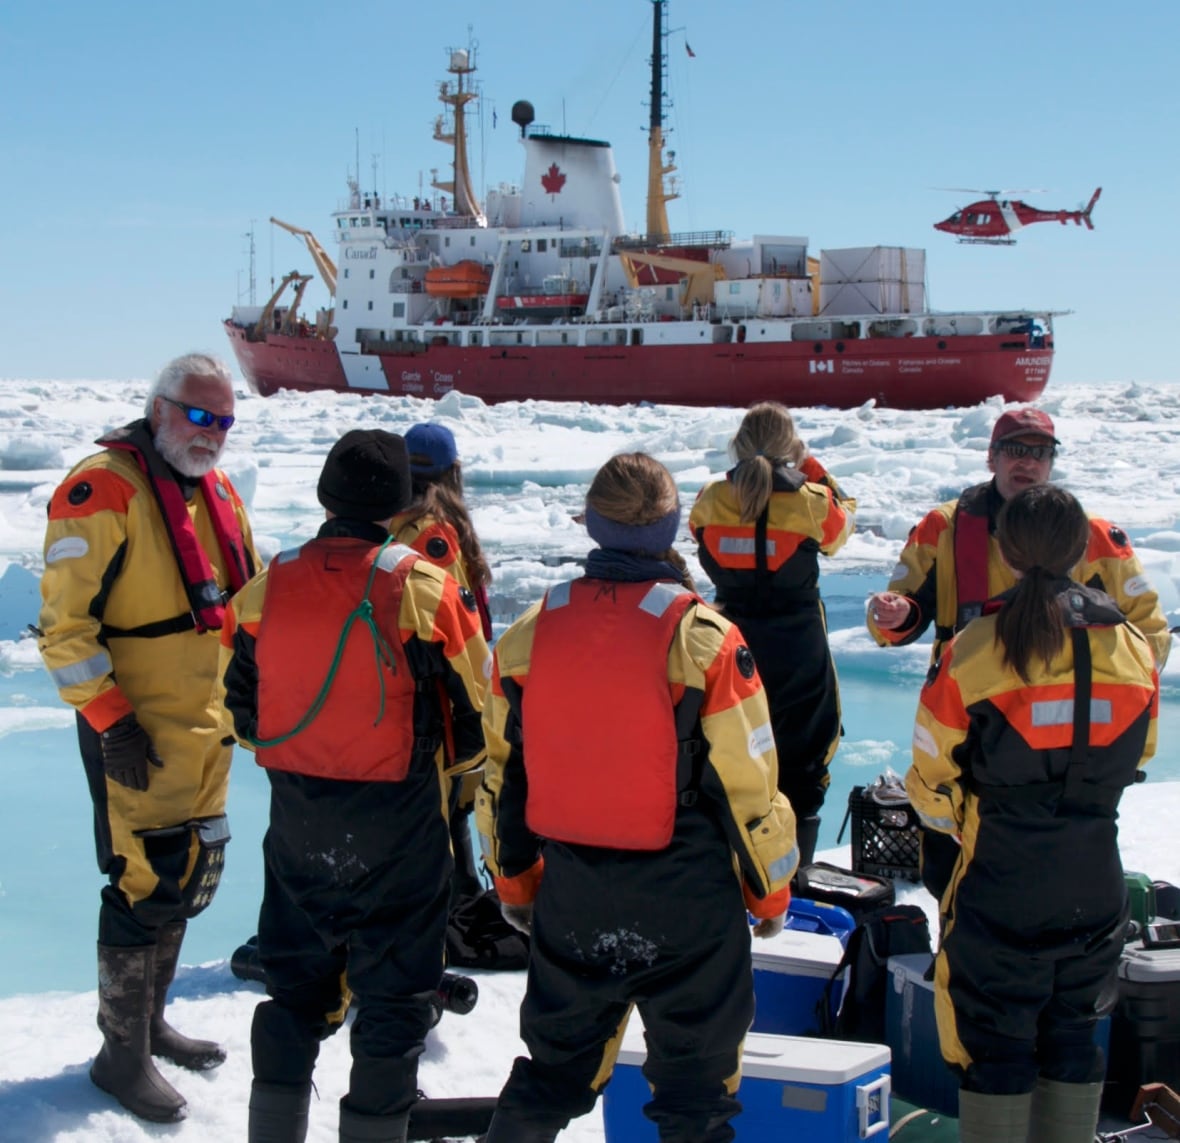
Arctic sea ice news concludes with brief news of the recent death of Canadian Arctic scientist David Barber. CBC News’s obituary for David provides more details:
Family and friends are mourning the loss of the visionary Arctic researcher and University of Manitoba professor David Barber.
Barber, who was a distinguished professor, the founding director of the Centre for Earth Observation Science and associate dean of research in the faculty of environment, earth and resource, passed away on Friday after suffering complications from cardiac arrest.
Barber, 61, is survived by his wife Lucette, three children and two grandchildren.
David Barber (left) pictured with his team on an Arctic expedition. Photo: Julien Barber[Edit – May 9th]
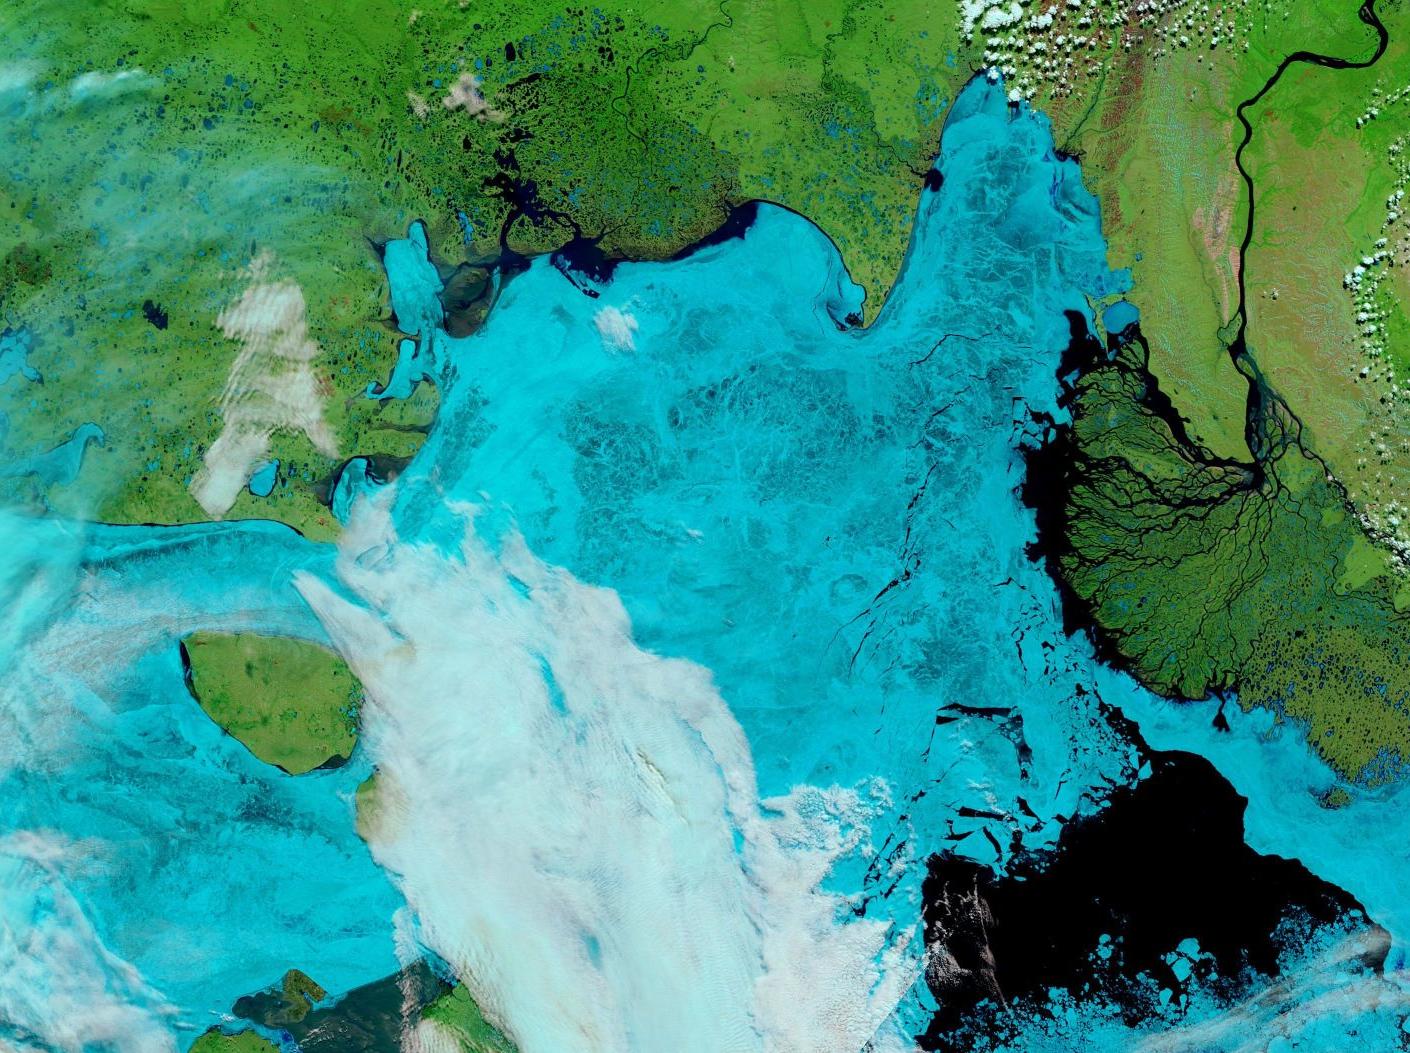
The waters of the Mackenzie River are starting to spread over the fast ice off the delta:
“False colour” image of the Beaufort Sea on May 7th from the MODIS instrument on the Terra satellite[Edit – May 11th]
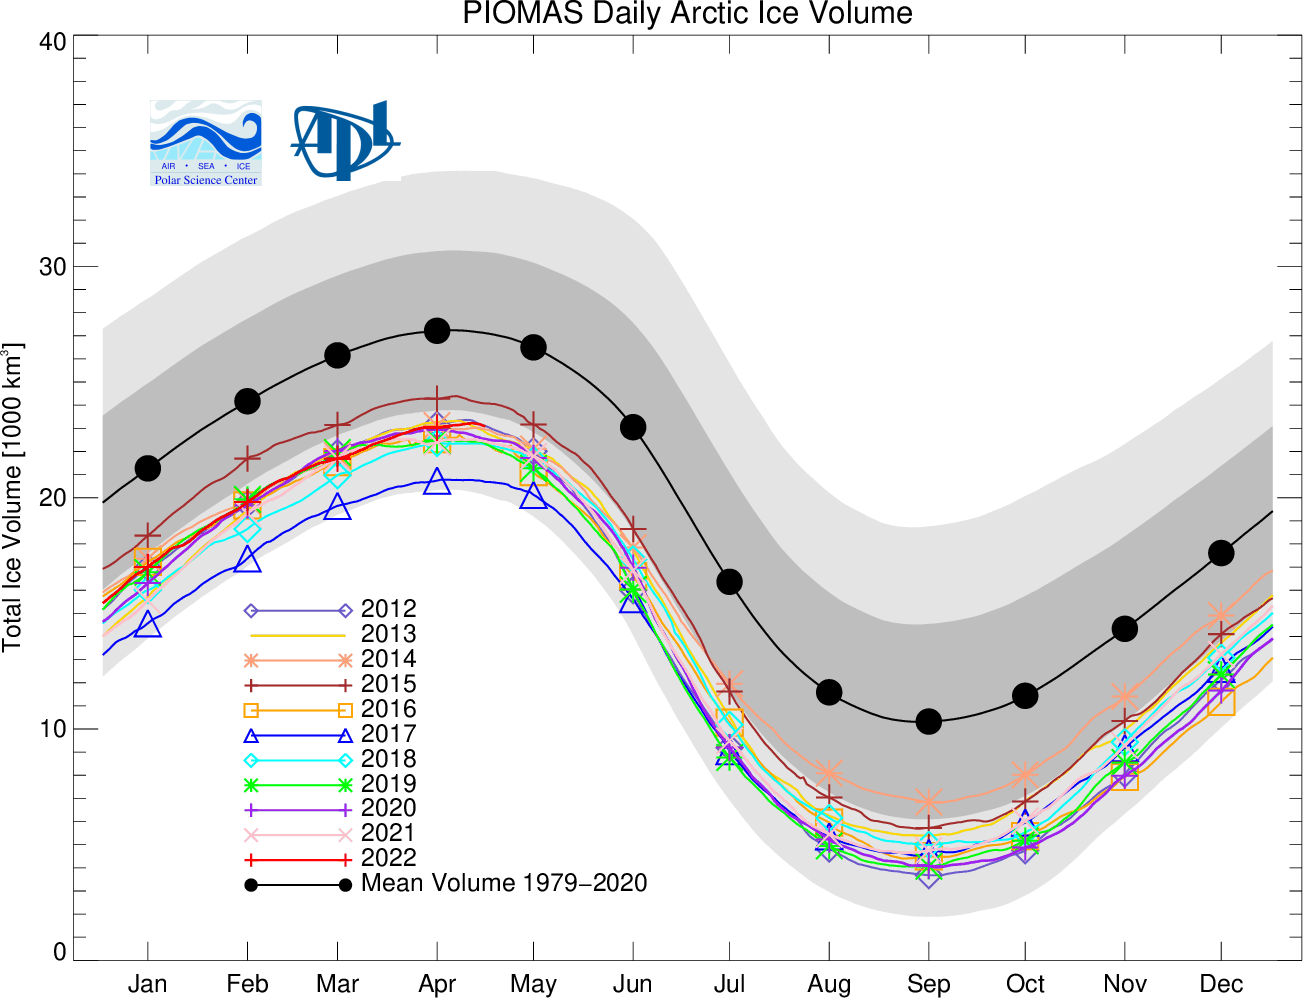
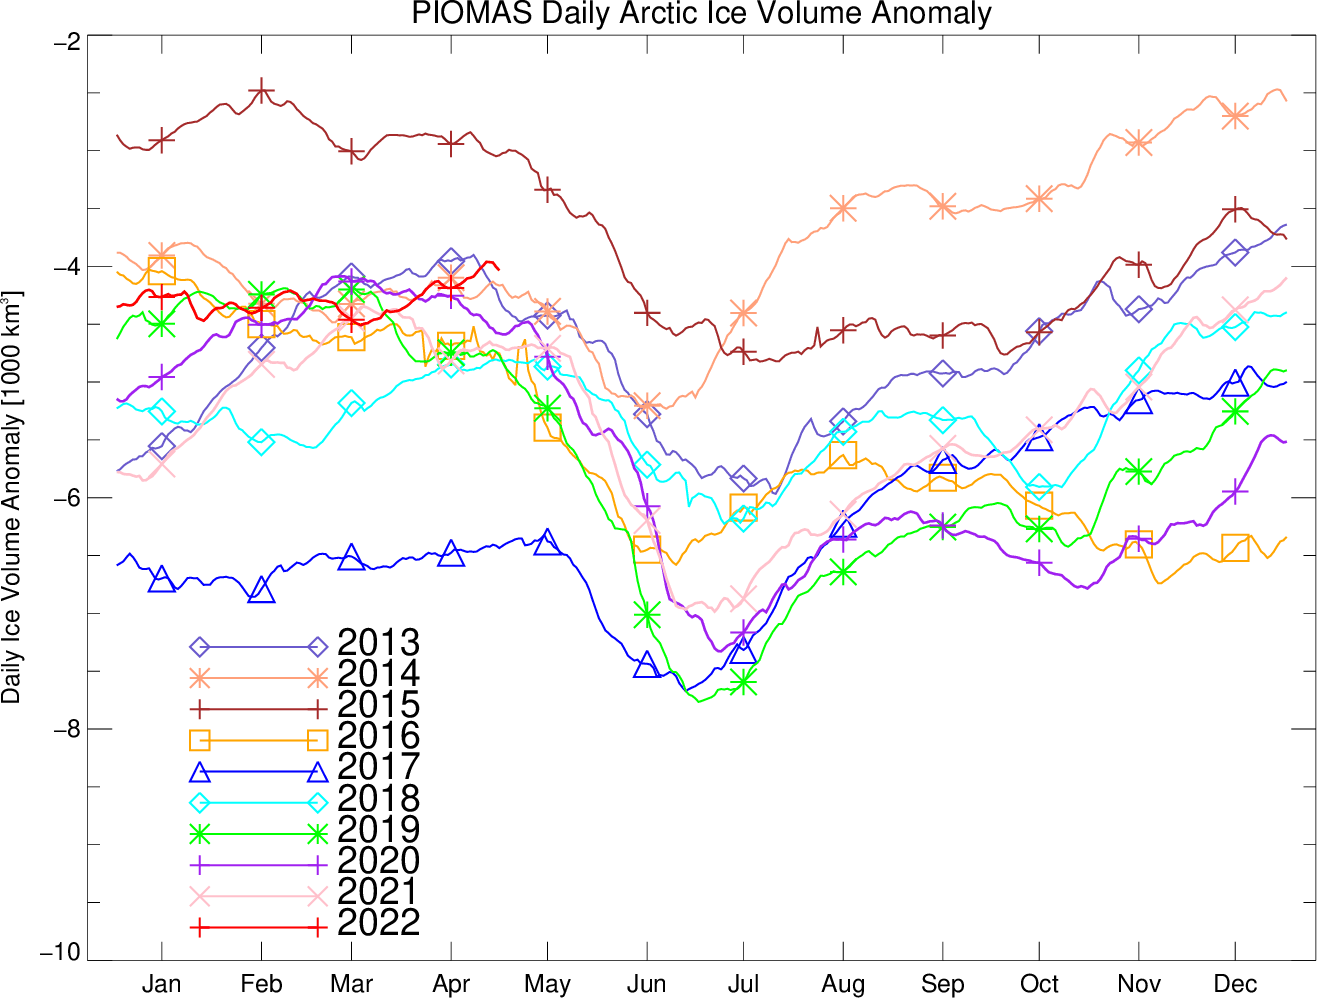
The Polar Science Center at the University of Washington has released the PIOMAS volume data for April 2022:
Average Arctic sea ice volume in April 2022 was 23,000 km3. This value is the 9th lowest on record for April, about 2,300 km3 above the record set in 2017. Monthly ice volume was 30% below the maximum in 1979 and 15% below the mean value for 1979-2021. Average April 2022 ice volume was 1.45 standard deviations above the 1979-2021 trend line.
The daily volume numbers reveal the PIOMAS maximum volume for 2022 to be 23,225 km3 on April 26th.
The PSC report continues:
Ice growth anomalies for April 2022 continued to be at the upper end of the most recent decade with a mean ice thickness (above 15 cm thickness) at the middle of recent values.
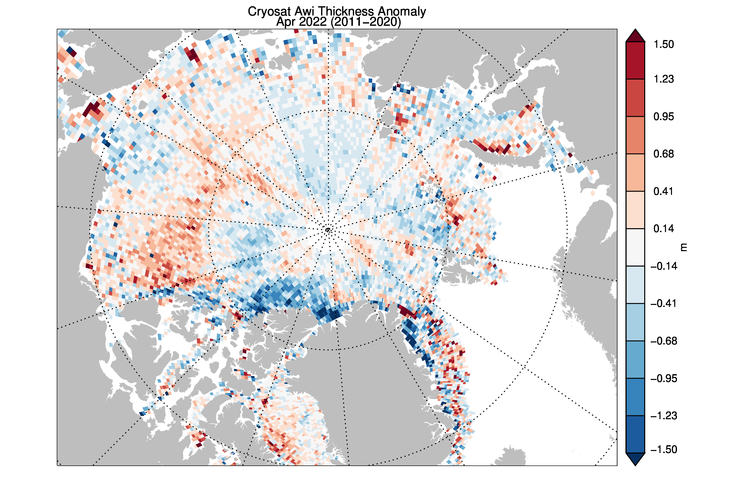
The ice thickness anomaly map for April 2022 relative to 2011-2020 divides the Arctic in two halves with positive anomalies in the “Western Arctic” but negative anomalies in “Eastern Arctic”. A narrow band of negative anomalies remains along the coast of North Greenland but a positive anomaly exists north of Baffin Island.
Note that the “positive anomaly north of Baffin Island” referred to is not apparent in the CryoSat 2 ice thickness anomaly map, although there is agreement about the thicker ice in the eastern Beaufort Sea:
[Edit – May 23rd]
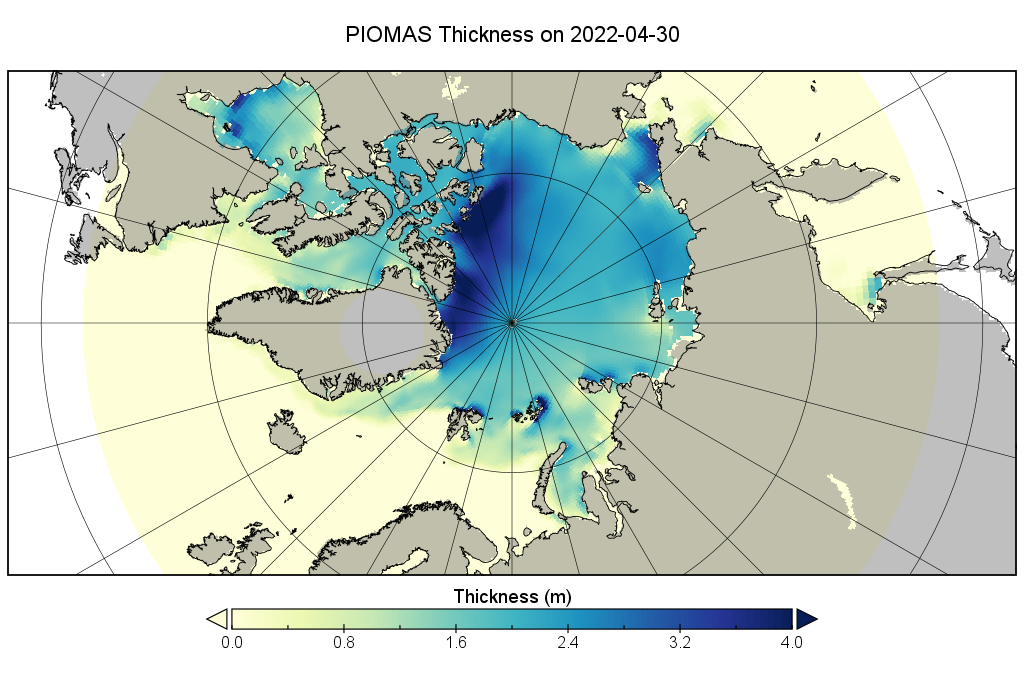
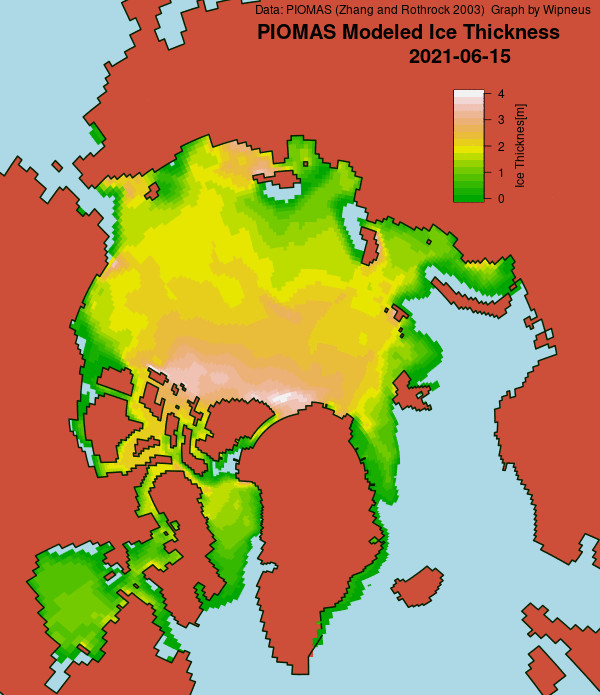
CryoSat-2 thickness maps stopped for the Summer in mid April. I’ve been hoping for mid May data from the PIOMAS team, but in vain so far. In its continuing absence here is a “work in progress” PIOMAS thickness map for the end of April:
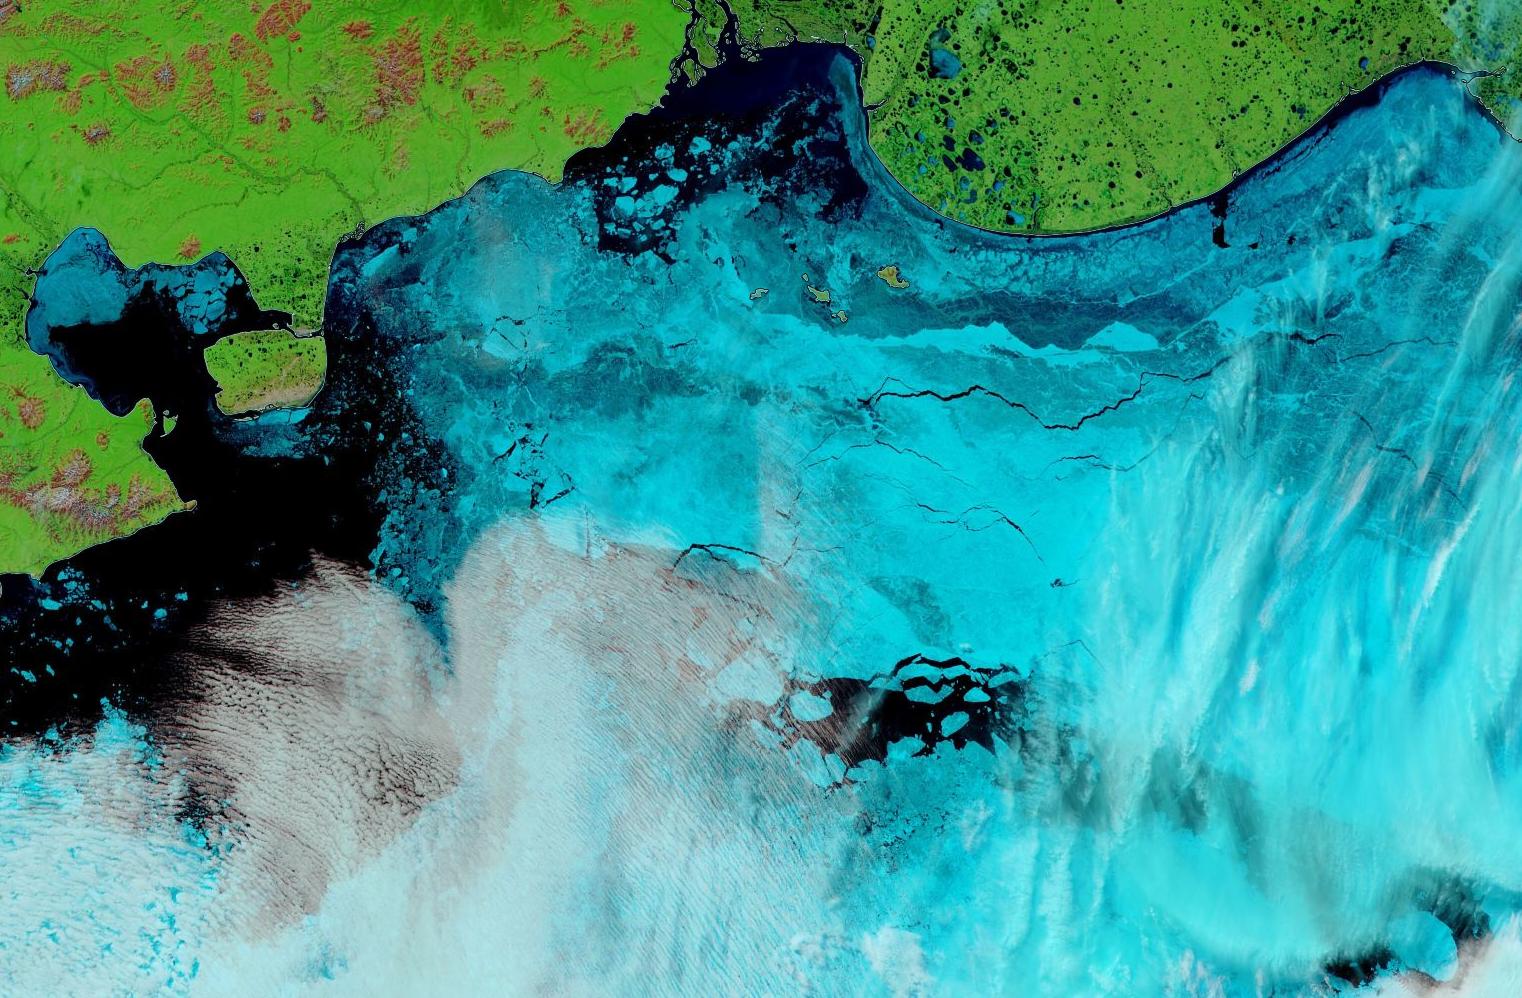
The sea ice in Chaunskaya Bay and along the adjacent coast of the East Siberian Sea is starting to look distinctly damp:
“False colour” image of the East Siberian Sea on May 23rd from the MODIS instrument on the Terra satellite
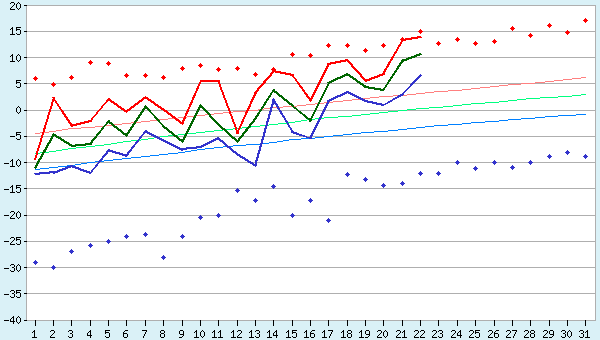
That’s not too surprising when you also look at recent temperatures in Pevek, which have been approaching all time highs for the date:
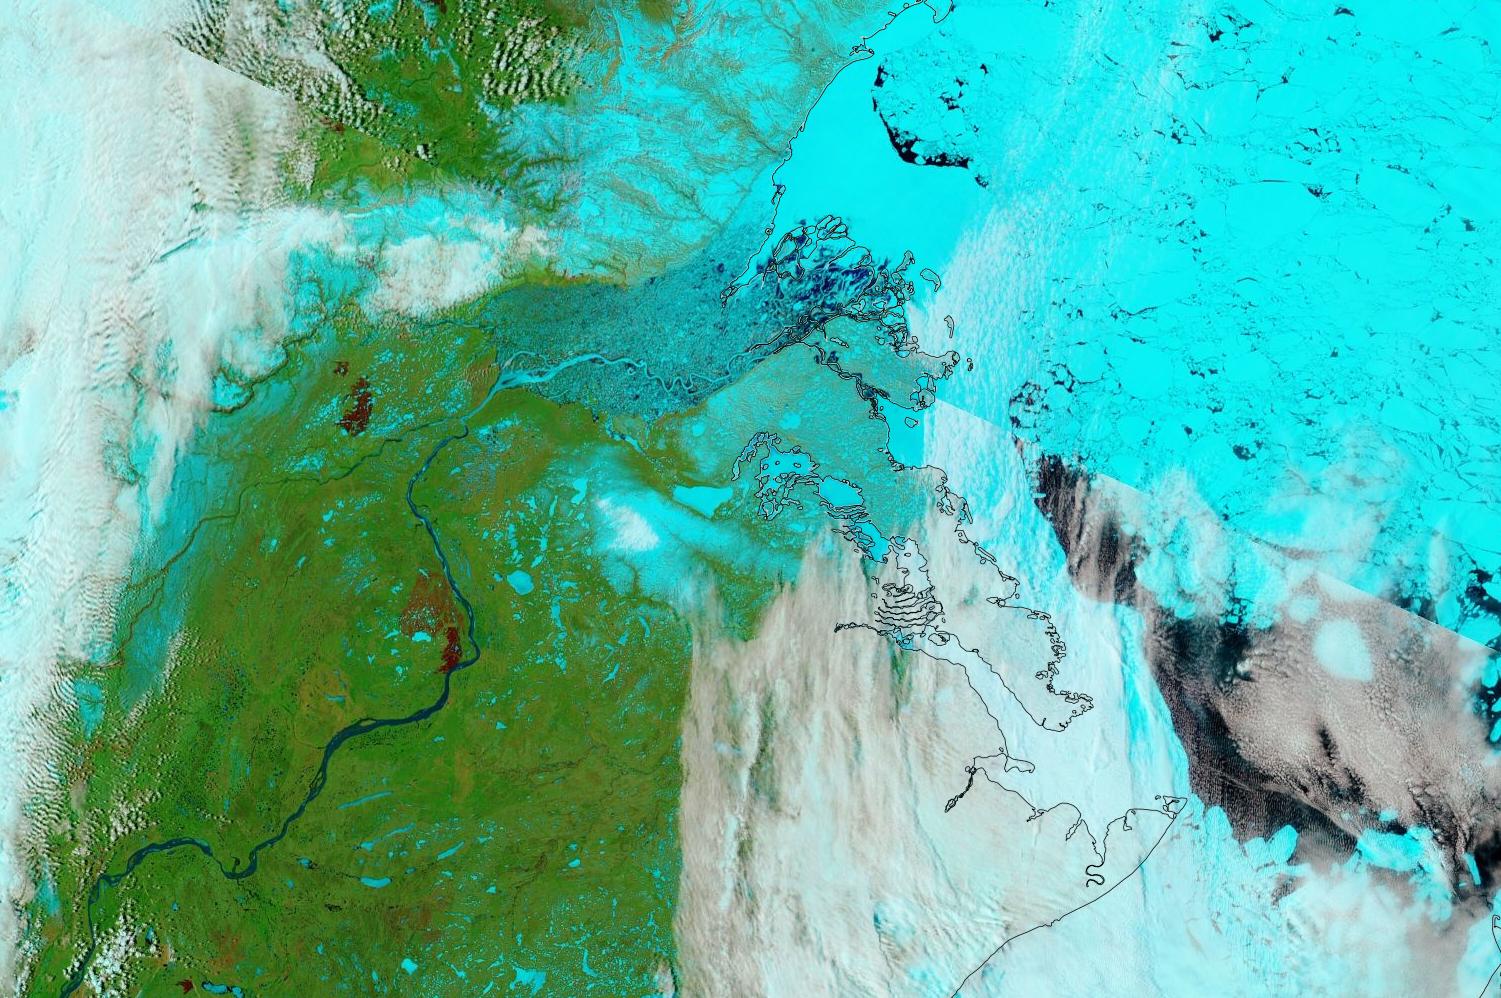
P.S. The Mackenzie River has reappeared from under the clouds and is now largely liquid:
“False colour” image of the Mackenzie River and Beaufort Sea on May 23rd from the MODIS instrument on the Terra satellite[Edit – May 27th]
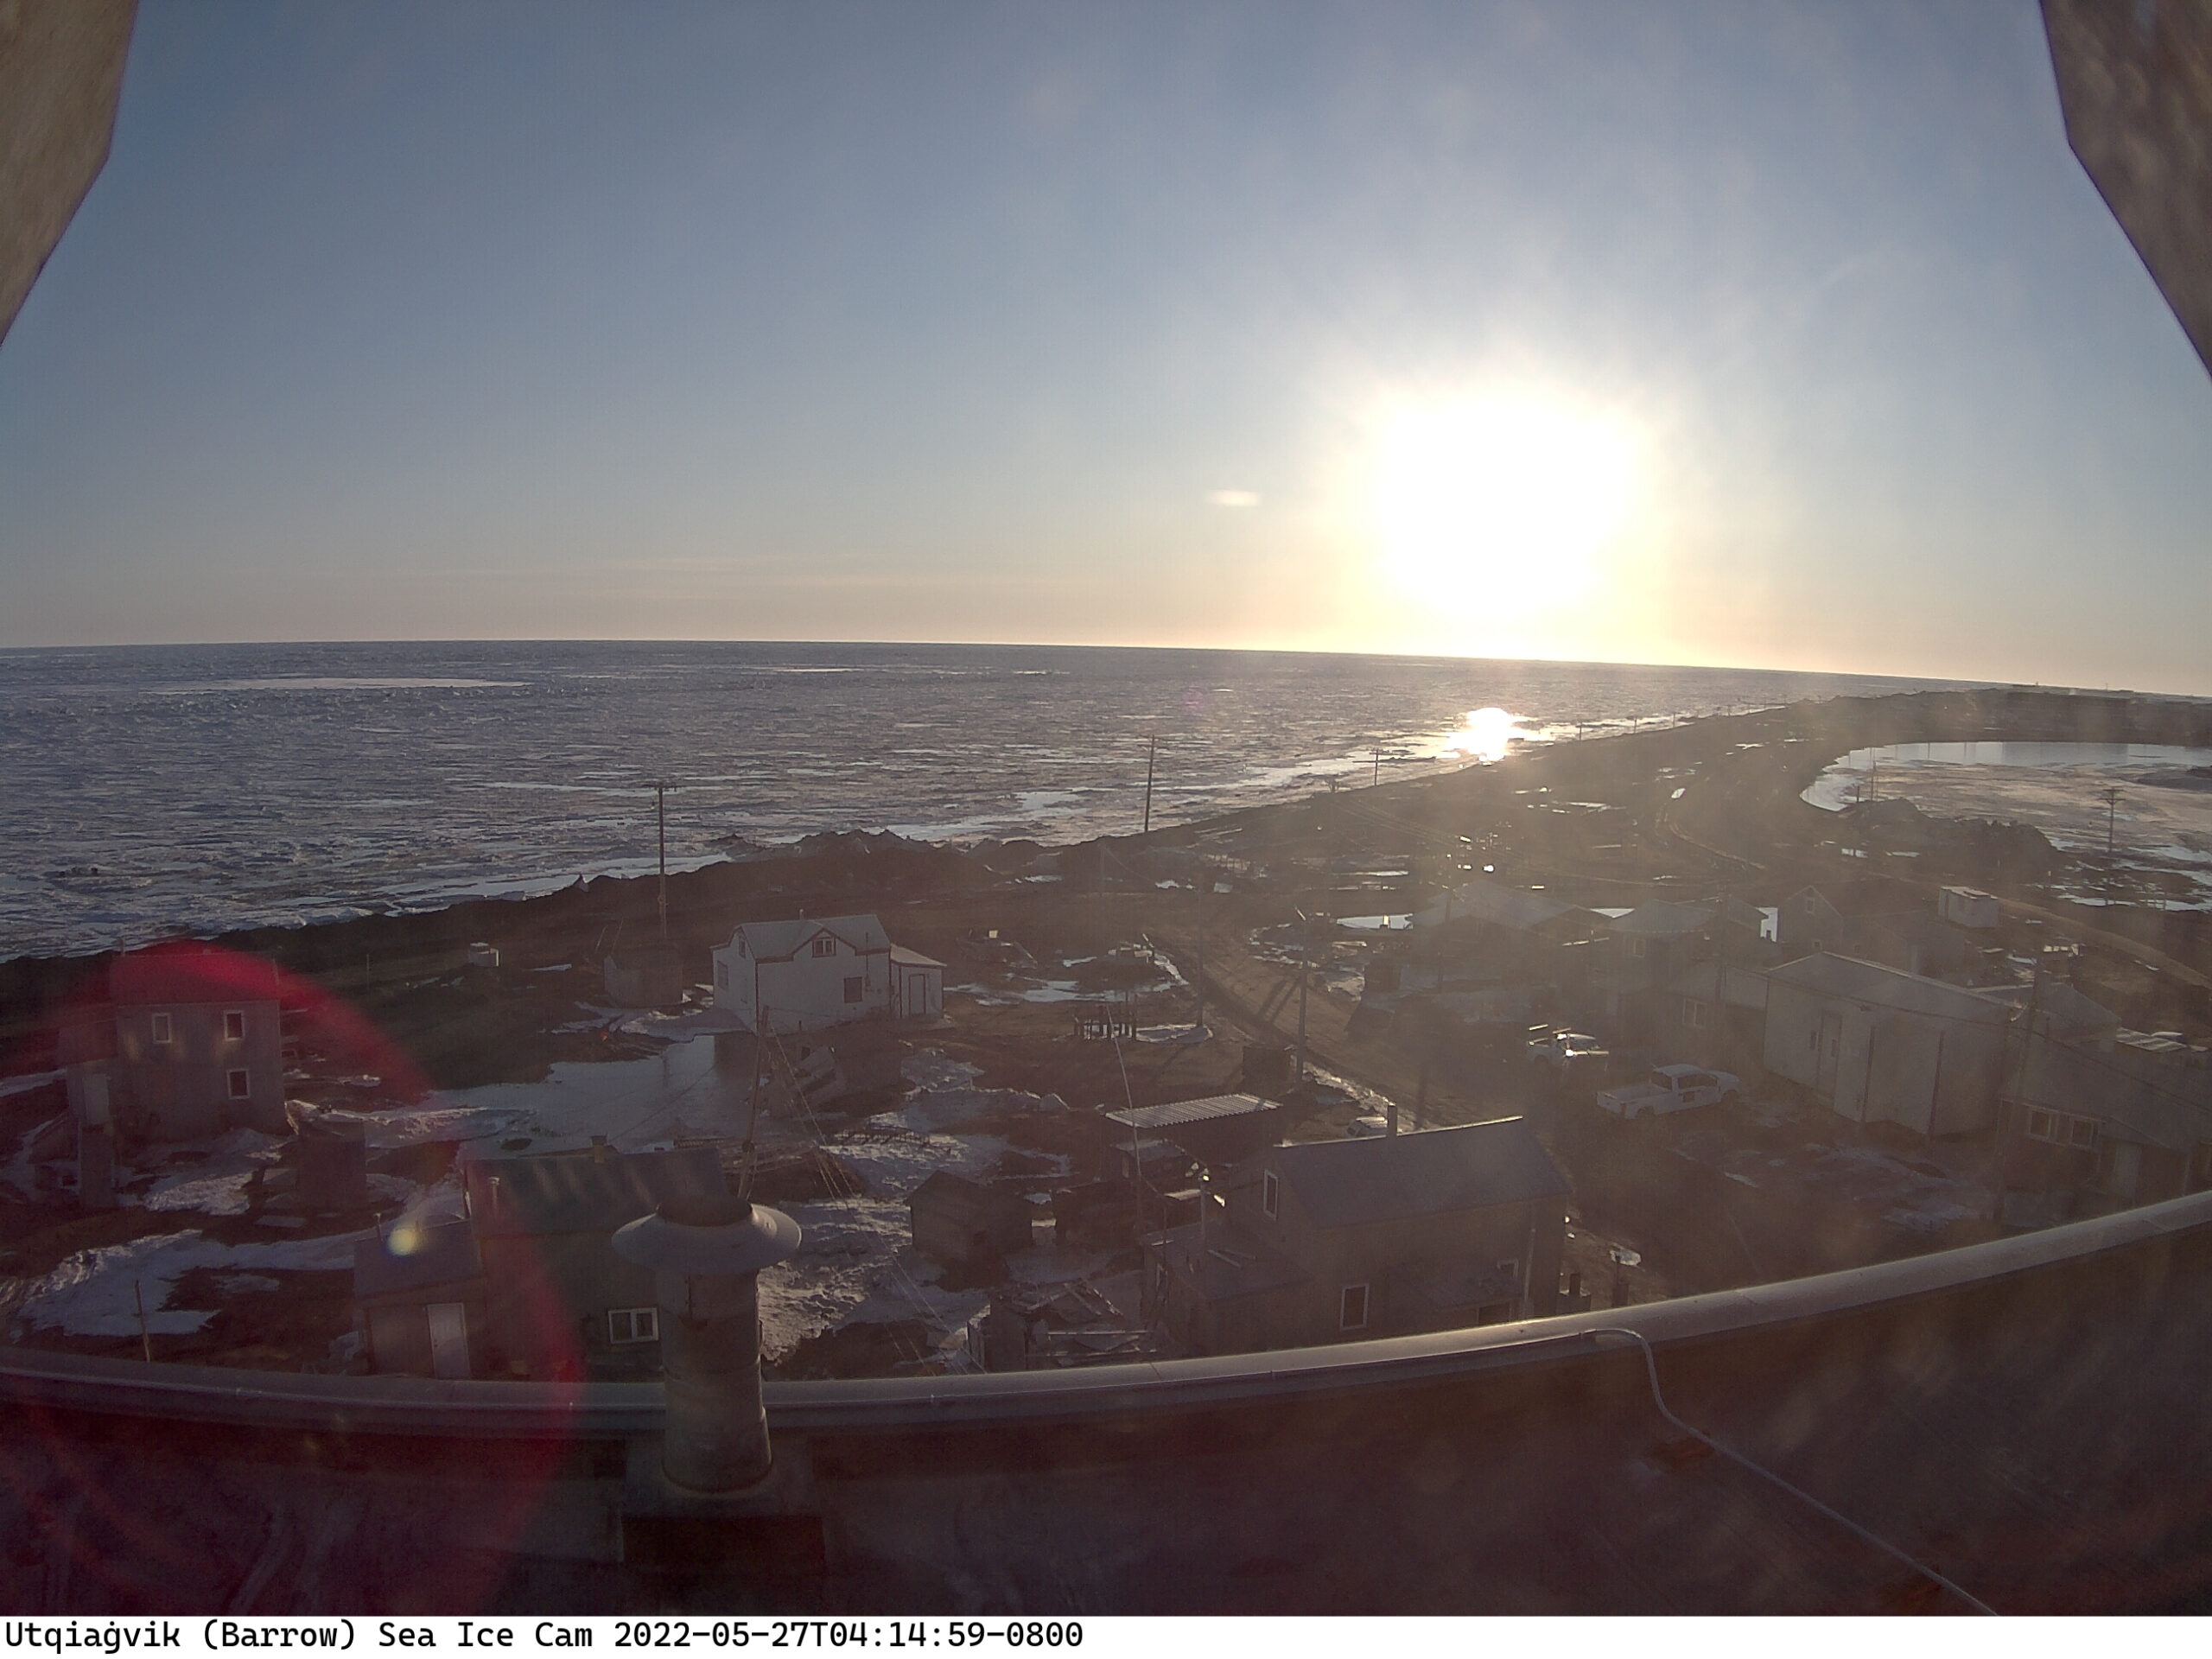
Some surface melt is now visible on the fast ice at Utqiaġvik:
No doubt the recent above zero temperatures are responsible, but the forecast is for colder conditions to return:
Discussion continues on the new open thread for June 2022.
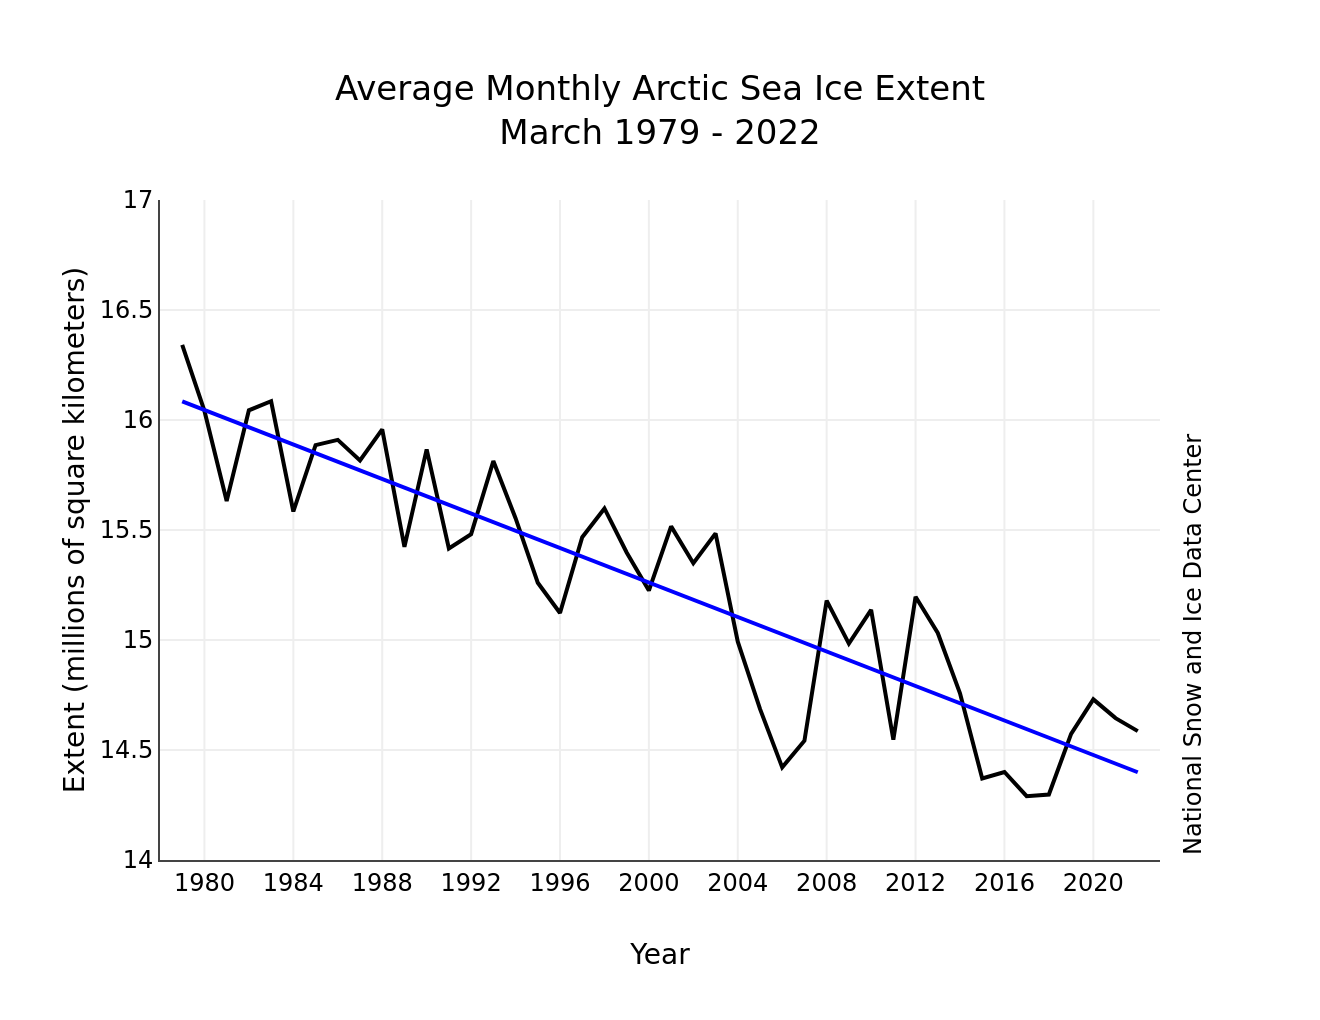
The April edition of the NSIDC’s Arctic Sea Ice News summarises March 2022 as follows:
Average Arctic sea ice extent for March 2022 was 14.59 million square kilometers (5.63 million square miles), ranking ninth lowest in the satellite record…
The total decline, after a series of small ups and downs, was only 250,000 square kilometers (96,500 square miles):
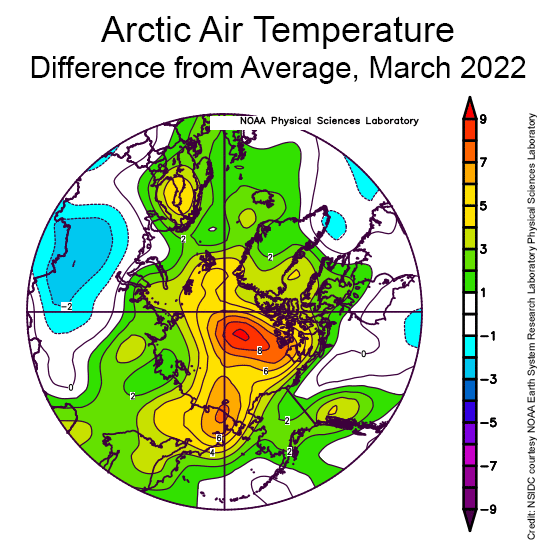
Counter to what might be expected given the very slow rate of sea ice loss over the month as a whole, air temperatures at the 925 millibar level (about 2,500 feet above the surface) were above average over all of the Arctic Ocean:
March temperatures were up to 9 degrees Celsius (16 degrees Fahrenheit) higher than average north of the Canadian Arctic Archipelago, up to 6 degrees Celsius (11 degrees Fahrenheit) above average in the East Siberian Sea, but up to 5 degrees Celsius (9 degrees Fahrenheit) above average over a wide area.
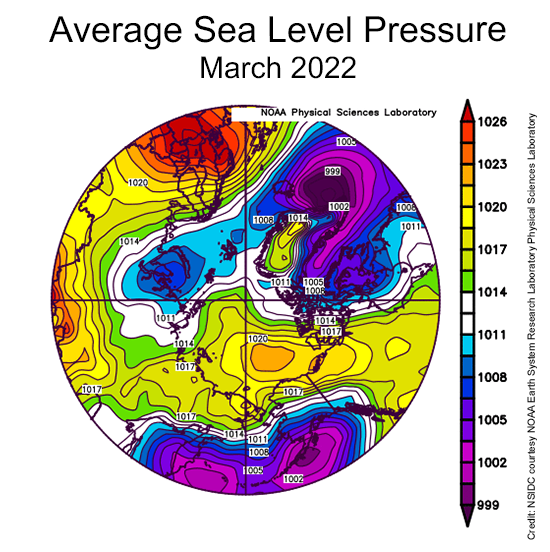
The key features of the sea level pressure pattern were high pressure (an anticyclone) over the central Arctic Ocean, a trough of low pressure extending into the Barents Sea, and an unusually high pressure over Northern Europe:
While having an anticyclone over the central Arctic Ocean is quite typical for this time of year, the combination of the high pressure over northern Europe and the pressure trough to the west led to a strong pressure gradient, leading to strong winds from south through the Norwegian and Barents Seas…
This can be tied to the extreme warm event over the Arctic Ocean seen in the middle of the month, associated with strong water vapor transport and the passage of several strong cyclones.
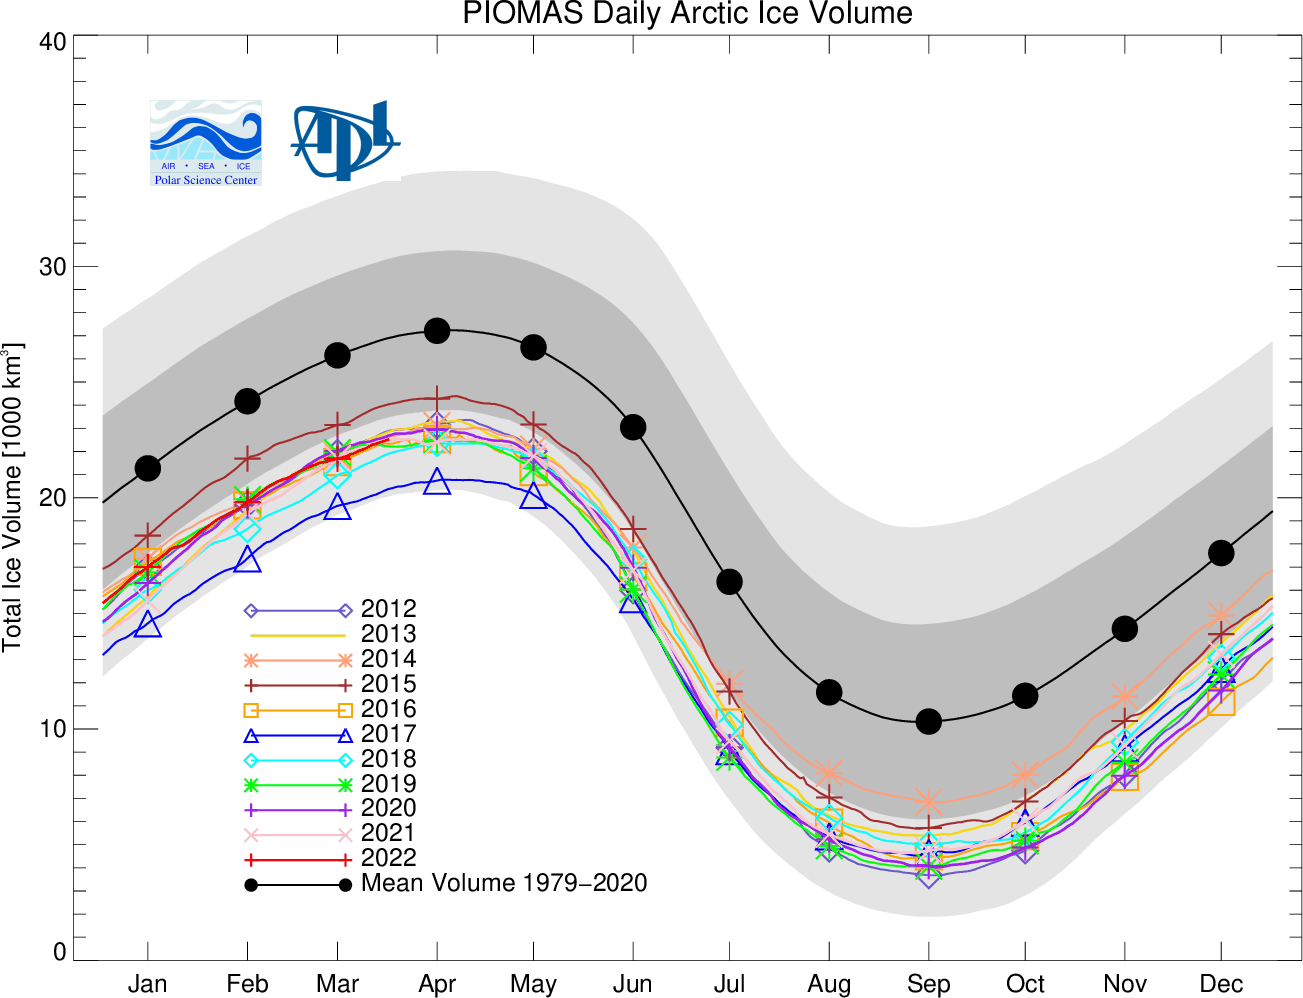
The Polar Science Center at the University of Washington has also released the PIOMAS volume data for March 2022:
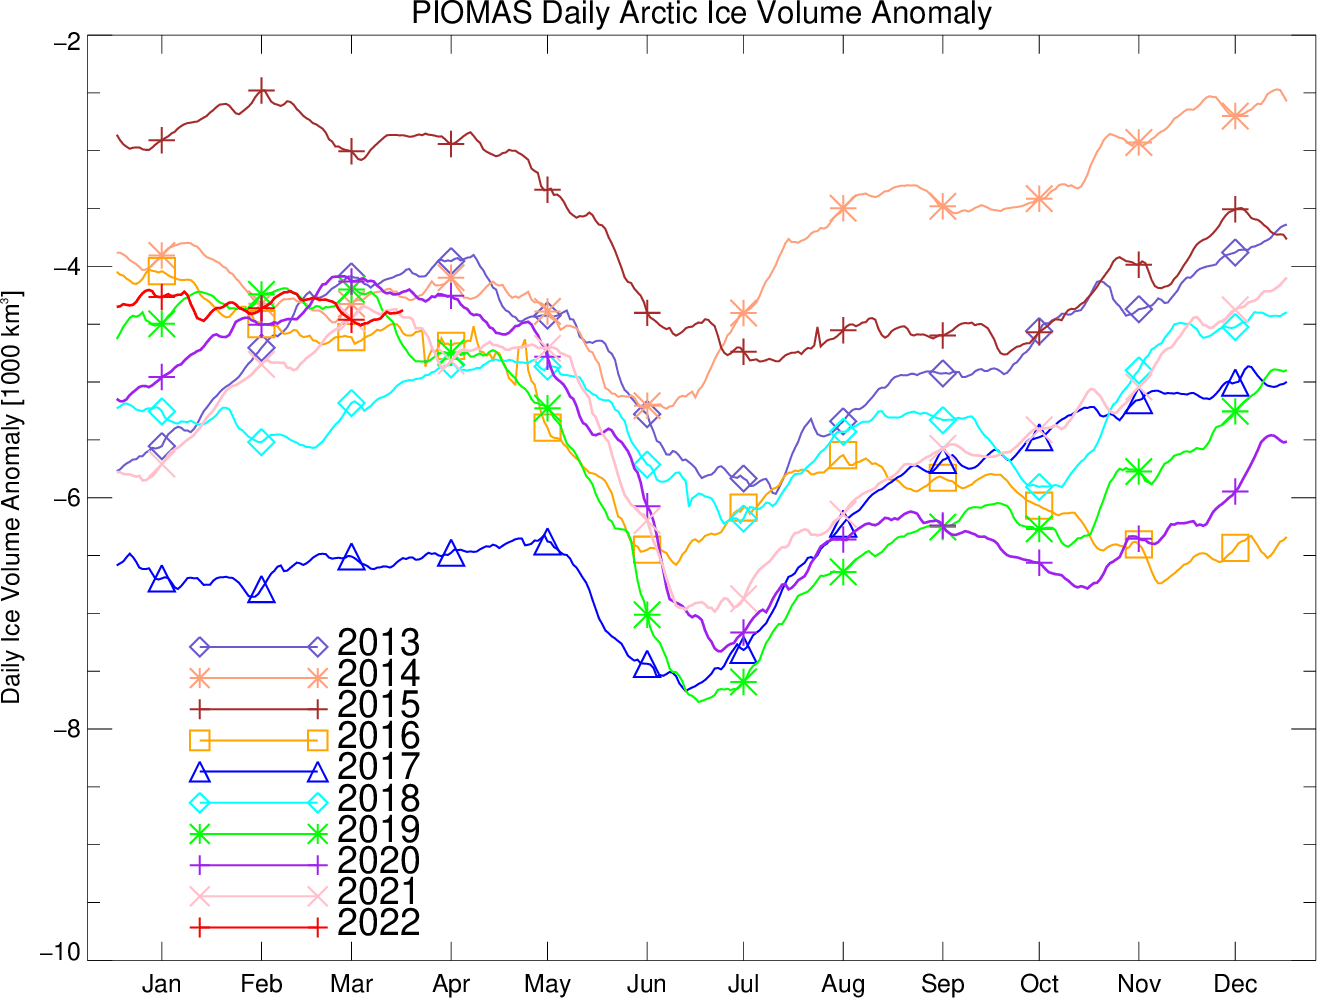
Average Arctic sea ice volume in March 2022 was 21,700 km3. This value is the 6th lowest on record for March, about 2,200 km3 above the record set in 2017. Monthly ice volume was 38% below the maximum in 1979 and 25% below the mean value for 1979-2021:
Ice growth anomalies for March 2022 continued to be at the upper end of the most recent decade with a mean ice thickness (above 15 cm thickness) at the middle of recent values:
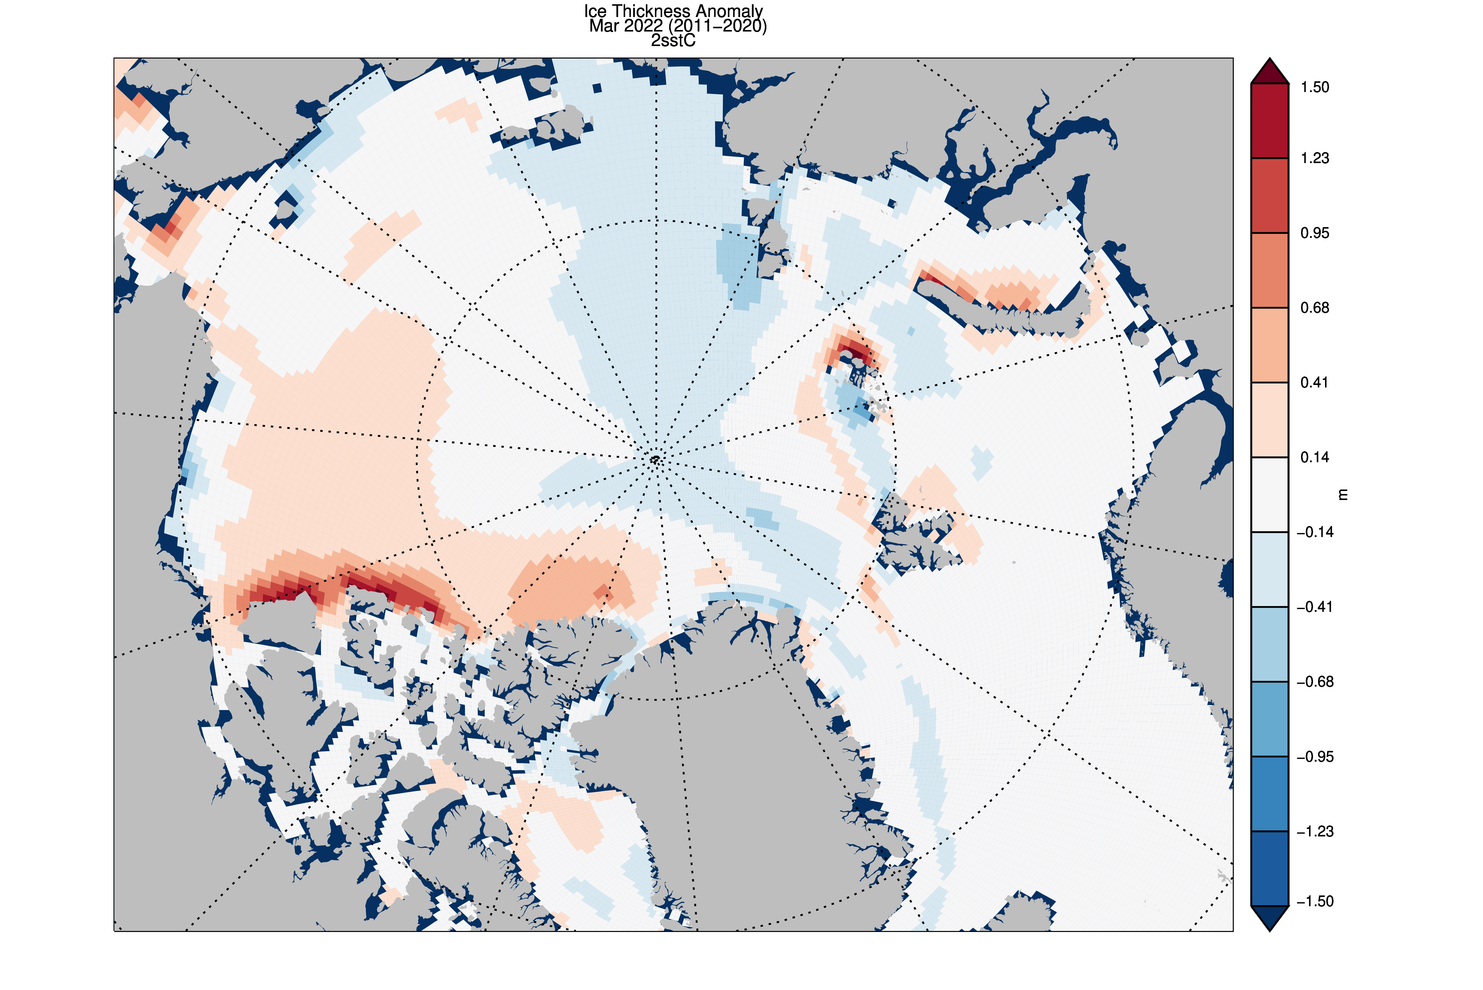
The ice thickness anomaly map for March 2022 relative to 2011-2020 divides the Arctic in two halves with positive anomalies in the “Western Arctic” but negative anomalies in “Eastern Arctic”. A narrow band of negative anomalies remains along the coast of North of Greenland but positive anomaly exists north of Baffin Island.
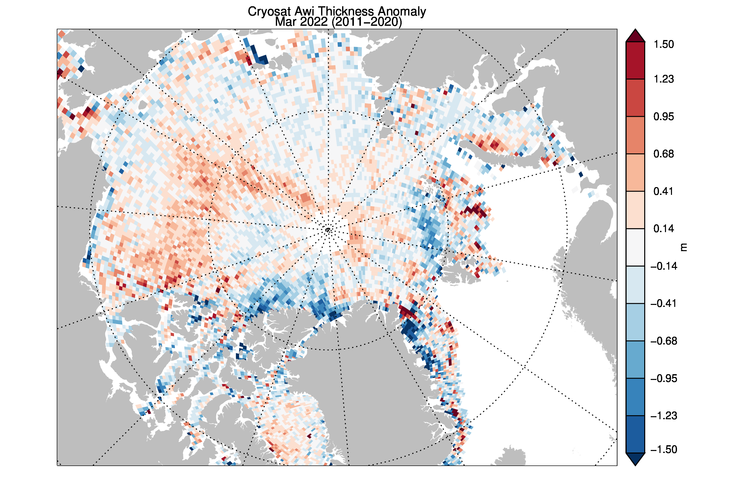
CryoSat 2 ice thickness shows an similar pattern of sea ice thickness anomalies though the areas North of Greenland and Baffin Bay show substantial differences:
[Edit – April 10th]
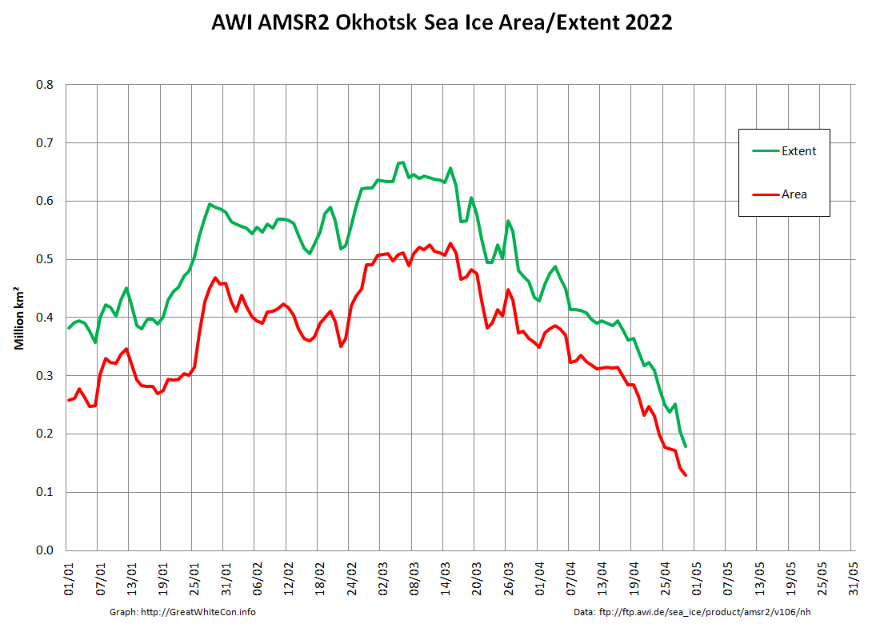
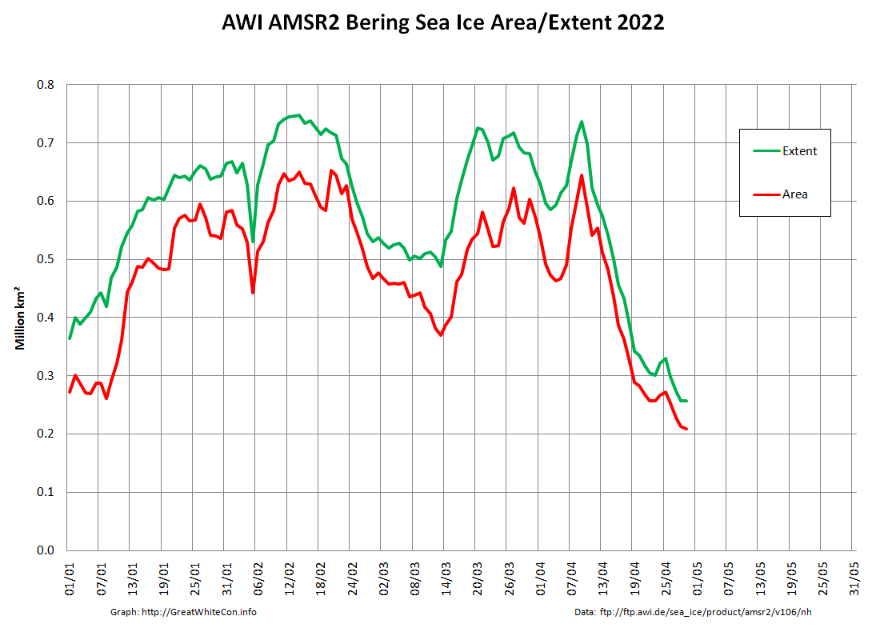
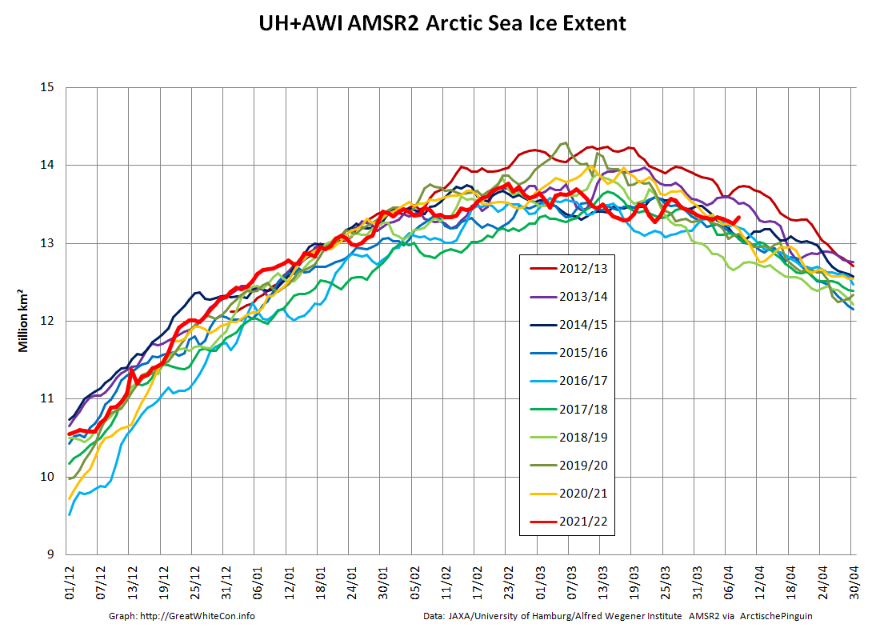
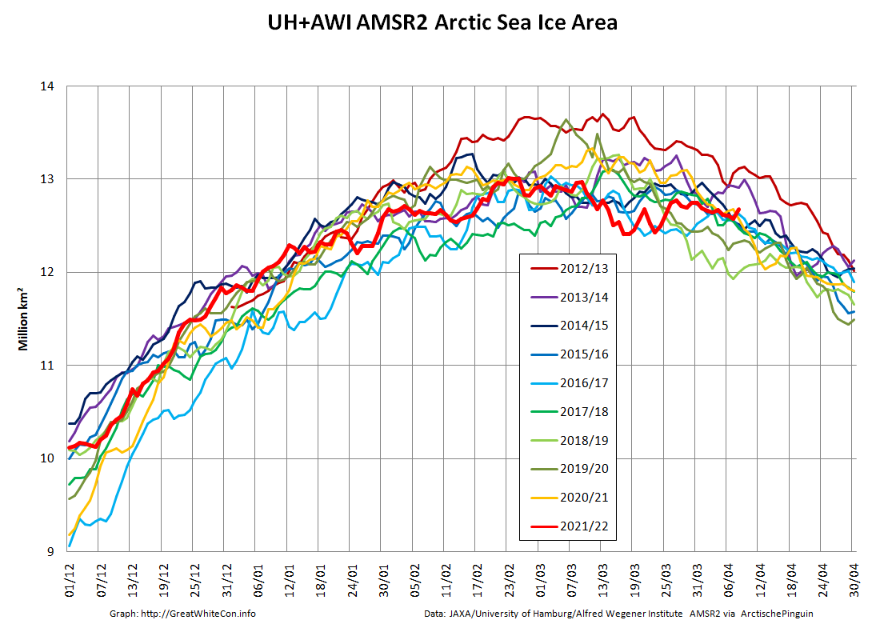
Here are the latest graphs of our favourite “high resolution” AMSR2 metrics, which combine recent data from the Alfred Wegener Institute with historical data from the University of Hamburg:
As you can see, there have indeed been a few ups and downs! Click the image below to see a 10 Mb animation of ice motion over the last few weeks:
The obvious point to note at the moment is that there are currently long flaw leads on both the Siberian and Canadian sides of the Arctic Ocean. The animation also reveals episodes of open water in the Beaufort and Chukchi Seas, as well as north of Franz Josef Land and Svalbard.
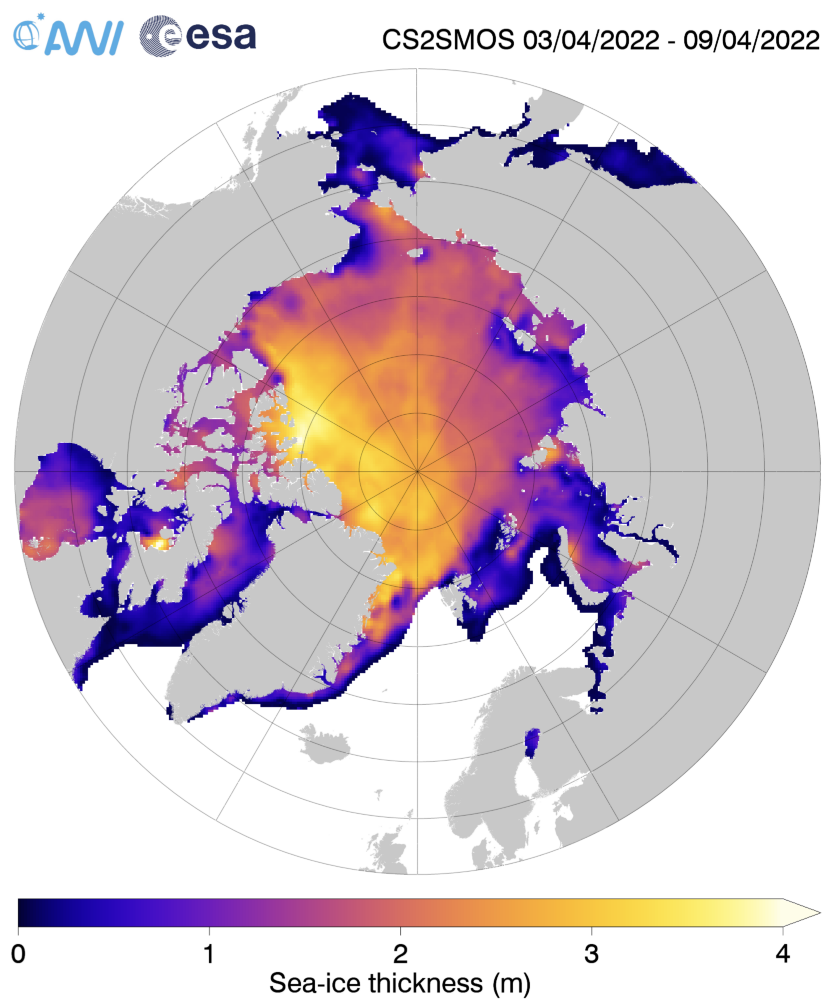
The ice in those areas is still very thin on the latest AWI CryoSat-2/SMOS sea ice thickness map:
[Edit – April 11th]
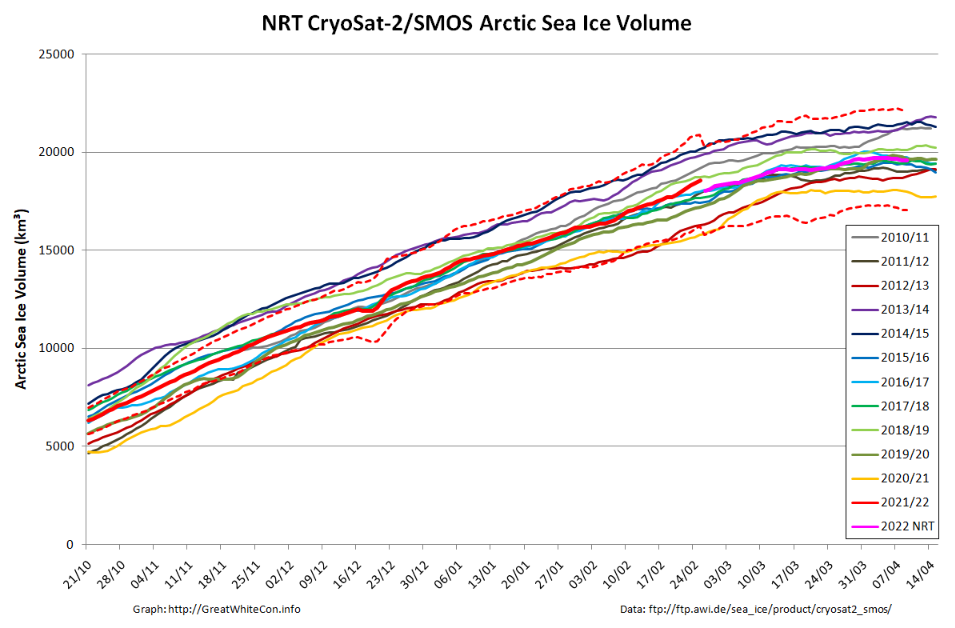
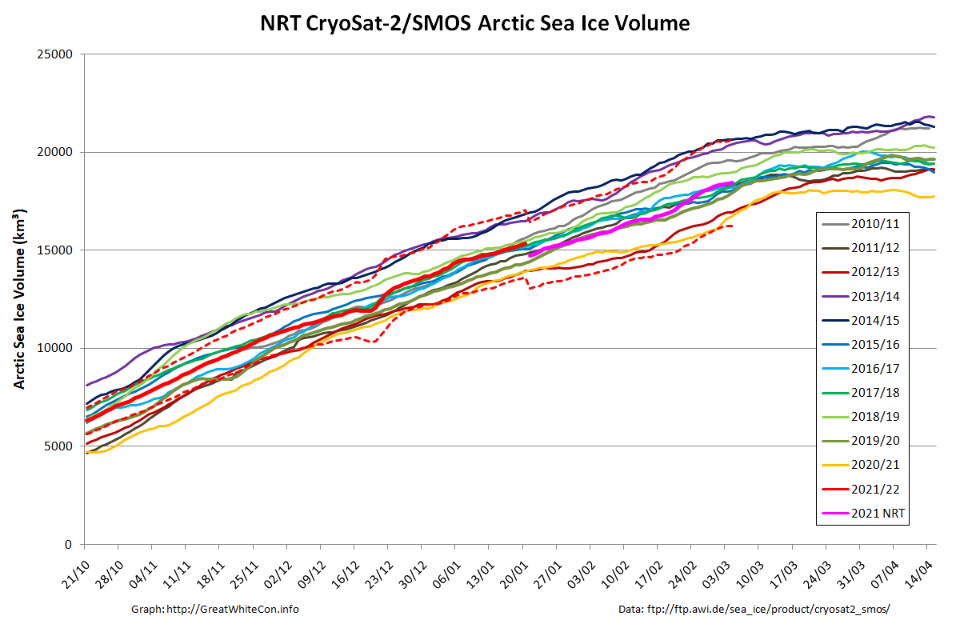
Here too is the latest AWI CryoSat-2/SMOS volume graph:
The reanalysed data is now showing something of a surge towards the end of February.
[Edit – April 23rd]
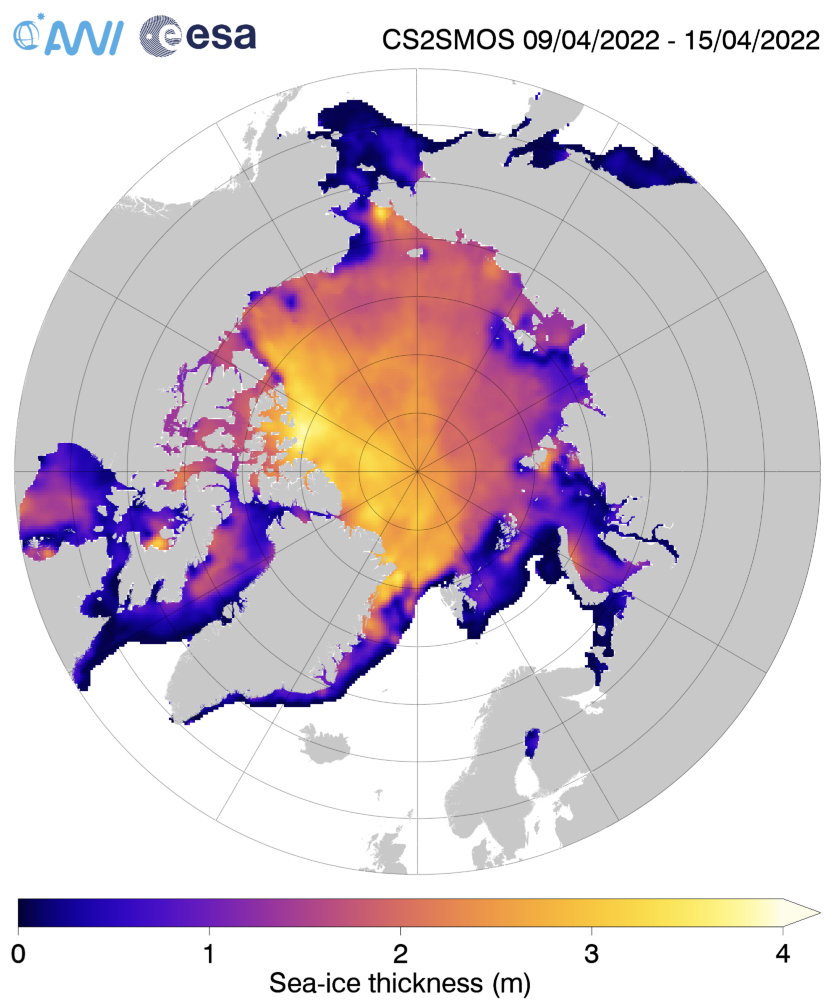
Here’s the last “near real time” AWI CryoSat-2/SMOS Arctic sea ice thickness map for Spring 2022:
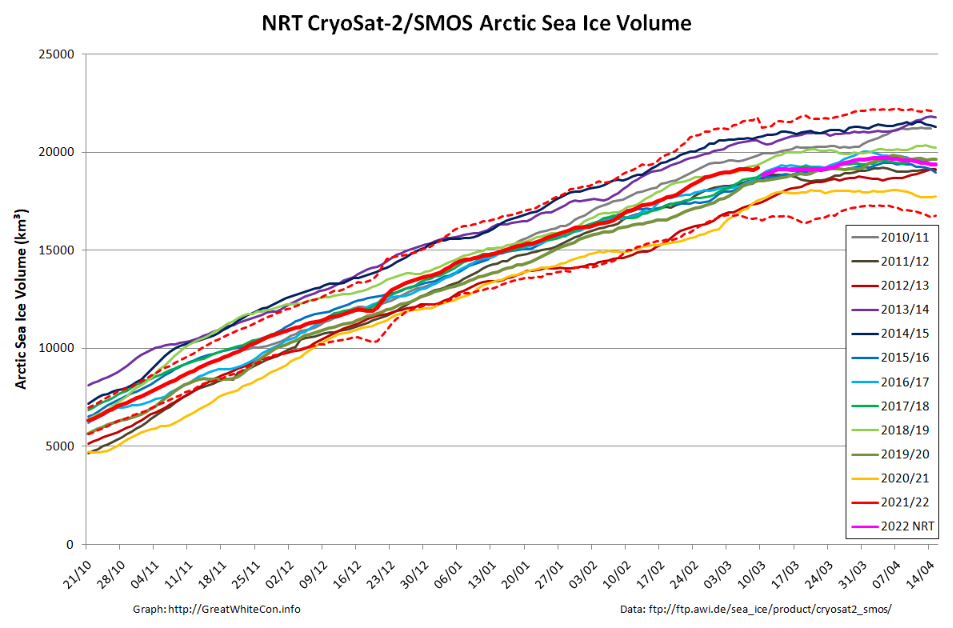
The significantly thinner areas in the Beaufort and Chukchi Seas are even more pronounced than previously. Here also is the associated CS2/SMOS volume graph:
The 2022 maximum volume based on NRT data is 19719 km³ on April 5th. Expect that to be revised upwards when the reanalysed data is ultimately published.
Going back to 2 dimensions, the assorted “ups and downs” now seem to have resolved into the melting season proper:
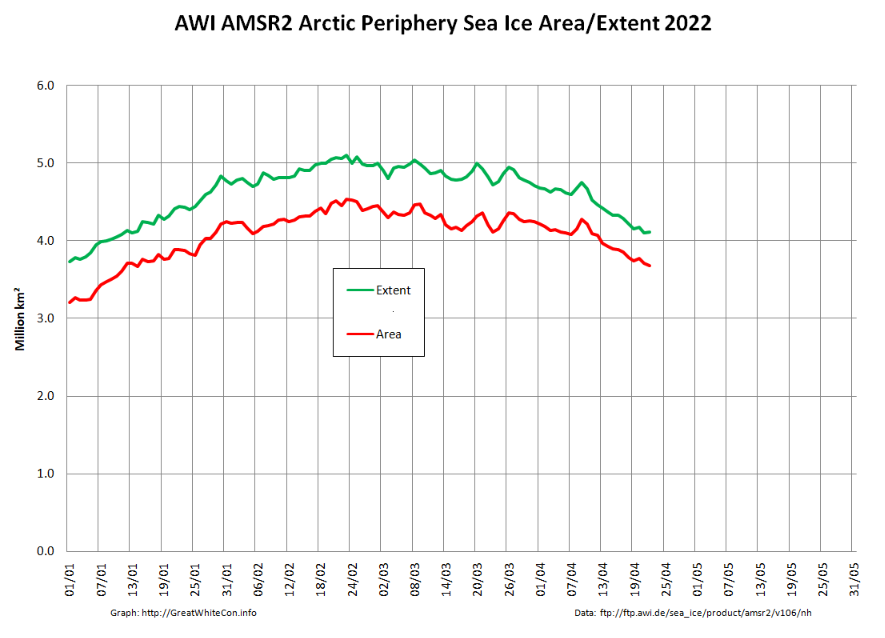
The peripheral sea have been responsible for most of the recent decline:
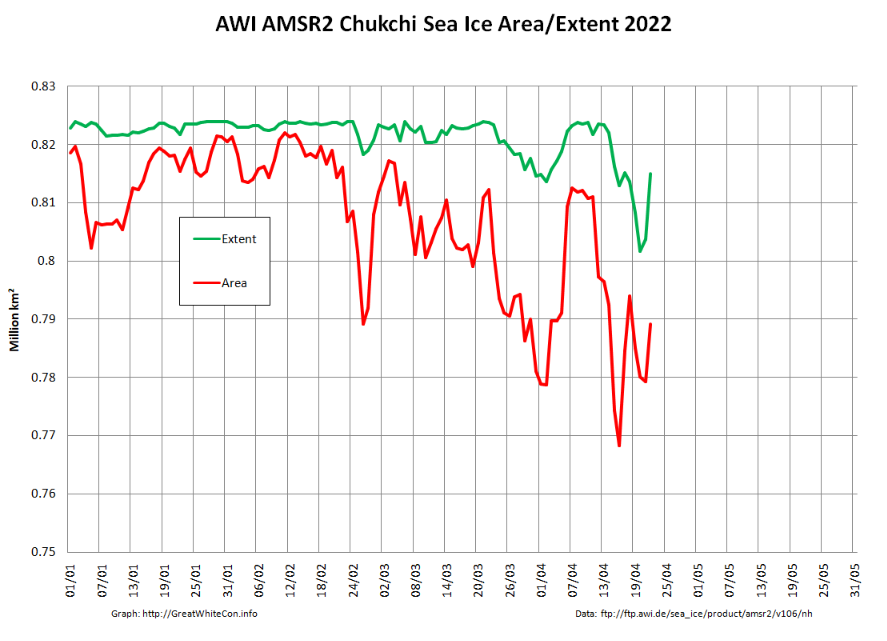
However as mentioned above, the Chukchi Sea has been experiencing some ups and downs of its own. Perhaps the sun is now high enough in the sky for the most recent “down” to stick around for the summer?
“True colour” image of the Chukchi Sea on April 21st from the MODIS instrument on the Terra satellite[Edit – April 24th]
Over the last couple of days some open water has appeared in the Beaufort Sea off the Mackenzie Delta:
“True colour” image of the Beaufort Sea on April 23rd from the MODIS instrument on the Terra satellite [Edit – April 25th]
Especially for Taylor, here’s the GFS Arctic snow depth forecast for 10 days into the future:
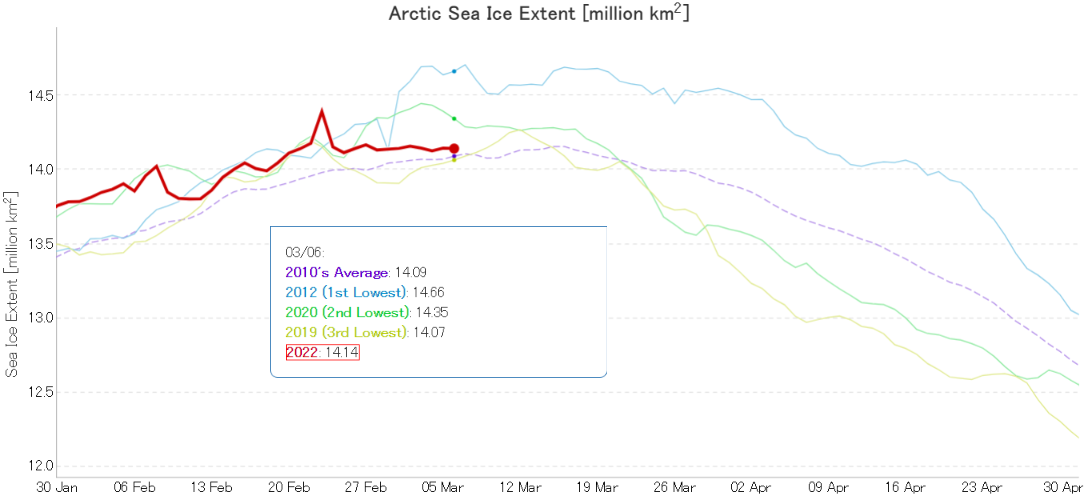
For detailed analysis of Arctic sea ice extent over the next few weeks please see the 2022 maximum extent thread. However to get the new open thread going here is the current JAXA/ViSHOP extent graph:
It’s looking more and more as though the real maximum for 2022 occurred close the false peak on February 23rd.
Arctic sea ice volume will keep increasing for a while longer. Here is the current AWI CryoSat-2/SMOS volume graph:
The recent “flat line” in extent is in part due to recent events on the Pacific periphery of the Arctic. Take a look at this animation of AMSR2 sea ice concentration:
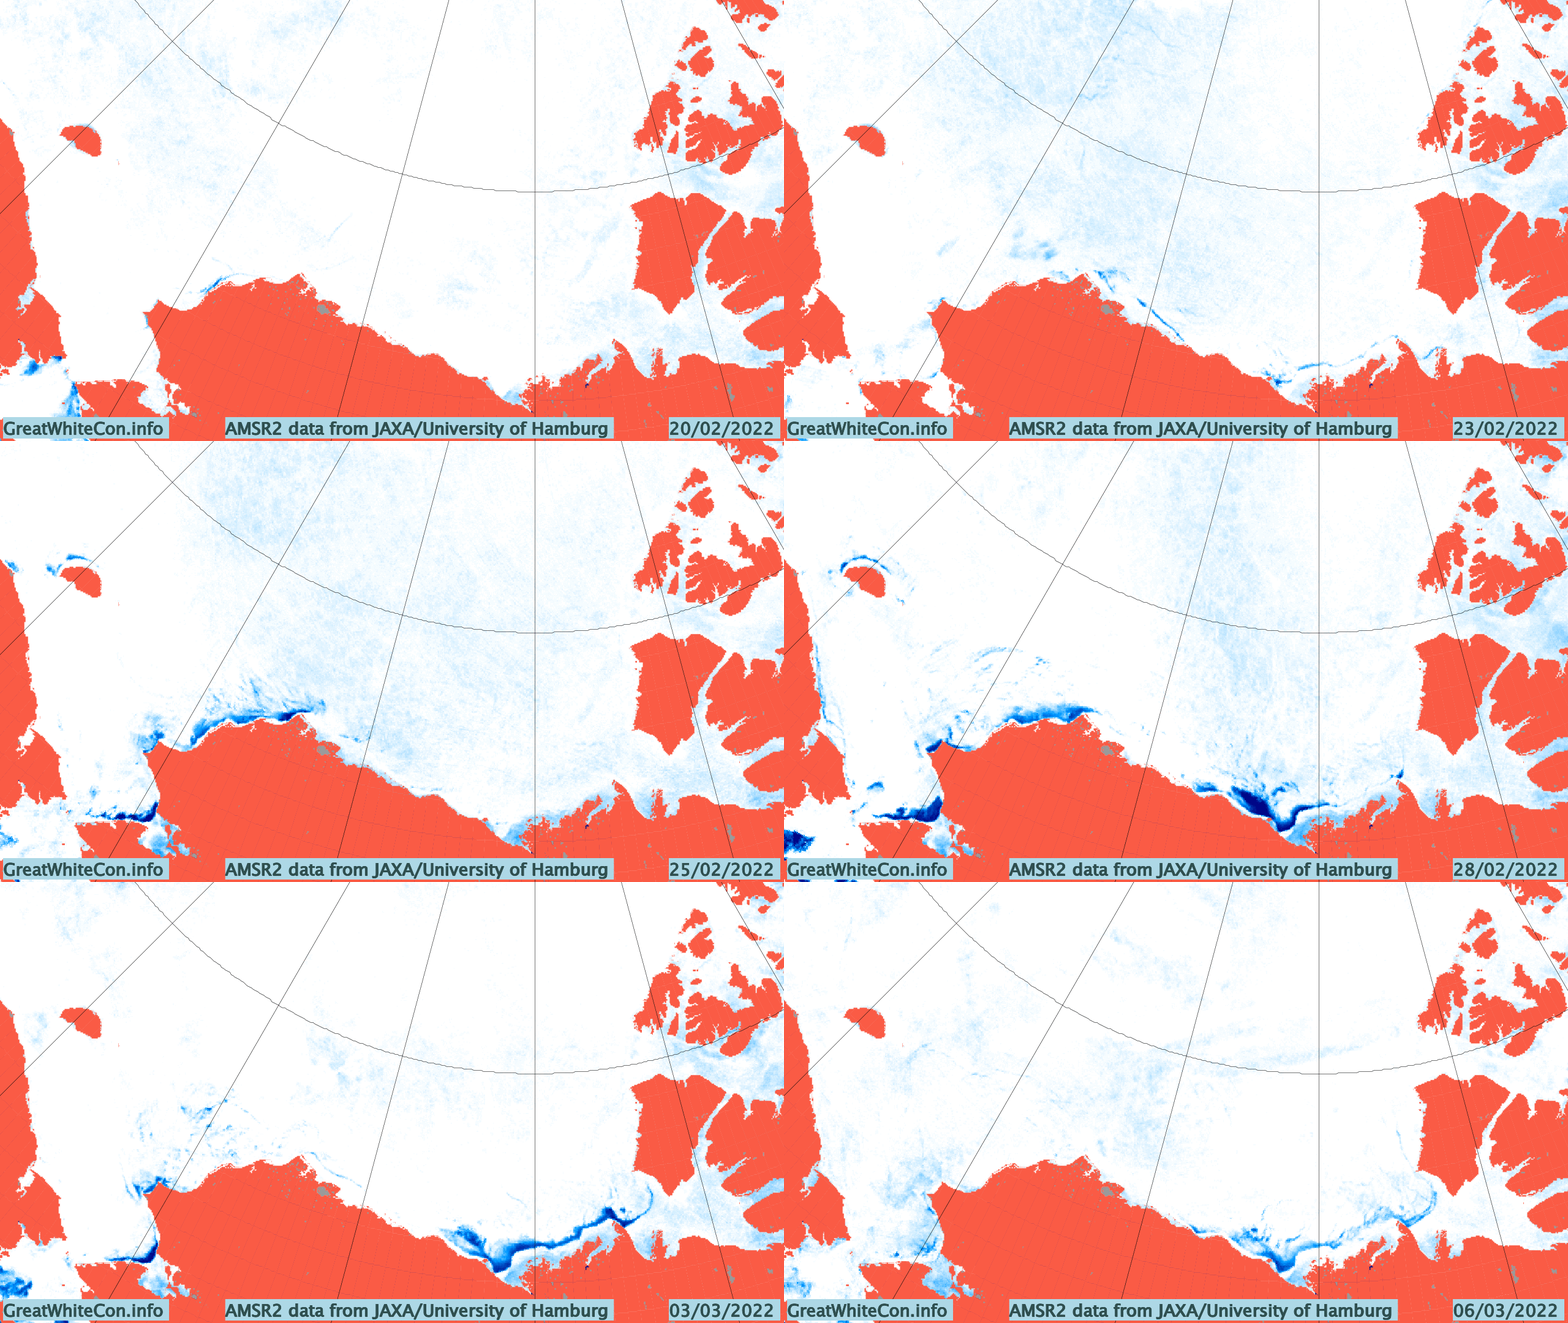
The gap varies depending on how the wind blows, but there is still evidence of open water (or very thin ice) along the shore of the Beaufort and Chukchi Seas. Here’s the Mackenzie Delta and the adjacent Beaufort Sea on March 5th:
Christmas is coming. Santa’s secret summer swimming pool has frozen over. The time has come for a new monthly Arctic update.
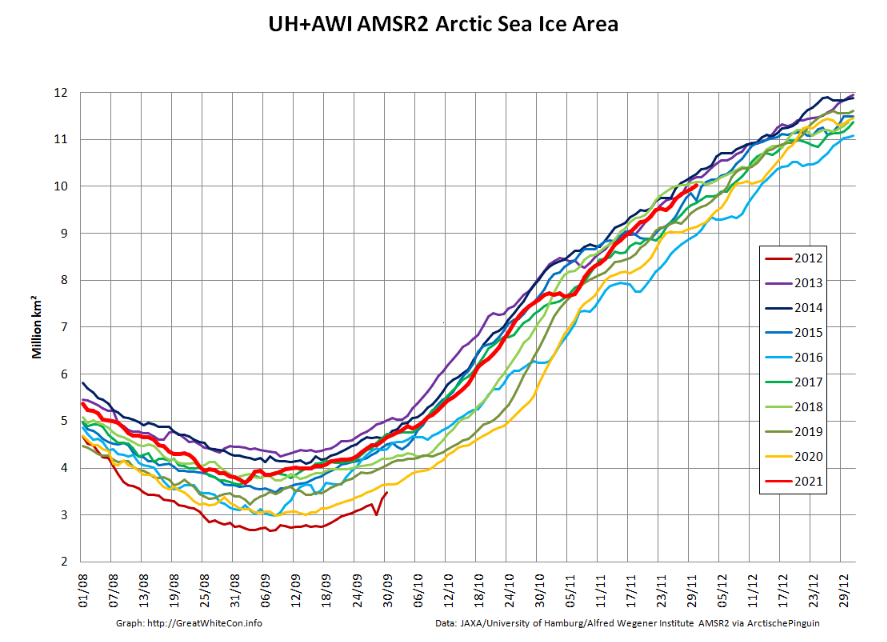
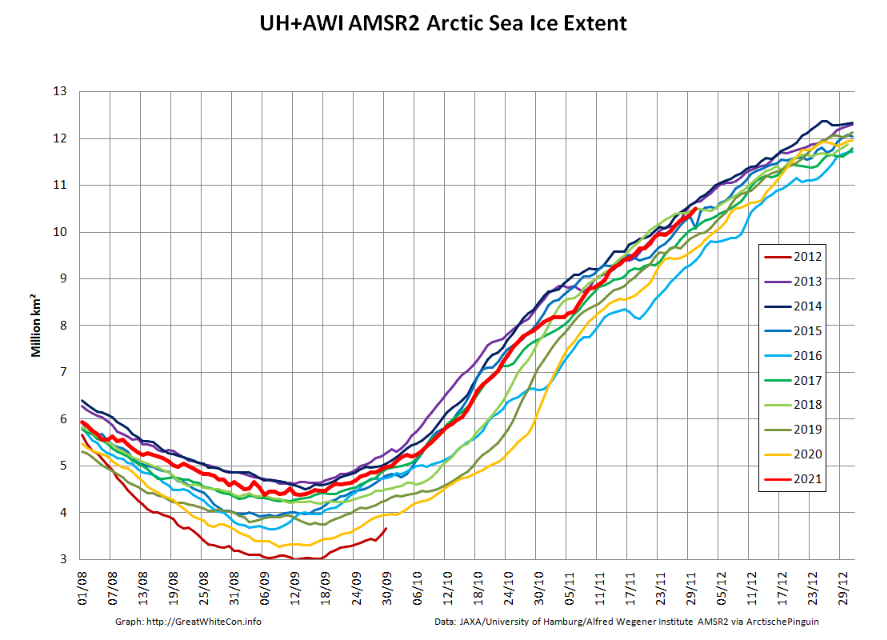
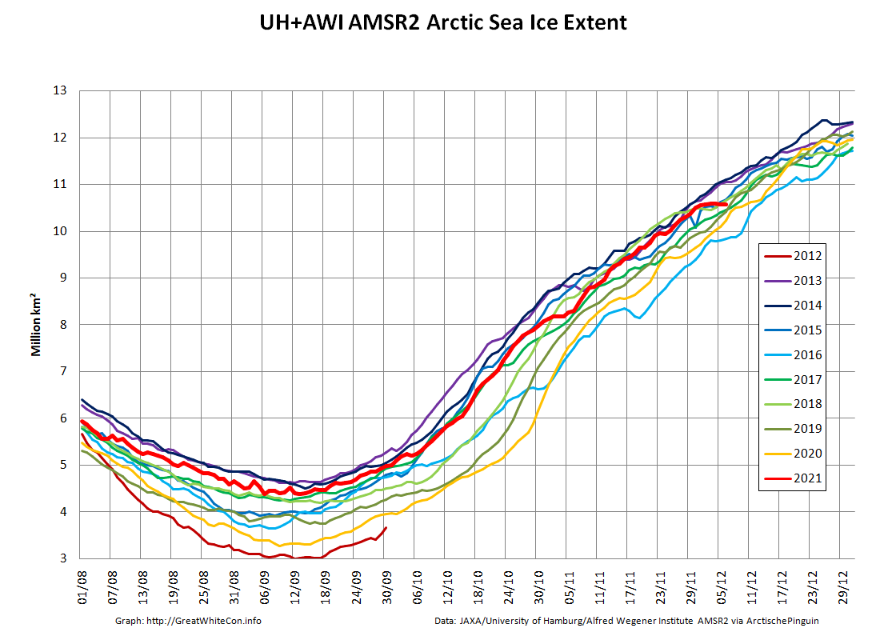
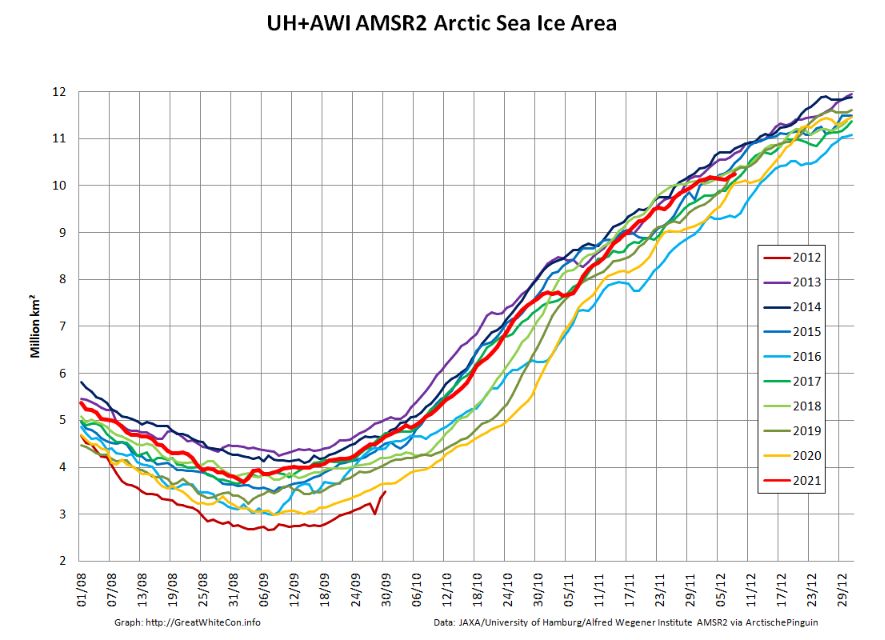
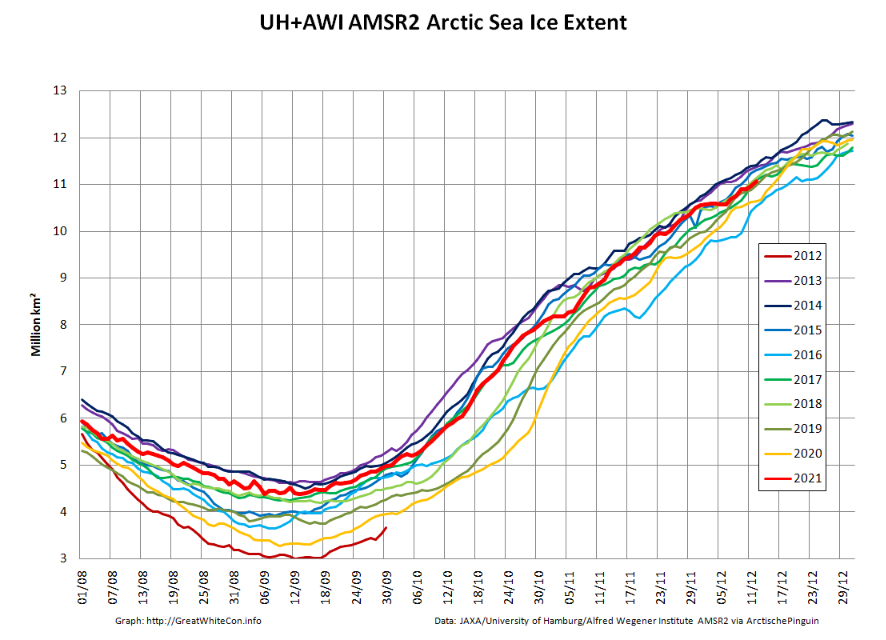
The JAXA/ADS/ViSHOP web site is undergoing maintenance for a week, so let’s start the festive season with a look at high resolution AMSR2 area and extent:
After a brief hiatus in early November both metrics are once again tracking within, but near the upper bound of the last 10 years.
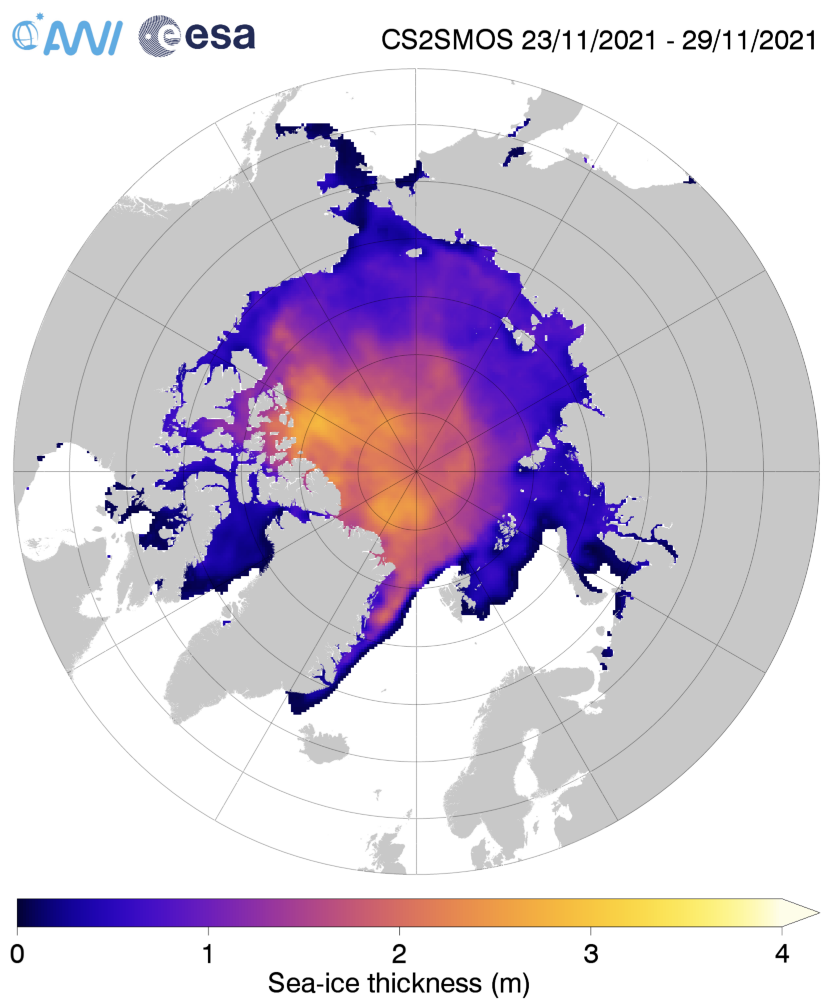
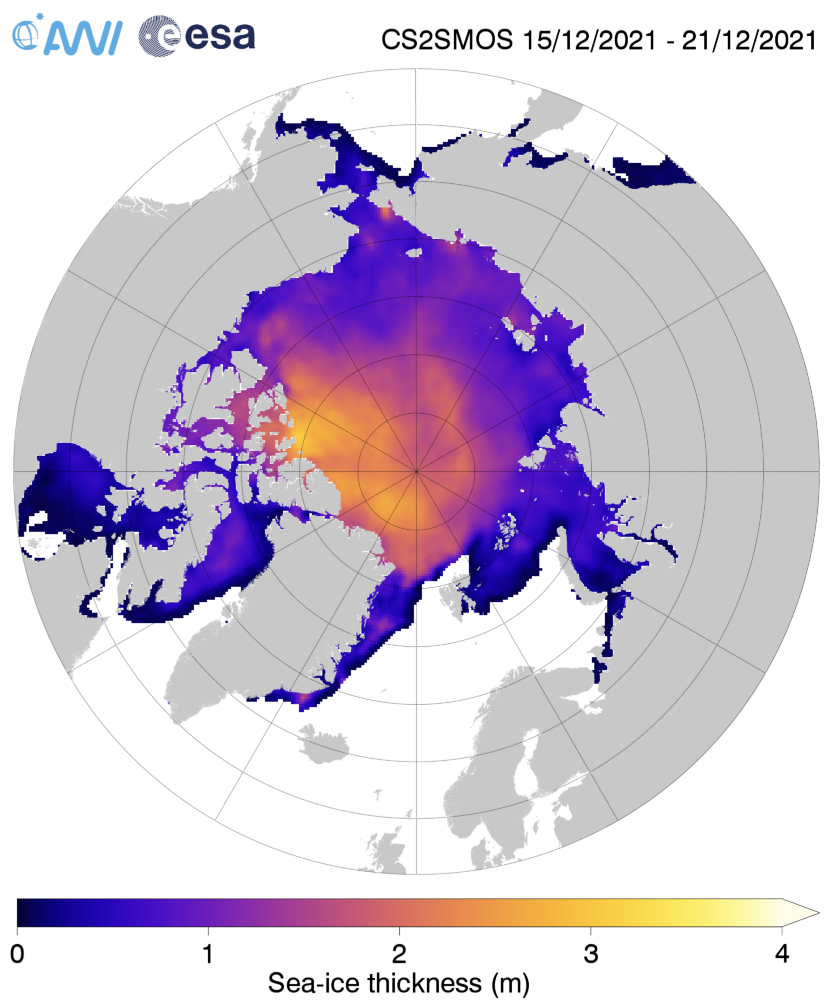
Next let’s take a look at the latest AWI CryoSat-2/SMOS thickness map:
together with the anomaly map from the Finnish Meteorological Institute:
Still thinner than usual in the so called “last ice area” north of Greenland and Ellesmere Island, and thicker than usual on the Siberian side of the Arctic, particularly in the Chukchi Sea.
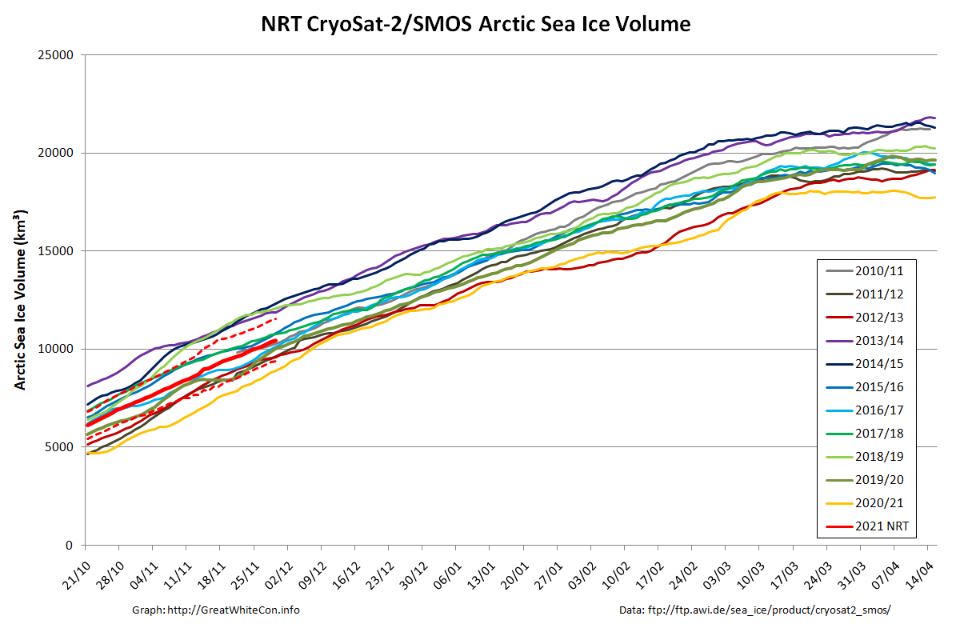
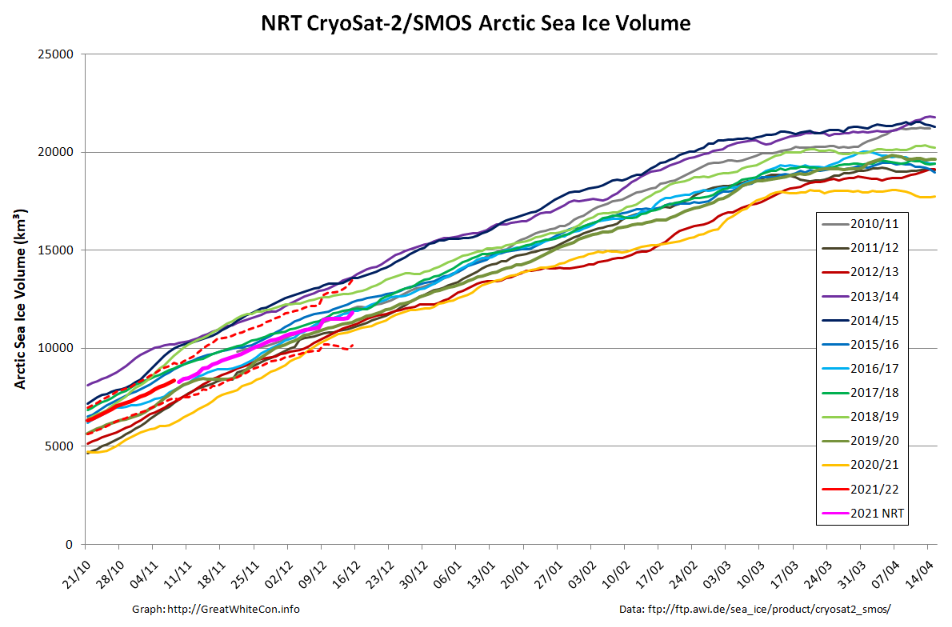
Finally, for the moment at least, here’s the latest CryoSat-2/SMOS volume graph:
Unlike the previous metrics, this particular one is close to the middle of the pack.
Sea ice extent increased at a faster than average pace through November and by the end of the month, extent was just within the interdecile range. Extent was above average in the Bering Sea, but Hudson Bay remained unusually ice free through the month.
The November 2021 monthly average extent was 9.77 million square kilometers (3.77 million square miles), which ranked tenth lowest in the satellite record. The 2021 extent was 930,000 million square kilometers (359,000 million square miles) below the 1981 to 2010 long-term average. Extent was higher than average in the Bering Sea, but is extremely low in Hudson Bay.
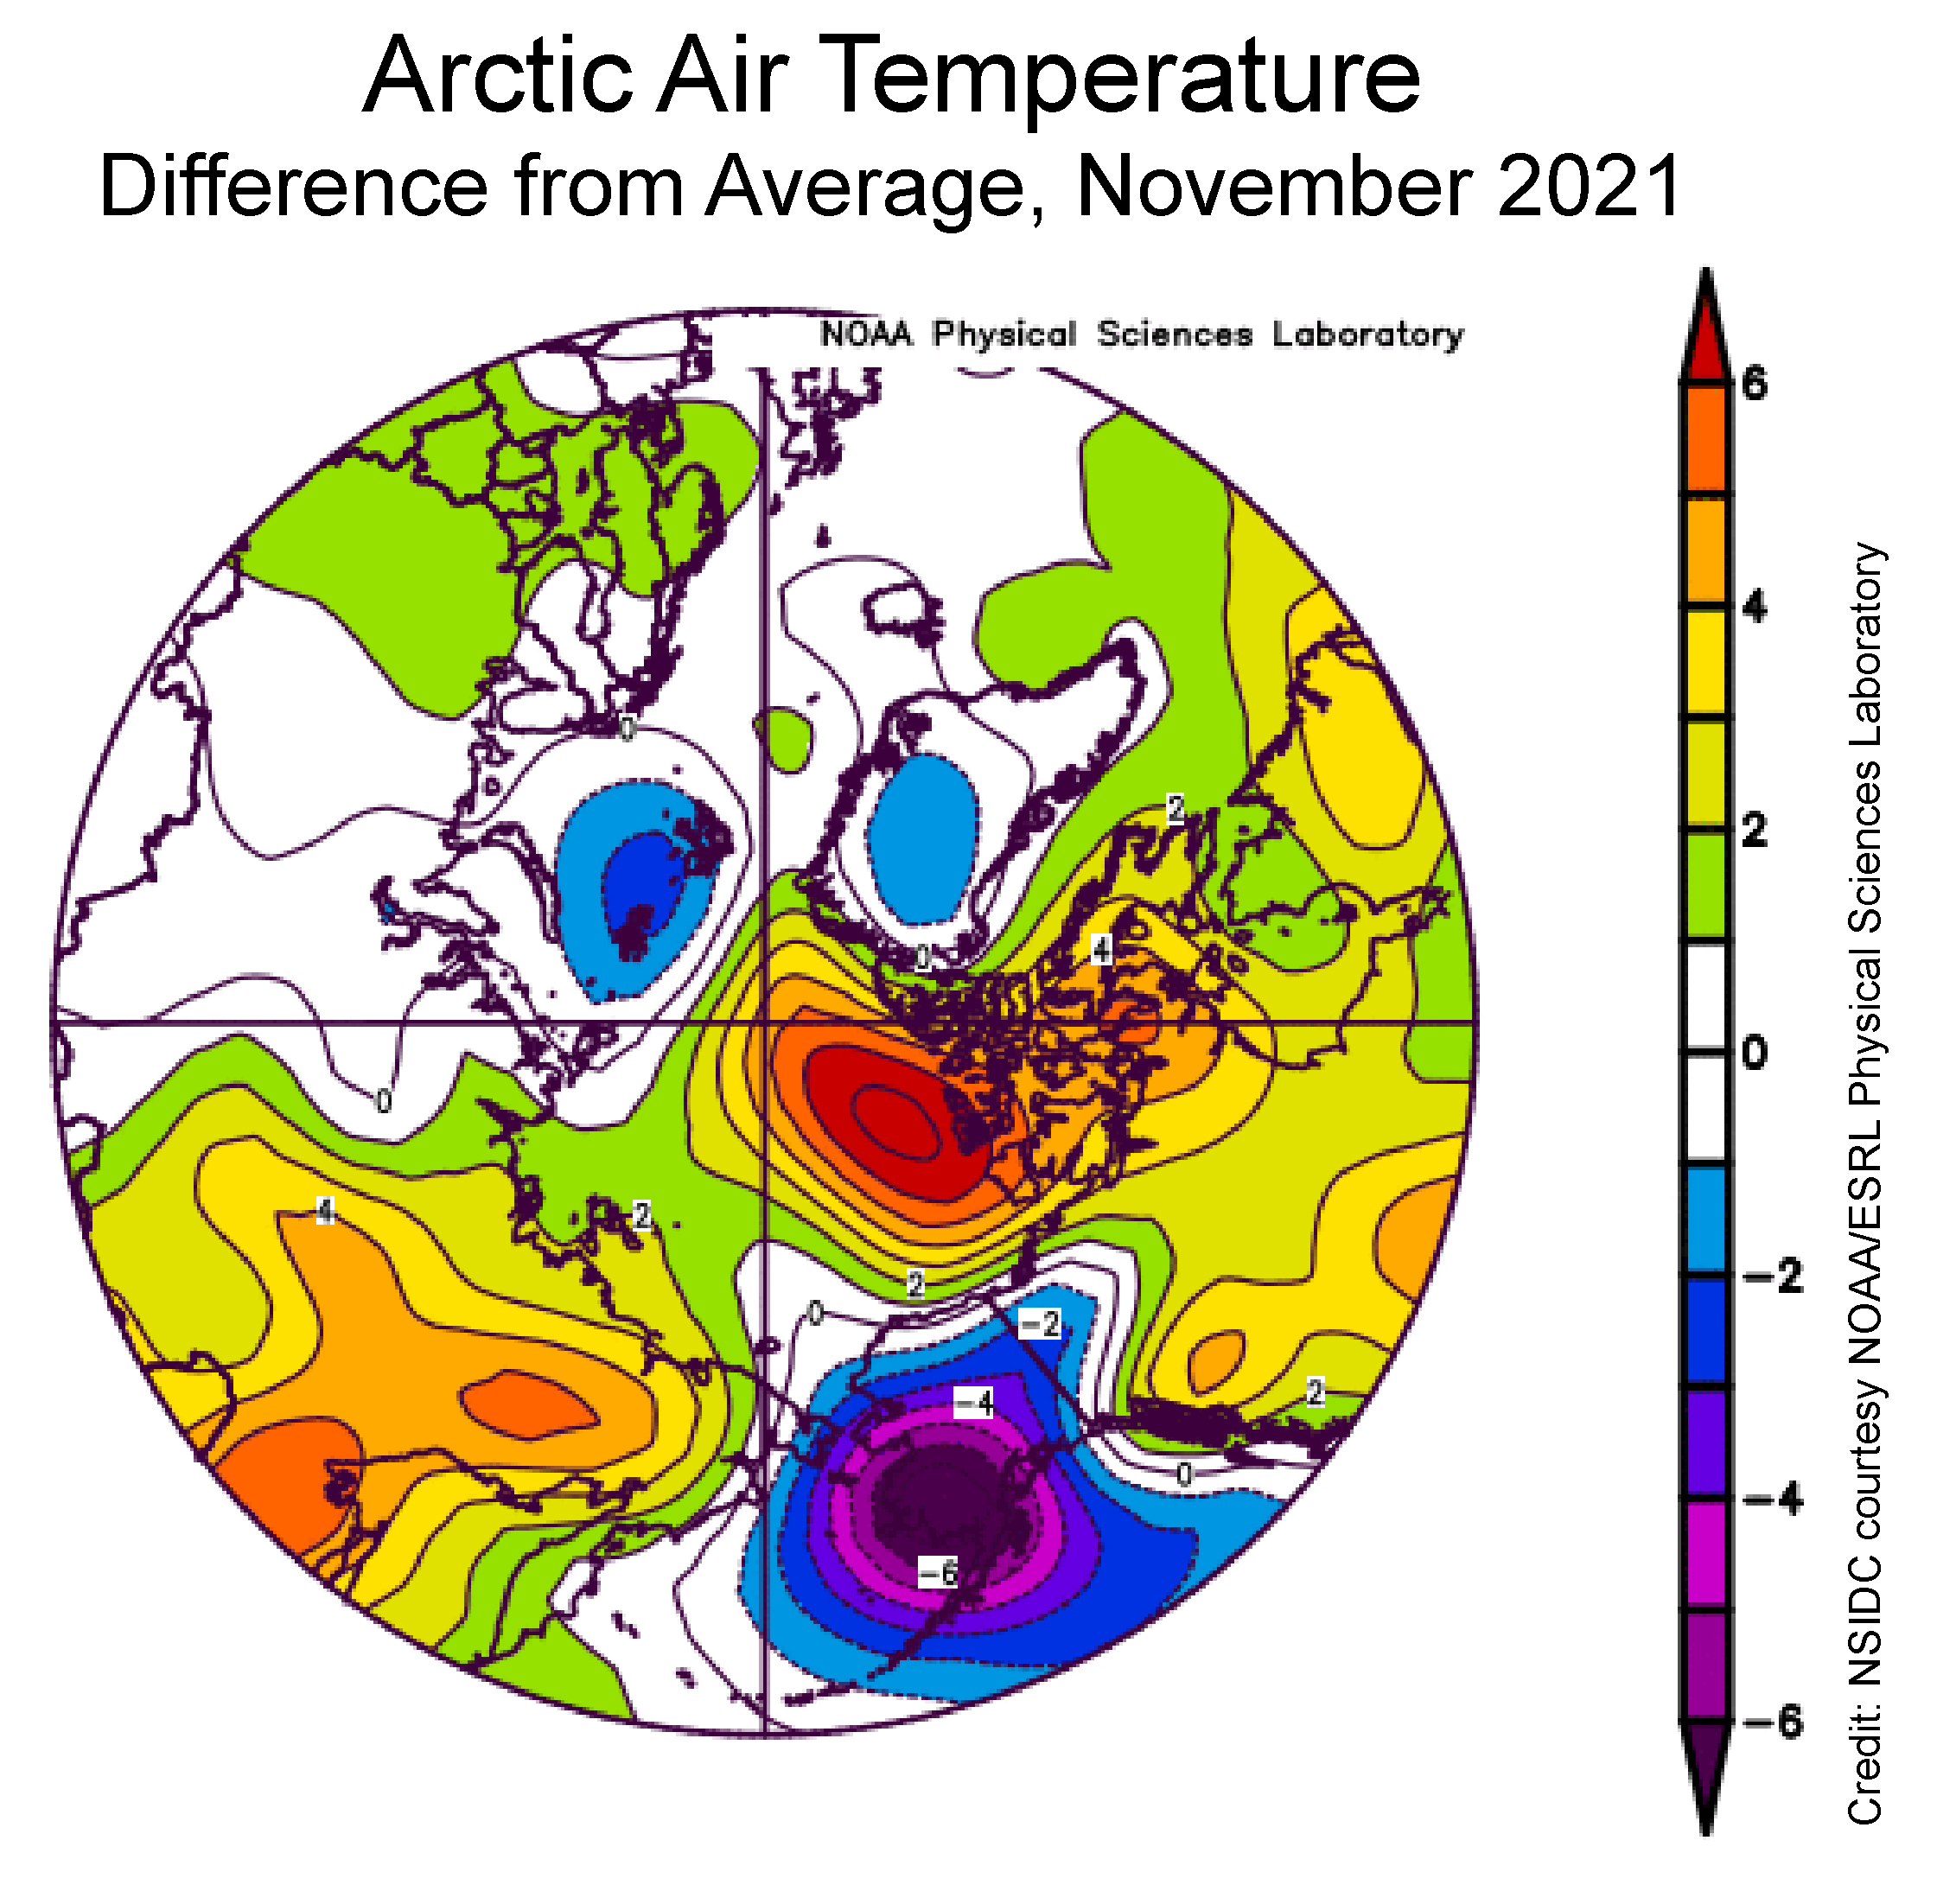
Air temperatures at the 925 millibar level (about 2,500 feet above the surface) were well above average north of the Canadian Archipelago, by as much as 6 degrees Celsius. Conversely, temperatures over southwest Alaska and the eastern sector of the Bering Sea were as much as 6 degrees Celsius below average:
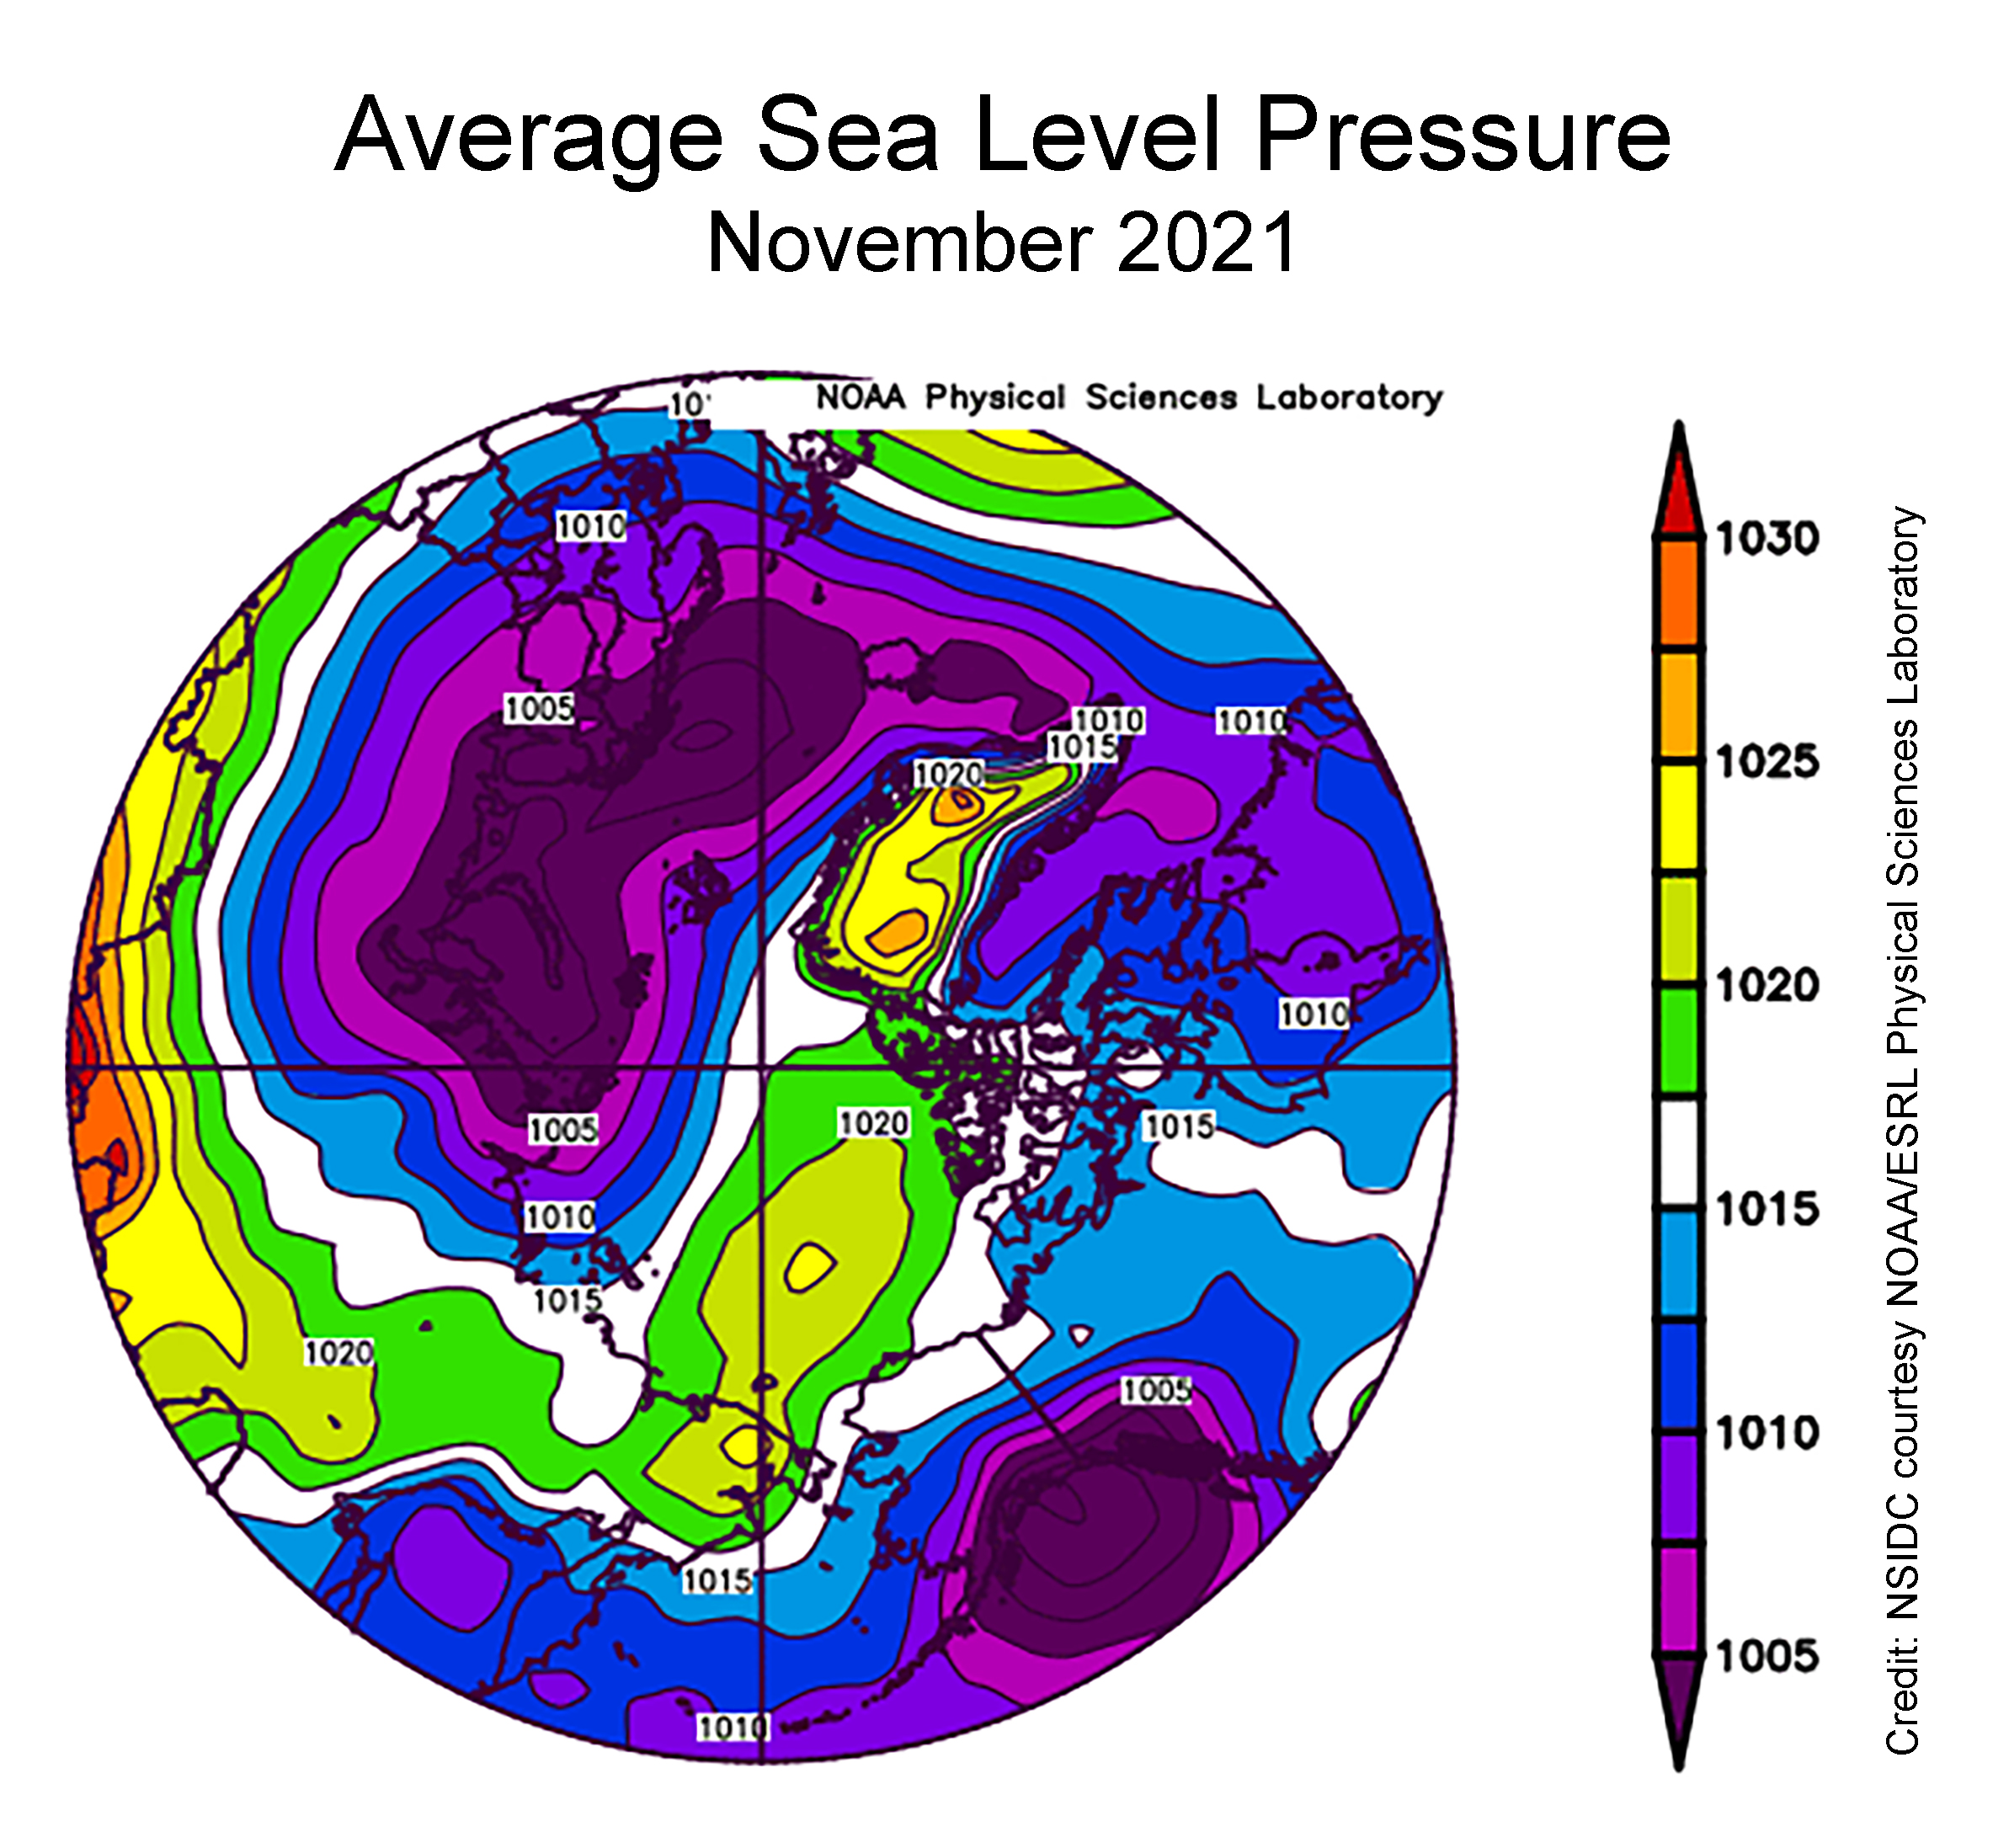
The sea level pressure pattern for November featured widespread low pressure over the Atlantic side of the Arctic and extending into the Barents and Kara Seas, paired with a moderately strong Beaufort Sea High. Strong low pressure over the Gulf of Alaska resulted in a circulation pattern in the eastern Bering Sea that brought cold air from the north. This pattern was favorable for sea ice growth, and can explain the above average ice extent in the region:
[Edit – December 7th]
Since the start of December high resolution AMSR2 extent has been flatlining:
Sea ice area has even declined slightly over the past few days:
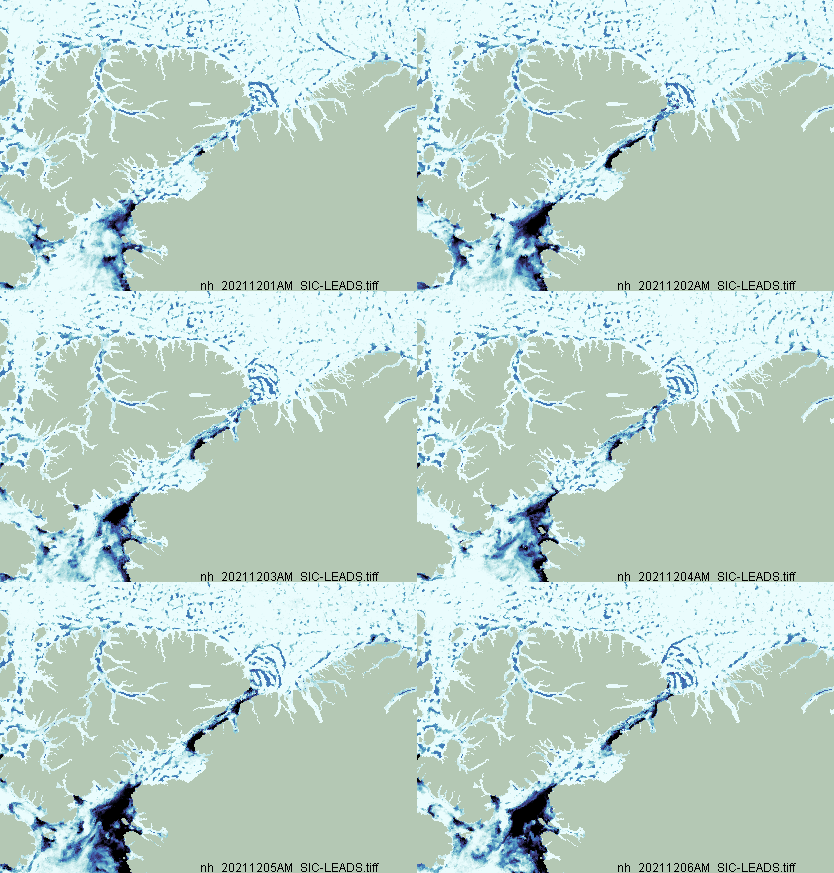
Here too is an animation created by Uniquorn on the Arctic Sea Ice Forum using AWI ASMR2 data to reveal ice movement through the Nares Strait during December:
[Edit – December 9th]
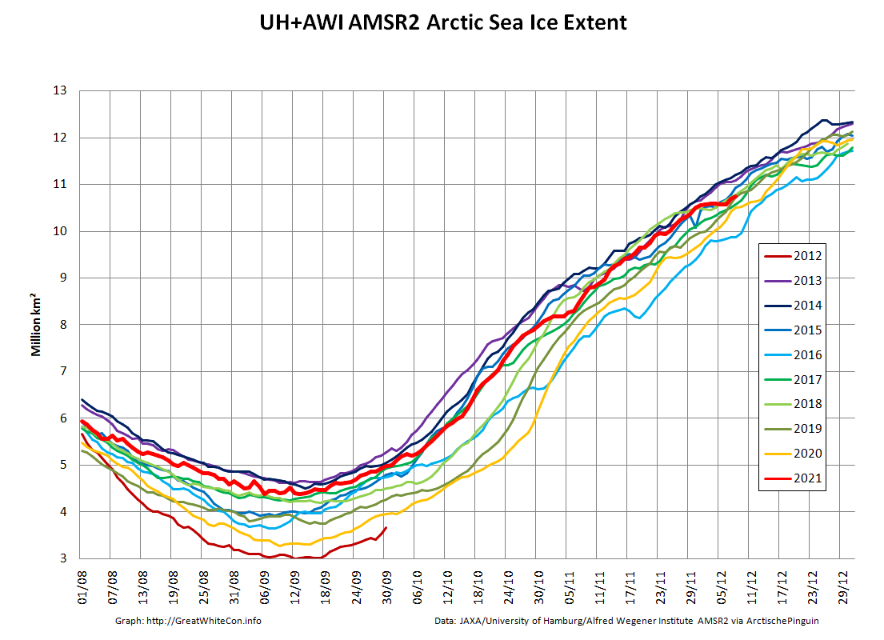
The JAXA/ADS/ViSHOP web site is down again, so let’s take another look at high resolution AMSR2 area and extent:
It seems that the “brief hiatus” is over, and extent is now in a “statistical tie” with 2018/19 at 4th lowest for the date amongst recent year.
[Edit – December 13th]
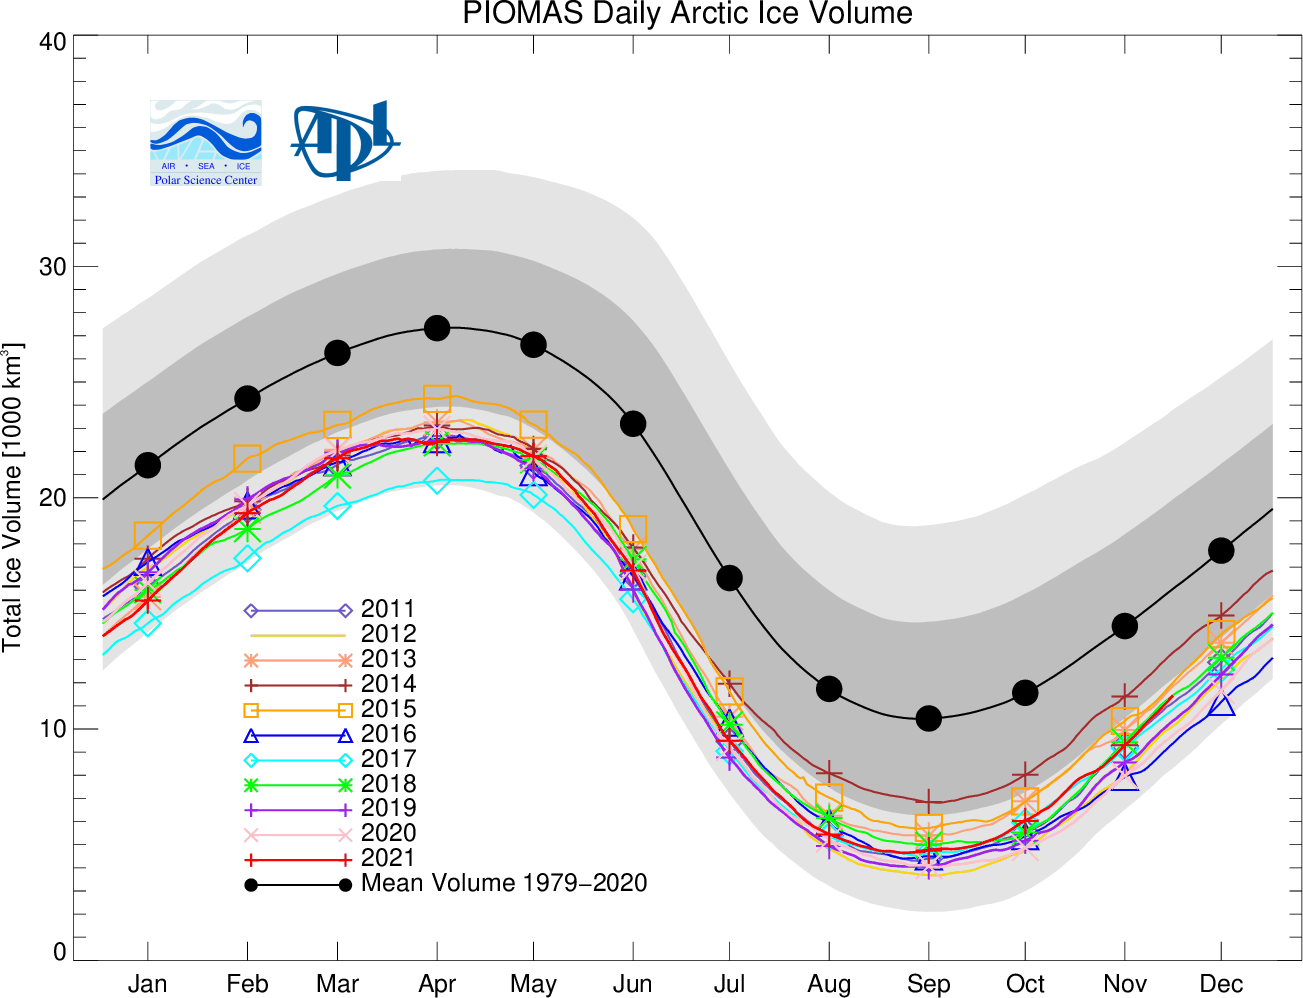
The PIOMAS Arctic sea ice volume data for November 2021 has been released:
Average Arctic sea ice volume in November 2021 was 7,830 km3. This value is the 7th lowest on record for November, about 1600 km3 above the record set in 2016. Monthly ice volume was 61% below the maximum in 1979 and 45% below the mean value for 1979-2020. Average November 2021 ice volume was about one sigma above the 1979-2020 trend line. October saw relative rapid ice growth for recent years bringing the mean ice thickness (above 15 cm thickness) above the recent low values:
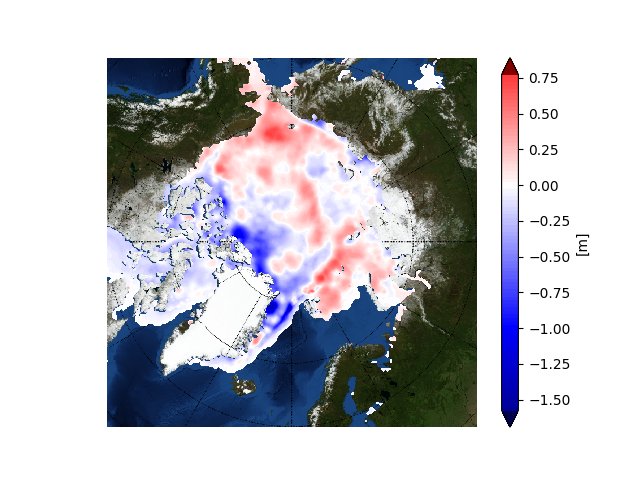
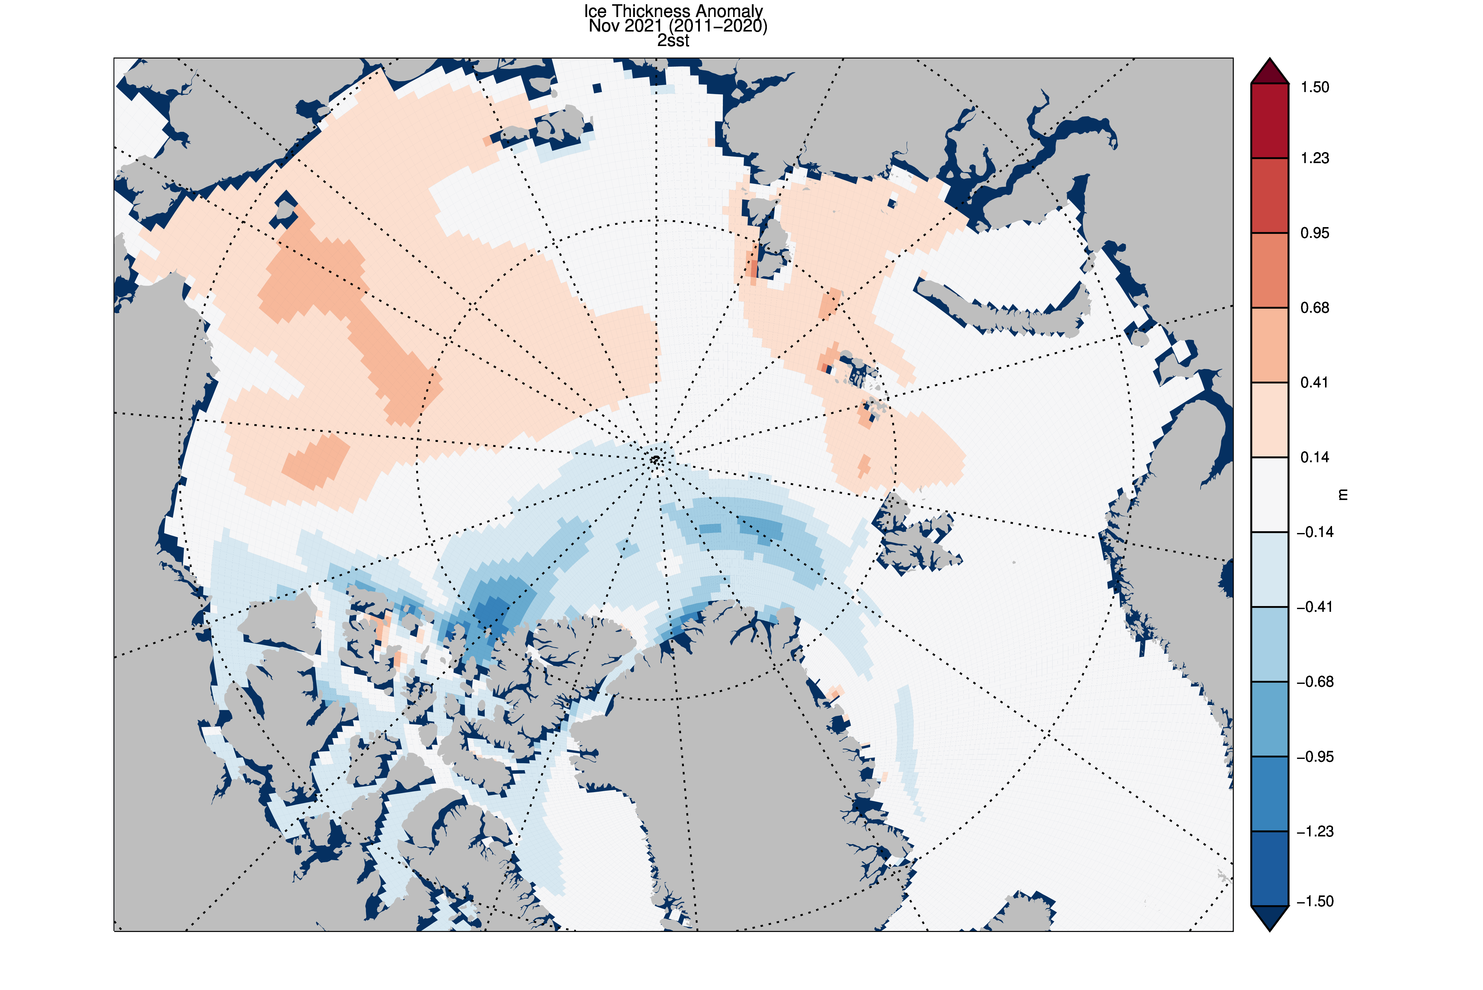
The ice thickness anomaly map for November 2021 relative to 2011-2020 continues to show anomalies divided into positive and a negative halves with areas of positive anomalies increasing since the two prior months. Negative anomalies stretching from North of Greenland and along the Canadian Archipelago across the Eastern Arctic into the Barents Sea. Areas North of Greenland again feature very low ice thickness as in prior years (see our recent paper). Positive anomalies are notable in the Beaufort and Chukchi seas due to advection of thicker older ice into the areas during the previous winter (See recent paper on this). The Alaskan summer has also been relatively cold contributing to unusually thick ice in this area:
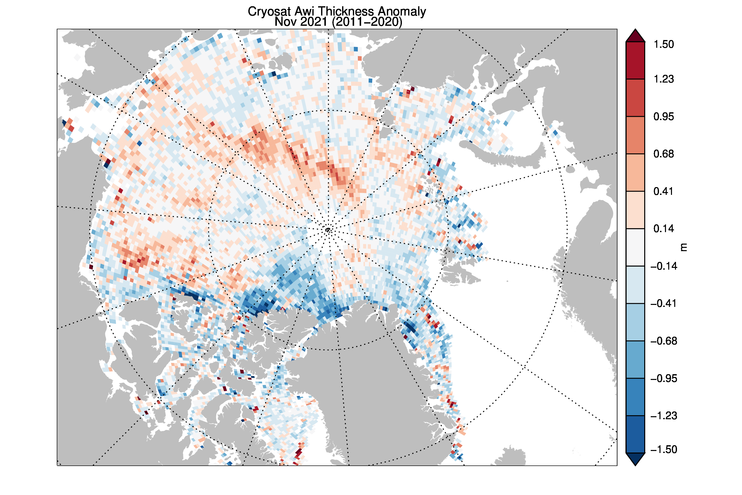
CryoSat-2 ice thickness shows a similar picture sea ice thickness anomalies but with the maxima slightly displaced which maybe due to temporal sampling of the composite:
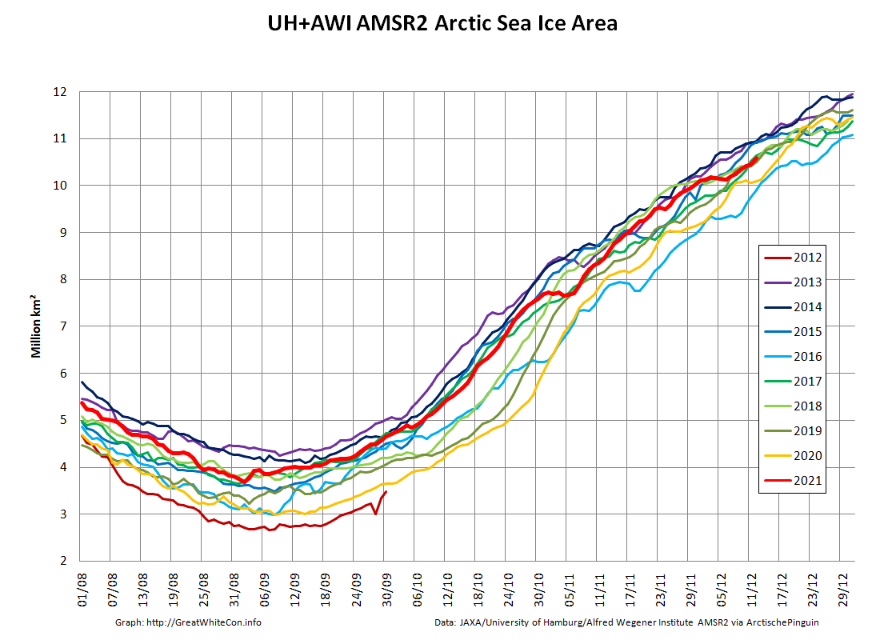
The JAXA web site is still down, so here’s another set of high resolution AMSR2 graphs:
[Edit – December 14th]
NOAA have just released their 2021 Arctic Report Card. Here’s the introductory video:
“Everybody knows [the Arctic] is a canary when it comes to climate change,” says Peter Jacobs, a climate scientist at NASA’s Goddard Space Flight Center, who presented the work on 13 December at a meeting of the American Geophysical Union. “Yet we’re misreporting it by a factor of two. Which is just bananas.”
Jacob’s co-authors include researchers who oversee several influential global temperature records, and they noted the faster Arctic warming as they prepared to release the global temperature average for 2020. NASA’s internal peer reviewer challenged the higher figure, suggesting the scientific literature didn’t support it. But the researchers have found the four times ratio holds in record sets from both NASA (3.9) and the United Kingdom’s Met Office (4.1), and they hope to soon include the Berkeley Earth record. (Their work also has company: In July, a team at the Finnish Meteorological Institute posted a preprint also arguing for the four times figure.)
The researchers found Arctic warming has been underestimated for a couple of reasons. One is climate scientists’ tendency to chop each hemisphere into thirds and label the area above 60°N as the “Arctic”—an area that would include, for example, most of Scandinavia. But the true definition of the Arctic is defined by Earth’s tilt. And, as has been known for centuries, the Arctic Circle is a line starting at 66.6°N. When researchers lump in the lower latitudes, “you’re diluting the amount of Arctic warming you’re getting,” Jacobs says. “That is not a trivial thing.”
The other difference is the choice of time periods over which the warming rate is calculated. Jacobs and his colleagues focused on the past 30 years, when a linear warming trend emerged for the Arctic. Analyses that look at longer term trends see less divergence between the Arctic and the world.
[Edit – December 23rd]
Here is the latest CryoSat-2/SMOS volume graph, now including some reanalysed data which seems to have come in slightly higher than the earlier “near real time” numbers:
Plus the AWI thickness map:
Further discussion of the divergence between volume and extent continues in the new New Year 2022 thread:
By way of a change we start this month’s look at all things Arctic with some sea ice statistical analysis. Anthony Watts’ Arctic porky pie production line has been speeding up recently, and I am not the only one who has noticed. As part of his takedown of the latest “skeptical” allegations against the United Kingdom Met Office Tamino has been looking at trends in Arctic sea ice extent over at his “Open Mind” blog:
First and foremost, the yearly minimum is only one day out of the year. We have sea ice extent data throughout the year, and what happens during the rest of the year counts. Instead of using the annual minimum, let’s use the annual average. To avoid losing the most recent data, I’ll compute the yearly average for October through the following September rather than the usual (but arbitrary) January through December. I’ll also omit October 1978 through September 1979 because that year is incomplete. I get this:
The annual averages show much less fluctuation than the annual minima, so we can estimate things like rates of change with greater precision. I find that there is statistical evidence that the rate changed over time. One model of such changes uses three straight-line segments with their changes chosen to best-fit the data, like this:
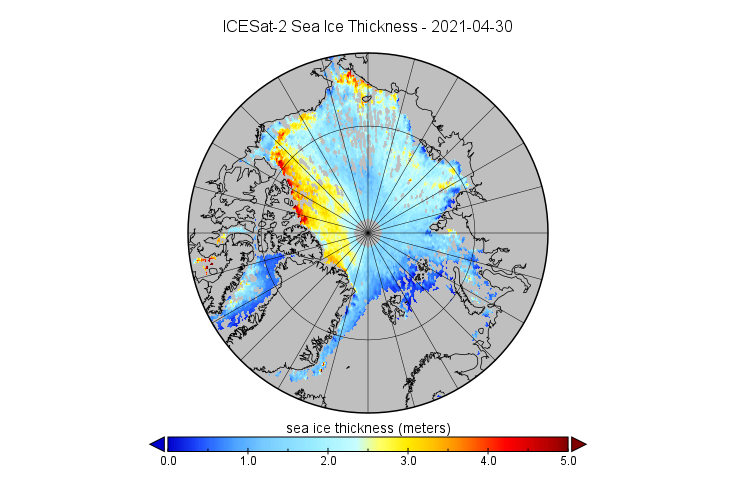
We reported on the first ICESat-2 sea ice thickness data to be released back in May. We are now very pleased to be able to reveal that the data up to April 2021 is now available for download from the NSIDC web site. Here’s a visualisation of April’s data:
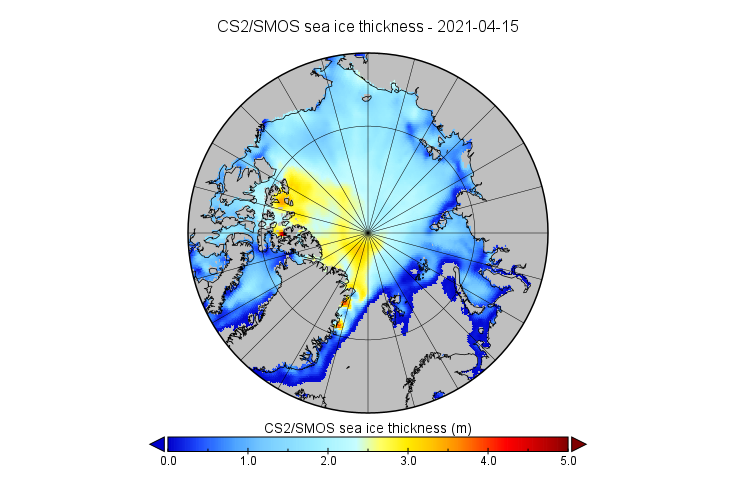
For comparison purposes here’s the CryoSat-2/SMOS equivalent:
ICESat-2 looks to have captured the arm of thicker ice extending across the Beaufort Sea suggested by sea ice age data better than CryoSat-2:
However thickness data is totally absent where leads are absent, in land-fast ice for example. It seems that near real time ICESat-2 processing isn’t available as yet, but we await the release of the data for October with barely bated breath!
A detailed dissection of the 2021 minimum of various Arctic sea ice extent metrics can be found on a dedicated thread. All other Arctic news in September will be found below.
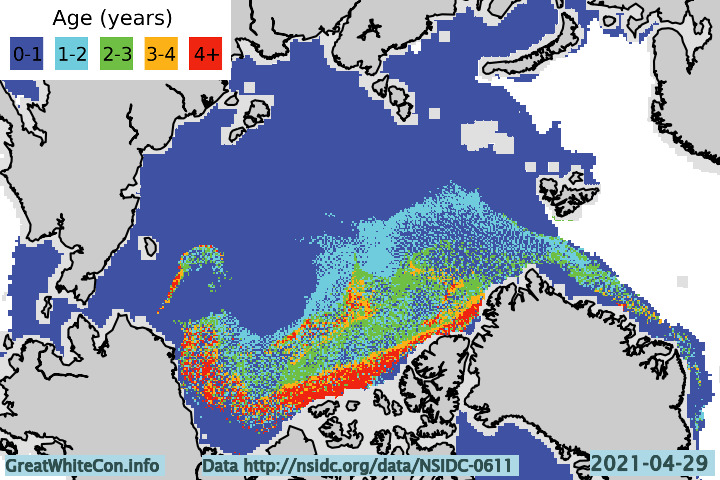
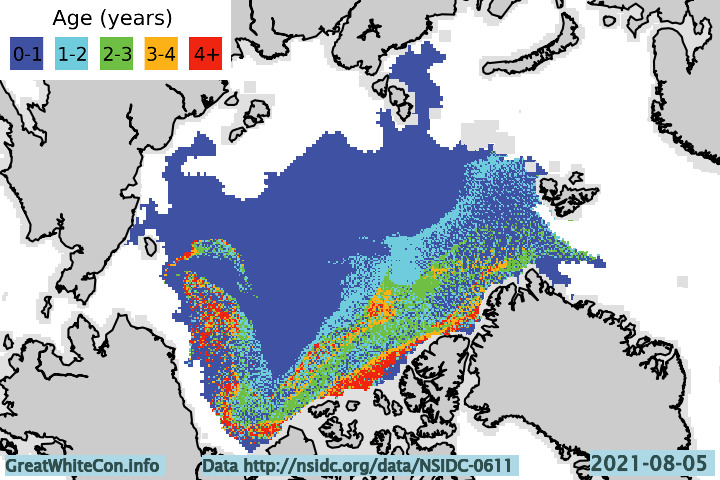
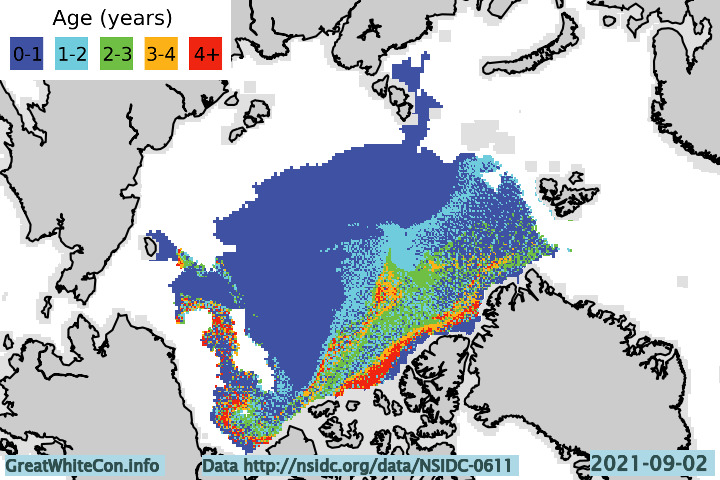
Let’s start with a map of sea ice age at the beginning of August:
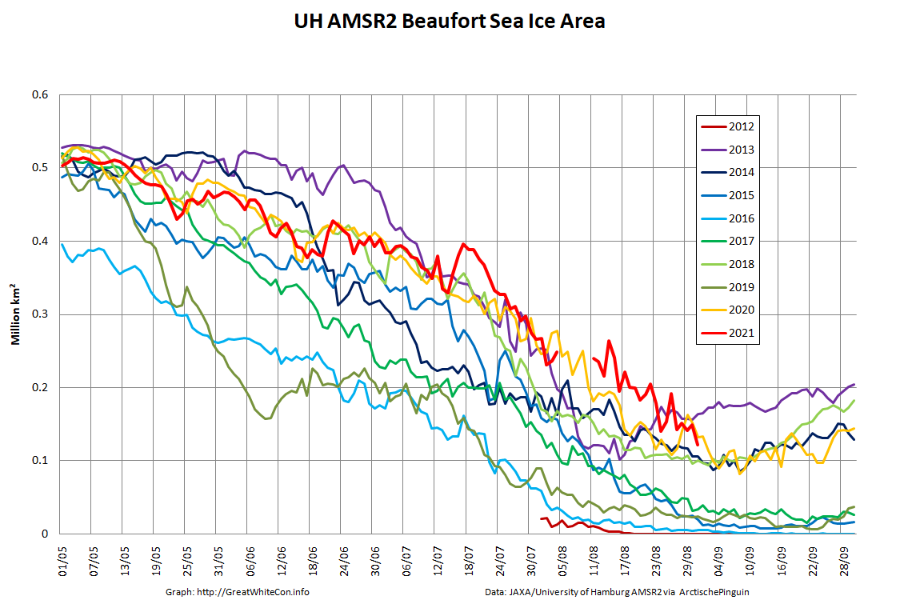
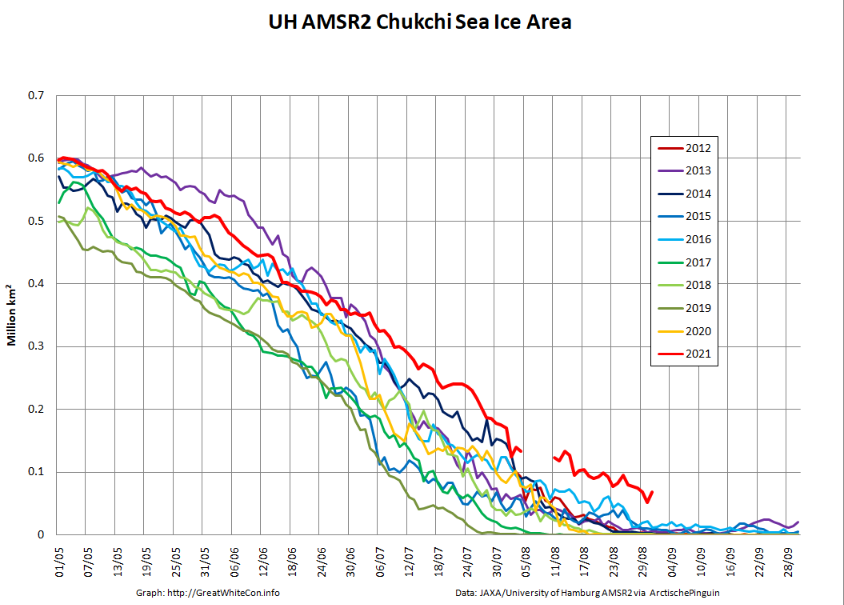
Firstly notice the absence of 3+ year old ice off the coast of north east Greenland. Also visible is a band of 4+ year old ice across the Pacific side of the Arctic Basin, which has slowed melting in the region and explains the following regional sea ice area graphs:
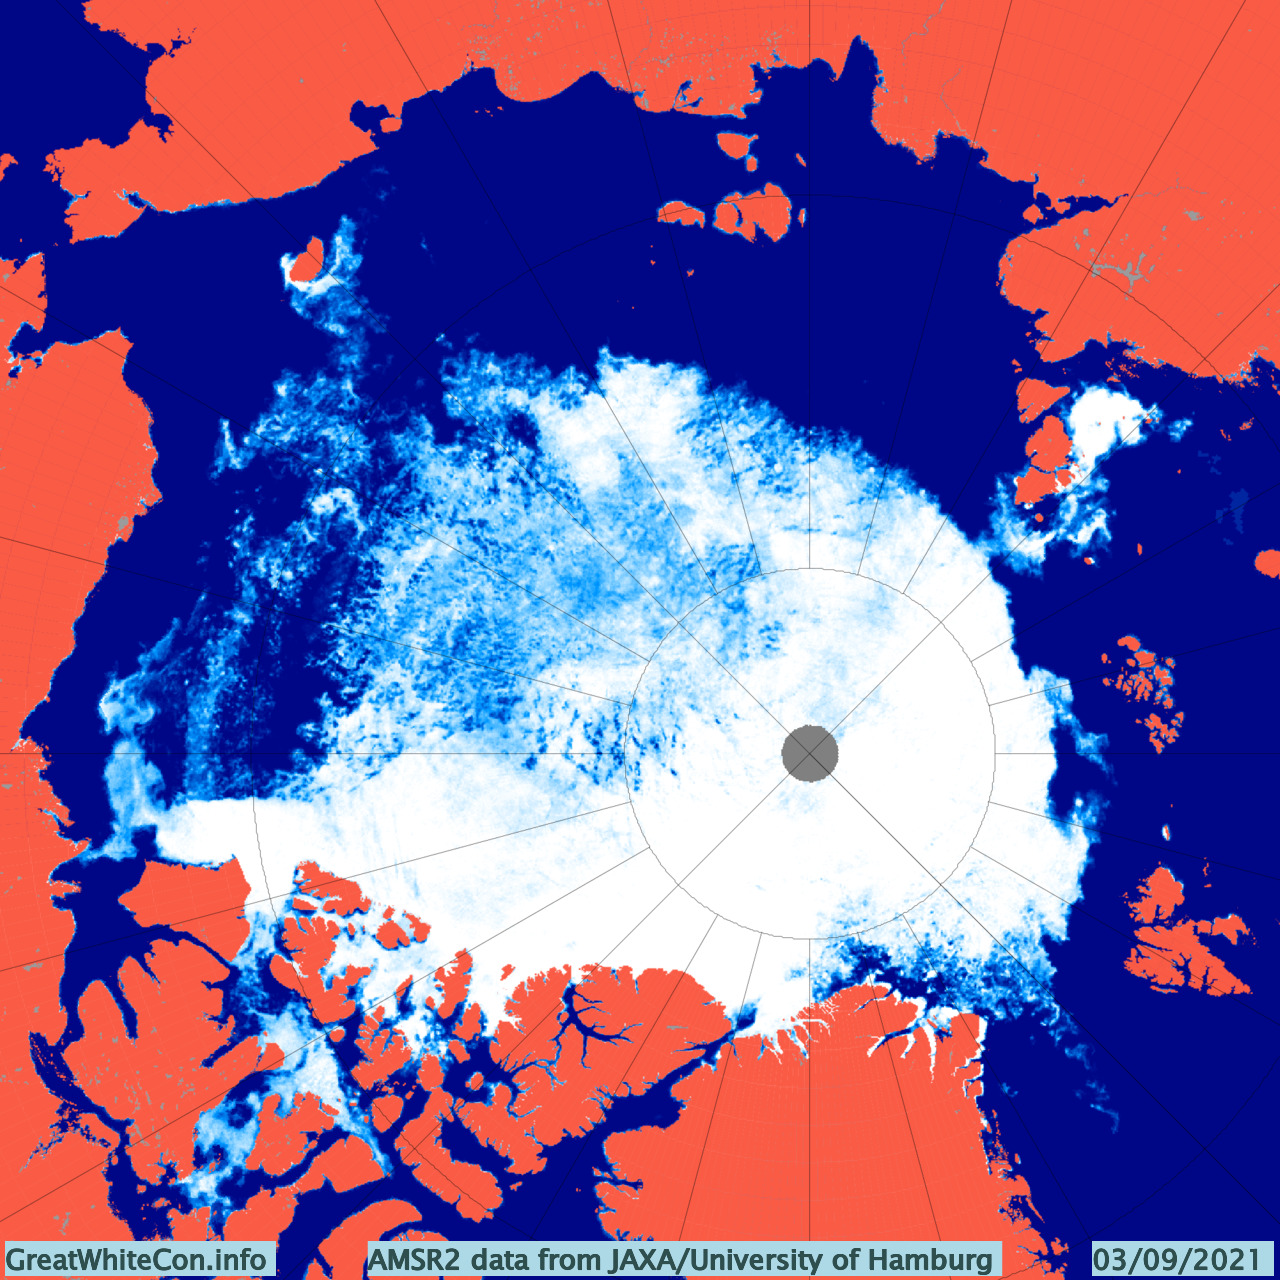
Next here’s the current AMSR2 concentration map:
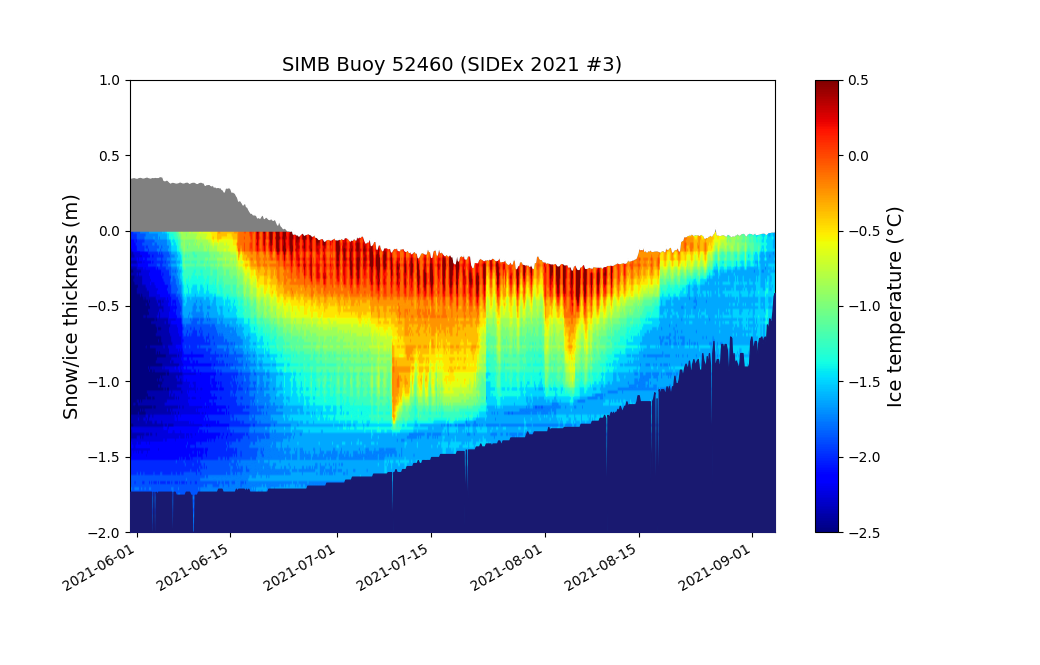
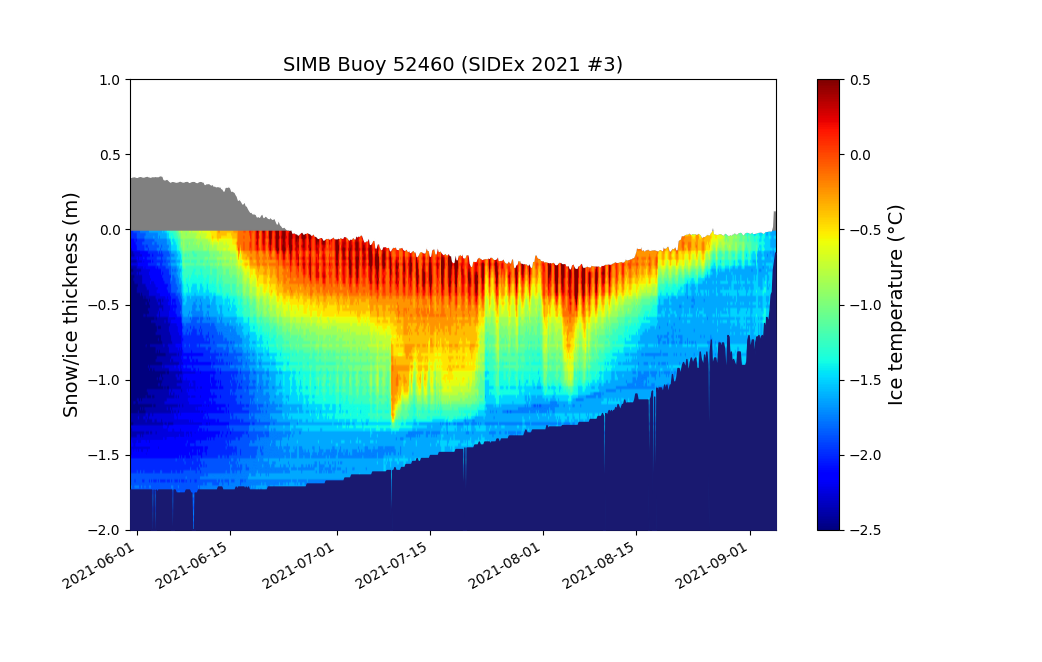
There is currently a large area of open water in the Wandel Sea to the north of Greenland. There is also an arm of old ice across the Beaufort and Chukchi Seas which is still clearly visible, but also visible is the recent reduction in sea ice concentration in the region. By way of explanation, here’s another look at the thickness of an ice floe currently situated to the north of the Chukchi at 74.84 N, 164.29 W, as measured by an ice mass balance buoy:
As the 2021 melting season draws towards its conclusion the floe is experiencing rapid bottom melt. How much longer will this floe and others like it last? Will it survive to become an “old ice” dot on next year’s ice age maps?
[Edit – September 6th]
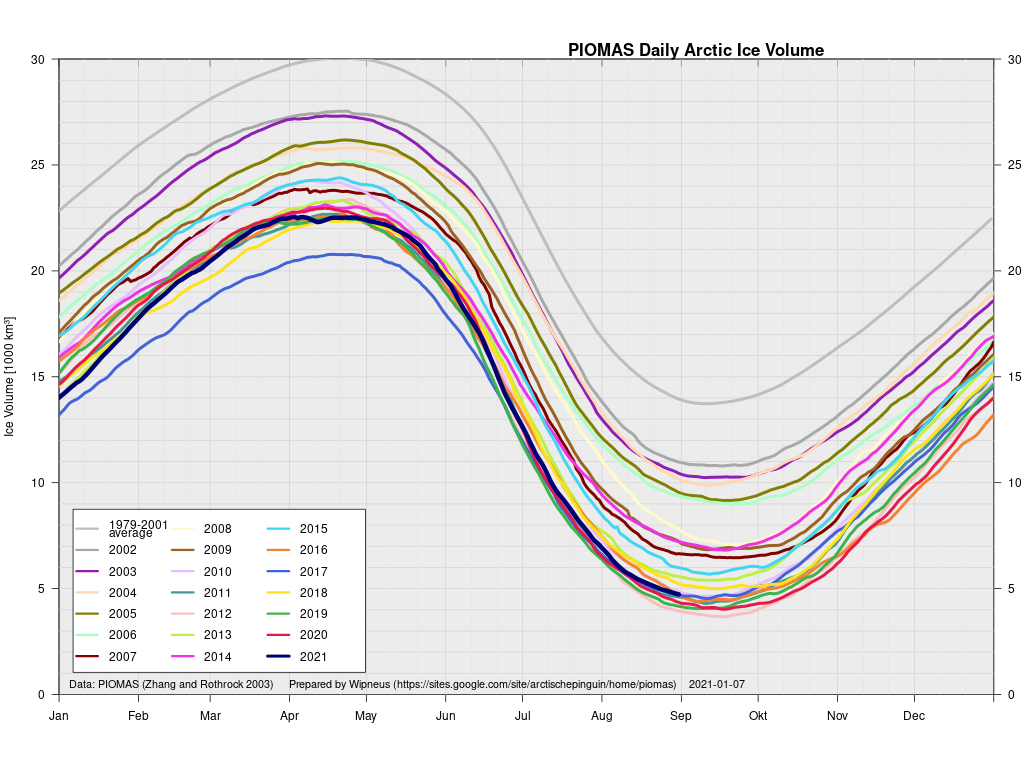
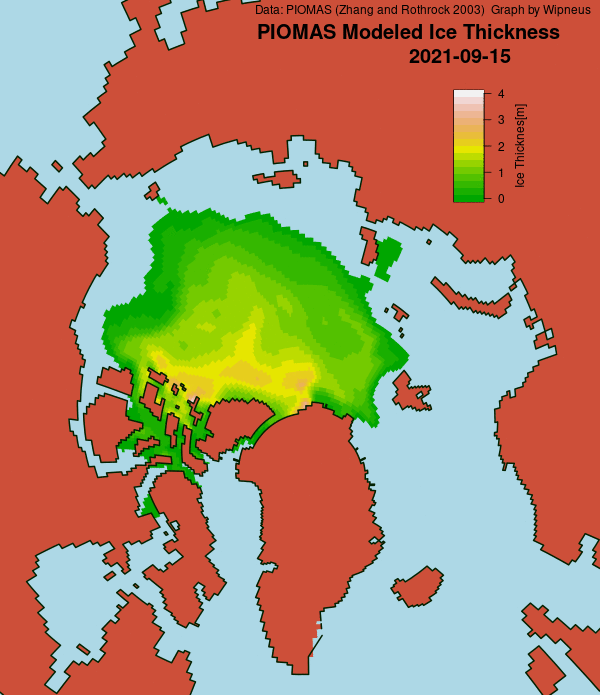
As Wipneus puts it on the Arctic Sea Ice Forum, “PIOMAS has updated the gridded thickness data up to the 31st of August”. Here’s the latest modelled thickness map, which shows the thickest remaining ice located north of the Canadian Arctic Archipelago rather than north of Greenland:
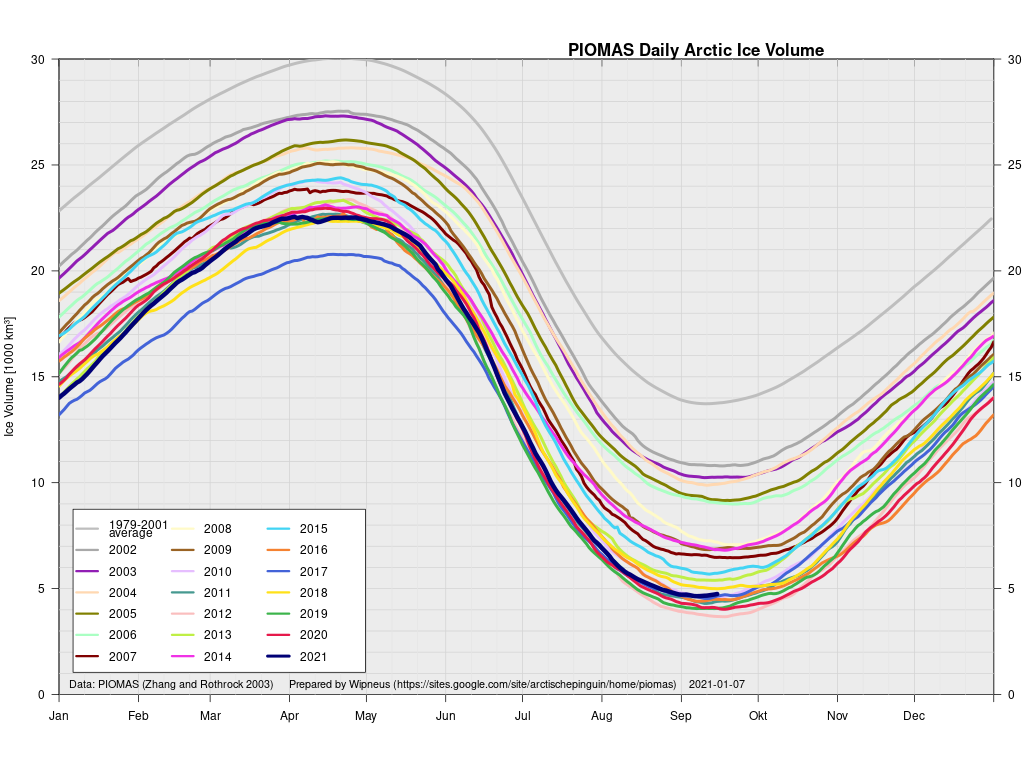
The accompanying volume graph shows 2021 in 7th lowest position, at 4.7 thousand km3:
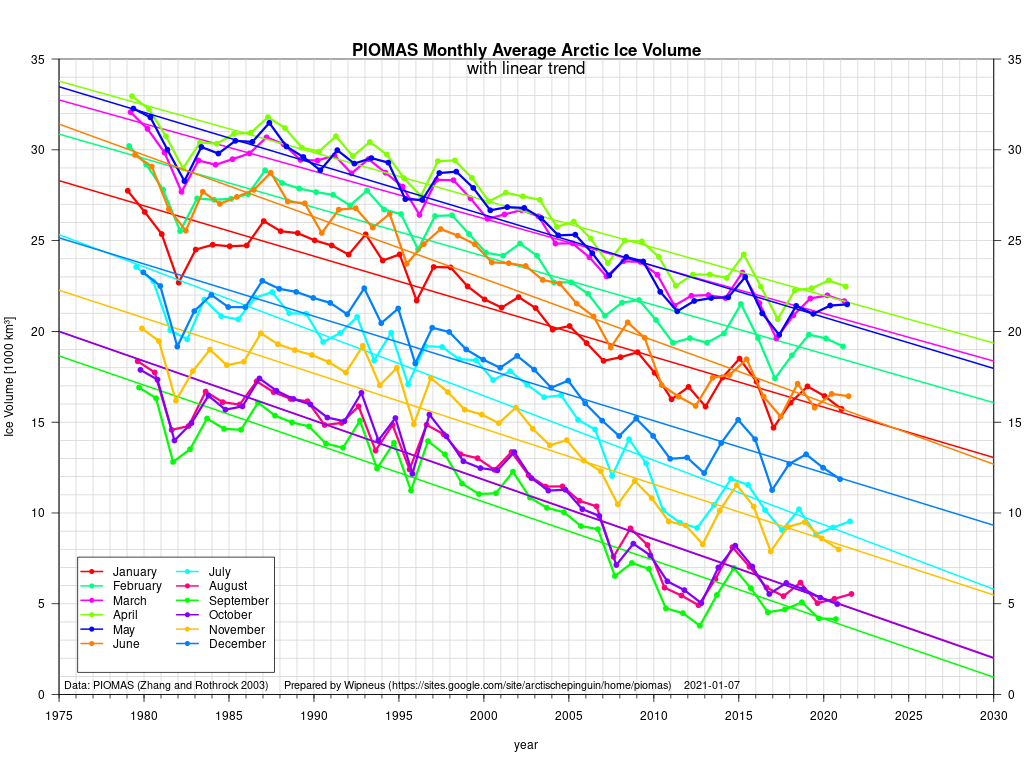
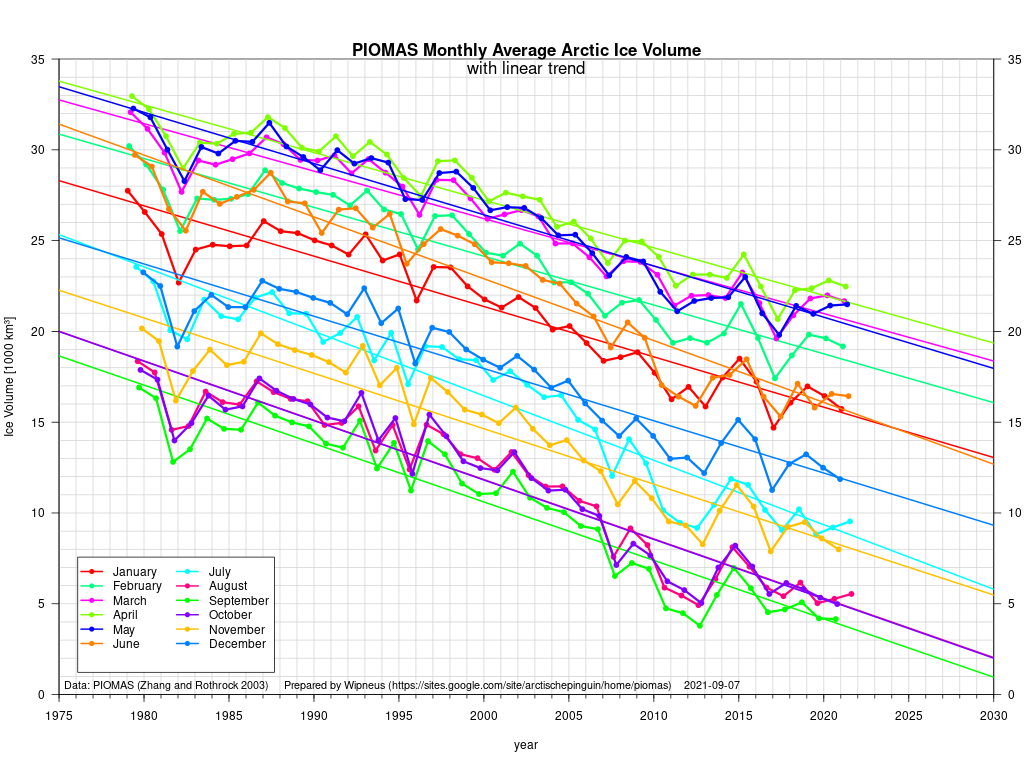
Here too are the current PIOMAS volume trends for each month of the year:
The Swedish icebreaker Oden has recently been exploring the area between northern Greenland and the North Pole as part of the Synoptic Arctic Survey expedition:
Here are the measurements of water temperature it has recorded over the past few days:
Ranging between -0.4 °C and -1.0 °C it doesn’t look as though the 2021 refreeze will be starting in the Wandel Sea just yet.
That shows plenty of old ice still left in the Beaufort Sea. However ice mass balance buoy 52460 now appears to floating free of its ice floe at 75.56 N, 165.99 W:
[Edit – September 14th]
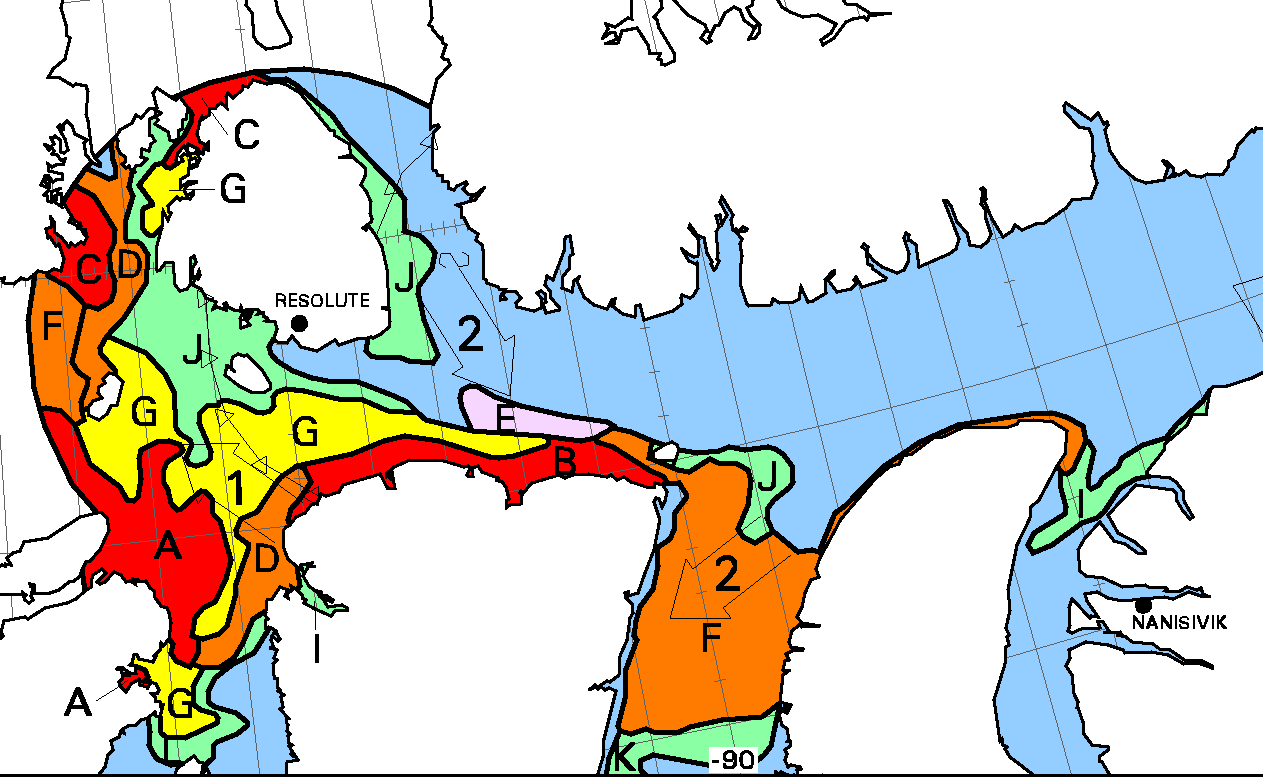
“New ice” has started to appear in previously open water on the Canadian Ice Service charts. See area E south east of Resolute:
Volume calculated from the thickness data currently show that 2021’s minimum was reached on September 7th at 4.64 thousand km3, which is the 8th lowest value in the Polar Science Center’s record.
[Edit – September 23rd]
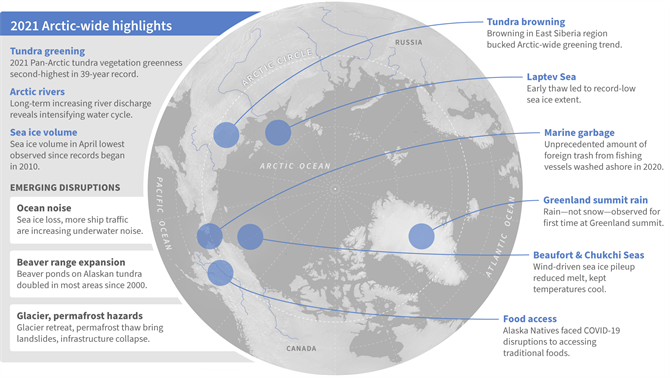
NASA have just announced a new paper about clouds in the Arctic. Highly relevant given their recent overview of the 2021 melting season!
Clouds are one of the biggest wildcards in predictions of how much and how fast the Arctic will continue to warm in the future. Depending on the time of the year and the changing environment in which they form and exist, clouds can both act to warm and cool the surface below them.
For decades, scientists have assumed that losses in Arctic sea ice cover allow for the formation of more clouds near the ocean’s surface. Now, new NASA research shows that by releasing heat and moisture through a large hole in sea ice known as a polynya, the exposed ocean fuels the formation of more clouds that trap heat in the atmosphere and hinder the refreezing of new sea ice.
The findings come from a study over a section of northern Baffin Bay between Greenland and Canada known as the North Water Polynya. The research is among the first to probe the interactions between the polynya and clouds with active sensors on satellites, which allowed scientists to analyze clouds vertically at lower and higher levels in the atmosphere.
The approach allowed scientists to more accurately spot how cloud formation changed near the ocean’s surface over the polynya and the surrounding sea ice.
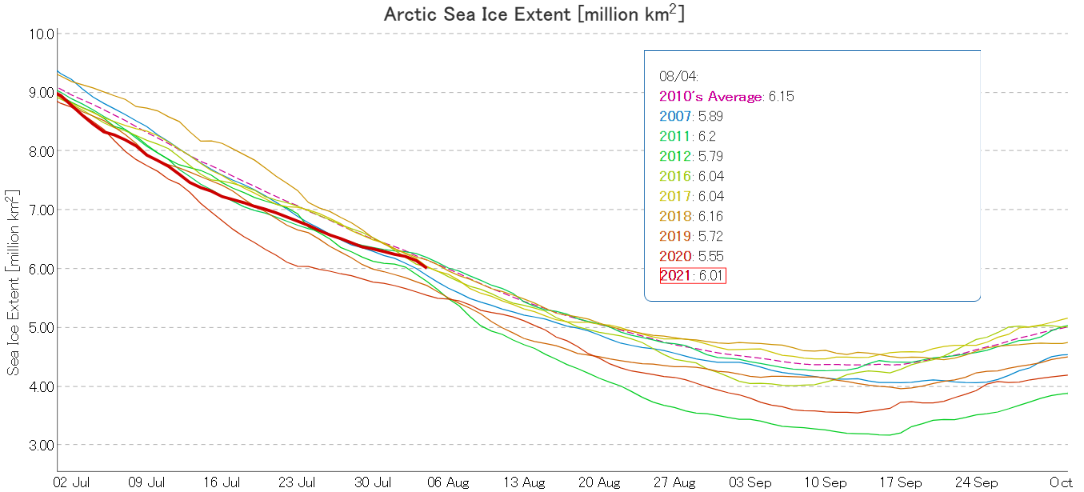
Let’s first of all take a look at JAXA’s flavour of Arctic sea ice extent:
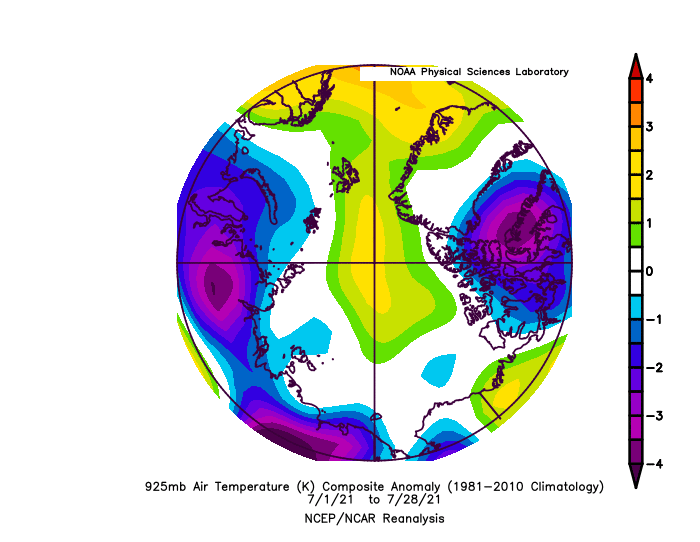
After reaching lowest extent for the date in early July, the weather in the Arctic Basin was stormy, cloudy and cool compared to other recent years until the last few days of the month:
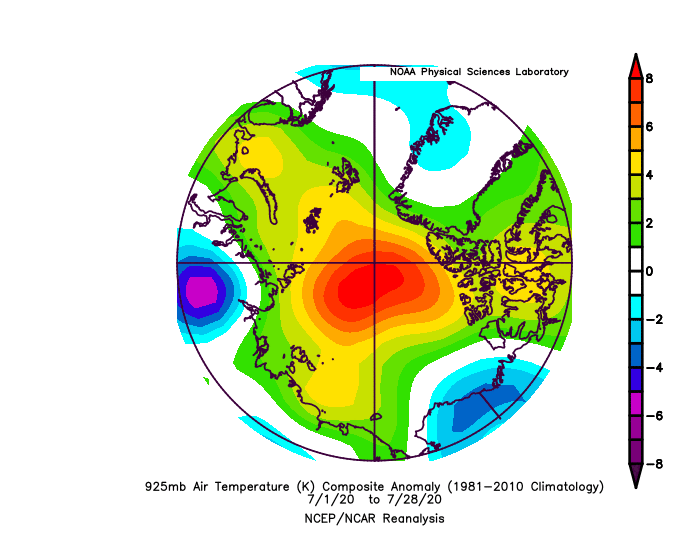
Here’s the same period in 2020 for comparison purposes:
Consequently the rate of extent loss in the second half of July was significantly less than last year.
Let’s begin the month with a “true colour” image from the Terra satellite of the Laptev Sea and thereabouts:
The blueish tinge indicates the appearance of melt ponds almost everywhere over the land-fast ice currently covering the majority of the Laptev Sea.
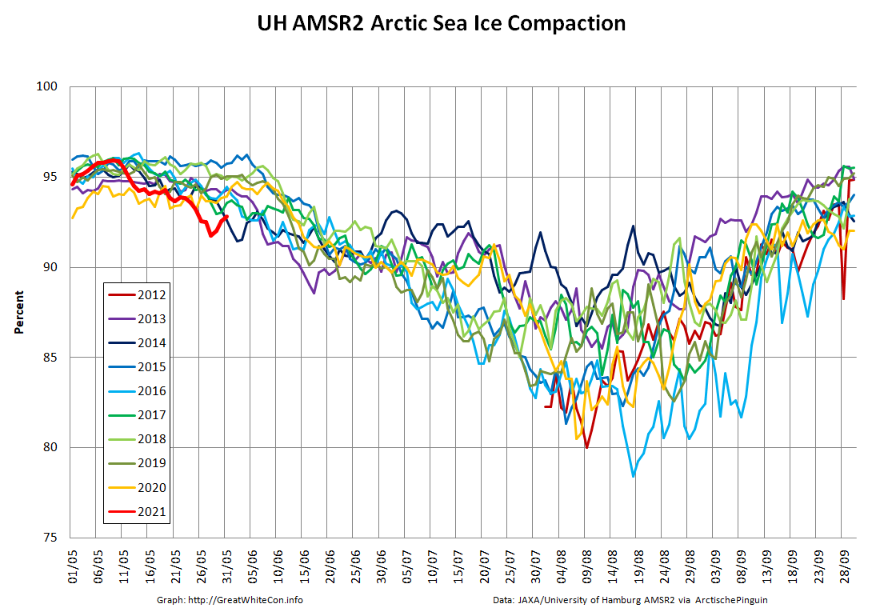
Let’s also take a look at the high resolution AMSR2 metrics for the end of May 2021:
Thanks to the recent “brief hiatus” in areal decline, Arctic wide compaction is no longer in record territory:
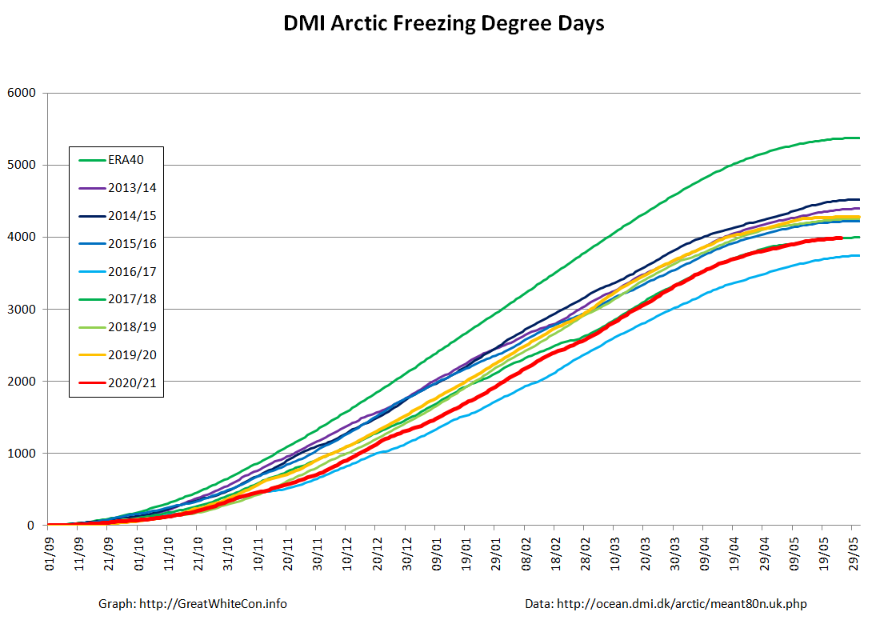
Finally, for the moment at least, here is the Danish Meteorological Institute’s high Arctic temperature data in the form of a graph of freezing degree days:
For some reason the data file still doesn’t include data to the end of May, but things won’t change much by then. Over the winter as a whole only 2016/17 was significantly warmer.
Let the 2021 Arctic sea ice summer melting season officially begin!
[Edit – June 4th]
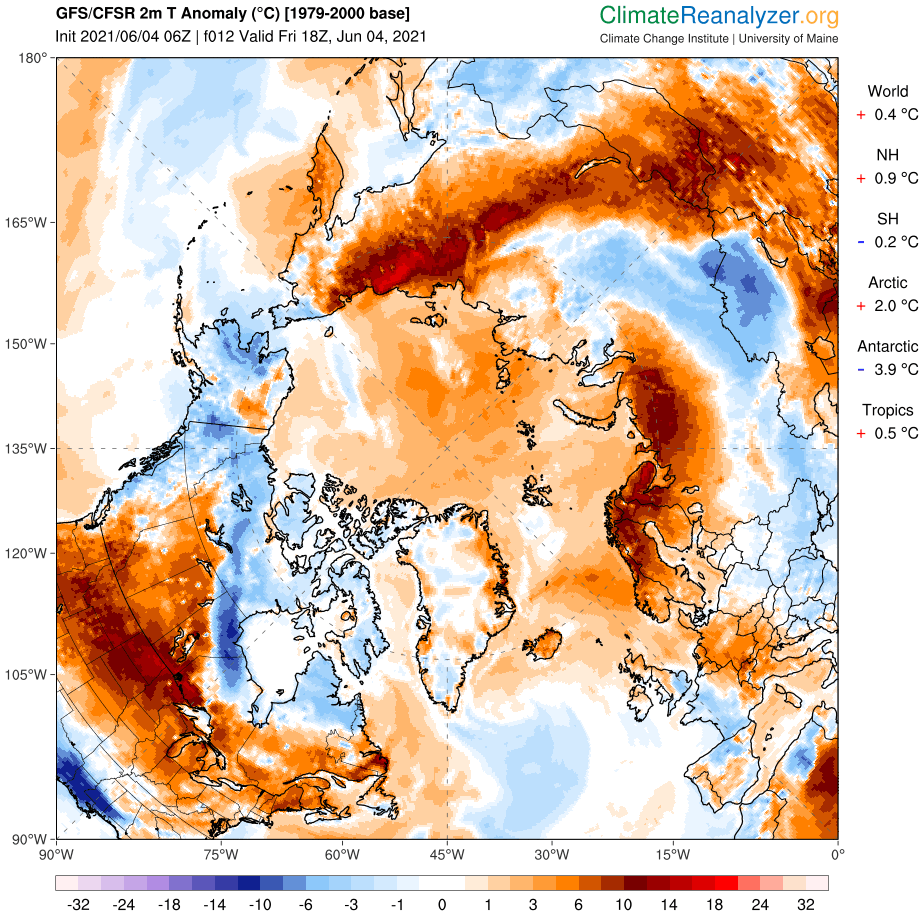
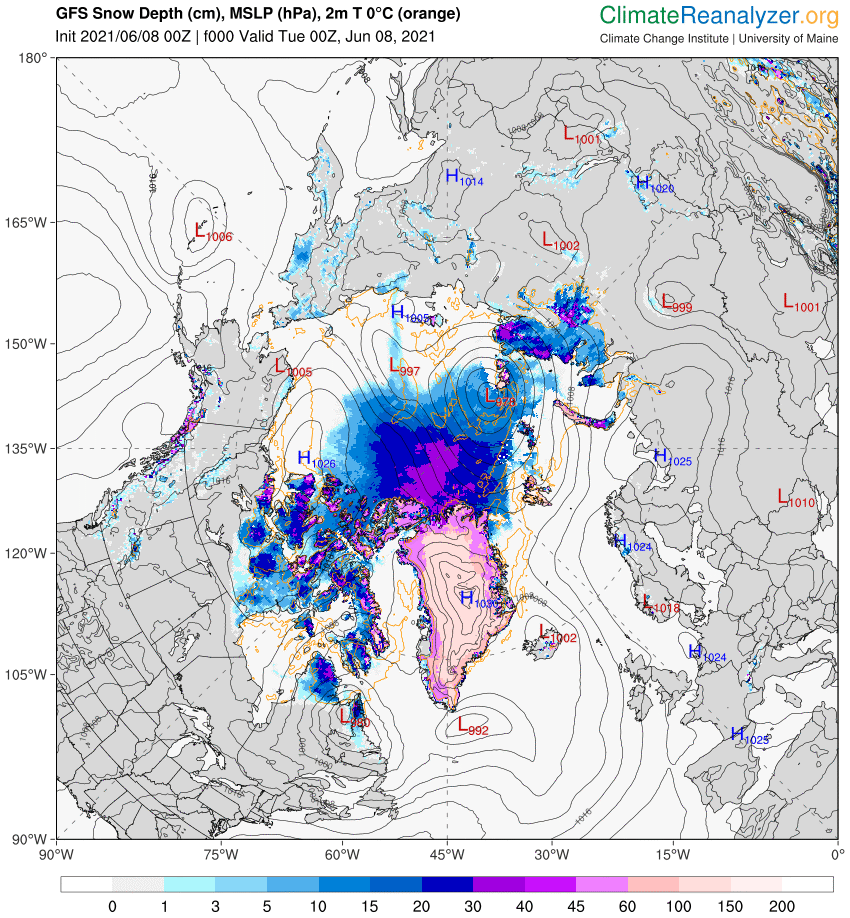
Perhaps unsurprisingly the GFS forecast from four days ago hasn’t quite worked out as predicted. The Arctic as a whole is certainly on the warm side, with a +2 C anomaly at this moment:
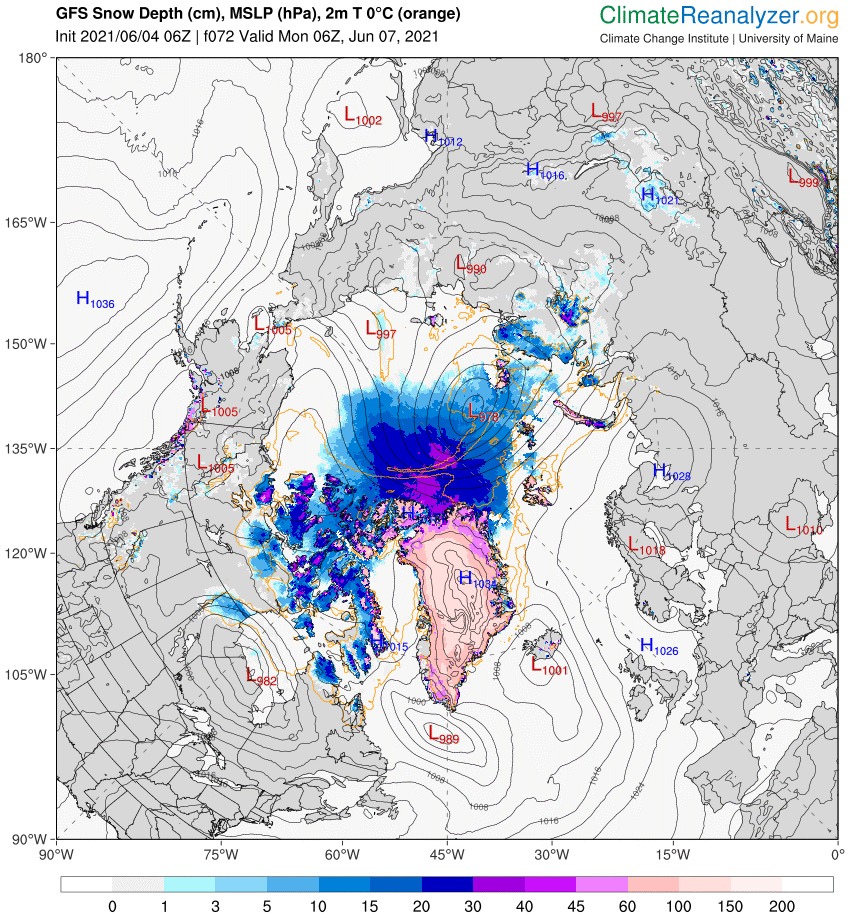
However the 966 hPa MSLP cyclone predicted for Monday is now forecast to be a mere 978 hPa:
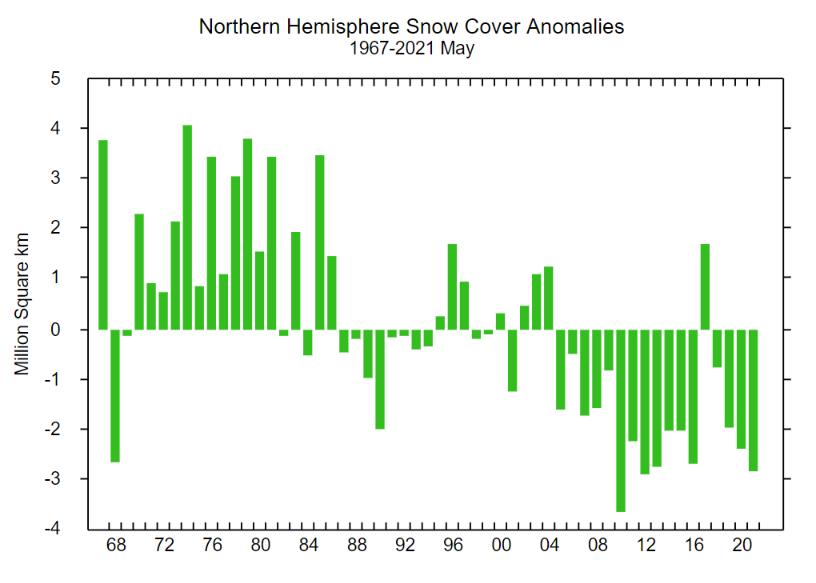
With 3 days to go there is a reasonable chance of it verifying in the “New Arctic” of 2021. As you can see from the map above a large area of the Central Arctic has now lost its snow cover. This is confirmed by the Rutgers Snow Lab northern hemisphere data for May:
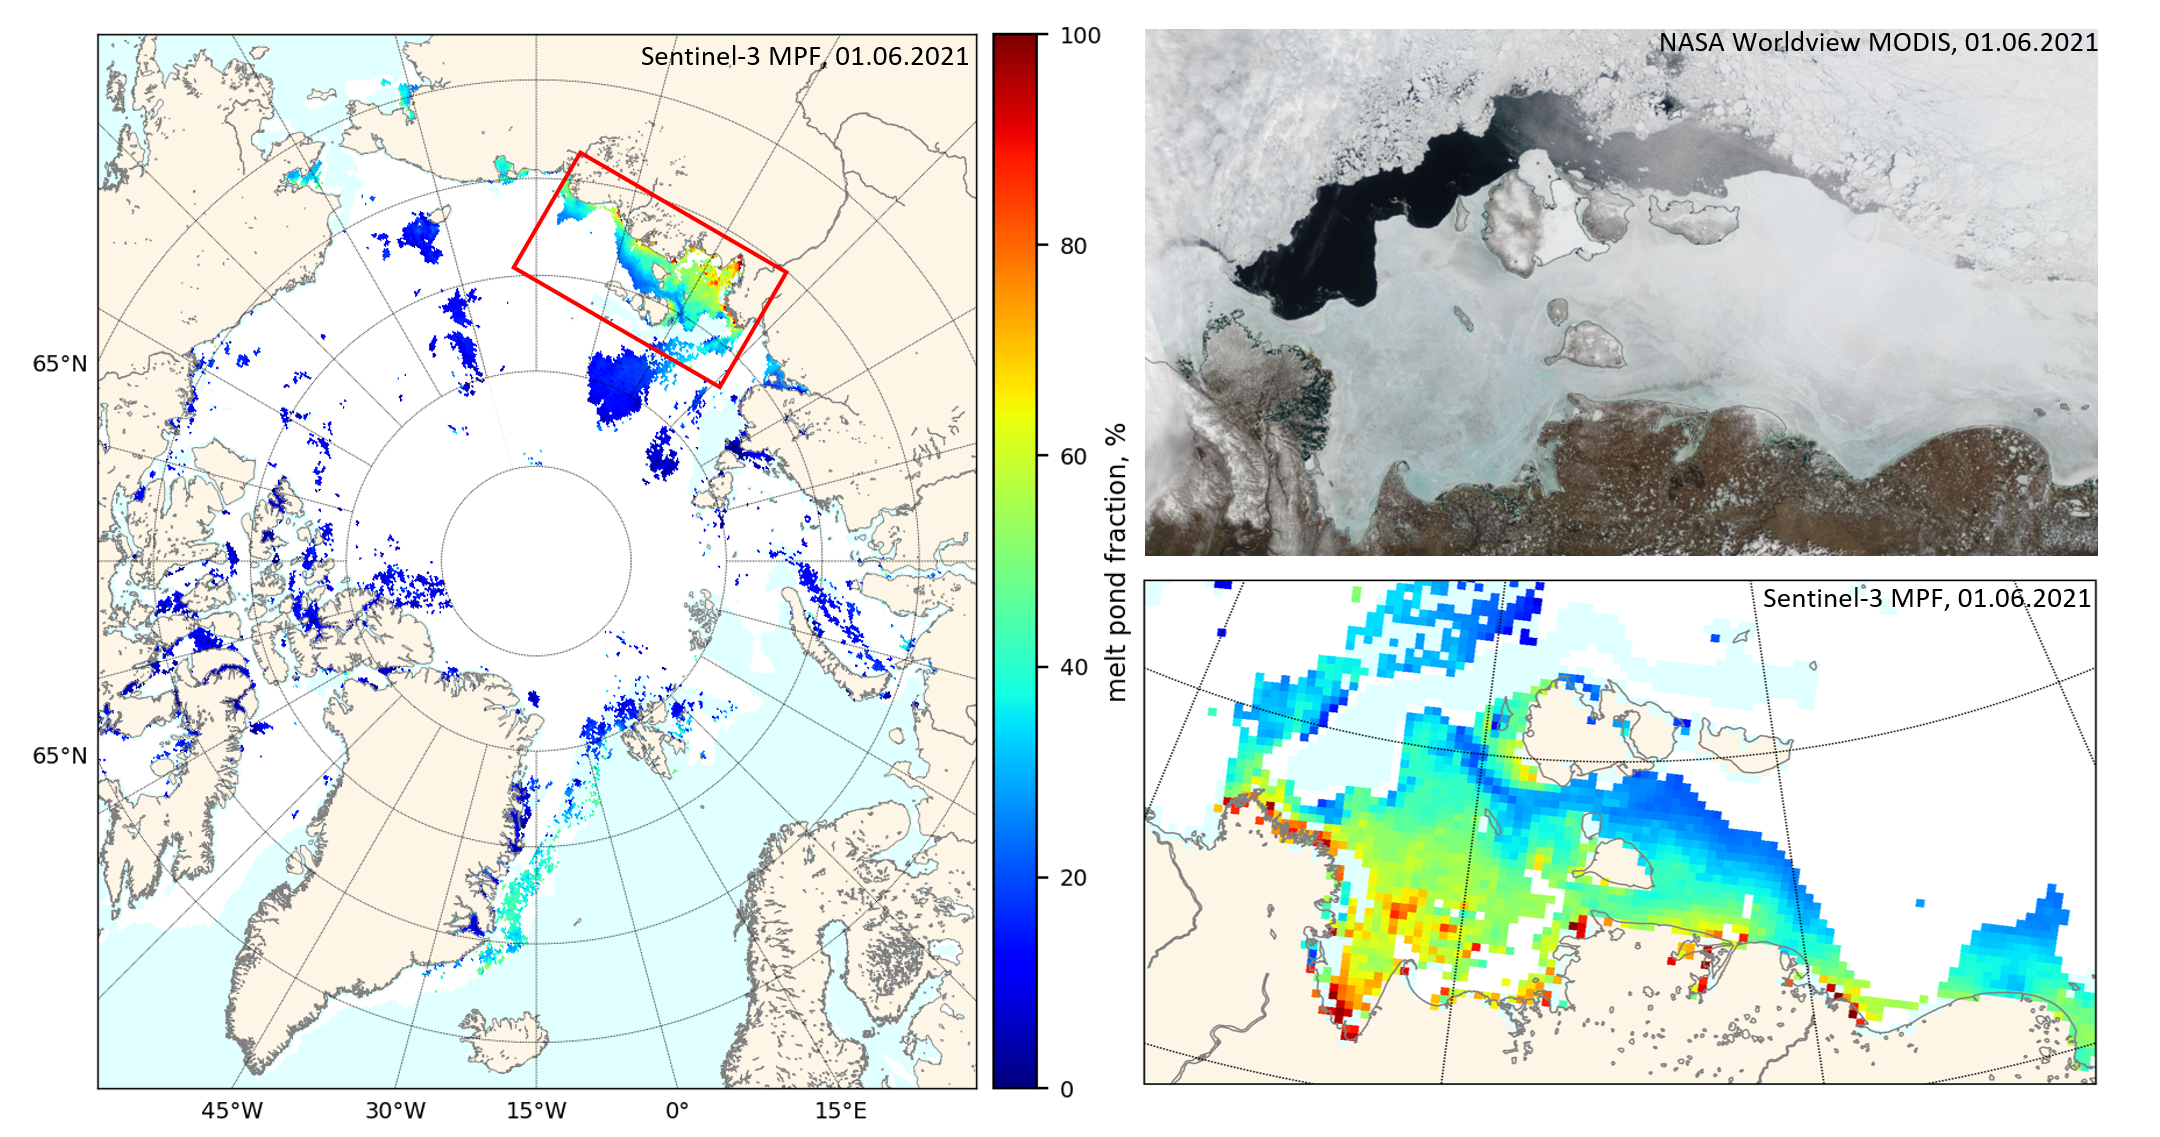
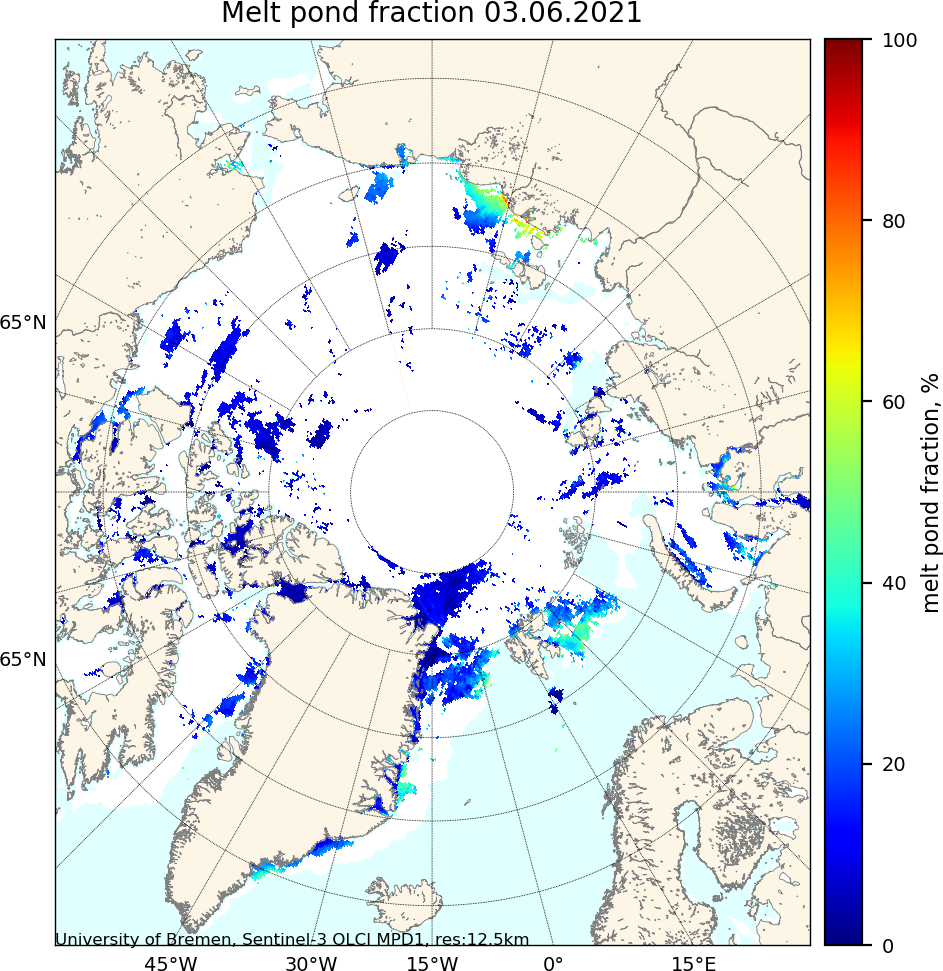
A new Sentinel 3 melt pond fraction product from the University of Bremen confirms that on the fast ice in the Laptev & East Siberian Seas snow cover has departed and melt ponds have arrived:
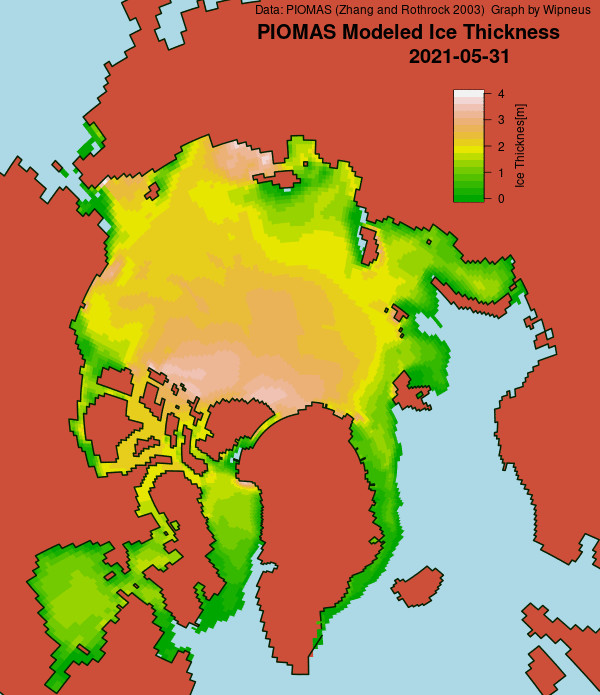
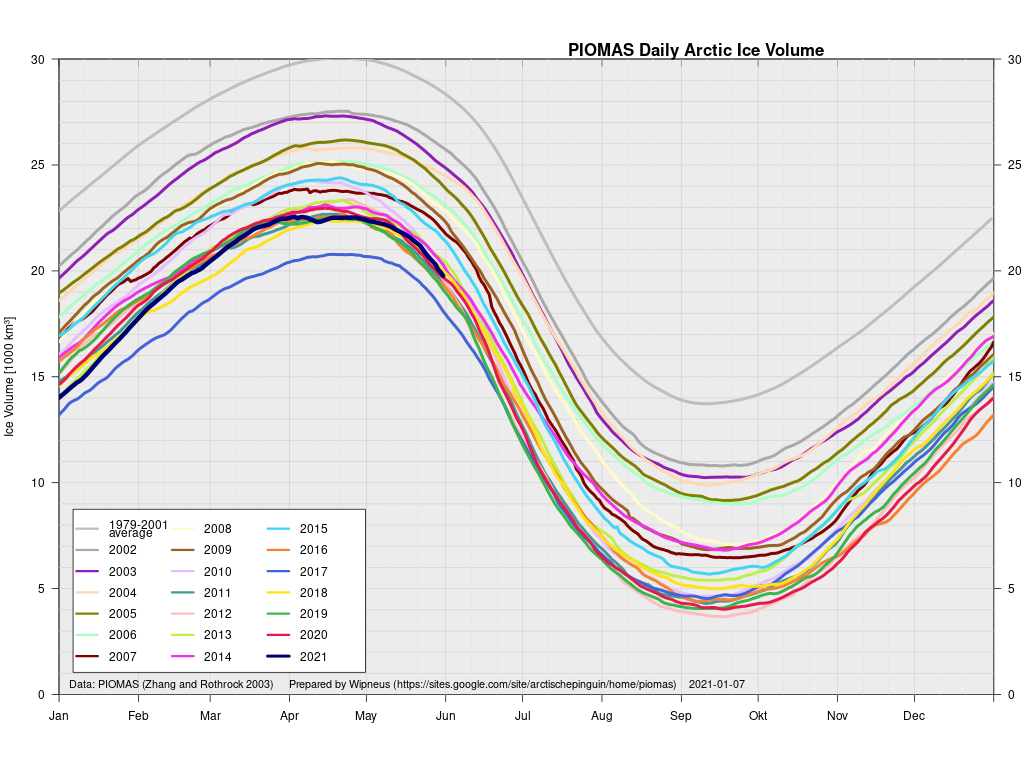
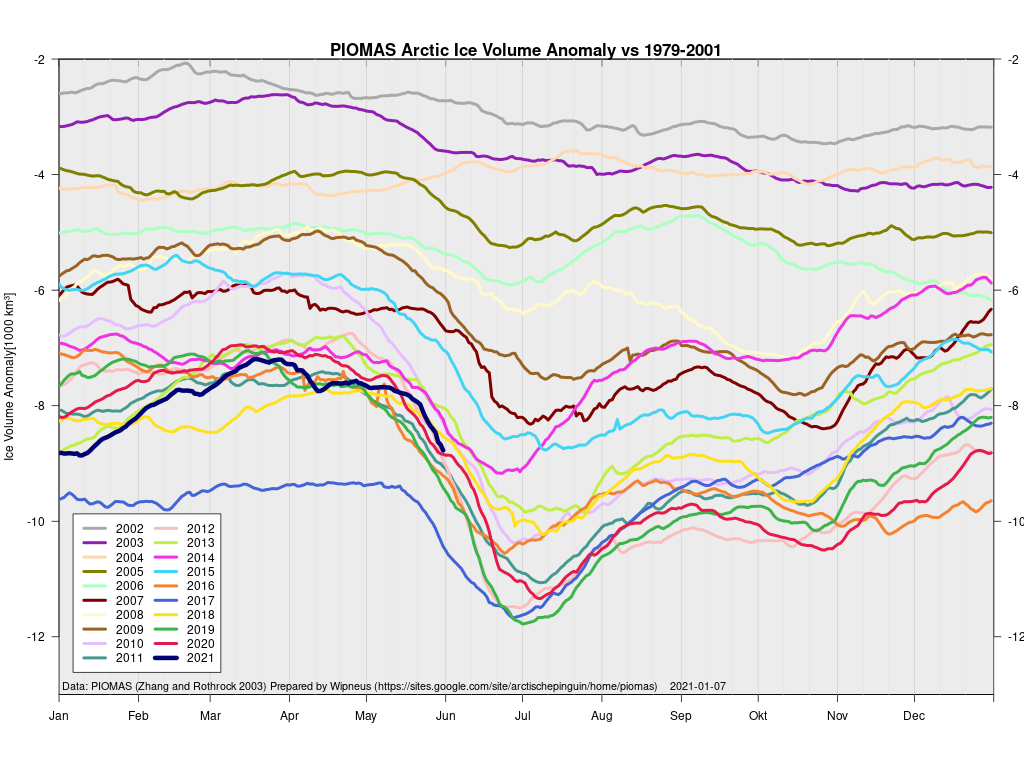
In other news Wipneus has released the latest PIOMAS gridded thickness and volume data on the Arctic Sea Ice Forum:
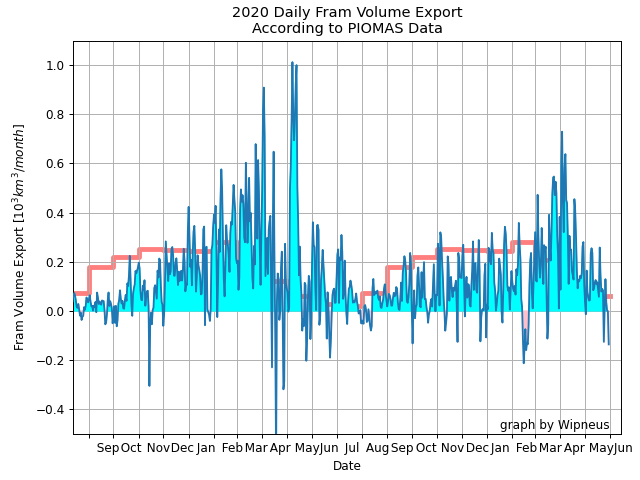
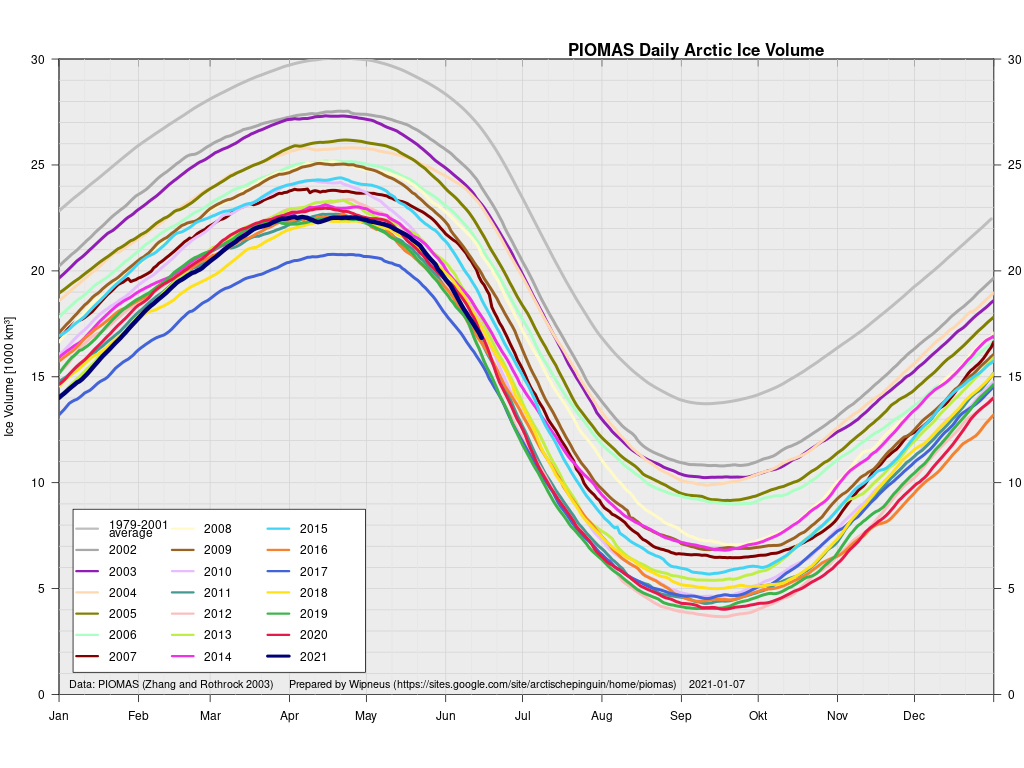
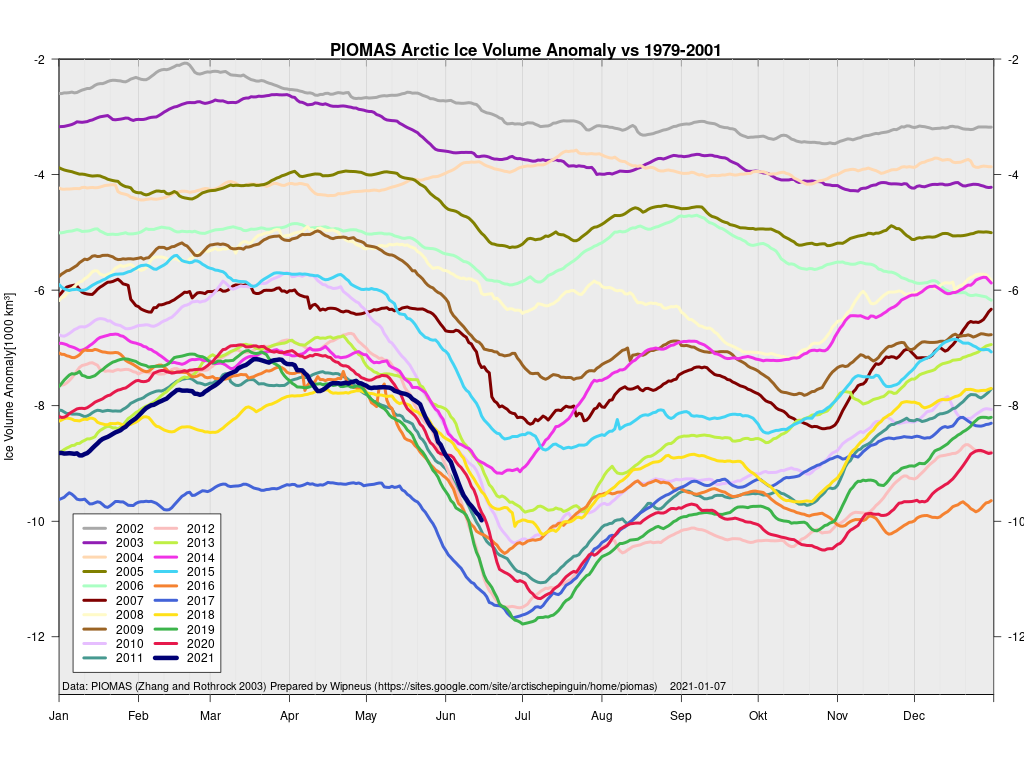
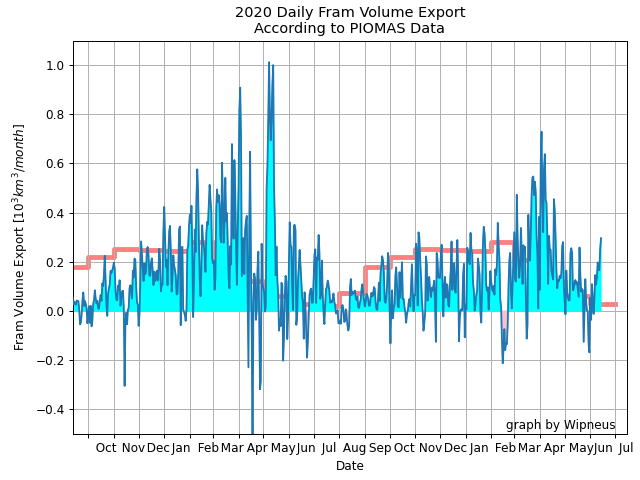
For some strange reason 2021 volume at the end of May is almost identical to 2012 and 2020! Plus of course there’s the modelled volume export from the Central Arctic via the Fram Strait:
[Edit – June 6th]
This “false colour” image reveals that there’s virtually no snow cover left on land, and this “false colour” image reveals that the land-fast ice in the East Siberian Sea is now awash with melt ponds:
[Edit – June 8th]
The forecast low pressure area appears to have bottomed out near the Severnaya Zemlya islands with a 978 hPa MSLP:
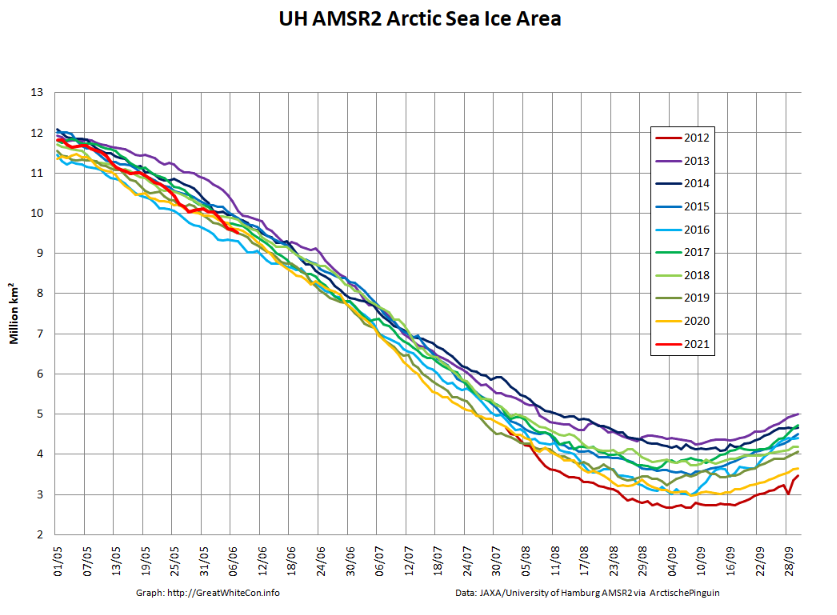
High resolution AMSR2 Arctic sea ice area is now 2nd lowest for the date after 2016:
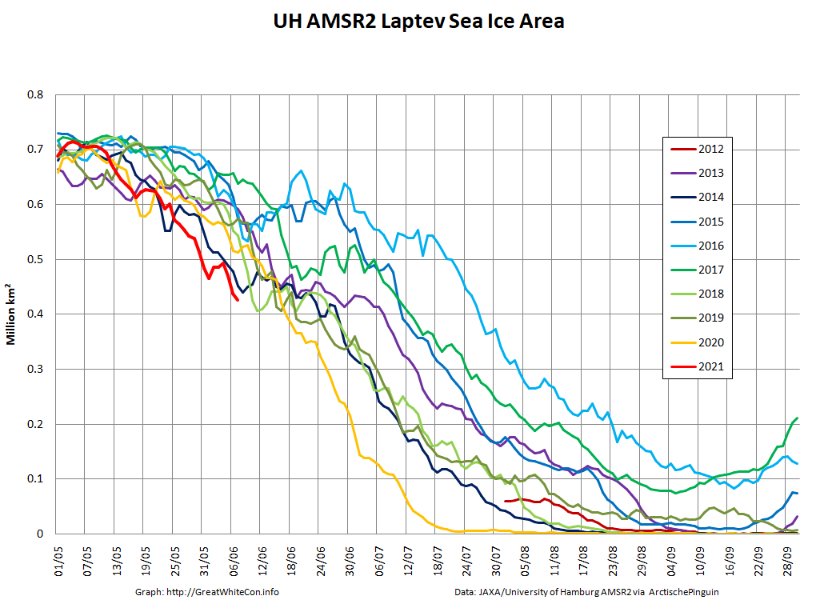
Laptev sea ice area is still lowest for the data, and looks as though it will retain that position for a while:
[Edit – June 9th]
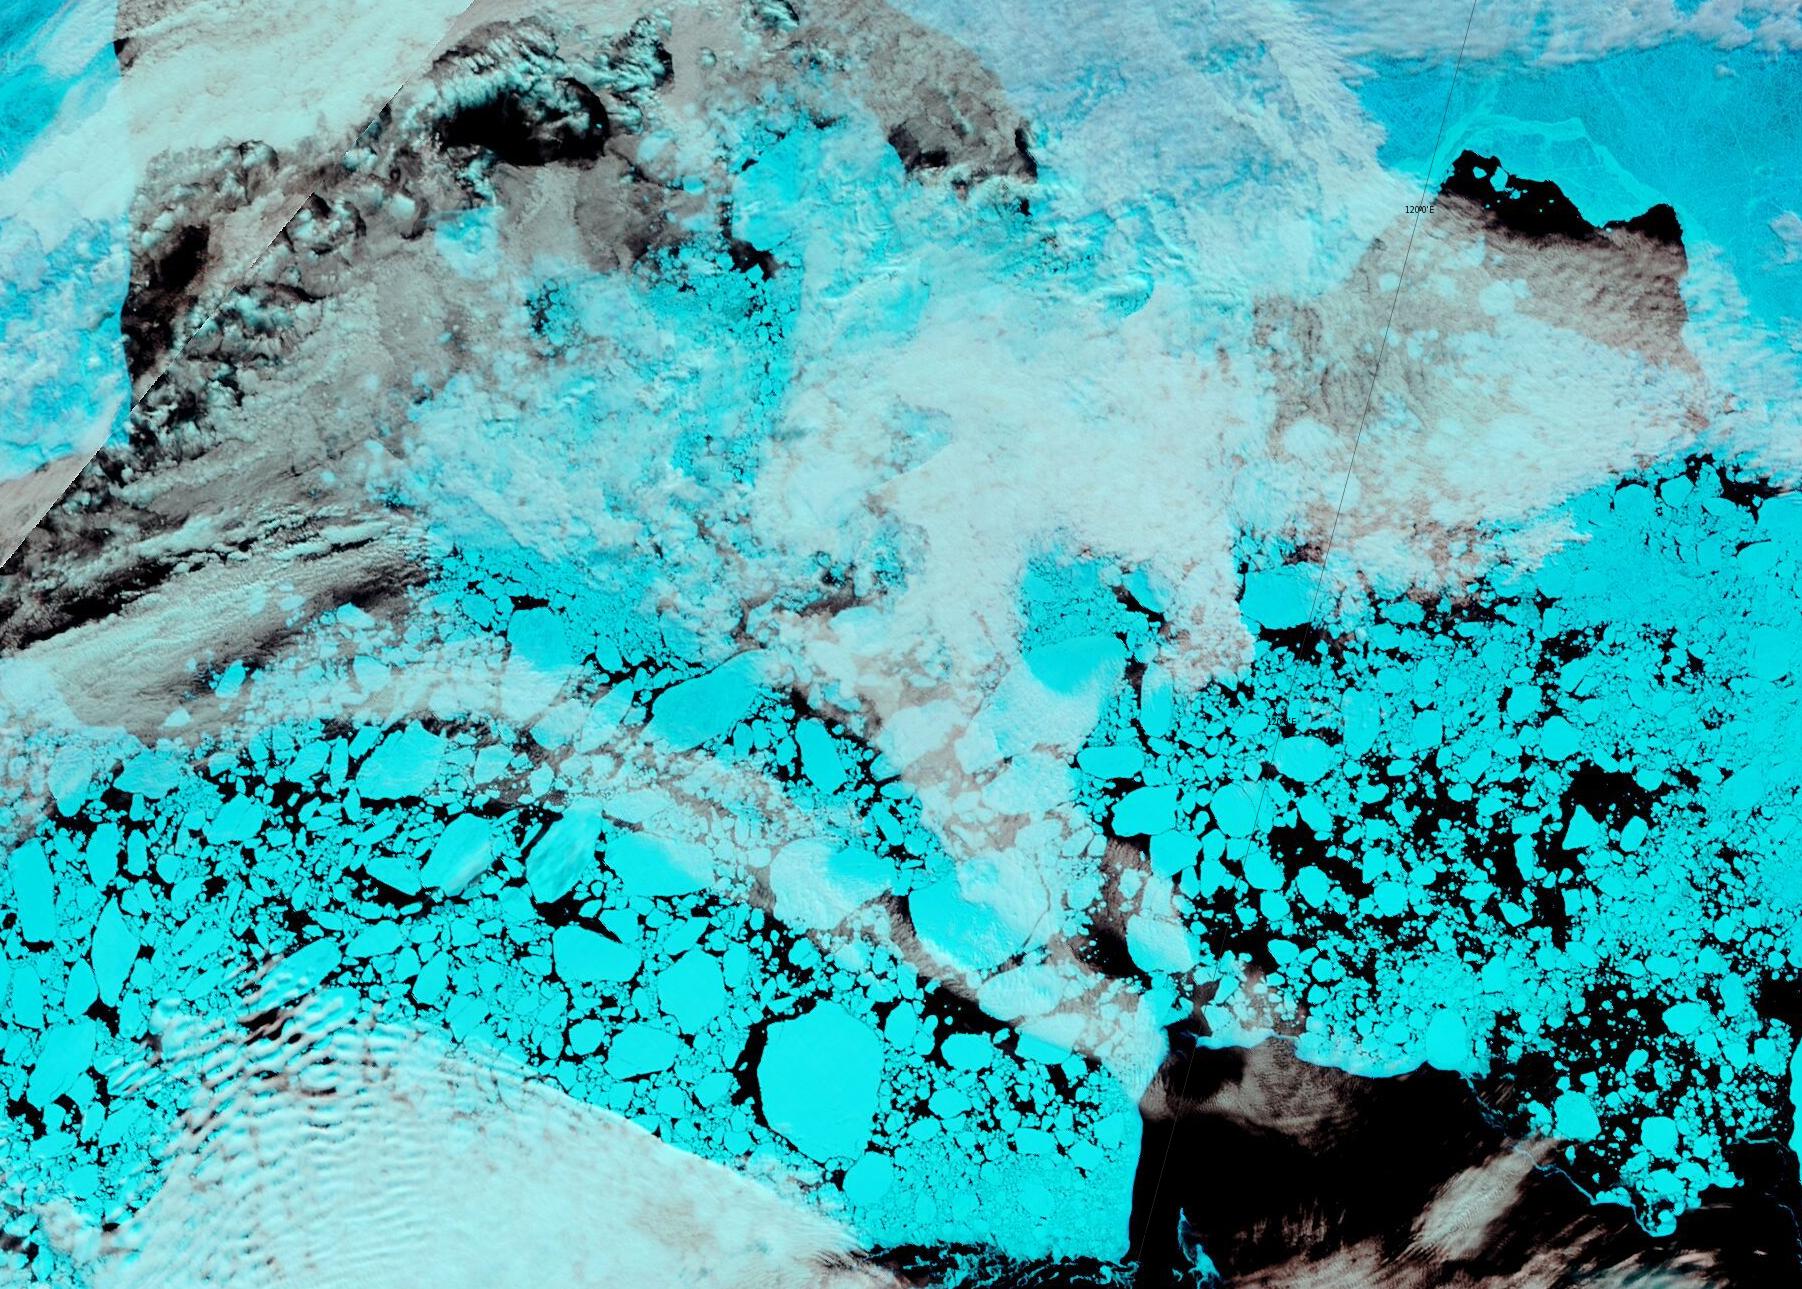
The effect of the recent heat and wind on the remaining sea ice in the Laptev Sea is now all too apparent:
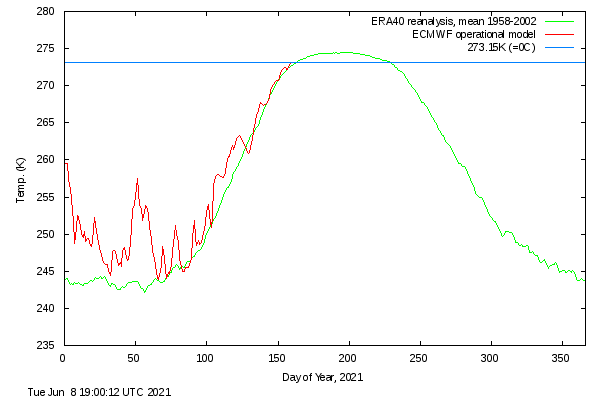
It’s also evident in the DMI >80N temperature graph, which has now reached sea ice “melting point” ahead of the climatology:
Note that the blue line is actually above the “freezing point” of salty Arctic sea water.
[Edit – June 13th]
Fairly clear skies over the Laptev Sea and the western East Siberian Sea, revealing wall to wall melt ponds and the land-fast ice starting to break up near the coast as well as on the edge of the now open ocean:
Plus yesterday’s view of the Beaufort Sea, revealing fast ice breaking up in the western entrance to the McClure Strait:
[Edit – June 18th]
A clearish view of the Laptev Sea today, revealing assorted cracks in a variety of locations:
[Edit – June 20th]
The latest mid-month PIOMAS thickness/volume numbers have been released:
[Edit – June 23rd]
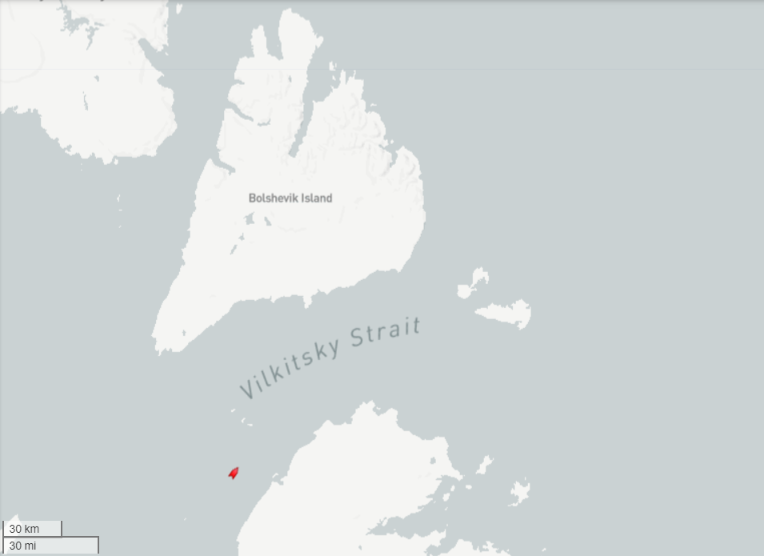
The skies over the Vilkitsky Strait have been cloudy for a few days. However a fairly clear view yesterday reveals that breakup is well under way in what is usually one the last areas along the Northern Sea Route to become navigable:
[Edit – June 26th]
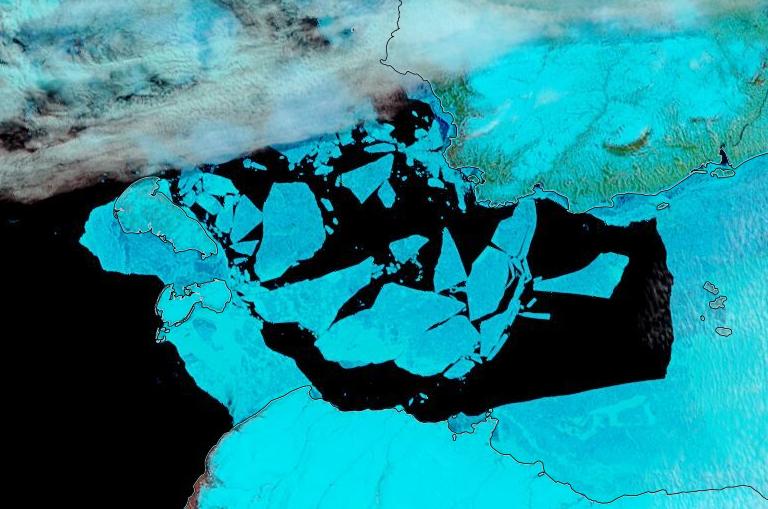
The land-fast ice in the East Siberian Sea has started to disintegrate en masse:
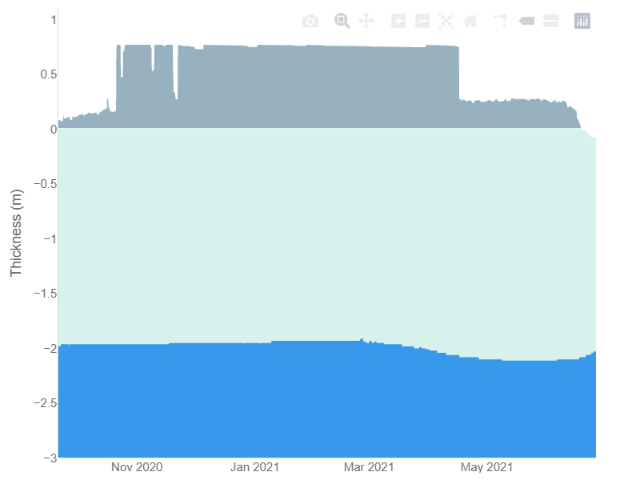
Data from ice mass balance buoy 441910, currently located at 76.1 N, 151.1 W in the Beaufort Sea, reveals the onset of both surface and bottom melt:
Watch this space!
This website uses cookies to improve your experience. We'll assume you're ok with this, but you can opt-out if you wish. Cookie settingsACCEPT
Privacy & Cookies Policy
Privacy Overview
This website uses cookies to improve your experience while you navigate through the website. Out of these, the cookies that are categorized as necessary are stored on your browser as they are essential for the working of basic functionalities of the website. We also use third-party cookies that help us analyze and understand how you use this website. These cookies will be stored in your browser only with your consent. You also have the option to opt-out of these cookies. But opting out of some of these cookies may affect your browsing experience.
Necessary cookies are absolutely essential for the website to function properly. This category only includes cookies that ensures basic functionalities and security features of the website. These cookies do not store any personal information.
Any cookies that may not be particularly necessary for the website to function and is used specifically to collect user personal data via analytics, ads, other embedded contents are termed as non-necessary cookies. It is mandatory to procure user consent prior to running these cookies on your website.