By way of a change we start this month’s look at all things Arctic with some sea ice statistical analysis. Anthony Watts’ Arctic porky pie production line has been speeding up recently, and I am not the only one who has noticed. As part of his takedown of the latest “skeptical” allegations against the United Kingdom Met Office Tamino has been looking at trends in Arctic sea ice extent over at his “Open Mind” blog:
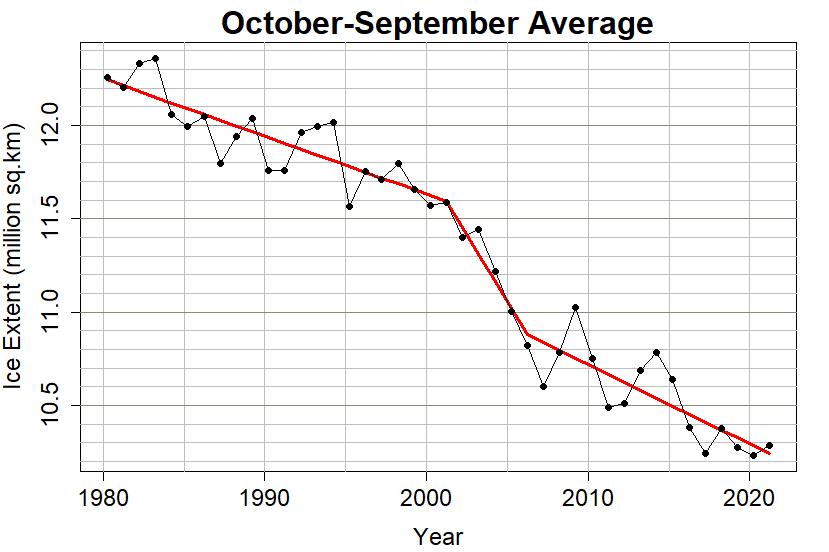
First and foremost, the yearly minimum is only one day out of the year. We have sea ice extent data throughout the year, and what happens during the rest of the year counts. Instead of using the annual minimum, let’s use the annual average. To avoid losing the most recent data, I’ll compute the yearly average for October through the following September rather than the usual (but arbitrary) January through December. I’ll also omit October 1978 through September 1979 because that year is incomplete. I get this:

The annual averages show much less fluctuation than the annual minima, so we can estimate things like rates of change with greater precision. I find that there is statistical evidence that the rate changed over time. One model of such changes uses three straight-line segments with their changes chosen to best-fit the data, like this:
Much more detail can be found over at Open Mind, but as I pointed out in the comments:
[Edit – October 5th]There is indeed some research… [into a factor that might have caused the ice to stabilize since 2007]. By way of example, we have been discussing “The Slow Transition” over on the Arctic Sea Ice Forum since 2014. If you want to dig deeper then please see this 2011 paper by Armour et. al.:
“Controls on Arctic Sea Ice from First-Year and Multiyear Ice Survivability”
“We can expect the thicker MY ice to thin at a greater rate than the thinner FY ice.”
The NSIDC have now published their post minimum episode of Arctic Sea Ice News:
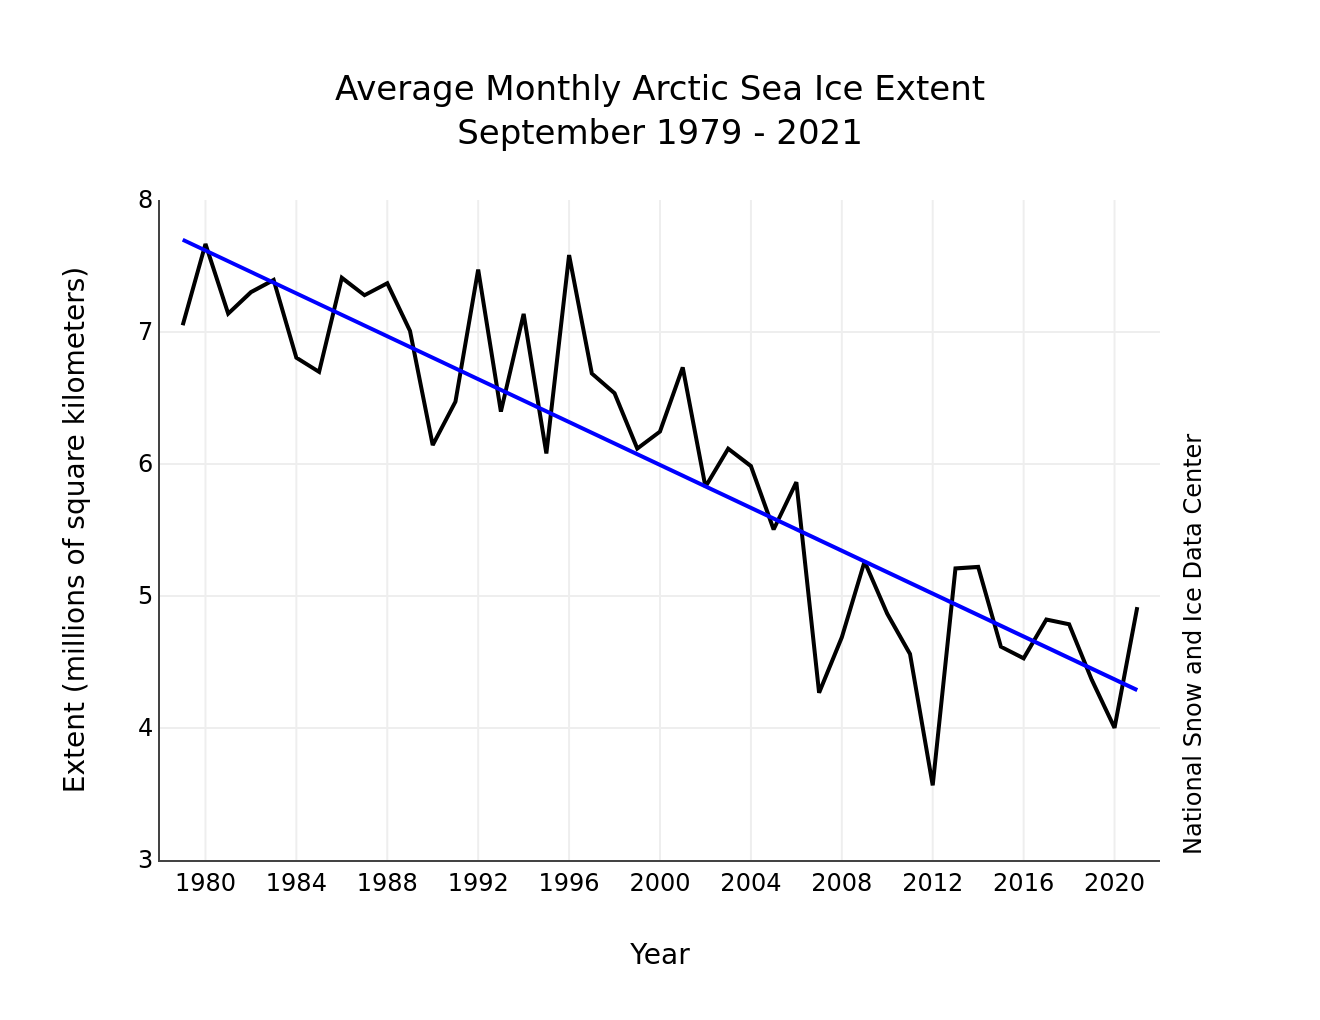
The summer melt season has come to a modest end. The summer of 2021 was relatively cool compared to the most recent years and September extent was the highest since 2014. It was nevertheless an eventful summer, with many twists and turns.
Arctic sea ice extent for September averaged 4.92 million square kilometers (1.90 million square miles), the twelfth lowest in the 43-year satellite record. This is 1.35 million square kilometers (521,000 square miles) above the record low set in September 2012, and 1.49 million square kilometers (575,000 square miles) below the 1981 to 2010 average. The last 15 years (2007 to 2021) have had the 15 lowest September extents in the record.
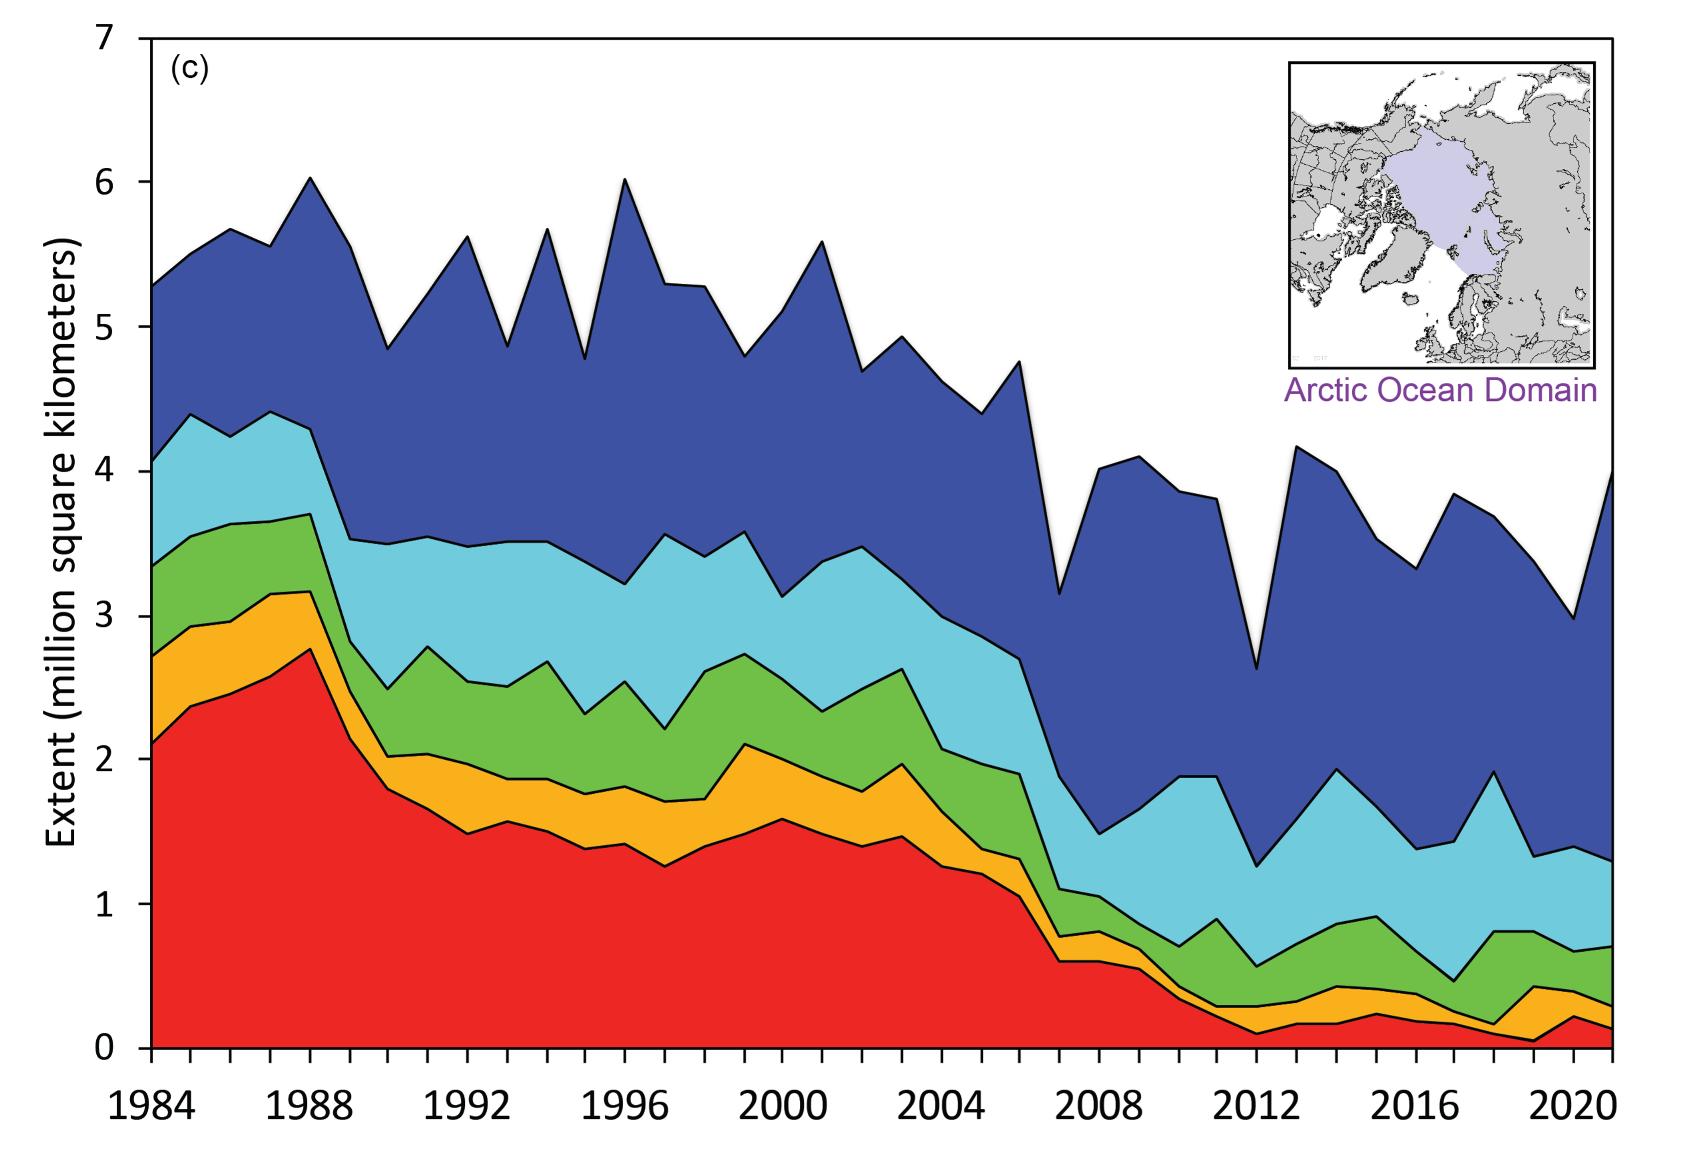
Amongst numerous other things the NSIDC point out that:
Despite September total ice extent being high compared to recent years, the amount of multiyear ice as assessed from ice age reached a near-record low, with an extent of only 1.29 million square kilometers (498,000 square miles), just slightly above the value of 1.27 million square kilometers (490,000 square miles) at the end of the 2012 melt season.
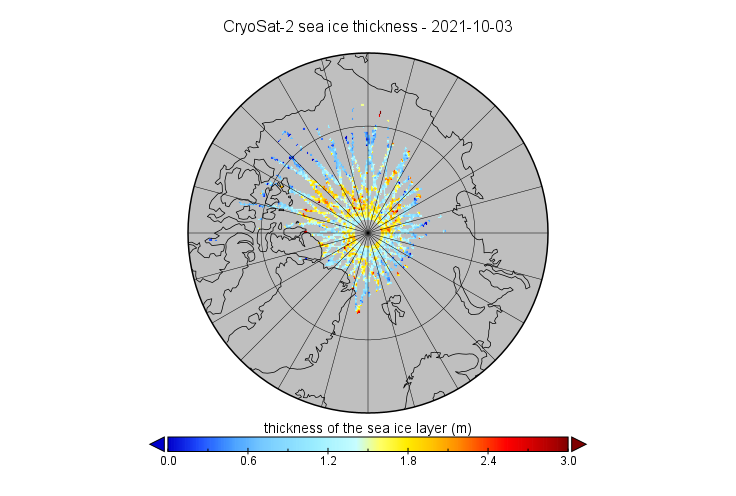
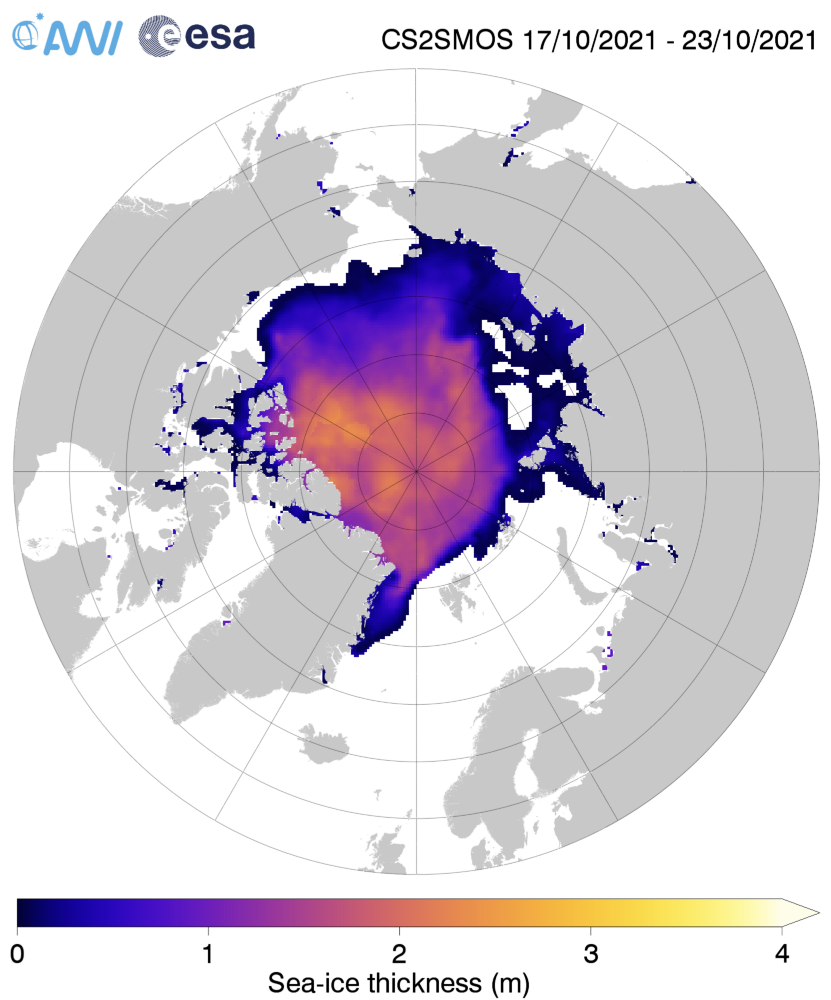
Here are the first results this Autumn from AWI’s flavour of CryoSat-2 Arctic sea ice thickness data. Note that the thickness palette is compressed further than is usual in our winter and spring updates:
An AMSR2 animation of the sea ice cover along the Northern Sea Route this summer. The “choke point” at the Vilkitsky Strait has “closed” much earlier than last year:
Here’s the current AARI sea ice chart for the area, dated October 8th:

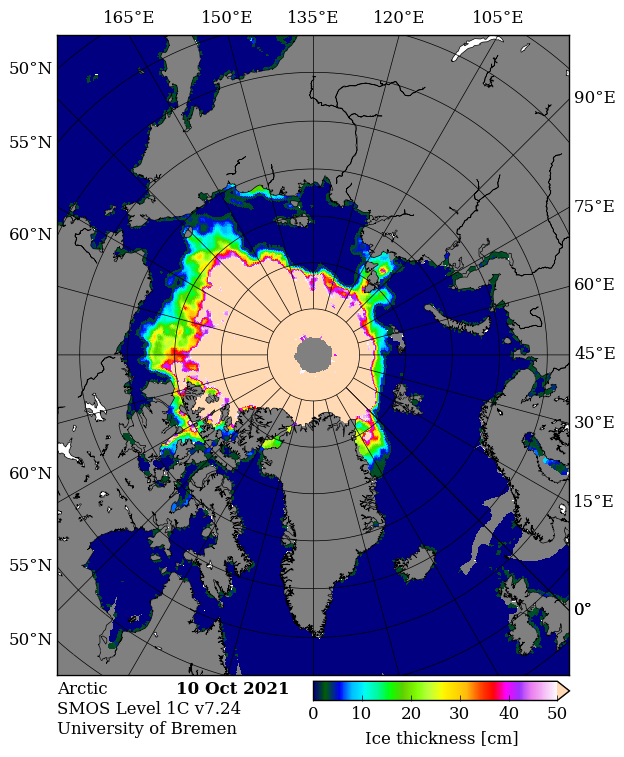
The University of Bremen have restarted SMOS coverage of the Arctic, so here’s their current “thin ice thickness” map for the Vilkitsky Strait and the rest of the Arctic Ocean:
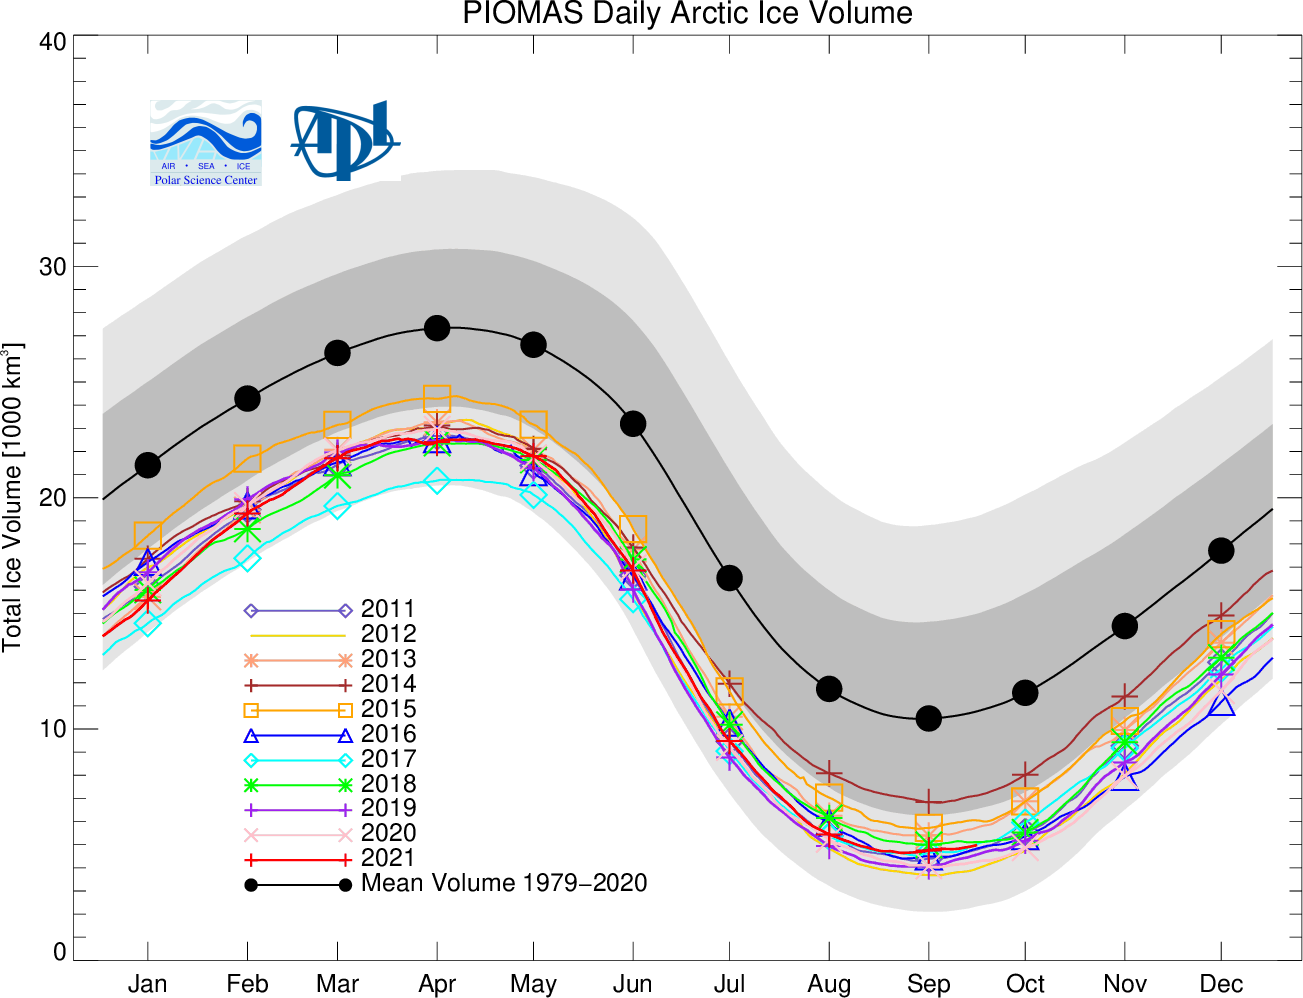
The Polar Science Center has released the PIOMAS volume data for September:
Average Arctic sea ice volume in September 2021 was 4,760 km3. This value is the 8th lowest on record for September about 1000 km^3 above the record set in 2012. Monthly ice volume was 72% below the maximum in 1979 and 55% below the mean value for 1979-2020. Average September 2021 ice volume was about 0.7 sigma above the 1979-2020 trend line. September ice melt was fairly normal for recent years but the mean ice thickness for September (above 15 cm thickness) was near a record low suggesting that the ice was spread out over a wider area.
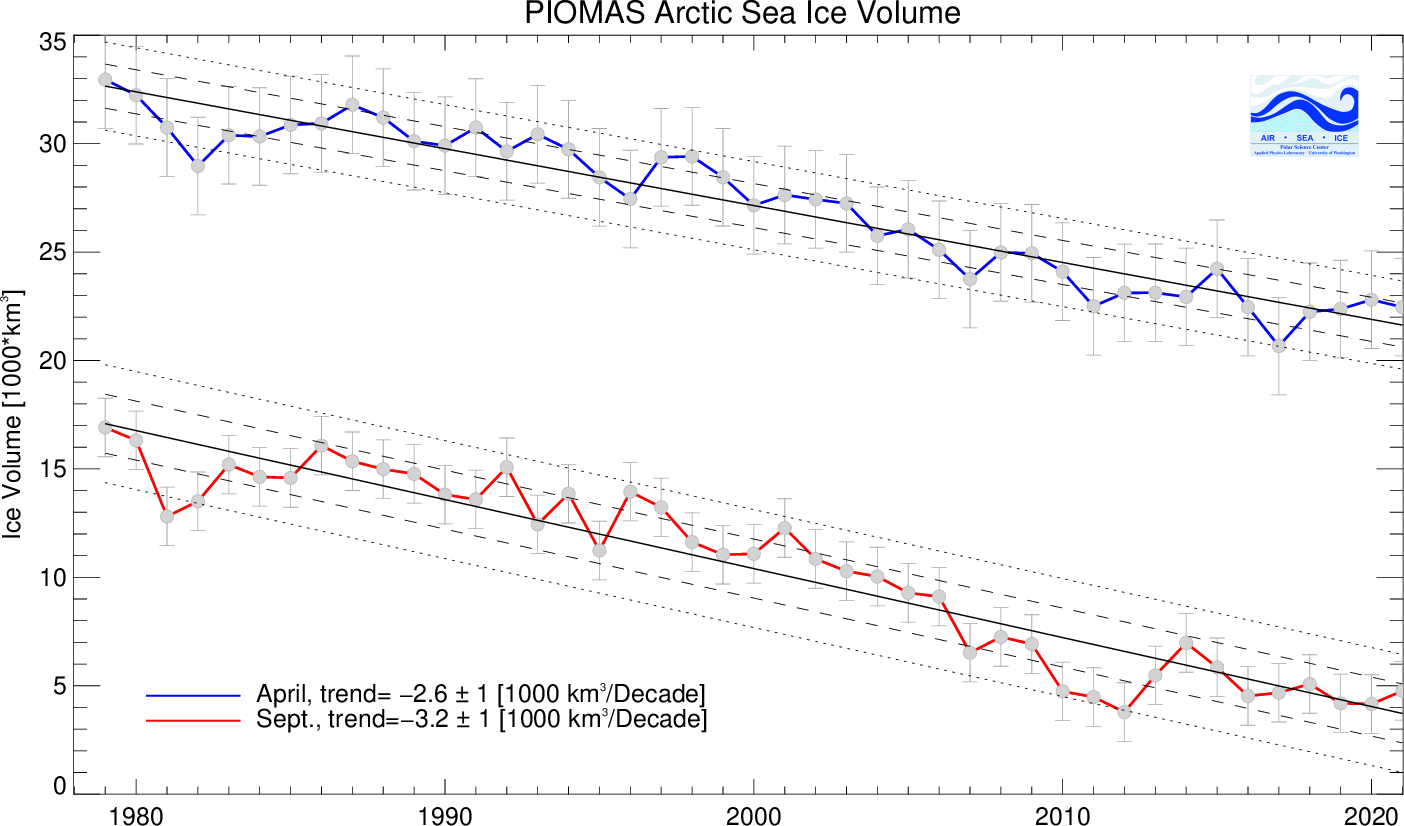
Here too are the updated volume trends, now including September 2021:
Here’s an animation of Arctic sea ice age from the 2015 minimum extent in September until the 2021 minimum:
Something to watch with much interest over the next few days:
An analysis of the 2021 Arctic sea ice melting season from Walt Meier of the NSIDC, and a discussion about Bering Sea ice conditions from Rick Thoman of the University of Alaska:
A somewhat “skeptical” fellow on Twitter seemed keen to point out that Thomas Lavergne’s forecast (see above) had underestimated the recent increase in sea ice extent, which is indeed the case:
P.S. pic.twitter.com/boUlm3PEdS
— Snow White (@GreatWhiteCon) October 24, 2021
Taking a look at the University of Hamburg AMSR2 concentration map as well it is clear that, in addition to the forecast “rapid freezing of the East Siberian Sea”, the Laptev Sea has been refreezing more quickly than anticipated by the CMEMS forecast:

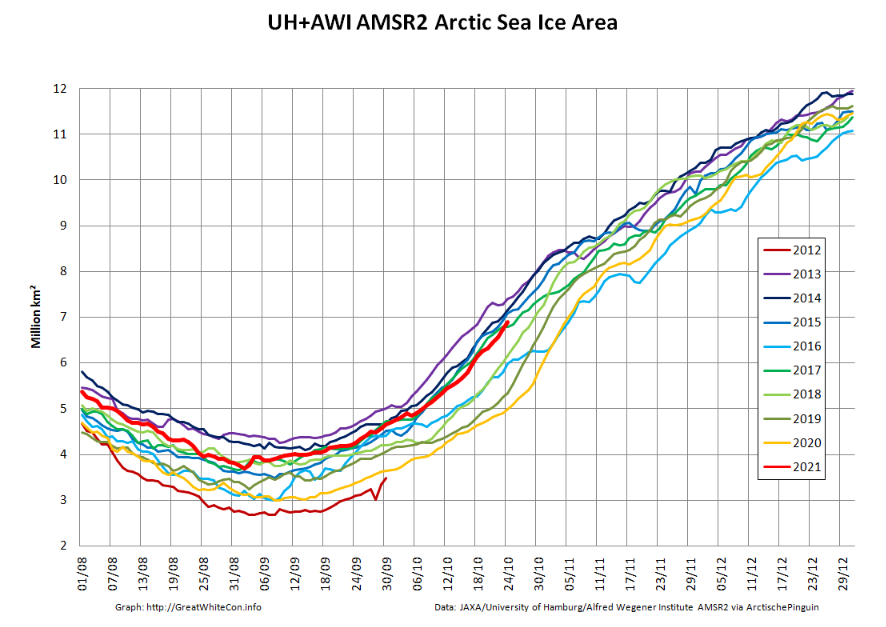
Here’s how high resolution AMSR2 area and extent look 5 weeks or so into the 2021/22 freezing season:
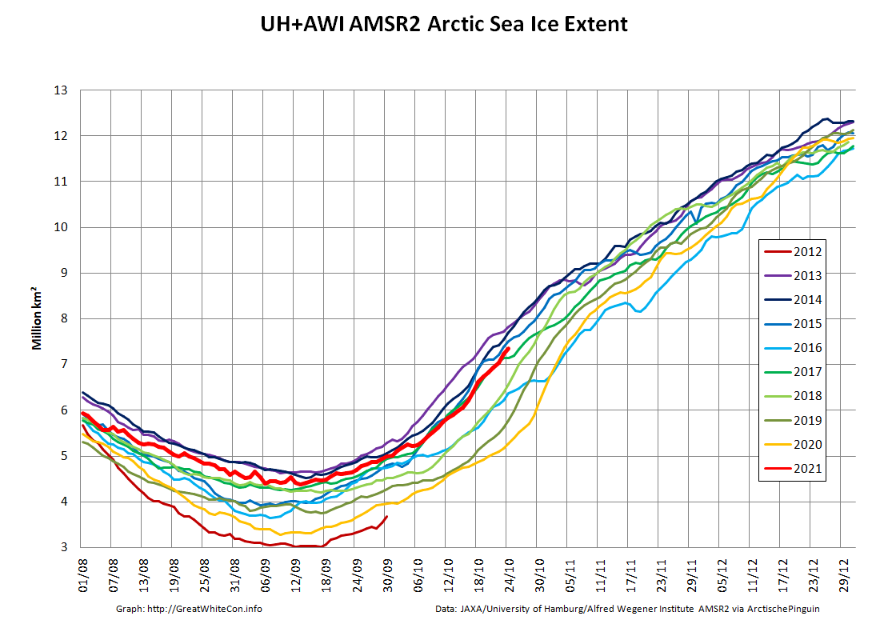
The first merged CryoSat-2/SMOS thickness data for Autumn 2021 has arrived from the AWI:
The volume graph is currently combining version 204 near real time data with version 203 reprocessed data from previous years:
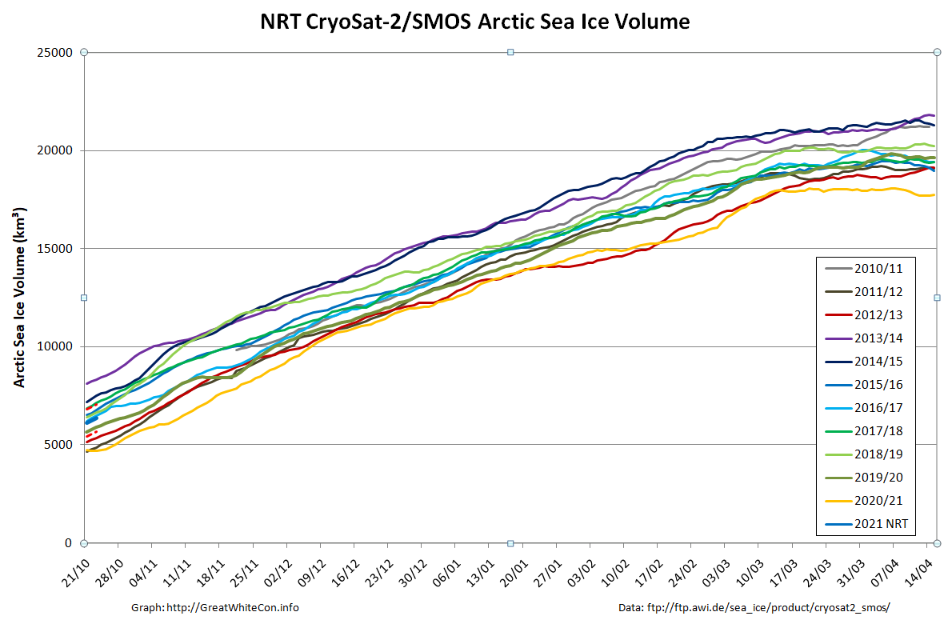
Volume on October 23rd was 6363.7 km³, near the middle of the pack of recent years.
[Edit – October 27th]After an absence of several days the NSIDC’s Sea Ice Index has burst back into life. Here’s the last ten years:

Via Jaakko Seppänen, the current CryoSat-2/SMOS thickness anomaly:
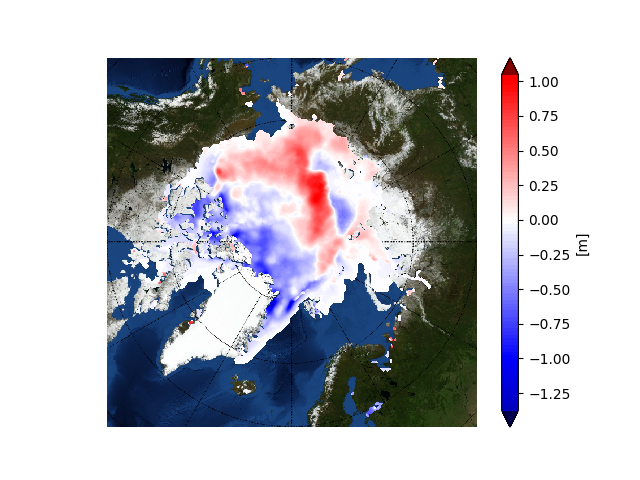
Volume is very close to the ten year average, but distribution far from it.
Watch this space!
When will we see Sep sea ice volume, if ever ..
We got no facts, just speculation. That’s how they prefer it.
As I have been known to state from time to time:
“Watch this space!”
As they almost say in that song:
“How long / Must we watch this space?”
This study analyzes a number of Greenland’s glaciers. Shows an abrupt change in the steep downward trend w/ receding glaciers beginning in 2012.
Anyone know of anything documenting this since 2017.
A link to the article in question would come in handy:
https://geusbulletin.org/index.php/geusb/article/view/4296
Amongst other things it includes this handy reference to the Greenland glaciers in question:
I can’t claim to have followed all 47, but Jakobshavn has calved several times this year, most recently:
Click to enlarge/animate.
«I hope that everything is fine with Wipneus…
I think it is the first time that he doesn’t update the PIOMAS charts and data.»
That’s what getting deleted wholesale 100% for no reason by Google does too you.
I can’t blame Wipneus for throwing his arms up in the air. This is on Google.
Thanks for the piomas update. I follow the Arctic Sea Ice forum which gives occasional mid month updates as you are aware.
Sort of funny that Garcia et al give the best up to date data and analysis.
Juan or Rubén?
https://doi.org/10.1007/s00382-020-05560-4
Juan.
Interesting times watching the ice and comments at the moment.
La Nina still brooding in the distance and I am sure it helped bring about some cooler water more ice late this arctic year.
The refreeze looks set to fill up centrally so I guess it is up to how far if at all, the peripheral seas go.
I thought it would be slow like the previous 2-3 years but??
The cloudiness during the period of peak insolation that slowed the melt down will also mean the sea surface temperatures around the central pack are a bit below last year. I must produce some maps to test that theory!
Meanwhile I’ve been endeavouring to explain to a stubborn “skeptical” fellow on Twitter, who also apparently thinks that a La Niña winter will restore Arctic sea ice to its former glory, that increased extent doesn’t mean what he thinks it means:
What’s more sea ice is an insulator, and snow is an even better insulator.:
This seems like a good time for a musical interlude:
All speculation until something definite happens.
Neven was very cautious about attaching anything significant to Arctic Sea Ice as was Anthony.
Predictions haver a habit of biting.
So what?
We discussed this briefly earlier in the year and I agree with you. We need a sustained period of change before jumping to any conclusions.
“Predictions have a habit of biting”
Let’s hope so?
I cannot help but notice that “Steve”/Tony has gone very quiet on the topic of Arctic sea ice recently!
It is all in the interpretation
TH
“By the end of the year, the 365 day mean will be higher than it was fifteen years ago. ”
Gerontocrat
“Average remaining extent gain (of the last 10 years) would produce a maximum in March 2021 of 14.81 million km2, 0.94 million km2 above the March 2017 record low maximum of 13.88 million km2, which would be 19th lowest in the satellite record”
15 years ago was 2006 which may be out of reach currently,
Currently in 9th spot and a long way to go …..
My “interpretation” of the available data is certainly different to “Steve Goddard’s”!
As luck would have it earlier today I elicited Judah Cohen’s interpretation of the data, which looks something like this:
So as I understand the situation, Wipneus still has no place to publish half-month updates, after Google terminated the Sites service. Gotta take some more of them Patience pills, I guess. For now, anyway, it doesn’t seem like the PIOMAS data series as such is officially terminated.
Jim, your thoughts on a 2 million sq K difference in 1 year with no obvious cause for such an unexpected shift?
Is our natural variability range that much out of kilter?
I note that in the past 3 years it has both been lowest/second lowest and 12th lowest several times.
Why such wide variation?
Is it easier to vary more with smaller ice volumes than 40 years ago?
I’ve already explained my thoughts on that topic Angech.
1) I’m with Judah Cohen when he stated “Arctic sea ice is higher than recent years at this time but within the envelope of the past decade.”
2) The “surprise” here is “why was extent so low last year?” rather than “why is this year so high?”.
3) At the start of July, 2021 was in the unenviable position of being “lowest extent for the date in the satellite era”. Then the weather turned cloudy.
4) See the latest volume measurements above, hot off the AWI presses.
At the start of July, 2021 was in the unenviable position of being “lowest extent for the date in the satellite era”.
So it was.
Difficult to argue with.
“Difficult to argue with”
Try telling that to Anthony, “Steve”/Tony, Willis et al.!
Correct observation.
June min to Oktober max.
Tells us something?
[Embedded image – Mod]
If I’ve understood your comment correctly, then yes. The summer of 2021 was cloudier than usual.
See for example: https://GreatWhiteCon.info/2021/08/facts-about-the-arctic-in-august-2021/