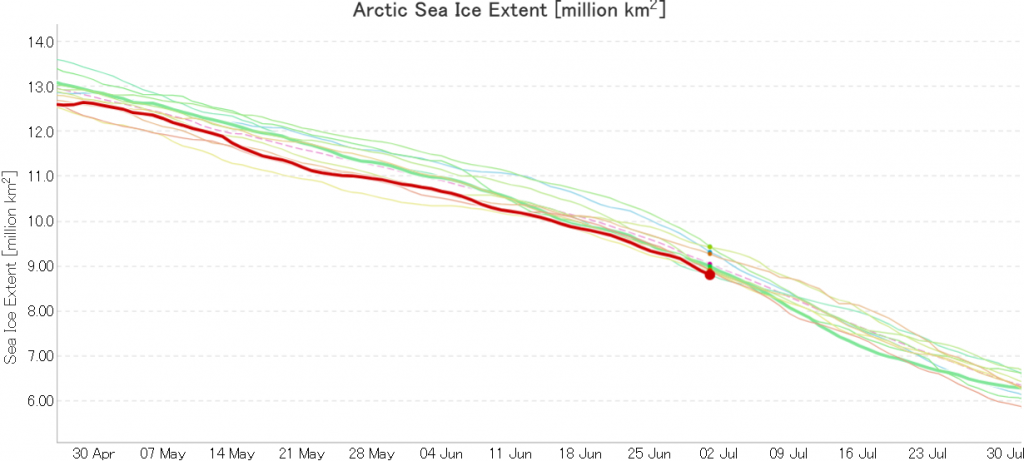
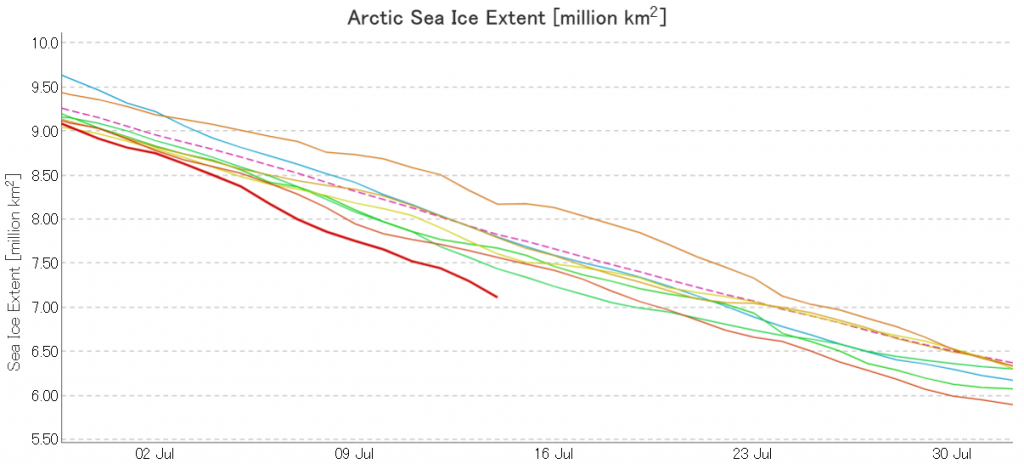
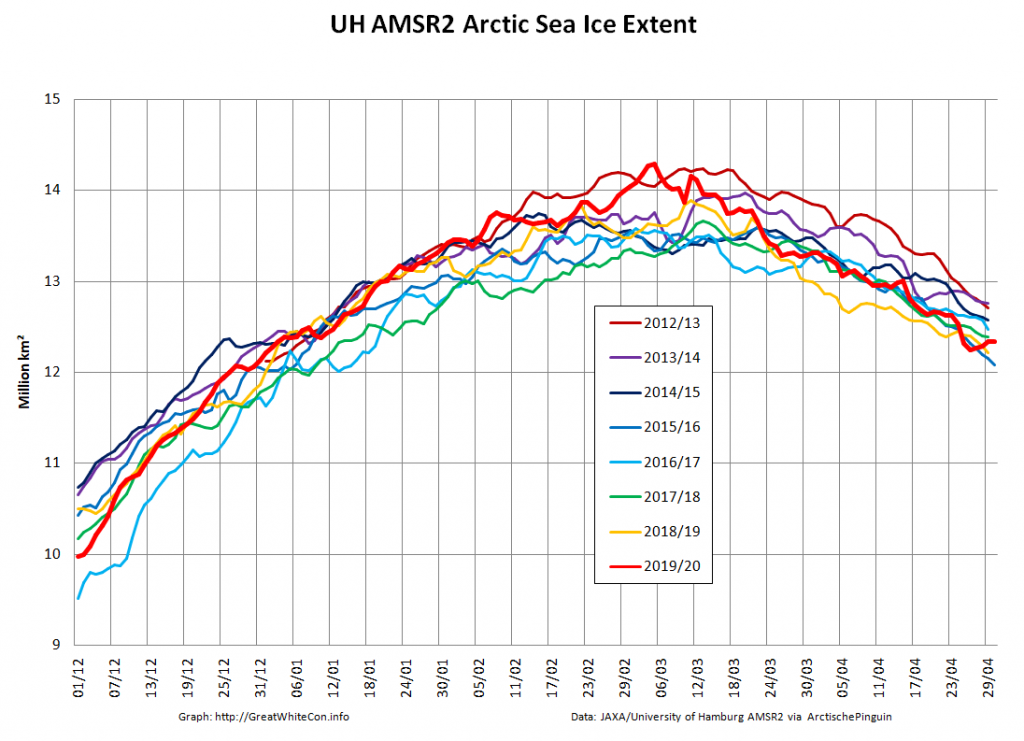
The new month starts with JAXA extent “lowest for the date in the satellite record” by a whisker:
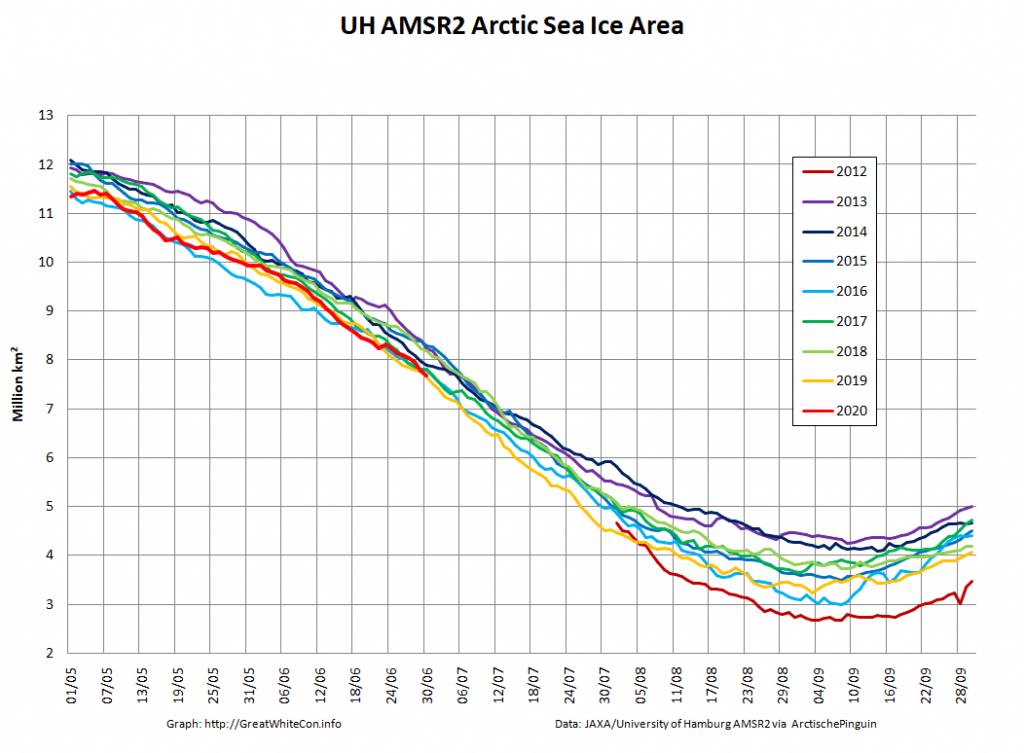
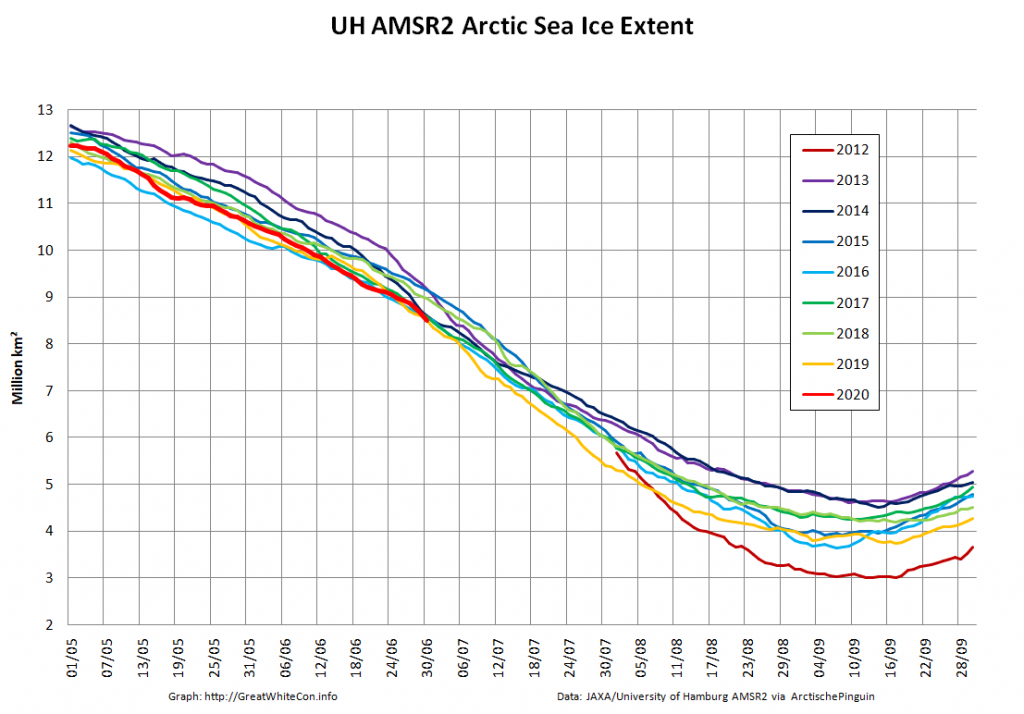
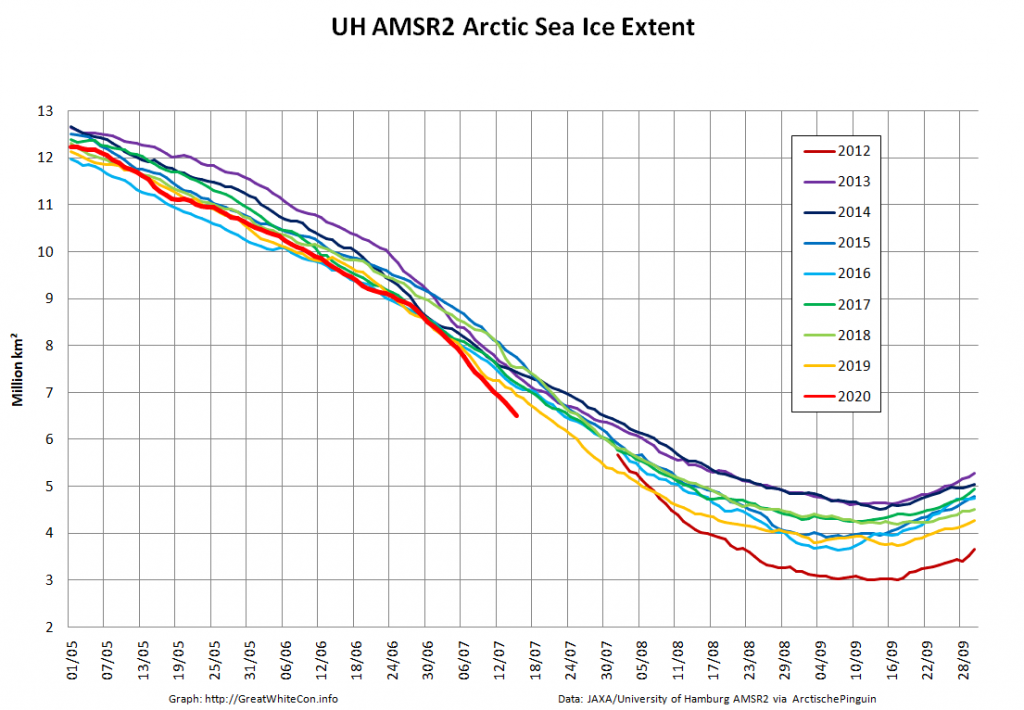
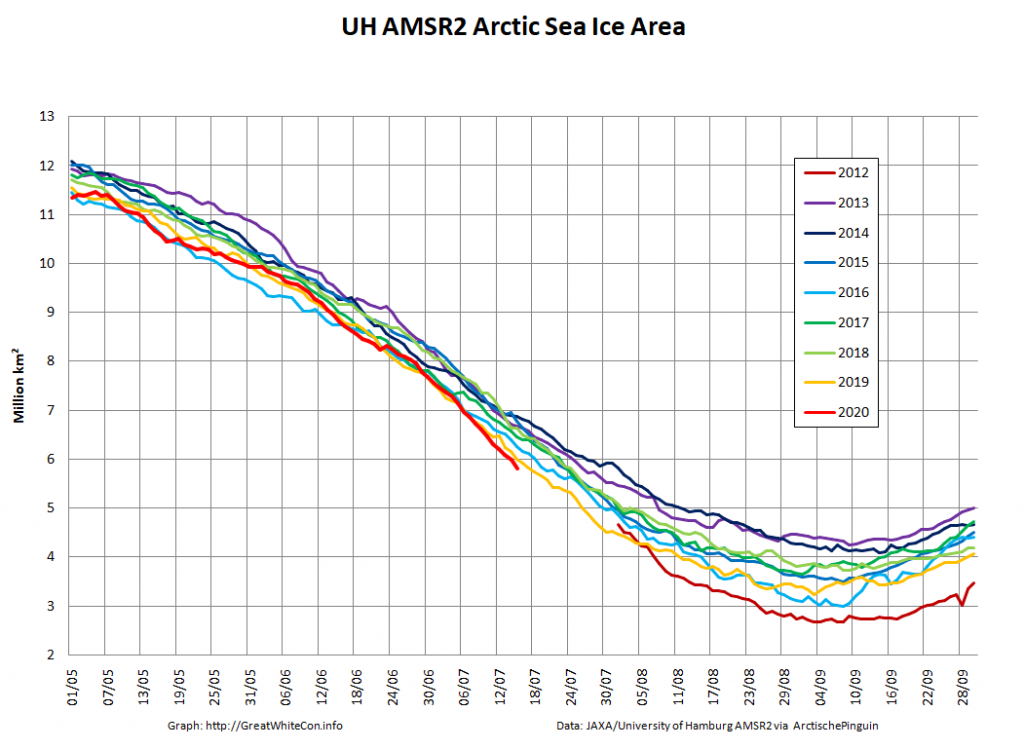
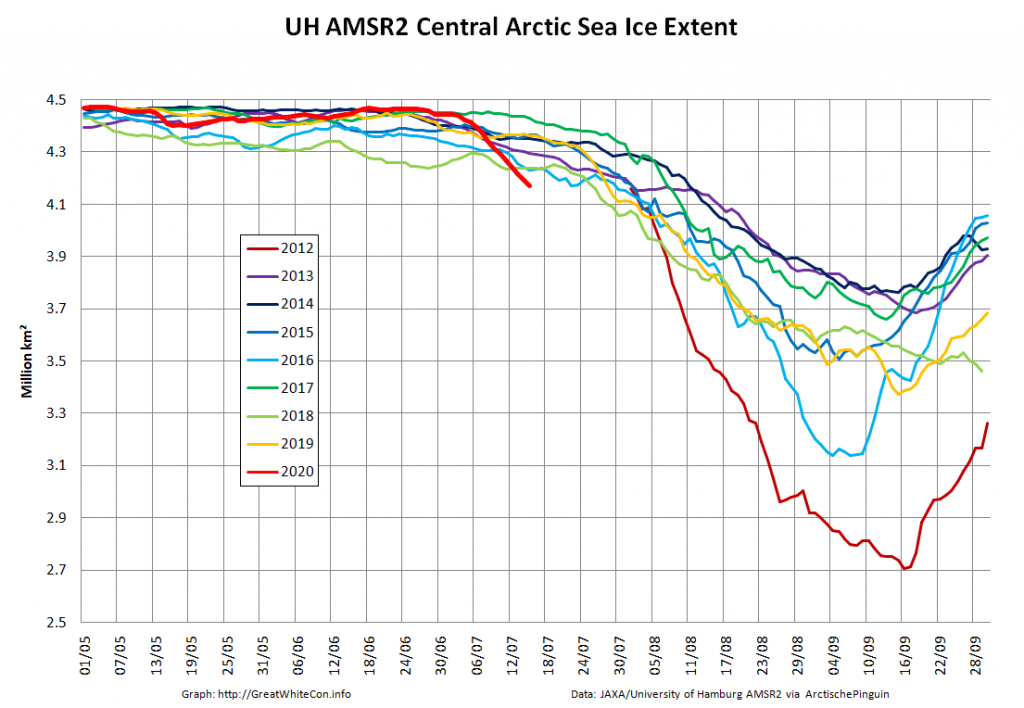
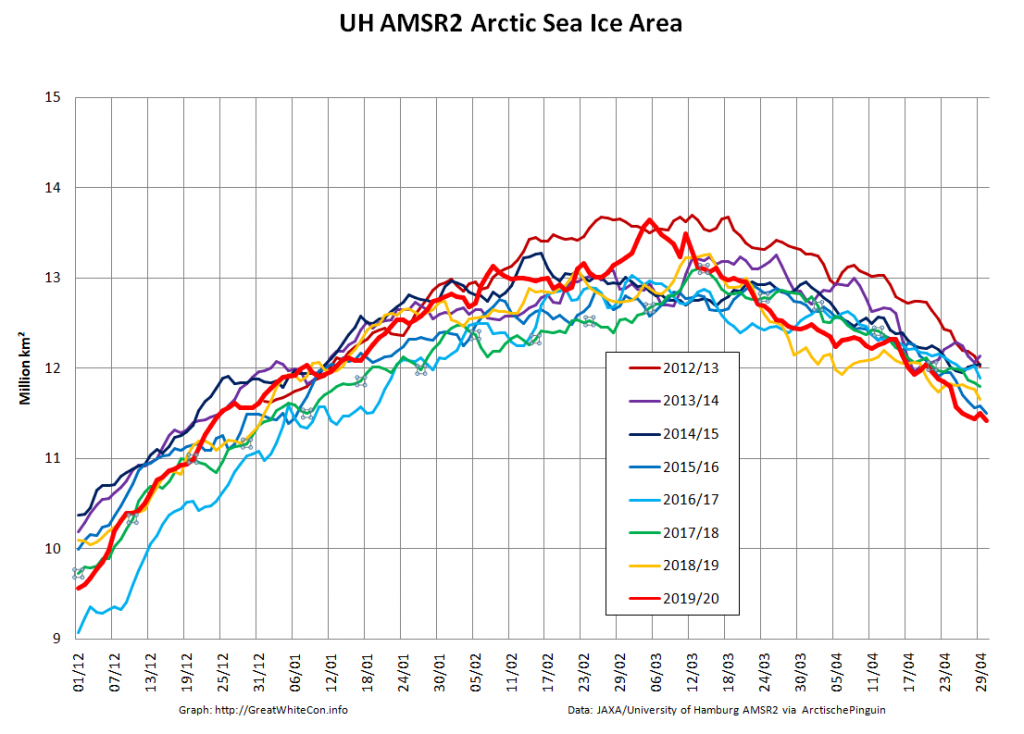
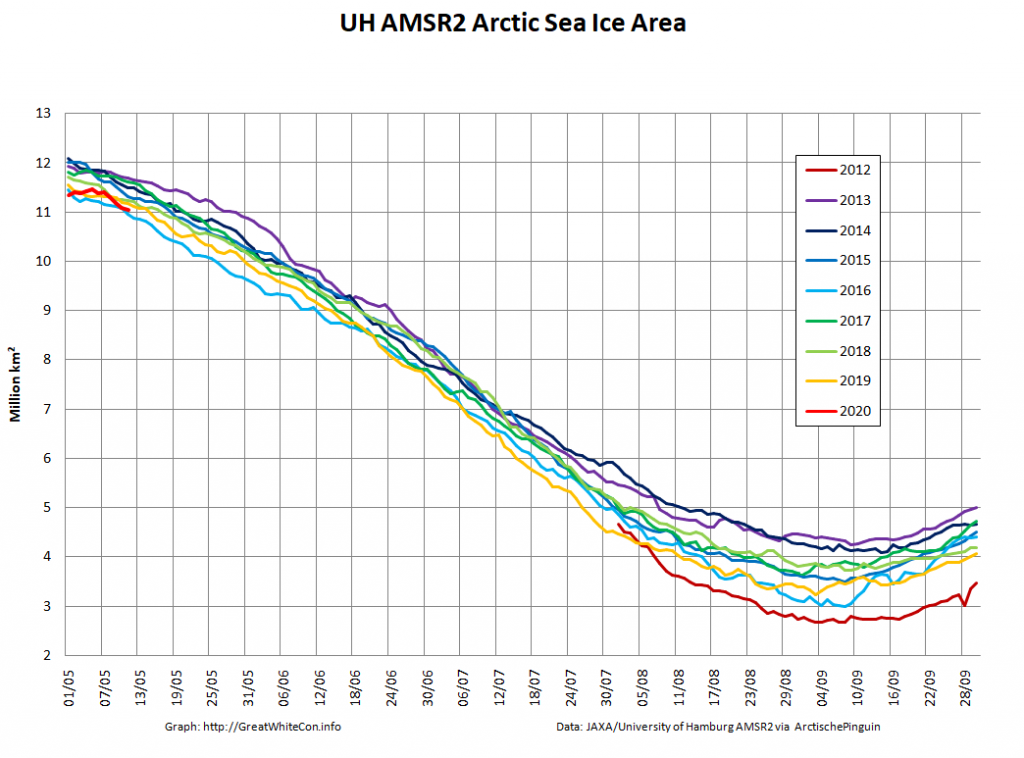
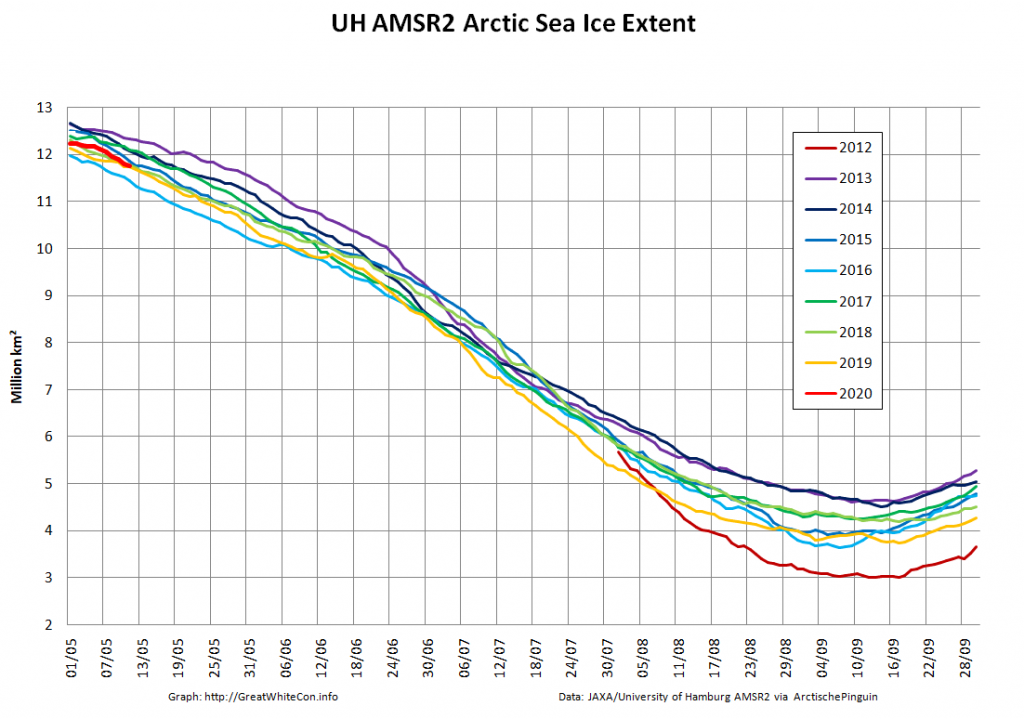
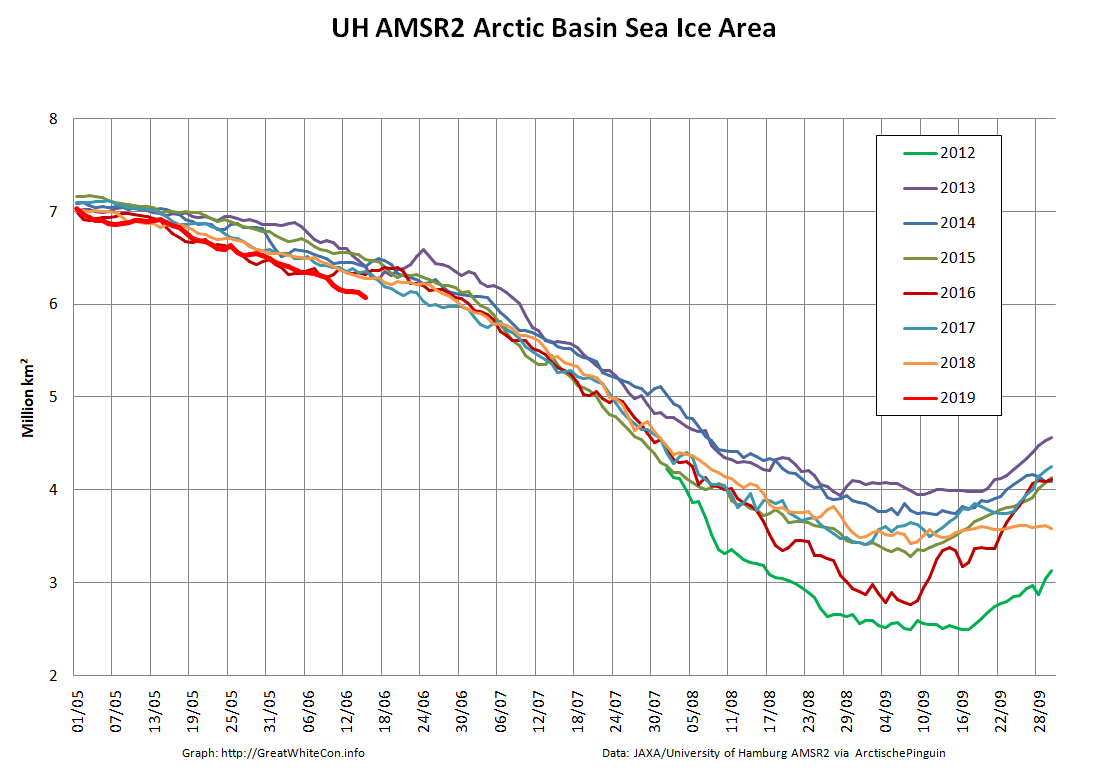
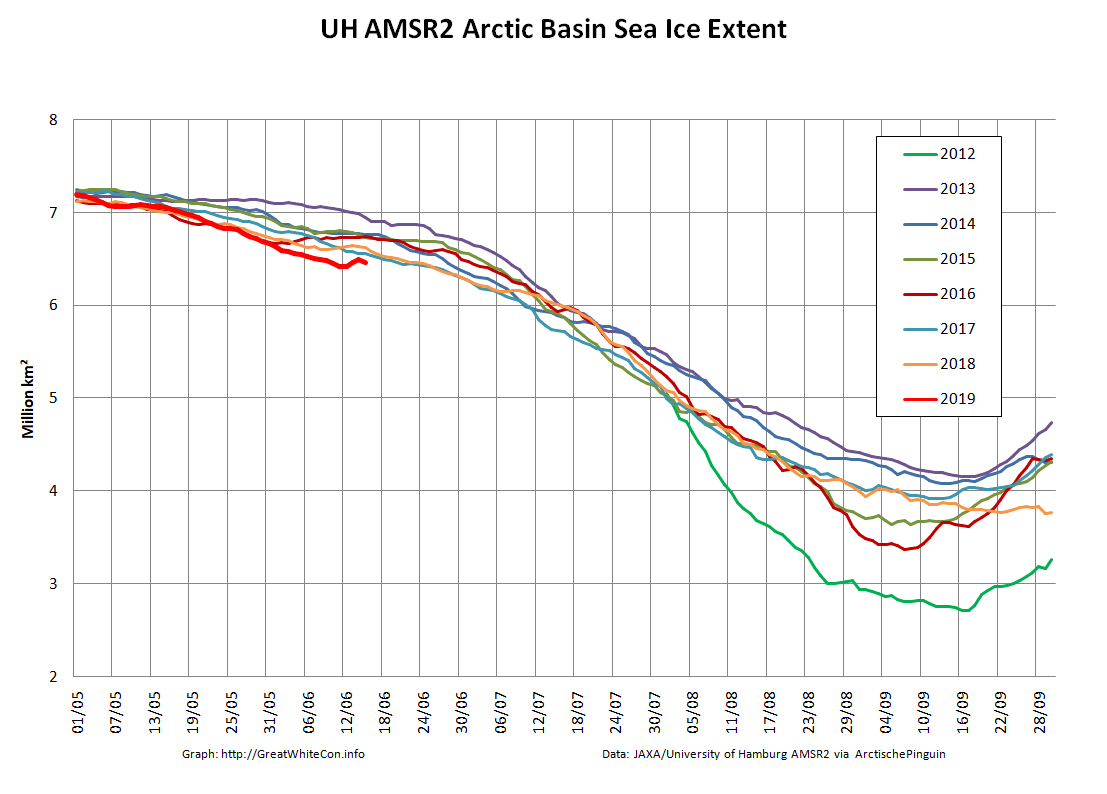
The high resolution Arctic sea ice area and extent graphs based on the University of Hamburg’s AMSR2 concentration data are also in “statistical ties” for that honour, in records going back to 2013:
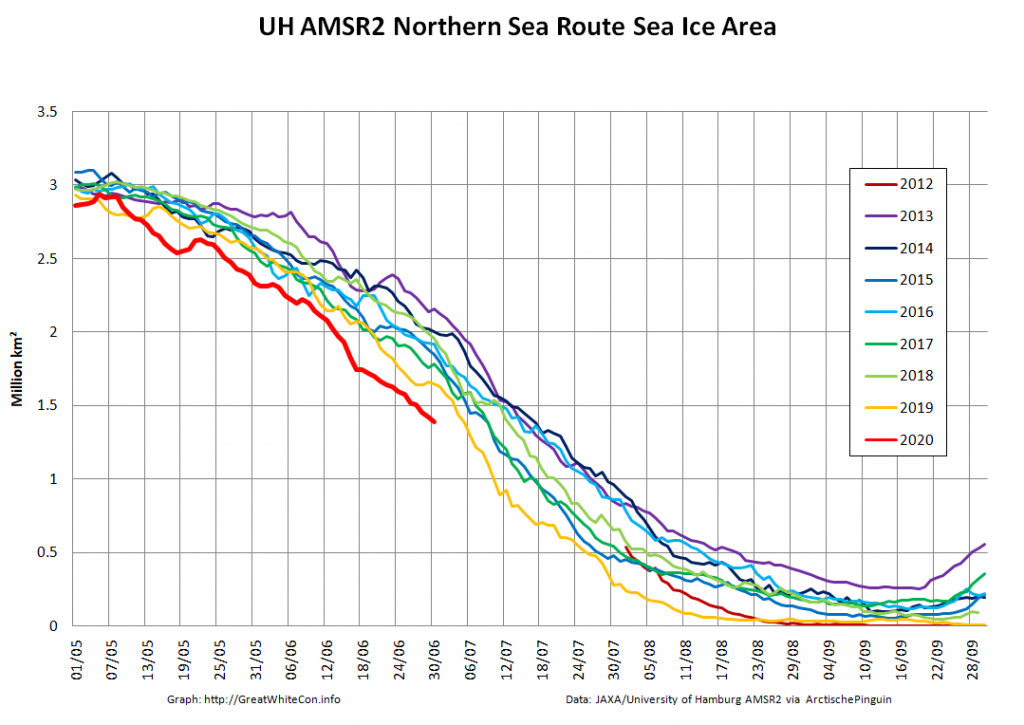
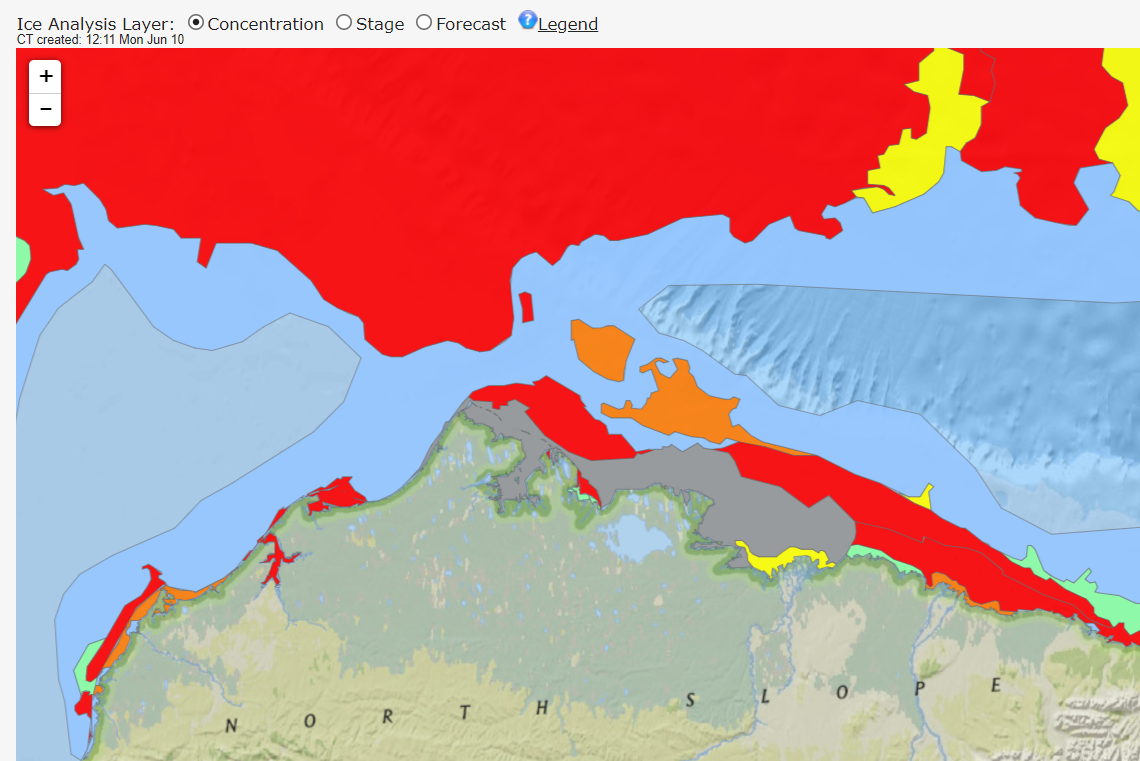
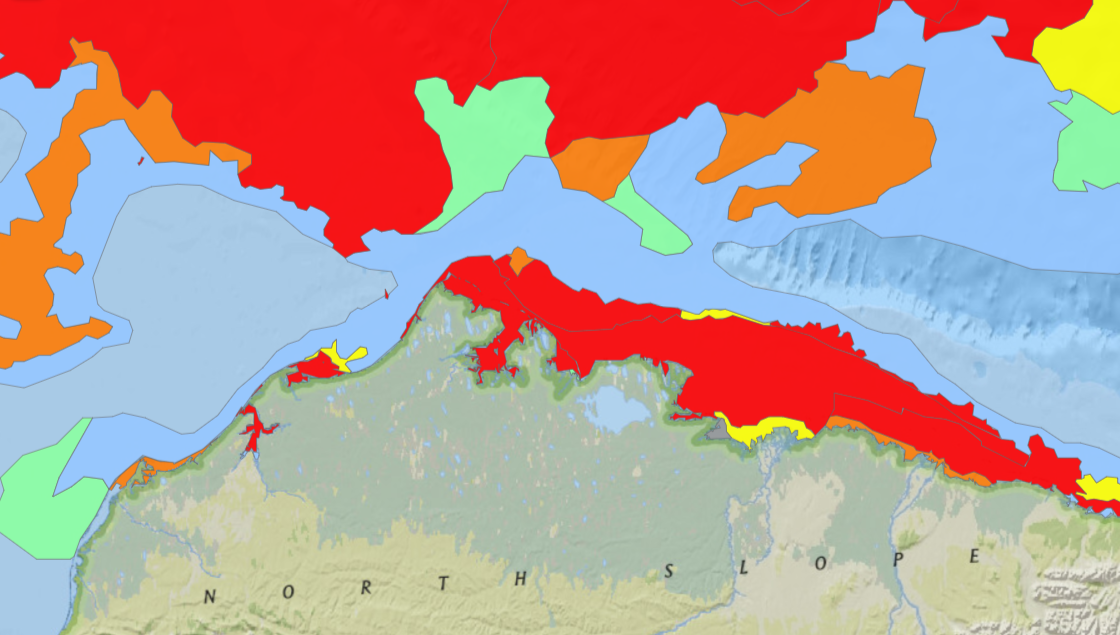
The 2020 melting season currently seems to be a game of two (geographical) halves. The sea ice on the Siberian side of the Arctic is currently at record lows:
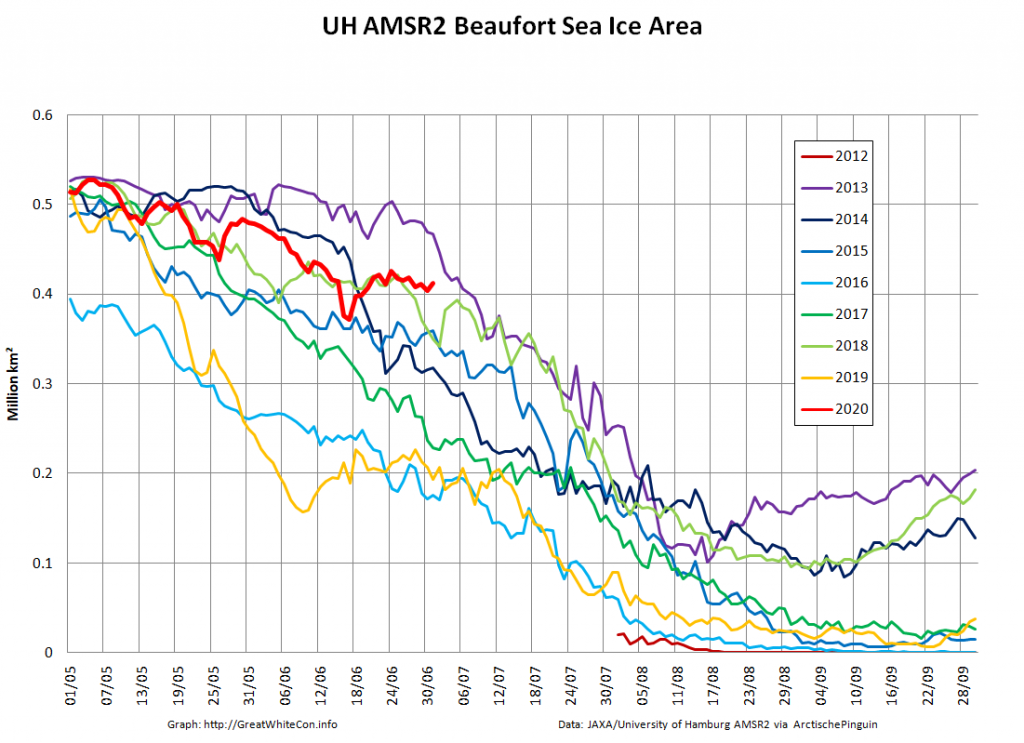
Whereas the Beaufort Sea is near a record high:
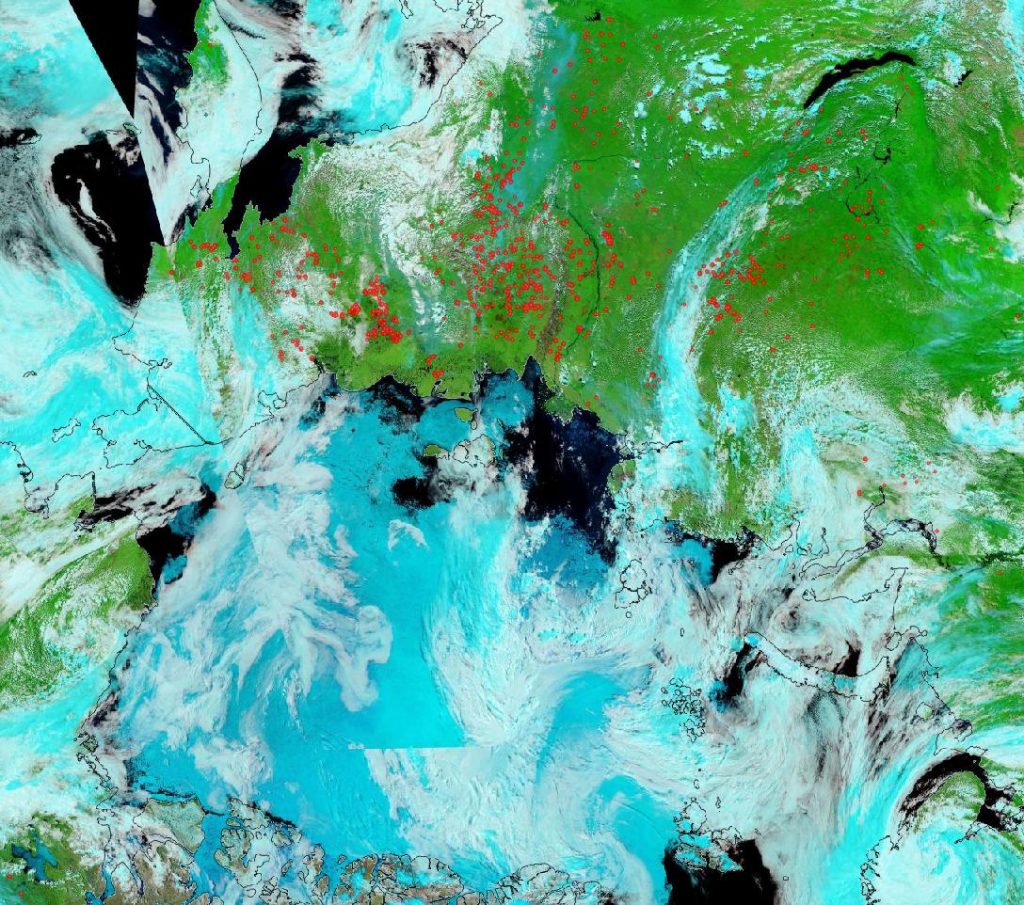
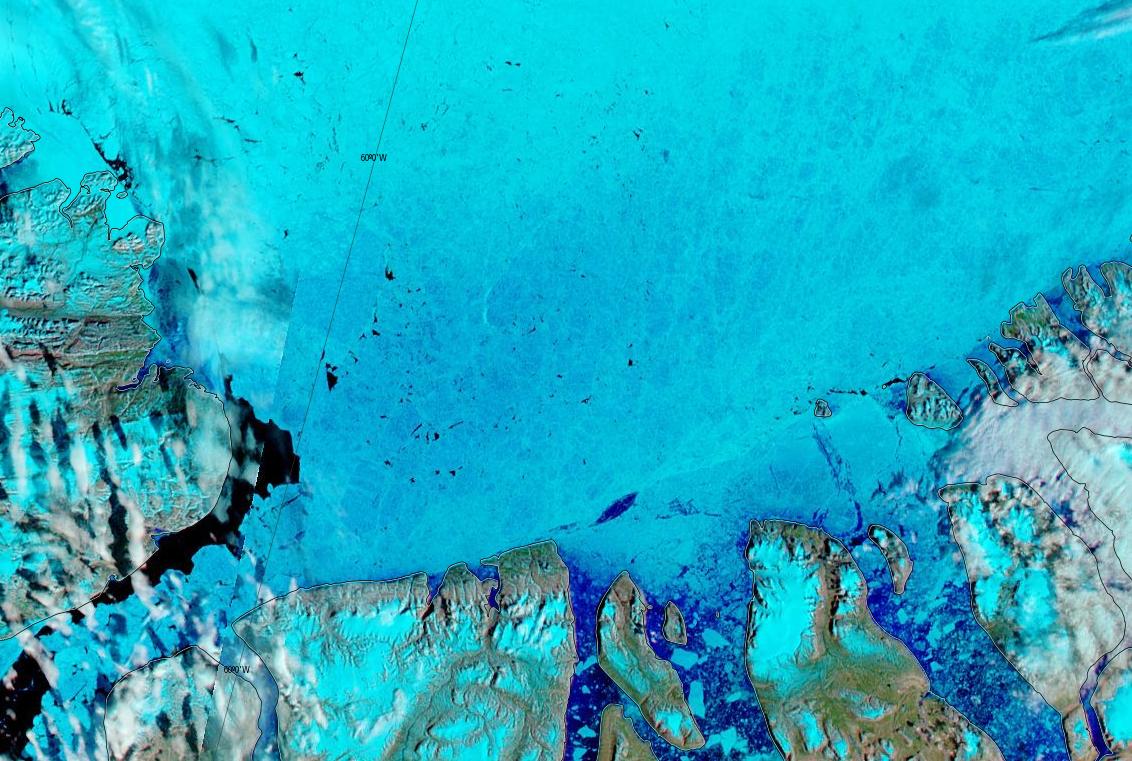
Currently the tell tale signs of surface melt are visible across most of the central Arctic, as are the large number of wildfires across Arctic Siberia:
NASA Worldview “false-color” image of the Arctic on July 1st 2020, derived from the MODIS sensor on the Terra satellite
[Edit – July 4th]
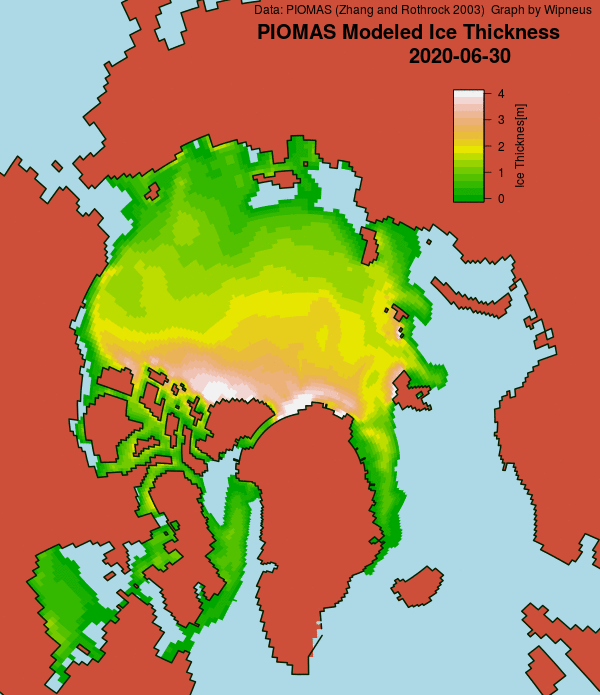
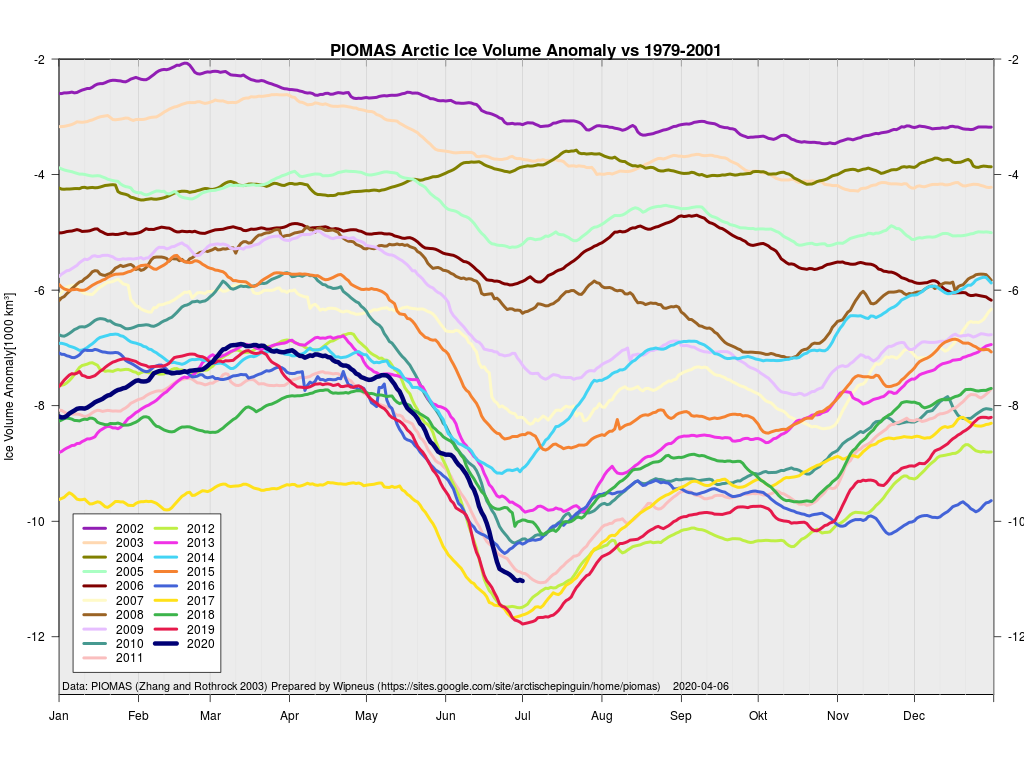
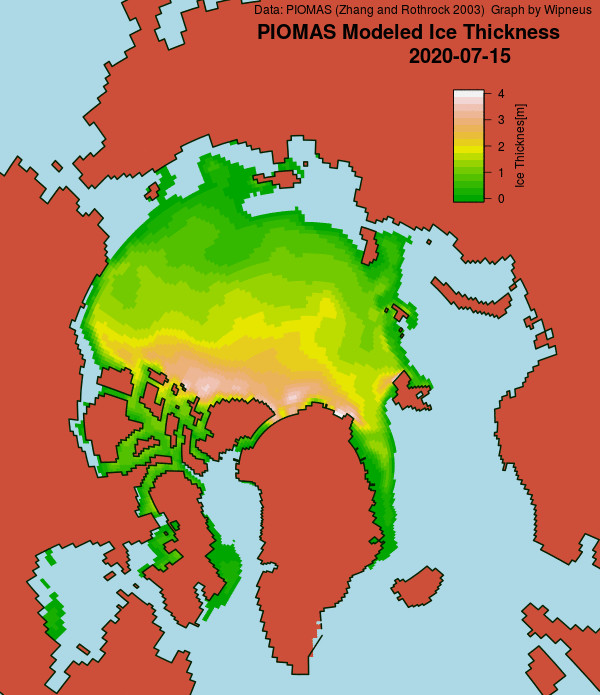
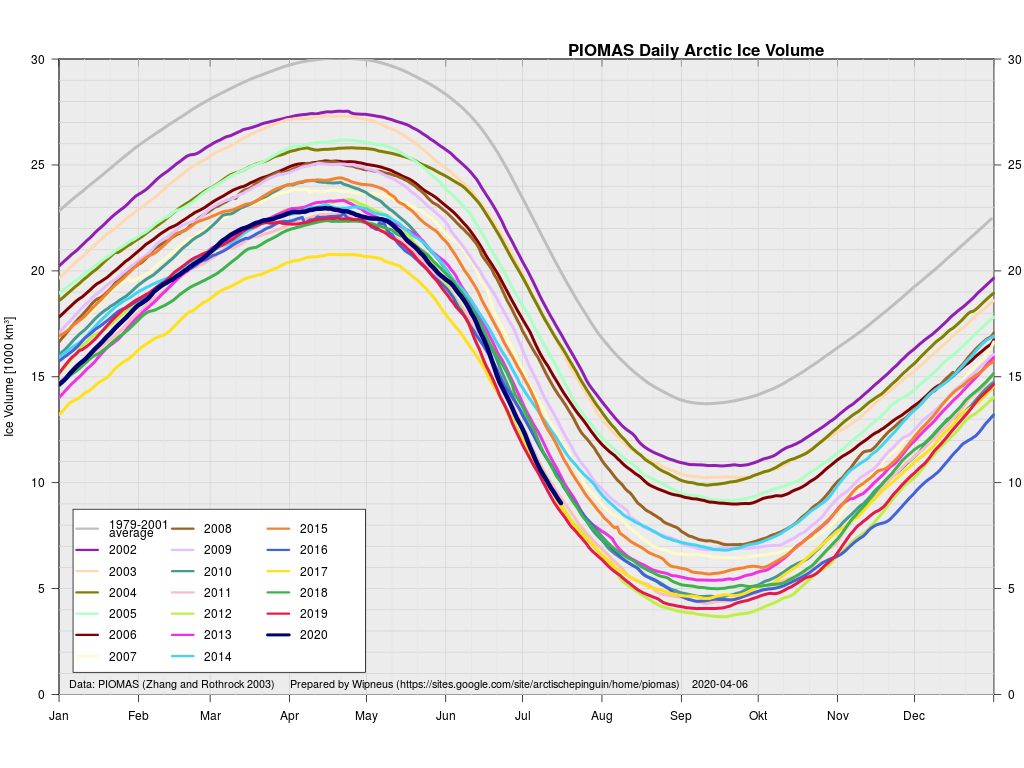
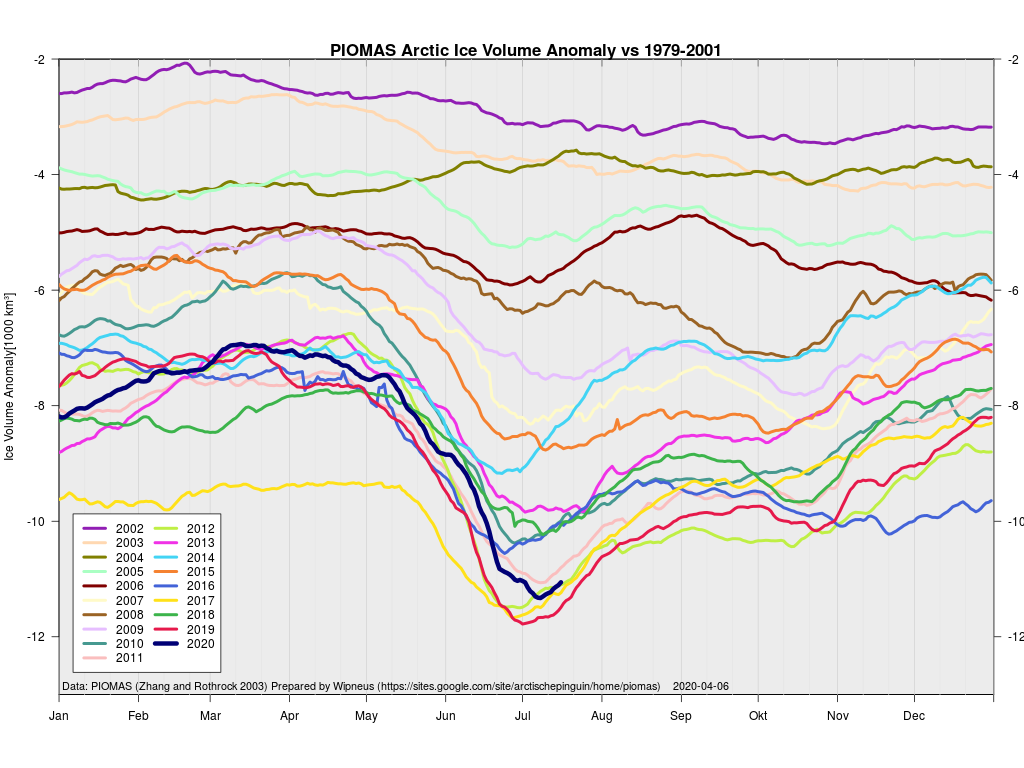
The June 30th PIOMAS gridded thickness numbers have been released, and here are the results of Wipneus’s number crunching:
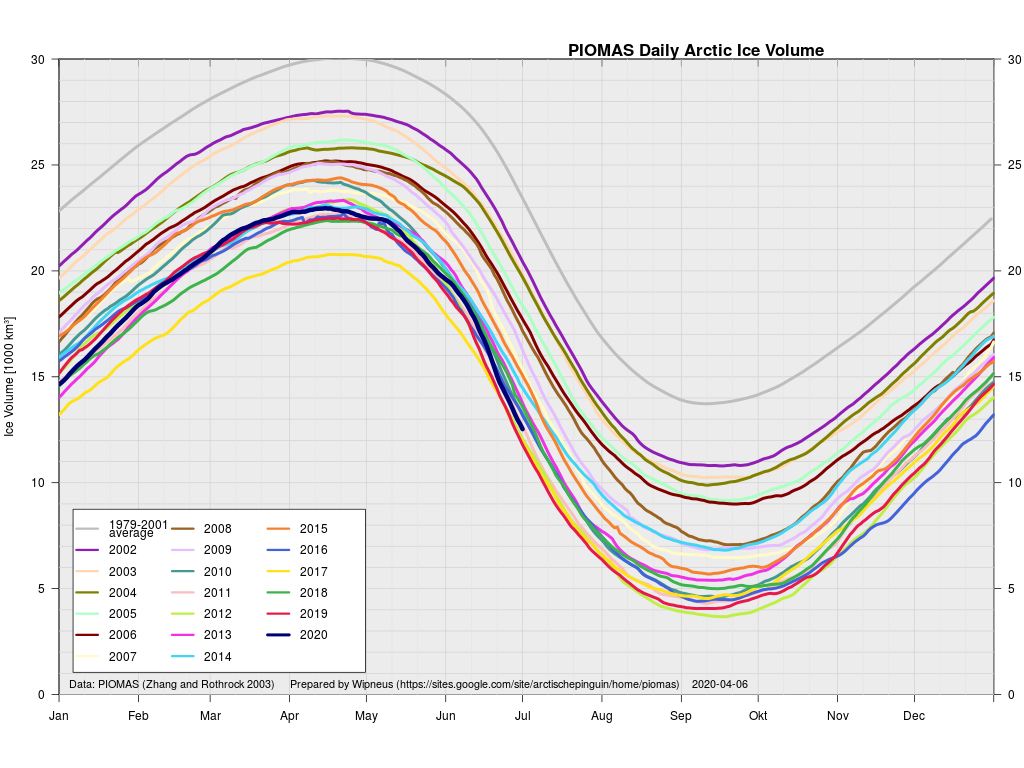
This month including a visualisation of the increasing negative anomaly:
[Edit – July 6th]
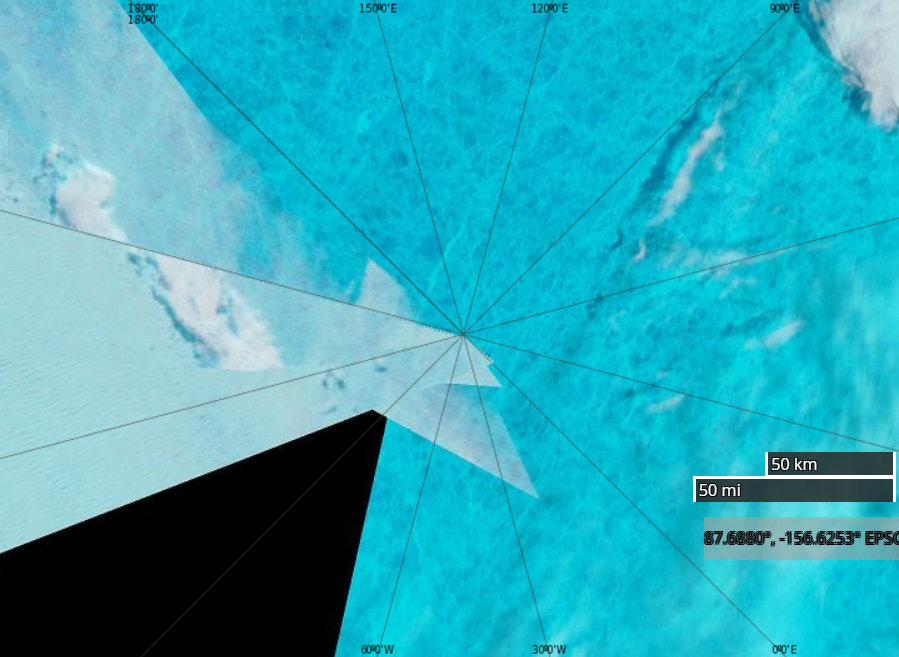
A break in the clouds over the North Pole reveals the onset of surface melt:
NASA Worldview “false-color” image of the North Pole on July 6th 2020, derived from the MODIS sensor on the Terra satellite
[Edit – July 8th]
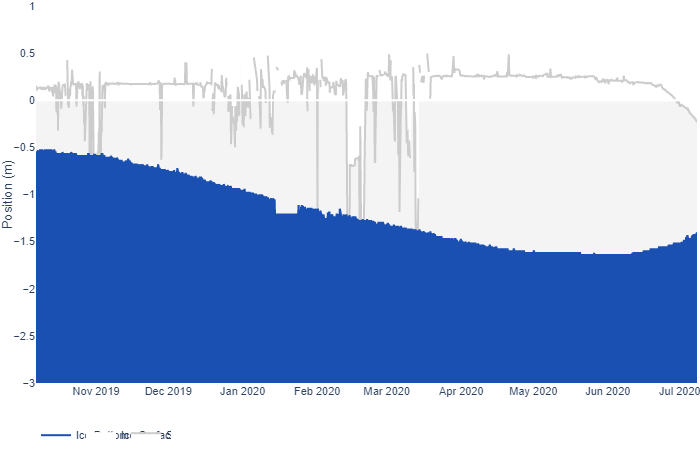
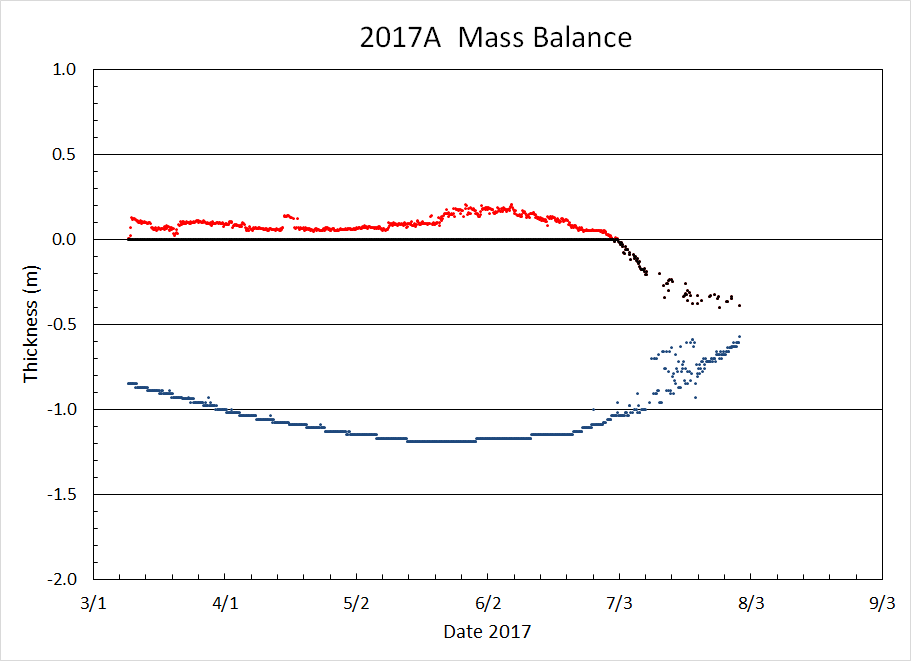
After a brief hiatus there are once again some ice mass balance buoys installed at assorted locations across the Arctic. Some have ceased to function, but one of the buoys installed as part of the MOSAiC expedition is still sending back data as it heads towards the Fram Strait. Buoy 387850 is currently located at 81.66 N, 4.19 E. Here’s its ice mass balance plot:
As you can see, both surface and bottom melt are well under way, with just over a meter of ice still remaining.
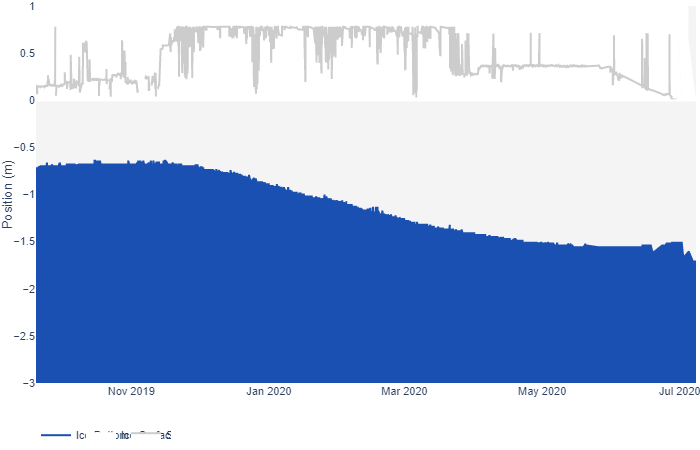
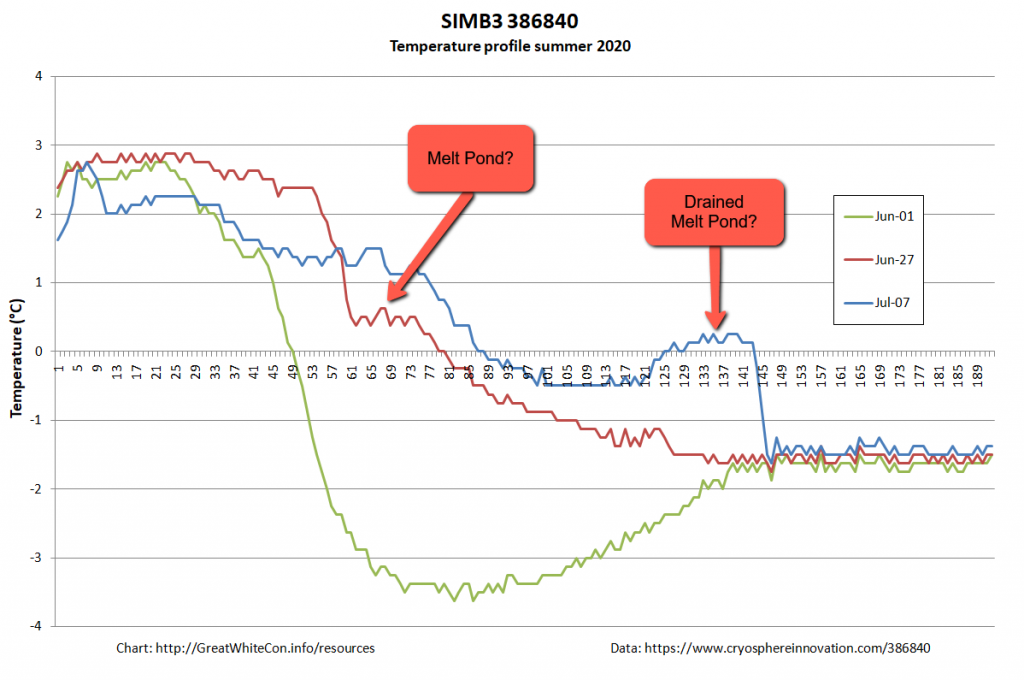
Now let’s take a look at buoy 386840, currently located at 74.30 N, 132.60 W in the Beaufort Sea:
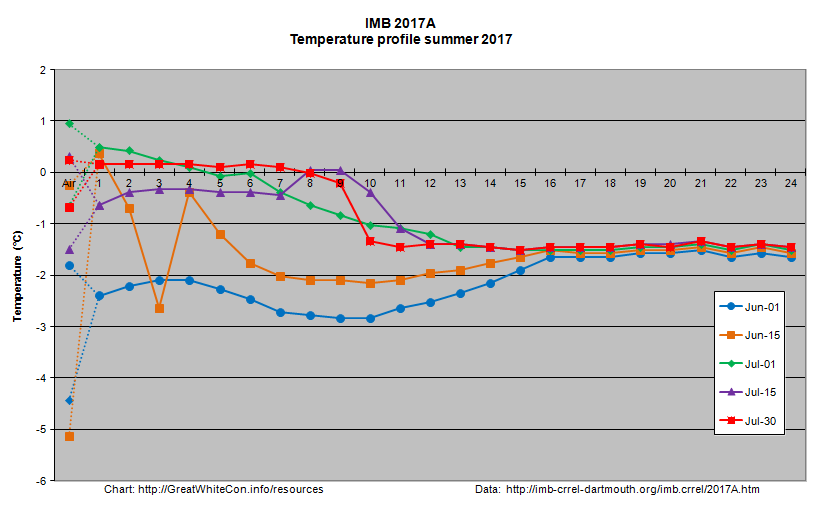
It looks as though the ice thickness has increased, but surely that can’t be right at this time of year? To try and find out I downloaded the raw data and plotted the temperature readings from the buoy’s thermistor string:
It looks to me as though the ice floe carrying the buoy is currently floating on some warm fresh water from a recently drained melt pond, which is confusing the sensor designed to measure the position of the bottom of the ice. There certainly seems to be far less than the claimed “1.653 m snow and ice thickness” still remaining to be melted!
[Edit – July 15th]
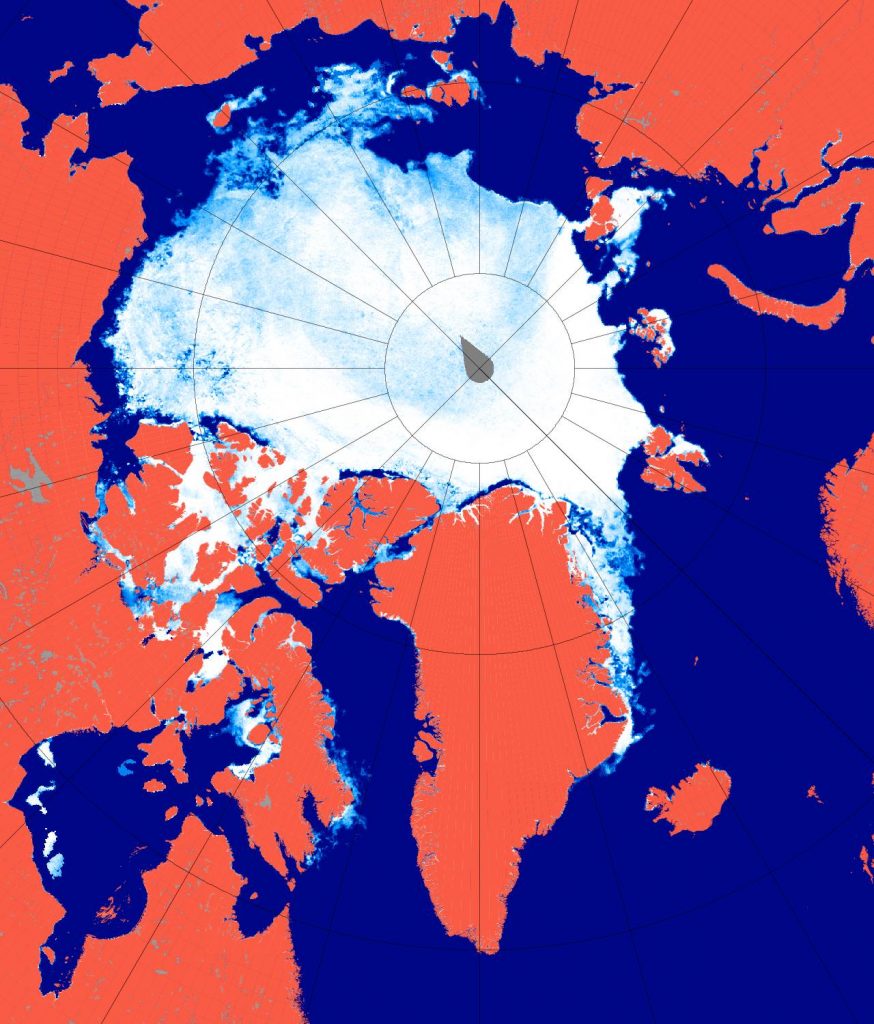
A very unusual image. Hardly a cloud in the sky over the North Pole yesterday:
NASA Worldview “false-color” image of the North Pole on July 14th 2020, derived from the MODIS sensor on the Terra satellite
The July 2020 extent “plummet” shows no signs of ending just yet. Here’s the JAXA/ViSHOP version:
[Edit – July 17th]
JAXA AMSR2 extent is now below 7 million km², and the high resolution version is lower still:
As the “Laptev Bite” and the Atlantic periphery of open water extends further towards the North Pole, Central Arctic Basin extent is now also at record lows for the date in the AMSR2 record:
Extent is currently lowest in the satellite era by a long way, but modelled volume is only fourth lowest!
Watch this space!
[Edit – July 21th]
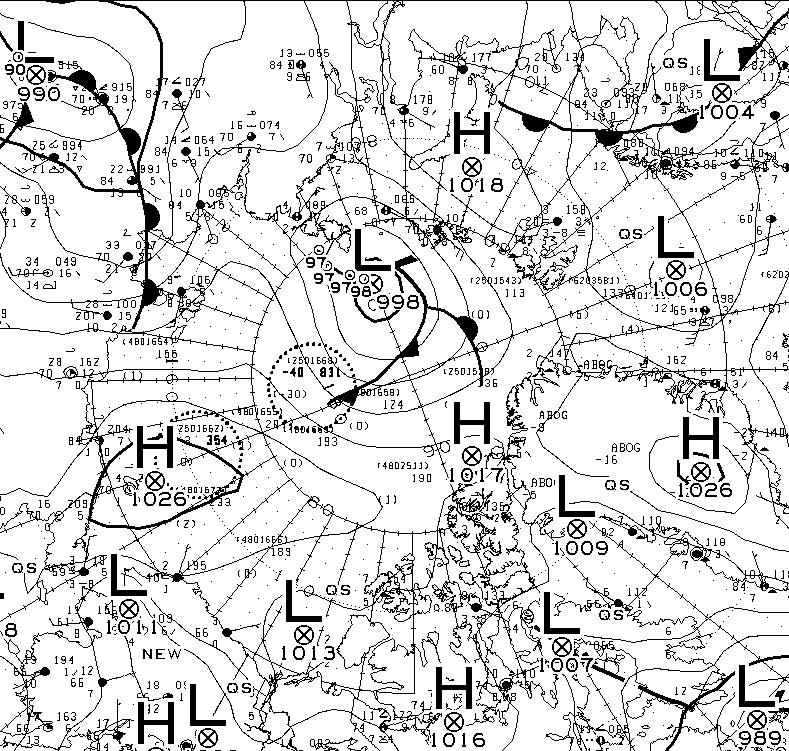
At long last there’s a sub 1000 hPa MSLP low pressure area slowly wending its way across the central Arctic:
It seems to have bottomed out at 997 hPa. Perhaps this will inhibit the ongoing “plummet” in extent? JAXA extent fell by 114,342 km2 yesterday.
[Edit – July 23rd]
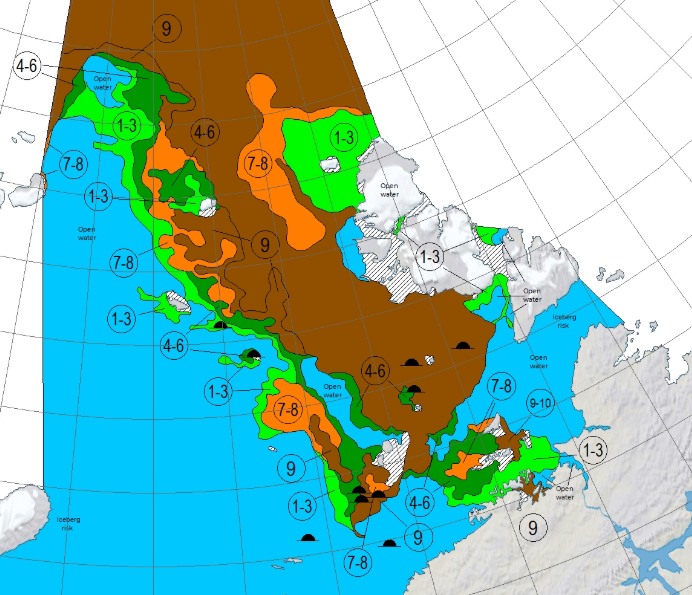
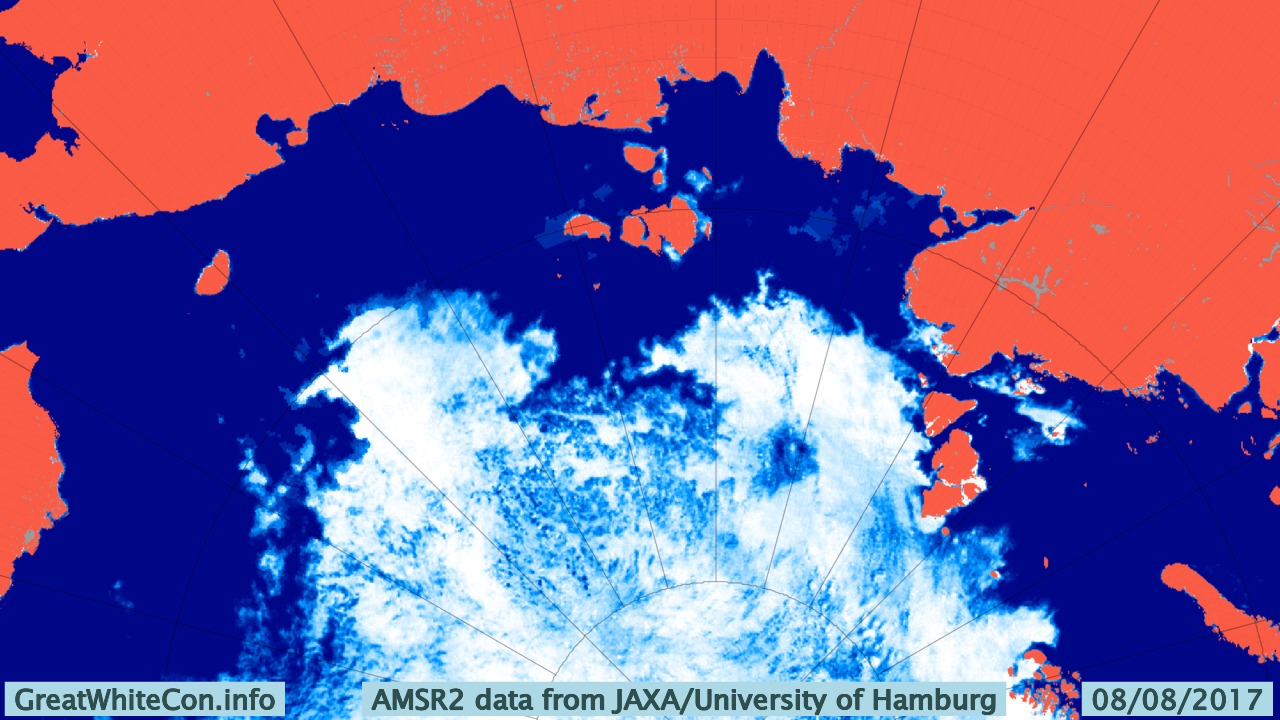
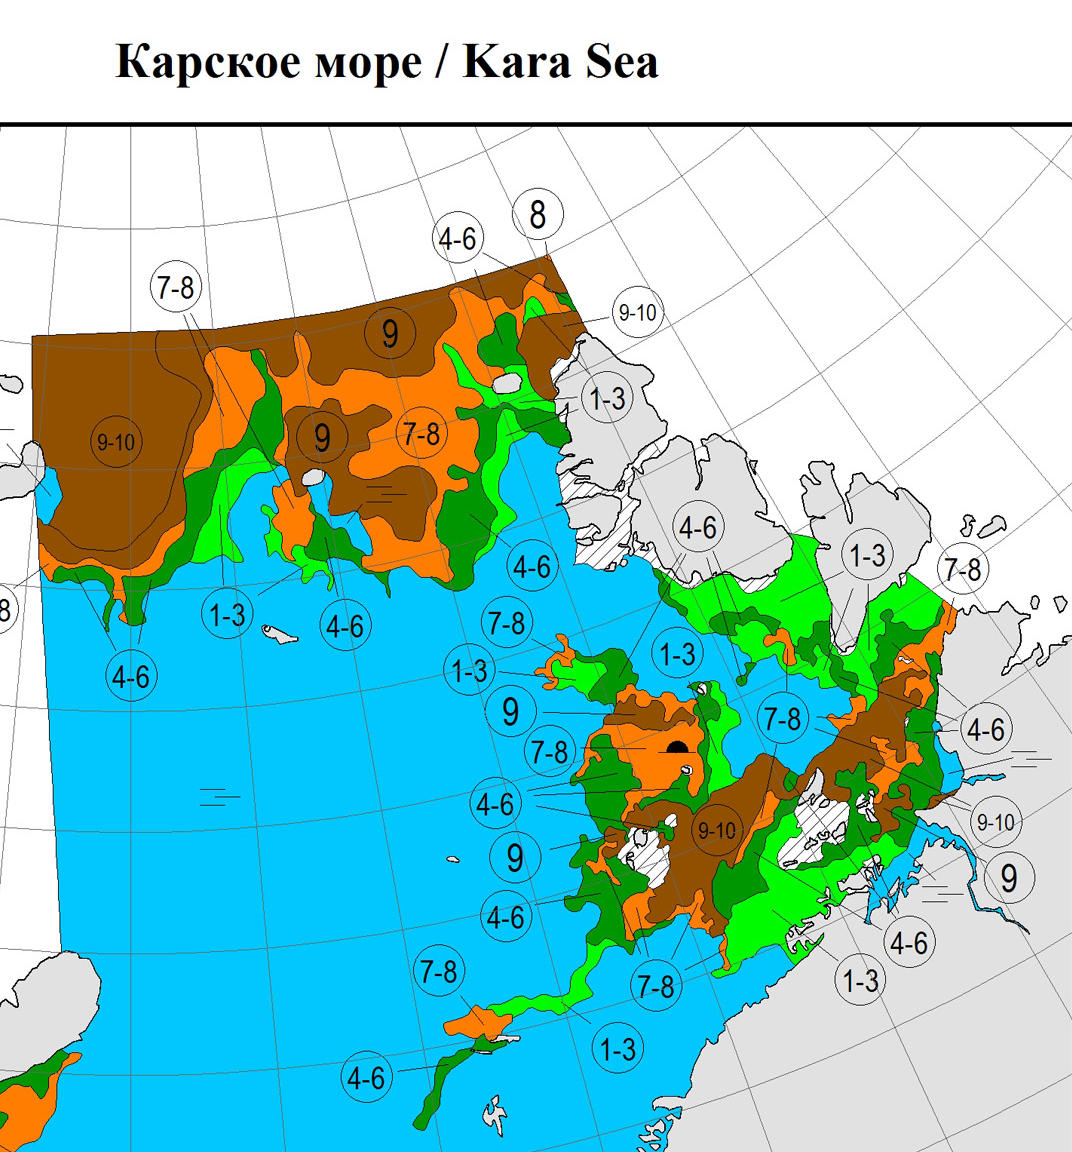
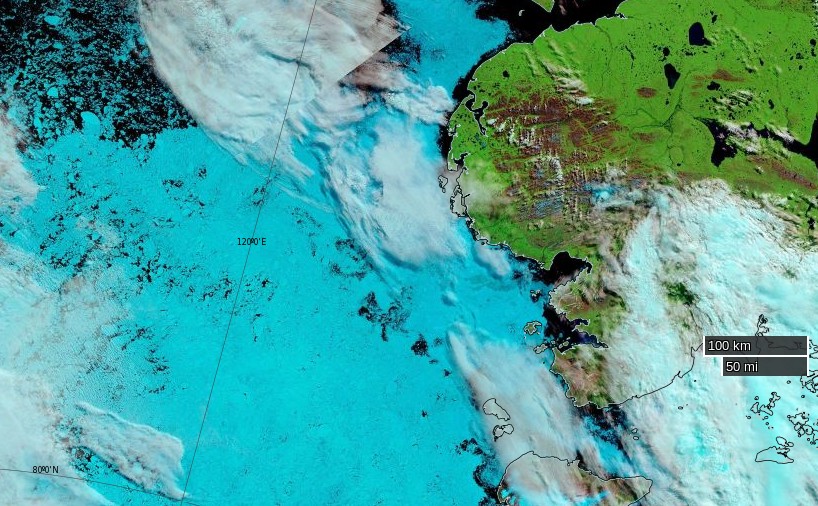
The Northern Sea Route has opened unusually early this year:
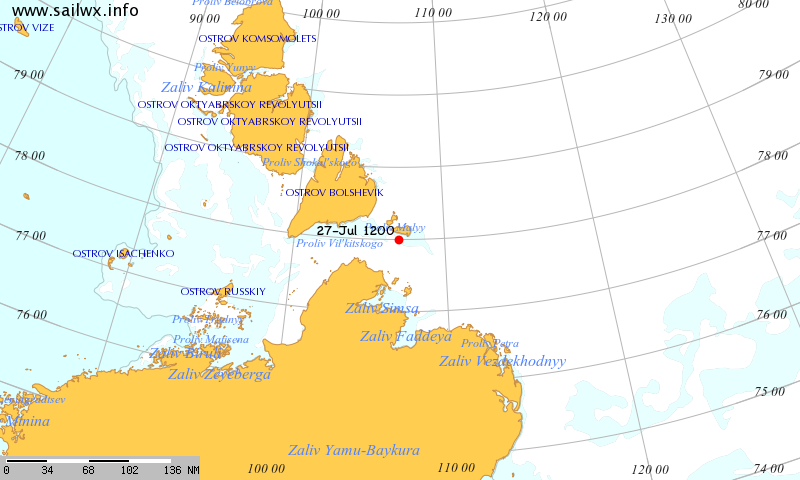
Based on the AMSR2 concentration maps from the University of Hamburg that happened on July 13th. The final choke point, as is so often the case, was the Vilkitsky Strait. According to the charts from the Russian Arctic and Antarctic Research Institute, by the 14th there was a narrow way through occupied by no more than 3/10 concentration ice:
[Edit – July 25th]
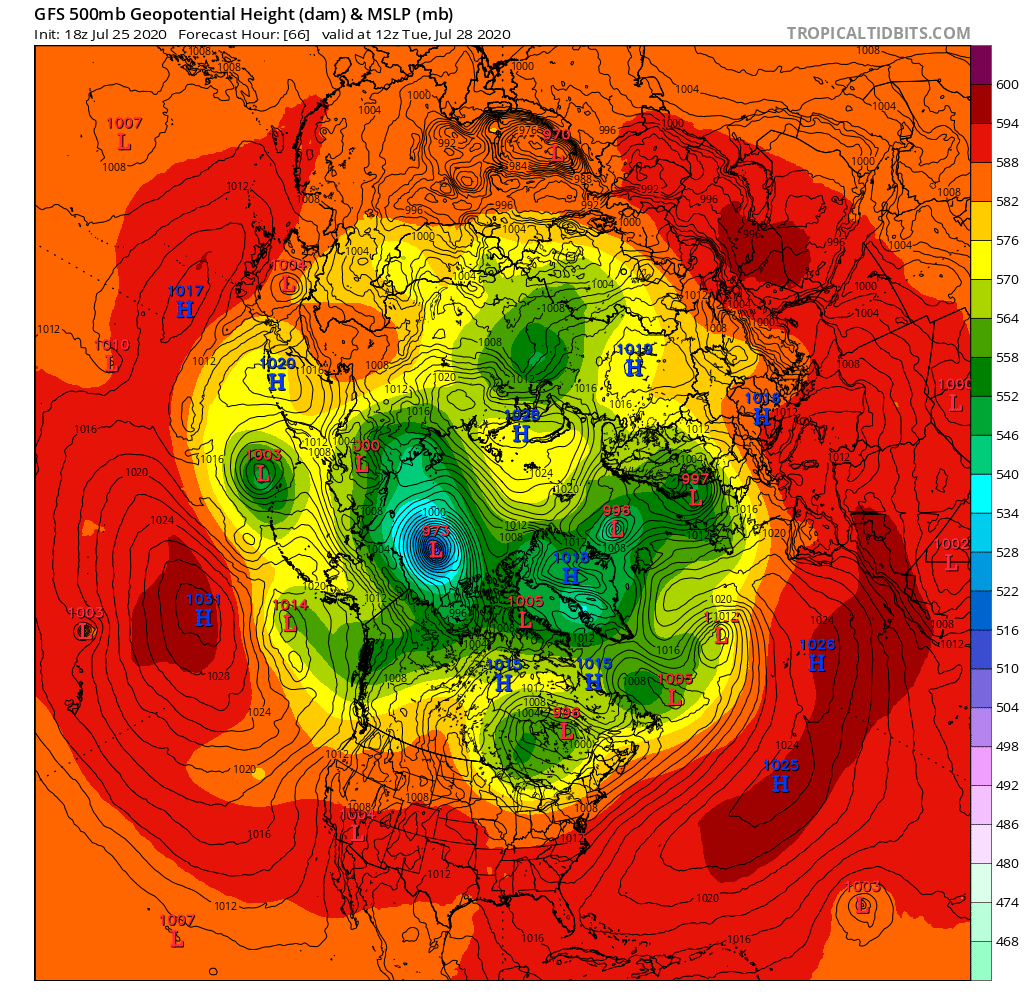
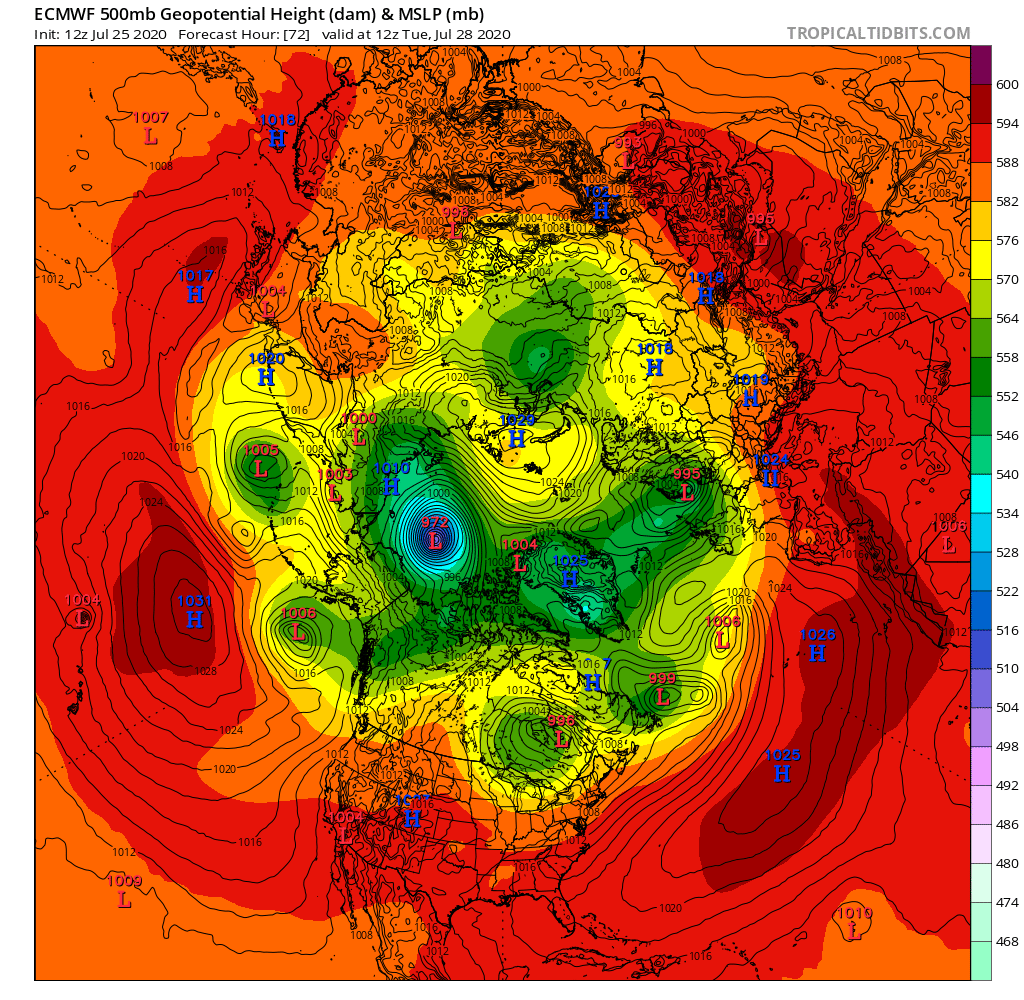
A mere three days away, and the GFS and ECMWF forecasts are in agreement, so there is a decent chance this setup will materialise in the real world:
A 972(ish) hPa MSLP cyclone sitting over the ice Beaufort Sea by 12Z on Tuesday.
[Edit – July 27th]
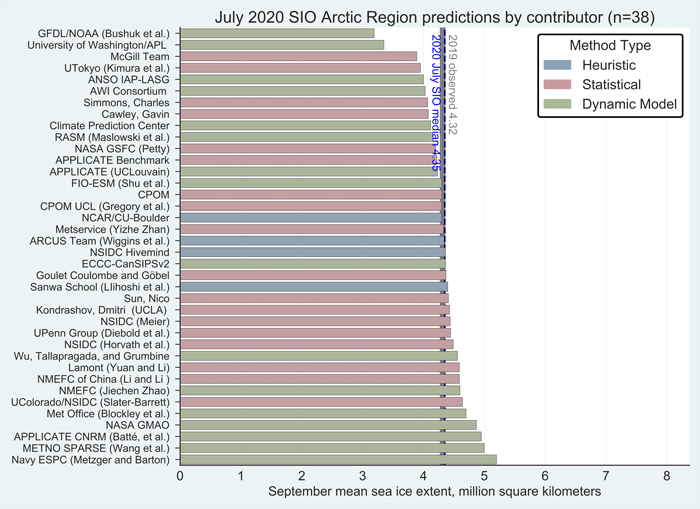
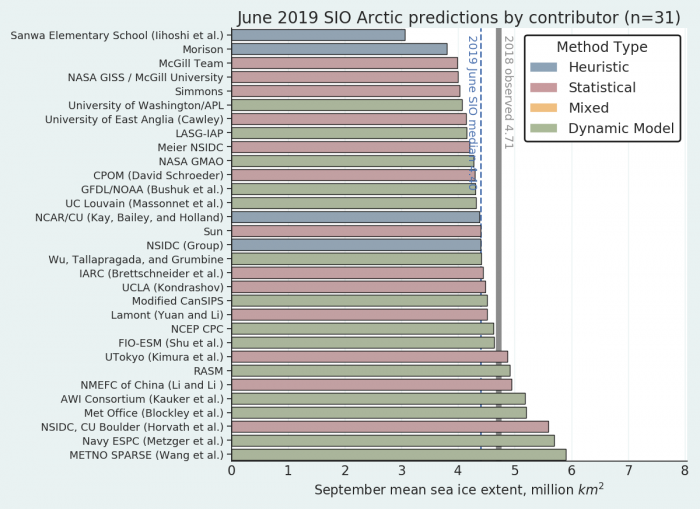
The Sea Ice Prediction Network July forecast for this year’s September minimum extent have been released. Here’s the graphical overview:
This year’s median projected value from the July forecasts of 4.3 million square kilometers is essentially identical to the median from the June forecasts. Quartiles are 4.1 and 4.6 million square kilometers. As was also the case for June, only two projections, both by dynamic models, are for a new record low, below the mark of 3.57 million square kilometers set in 2012. One dynamical model predicts the September sea-ice extent above 5.0 million square kilometers, compared to two in the June report.
Note that the numbers quoted are for the average NSIDC extent across the month of September, not the lowest daily JAXA extent, which I suggested earlier would be “below 4 million km²” this year.
Meanwhile over on Twitter this evening (UTC):
Stronger summer Arctic storms seems to be a consequence of climate change. But a deep cyclone in the central Arctic can help to accelerate sea ice melt even further.
The MSLP of the (Great?) Arctic cyclone sank below 970 hPa overnight:
After a fitful night's sleep what with one thing and another I wake to find that the (great?) #Arctic cyclone of July 2020 has sunk to a new low of 969 hPa.
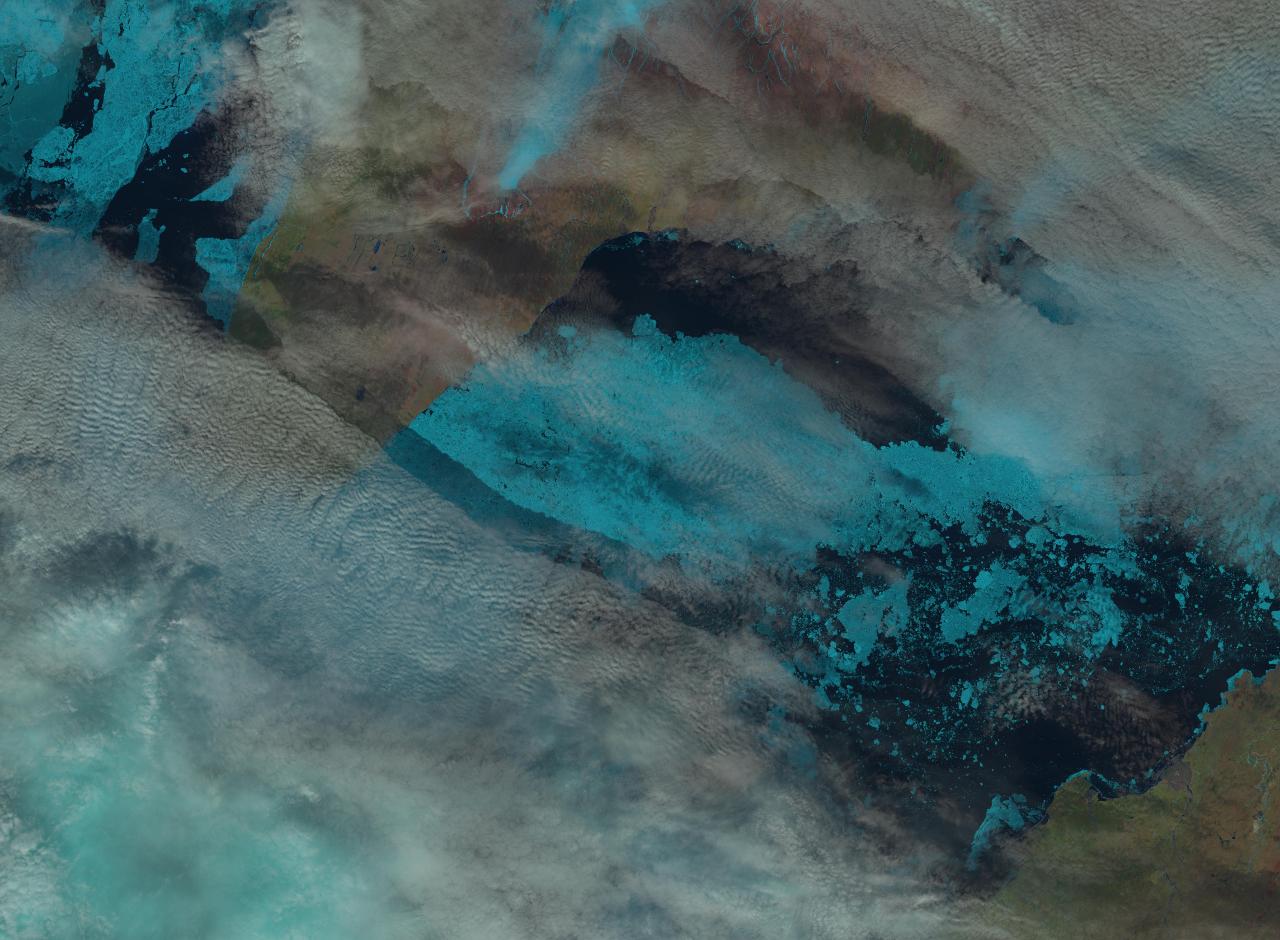
Here’s an early false colour snapshot of how (s)he looks from on high this afternoon (UTC), courtesy of the MODIS instrument on the Terra satellite:
[Edit – July 29th]
First up today we have a more complete “true colour” image of the cyclone doing its worst yesterday, including a fairly clear view in the bottom left corner of the initial damage to the sea ice covering the eastern Beaufort Sea. This one is from the Aqua satellite:
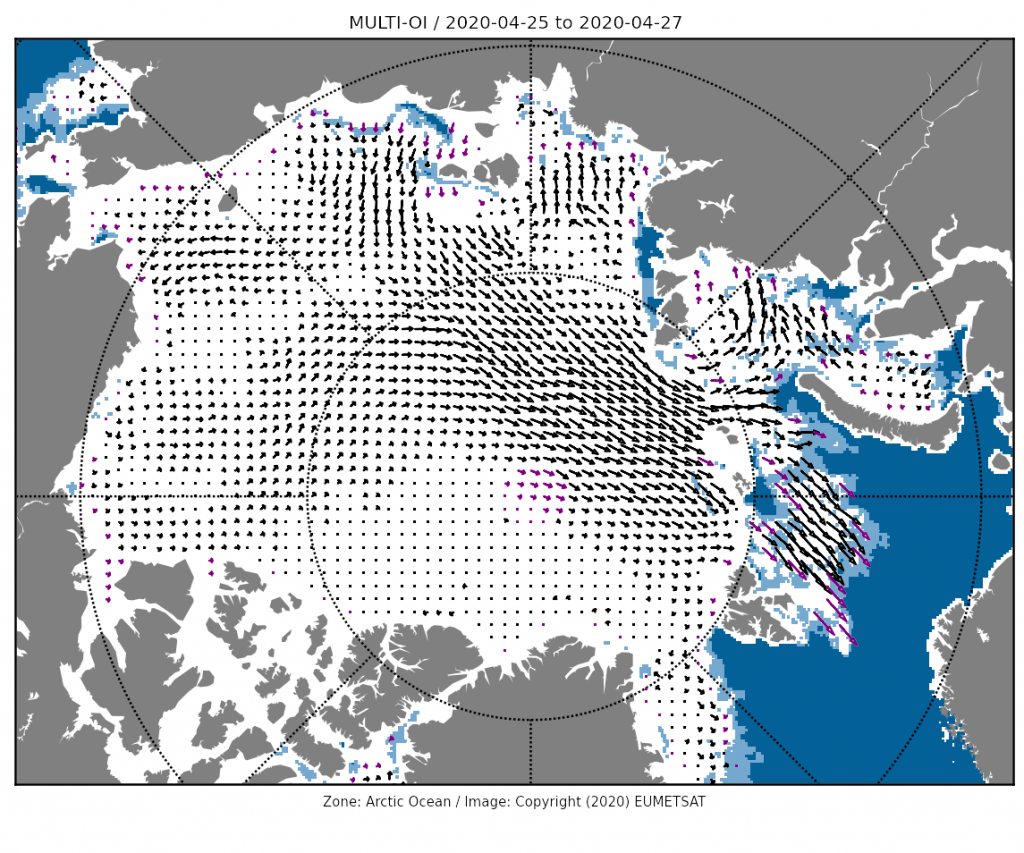
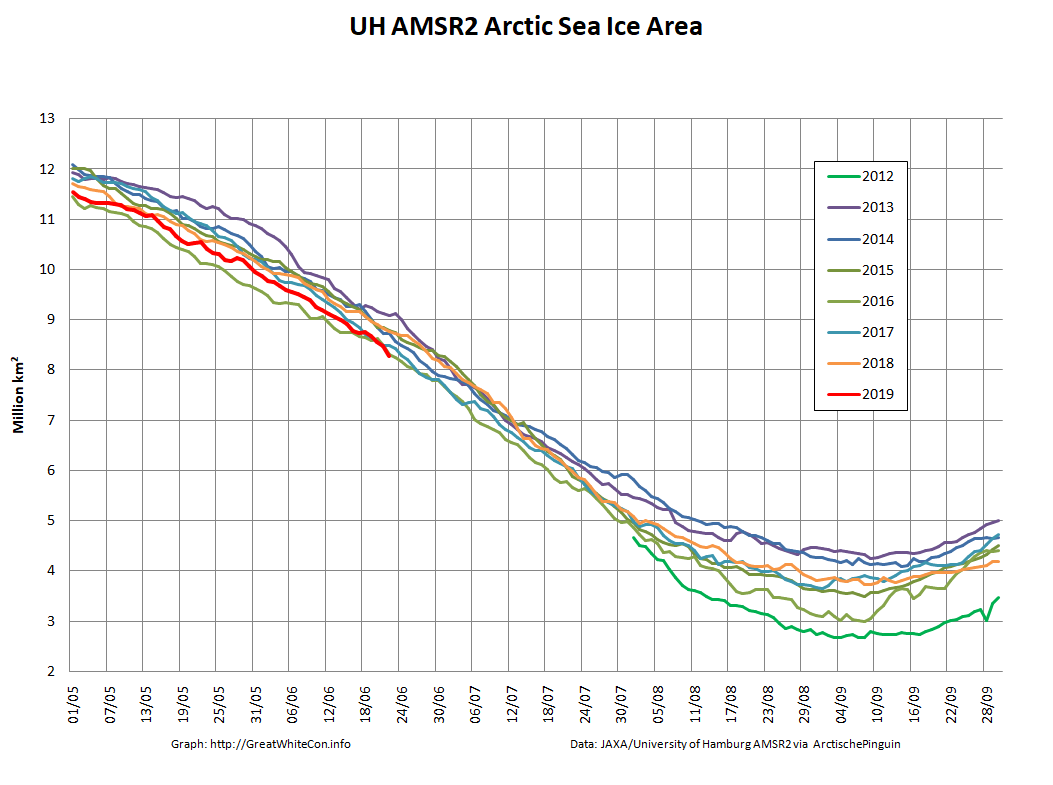
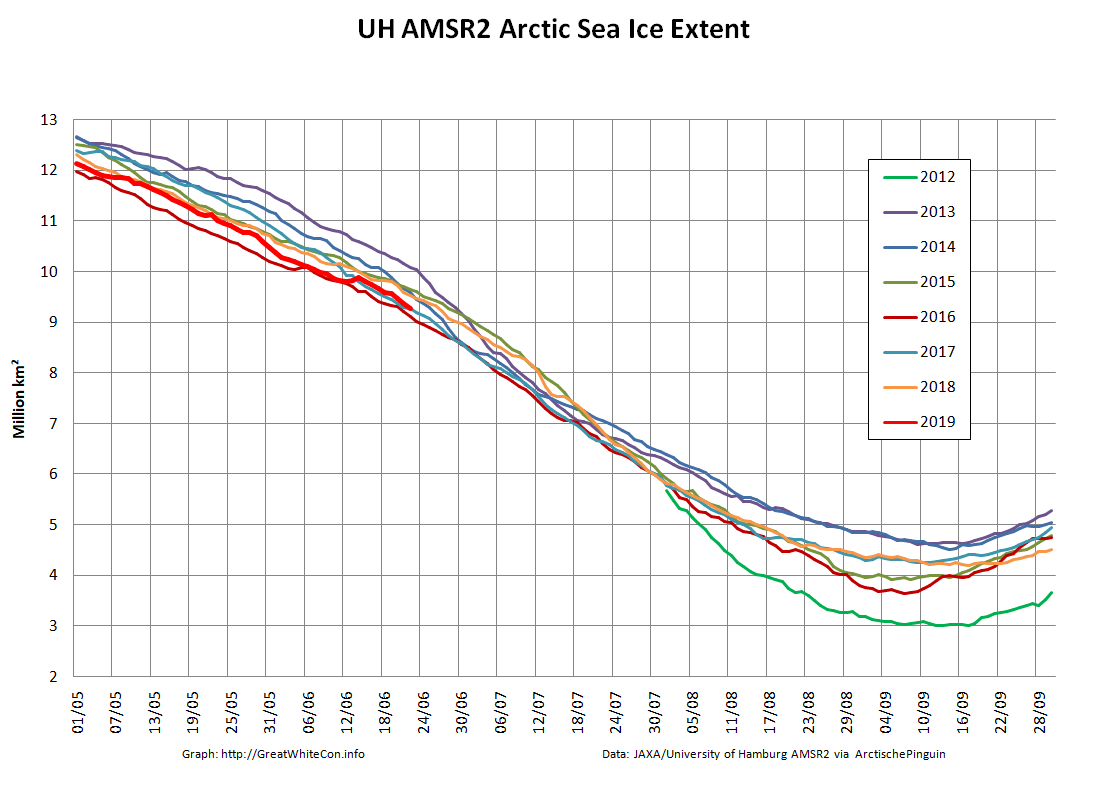
Let us begin this month’s report from the far north with the high resolution Arctic sea ice area and extent graphs based on the University of Hamburg’s AMSR2 concentration maps:
Area is currently lowest for the date in the AMSR2 record. After briefly occupying that position extent has increased over the last few days of April due to winds causing sea ice to move in the direction of the far North Atlantic:
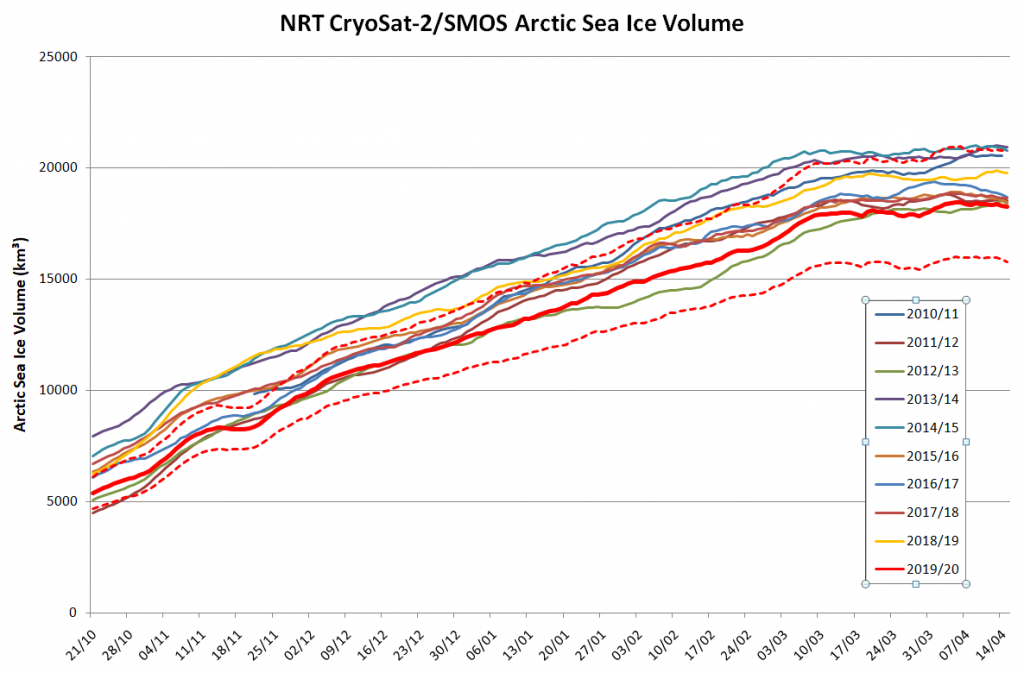
The Alfred Wegener Institute has now finished reanalysing their CryoSat-2/SMOS thickness data, and the resulting volume graph looks like this:
“Measured” Arctic sea ice volume is the lowest in the CryoSat-2 era as we head towards the main 2020 melting season, which in my calendar at least begins on June 1st. The PIOMAS modelled volume numbers should be released shortly.
[Edit – May 5th]
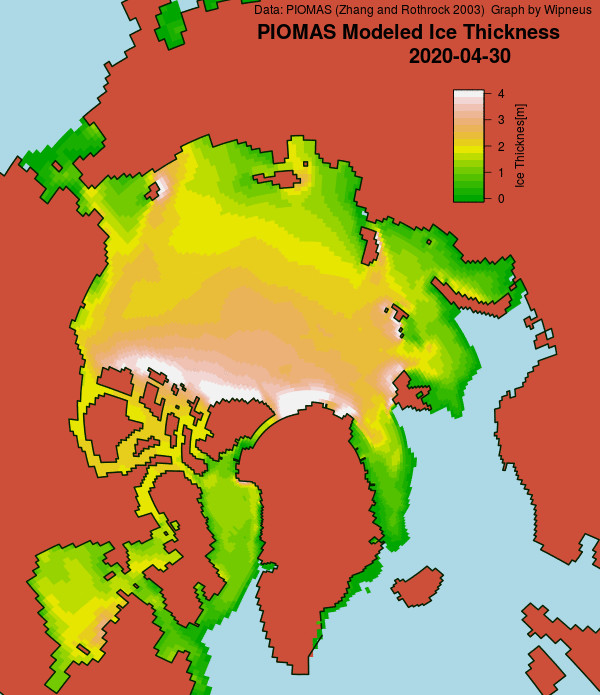
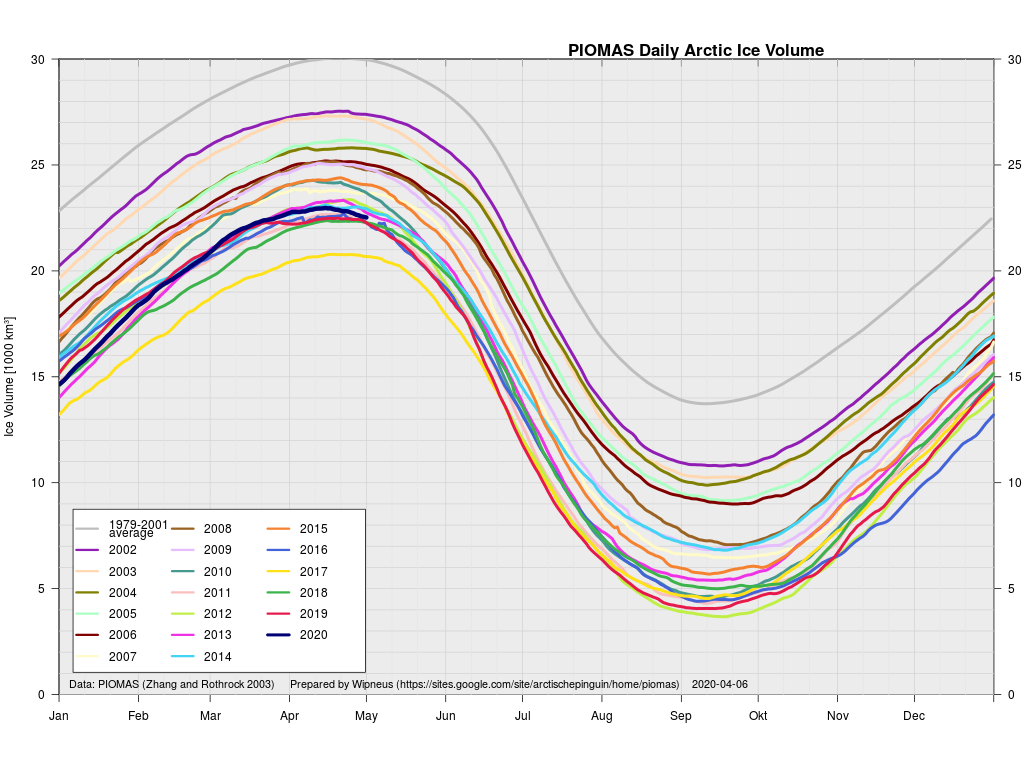
The April 30th PIOMAS gridded thickness numbers have been released, and Wipneus has worked his usual magic. By way of comparison with the AWI metric:
Obviously differing from CryoSat-2/SMOS, PIOMAS has 2020 volume a long way above 2017, in amongst a gaggle of other years.
[Edit – May 13th]
The middle of May is rapidly approaching, so let’s start to set the scene for the forthcoming melting season. First off here are the hi res AMSR2 area and extent graphs:
Extent is currently significantly above 2016 due to the recent “dispersion” mentioned above, but area is very close to an all time low for the date.
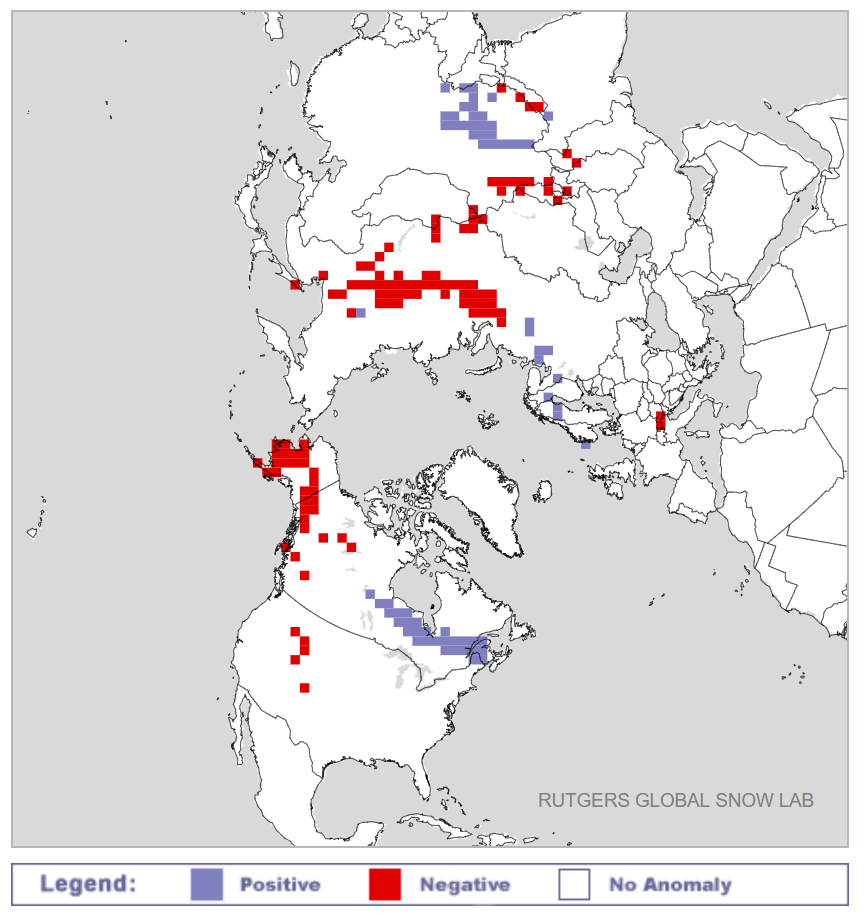
Next take a look at the current northern hemisphere snow cover anomalies from the Rutgers University Snow Lab:
Whilst there is a positive anomaly near Hudson Bay, there are significant negative anomalies across Siberia and Alaska. This does not augur well for sea ice retention along both the Northern Sea Route and Northwest Passage by September 2020.
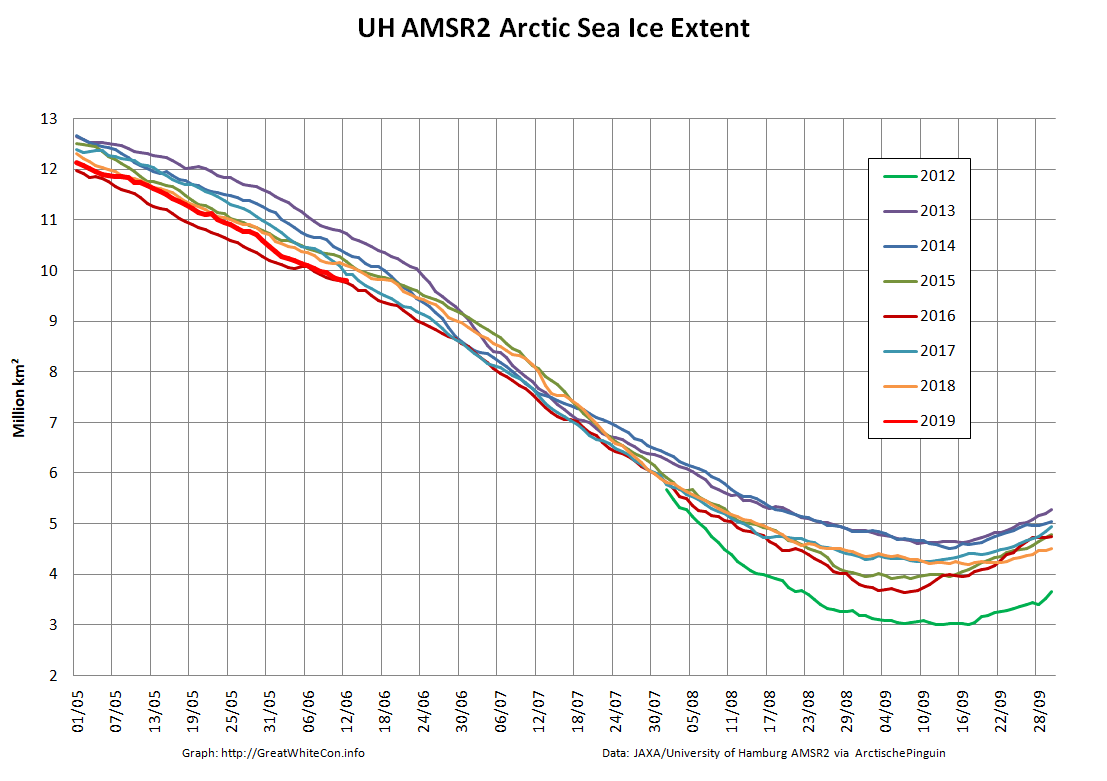
In my humble opinion summer in the Arctic summer starts on June 1st, so let’s check the current sea ice situation in the once frozen North. For details of the preconditioning of the ice during the Arctic spring see “Melt Pond May“, where I concluded that:
Compared with 2016 at the same time of year I am compelled to say that with June 1st just around the corner the 2019 summer melting season is primed to progress more quickly.
Currently extent is significantly below 2012, albeit somewhat above 2016 at the same time of year. And what of melt ponds? In 2012 there was evidence of less snow cover over land and more surface water on the ice on the Siberian side of the Arctic. Other than that Arctic sea ice in 2019 looks to be in worse shape than in 2012.
And how have things progressed over the last few days? Take a look at this:
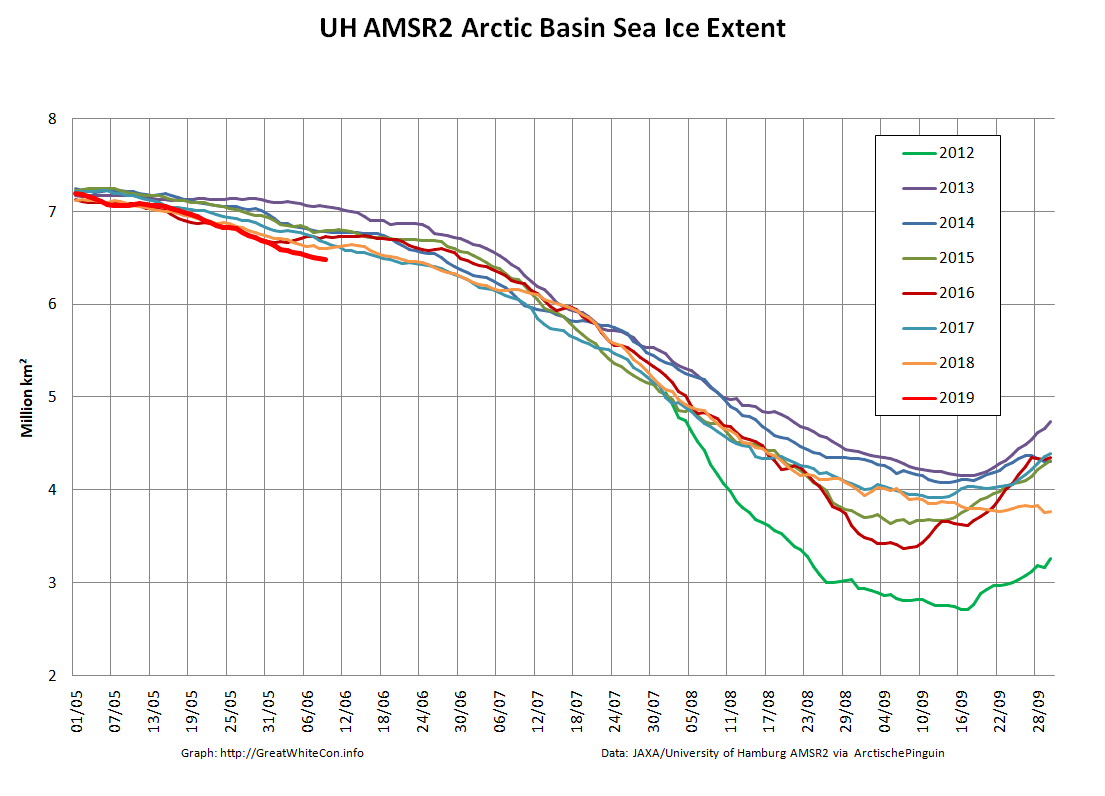
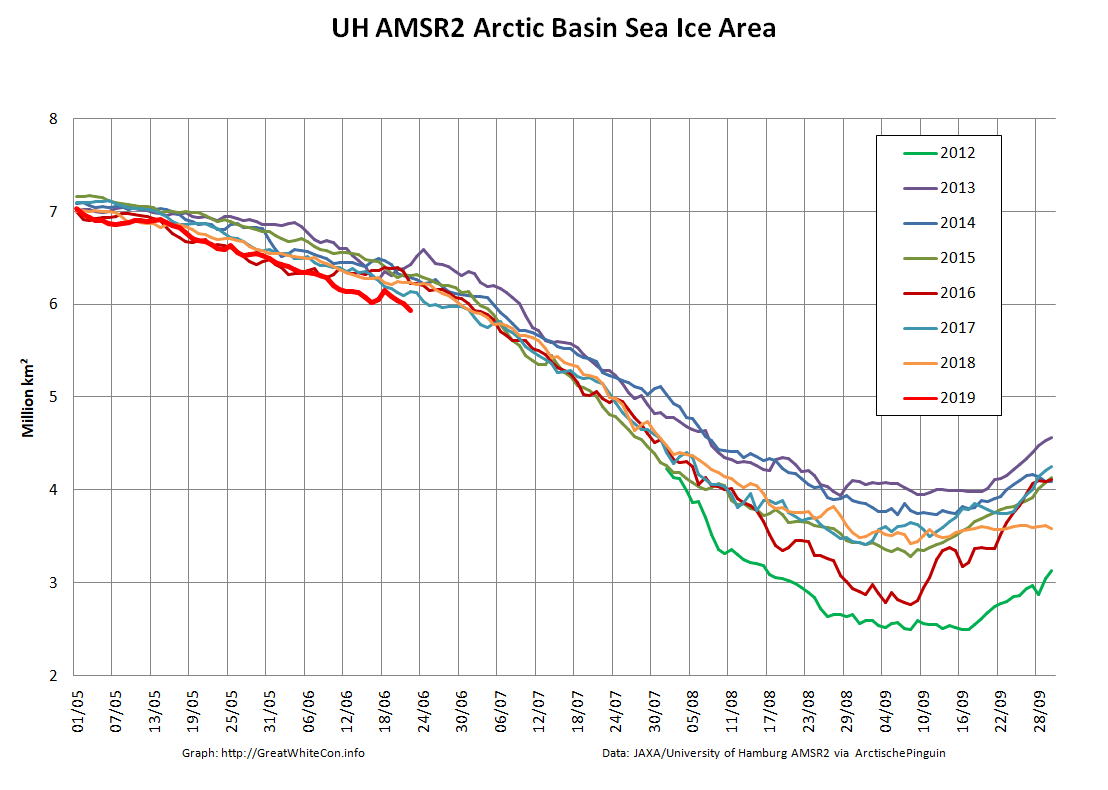
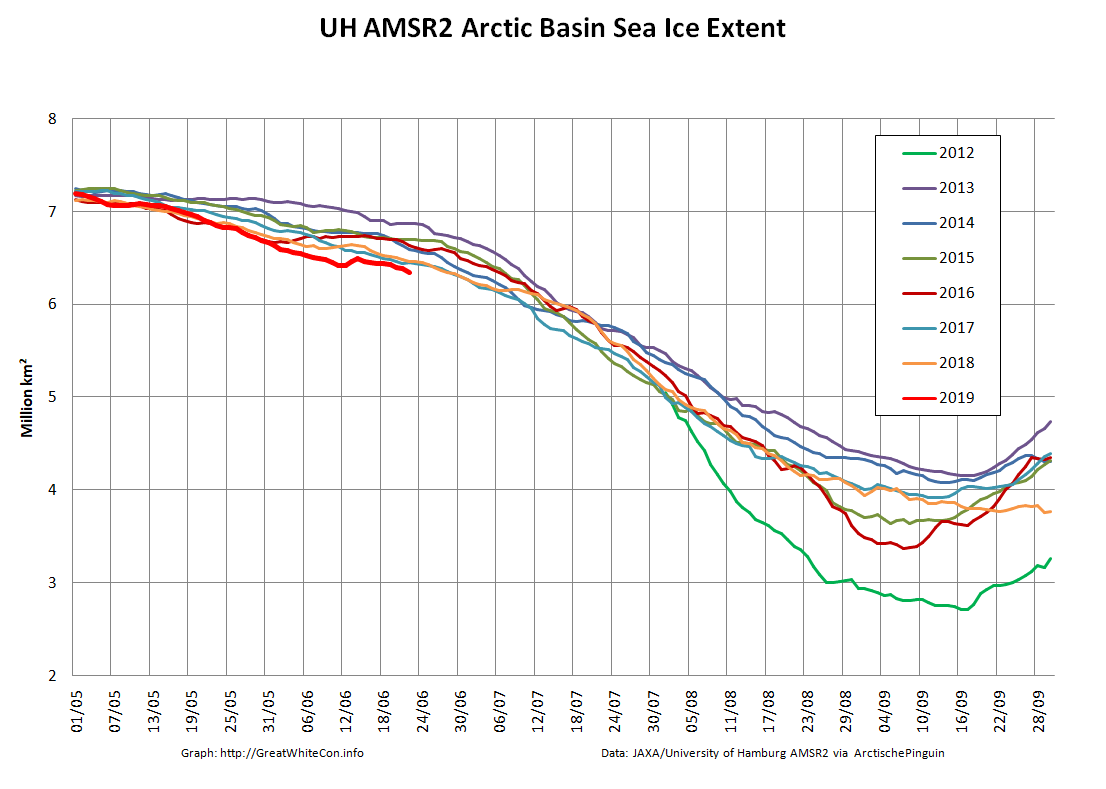
Our “Arctic Basin” metric encompasses the Central Arctic plus the Beaufort, Chukchi, East Siberian and Laptev Seas. It is currently headed into uncharted waters. The effect on overall Arctic sea ice extent is also readily visible:
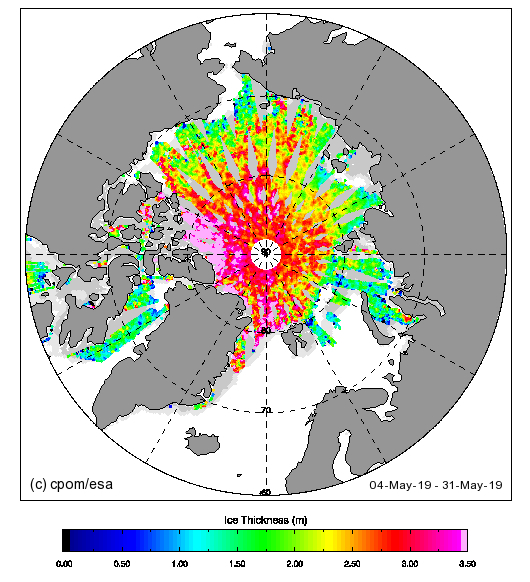
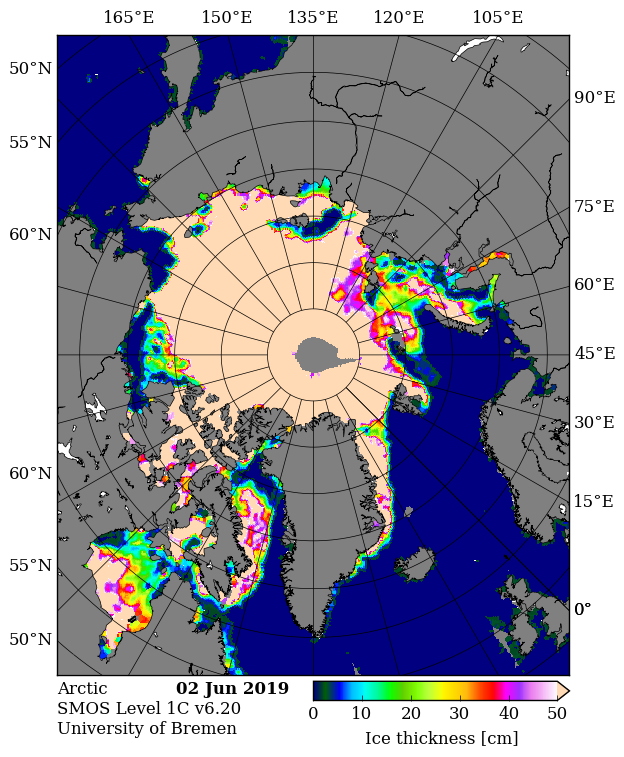
This year both the CPOM version of CryoSat-2 thickness and the University of Bremen’s SMOS thickness maps are continuing to be published during the melting season:
Take them with a large pinch of salt at this time of year!
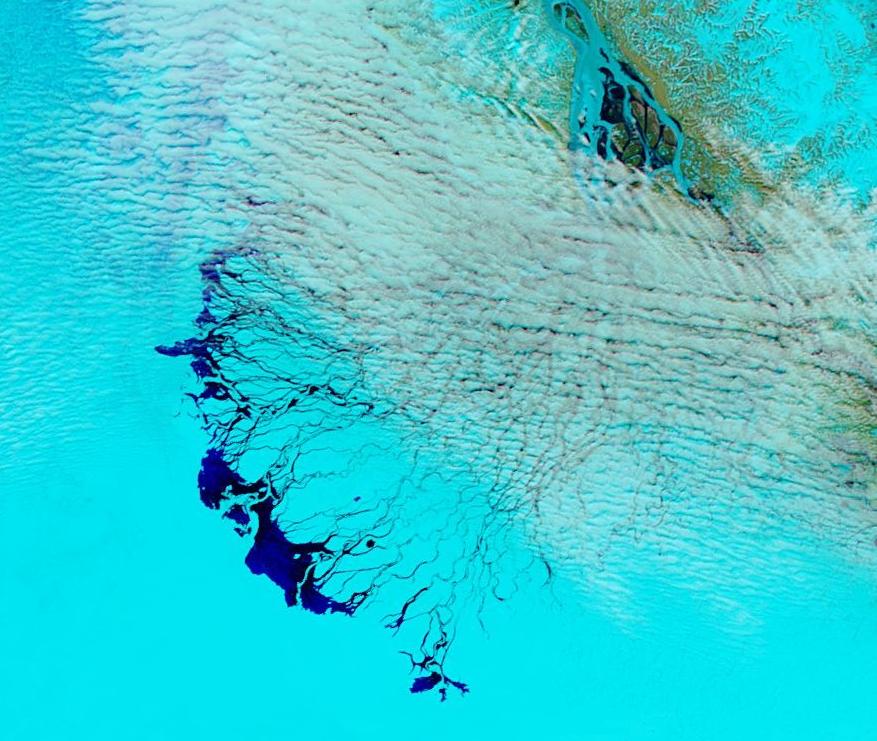
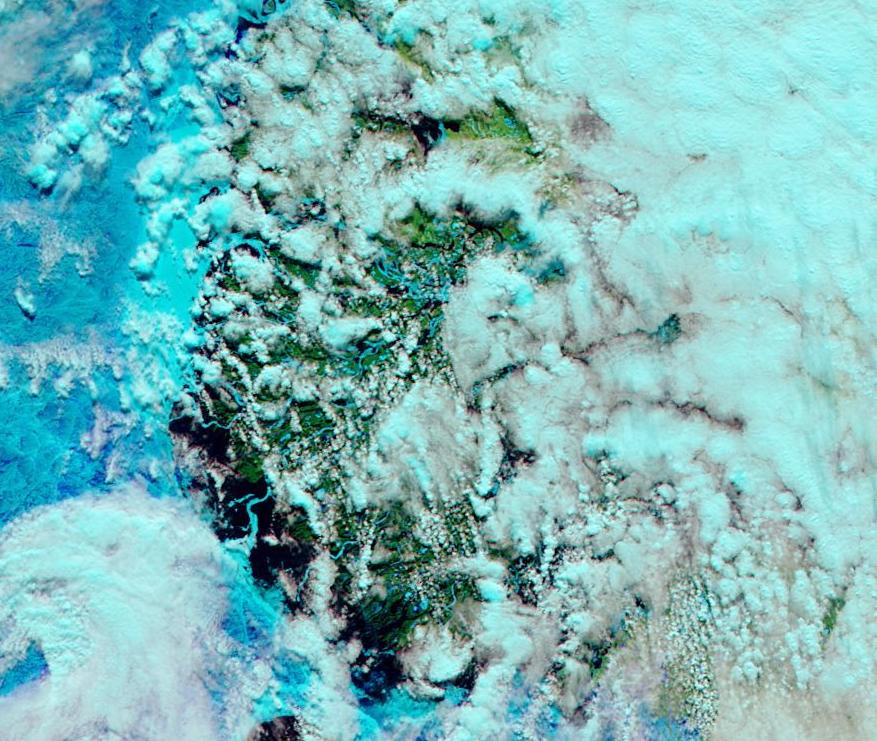
Finally, for the moment at least, liquid water is starting to seep out of the Lena Delta:
NASA Worldview “false-color” image of the Lena Delta on June 3rd 2019, derived from the MODIS sensor on the Aqua satellite
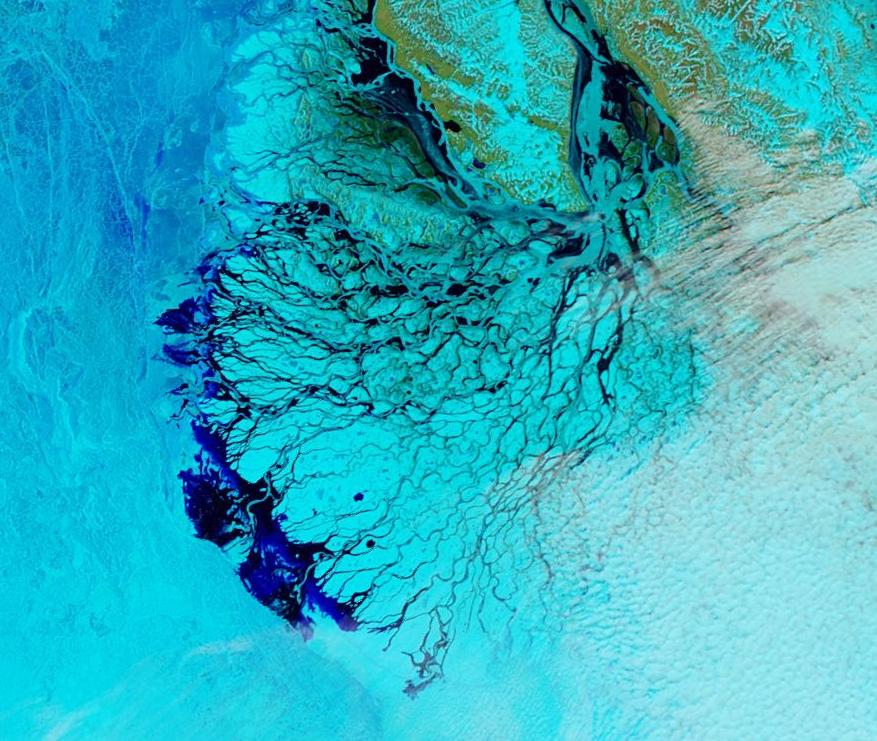
For comparison purposes please also take a look at the same date in 2016:
NASA Worldview “false-color” image of the Lena Delta on June 3rd 2016, derived from the MODIS sensor on the Aqua satellite
and the previous date in 2012:
NASA Worldview “false-color” image of the Lena Delta on June 2nd 2012, derived from the MODIS sensor on the Aqua satellite
[Edit – June 4th]
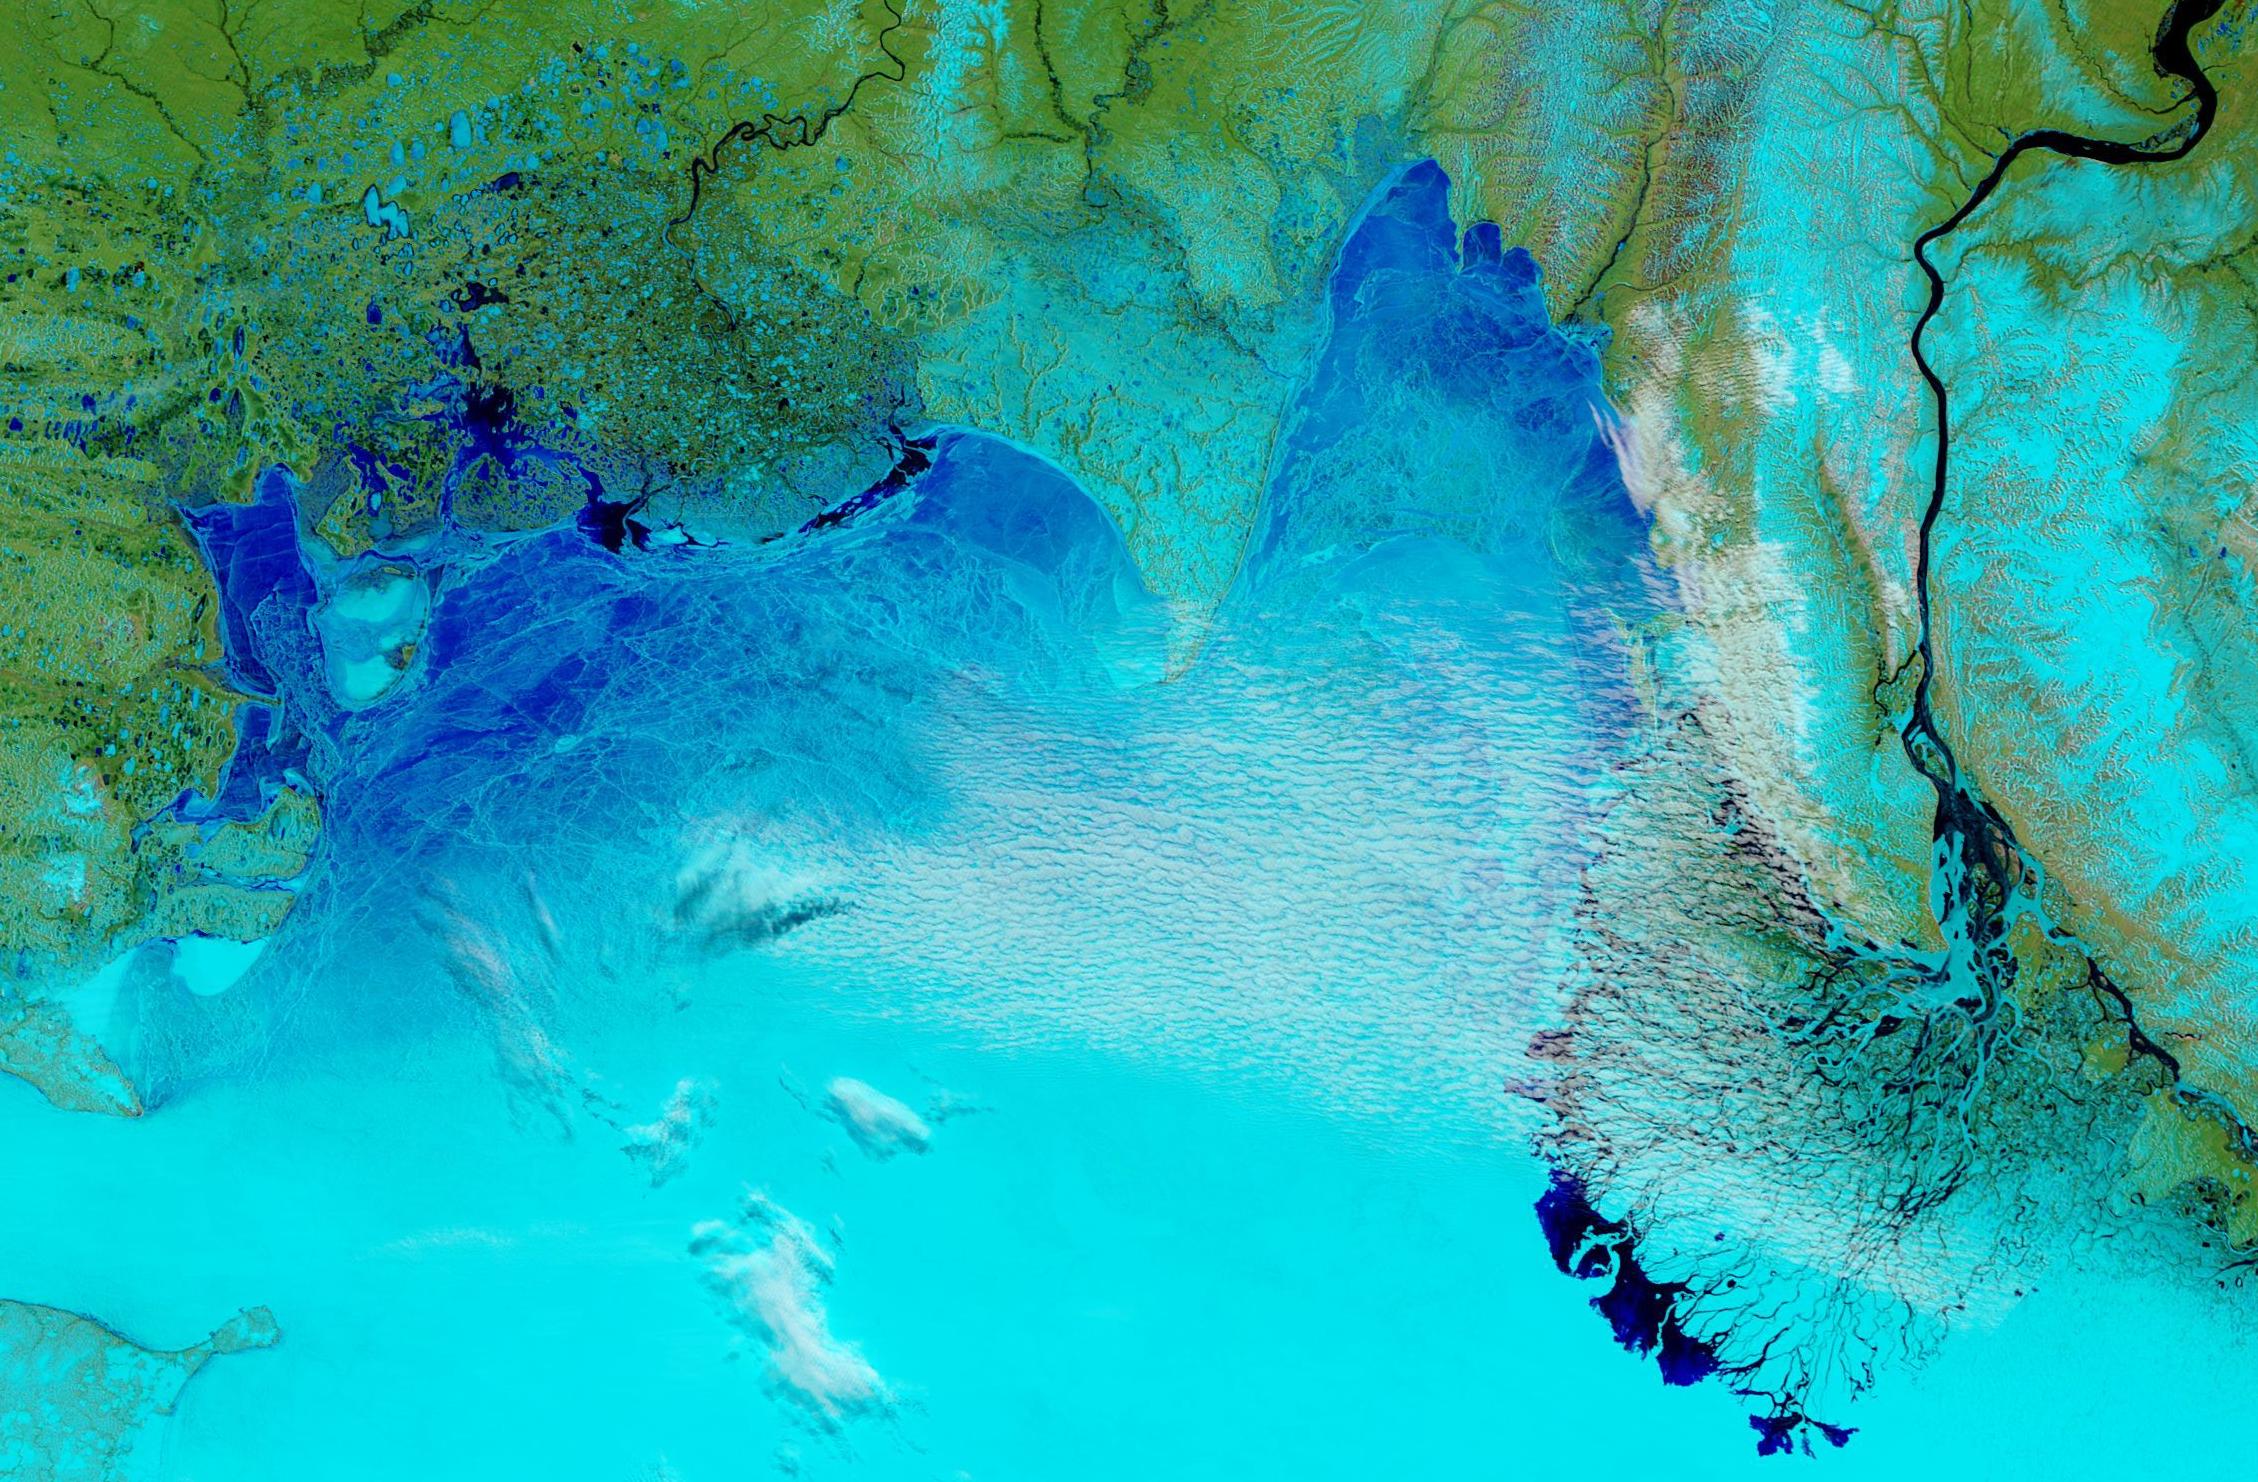
A significant area of the Laptev Sea ice is now turning a much darker shade of blue using the band 7-2-1 false colour combination:
NASA Worldview “false-color” image of the Laptev Sea on June 4th 2019, derived from the MODIS sensor on the Terra satellite
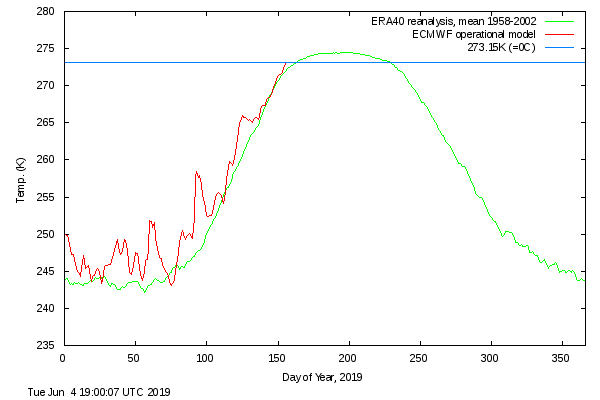
In addition the DMI >80N temperature metric has reached the zero Celsius line well ahead of schedule:
[Edit – June 5th]
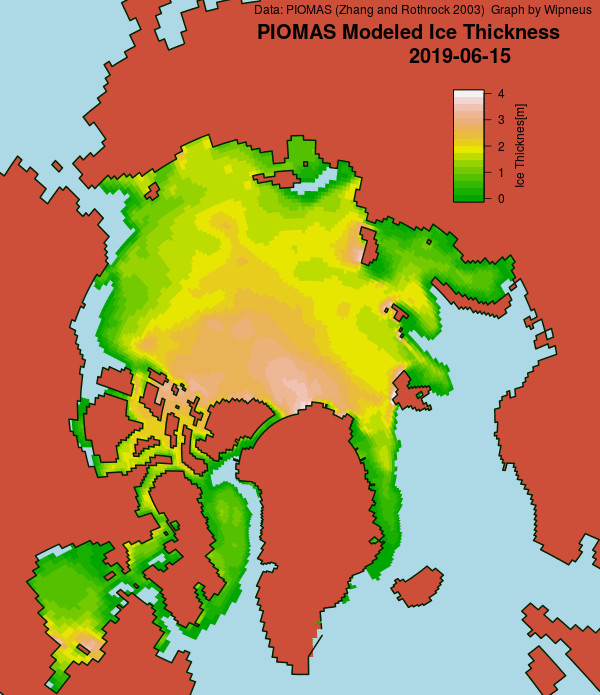
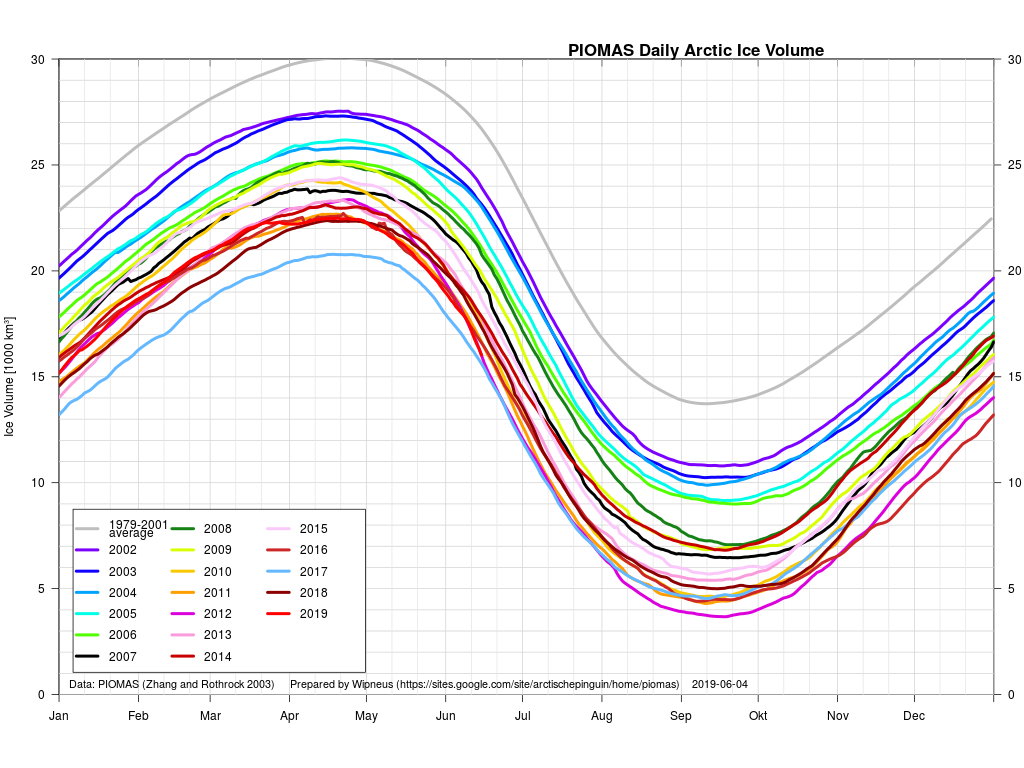
The May PIOMAS numbers have been released! Here is the Wipneus generated state of play on May 31st:
Any early bird traversing the Northwest Passage from west to east could now sail through open water around Point Barrow, along the Alaskan and Canadian coast and into the Amundsen Gulf:
Arctic Basin sea ice extent is still descending through uncharted territory:
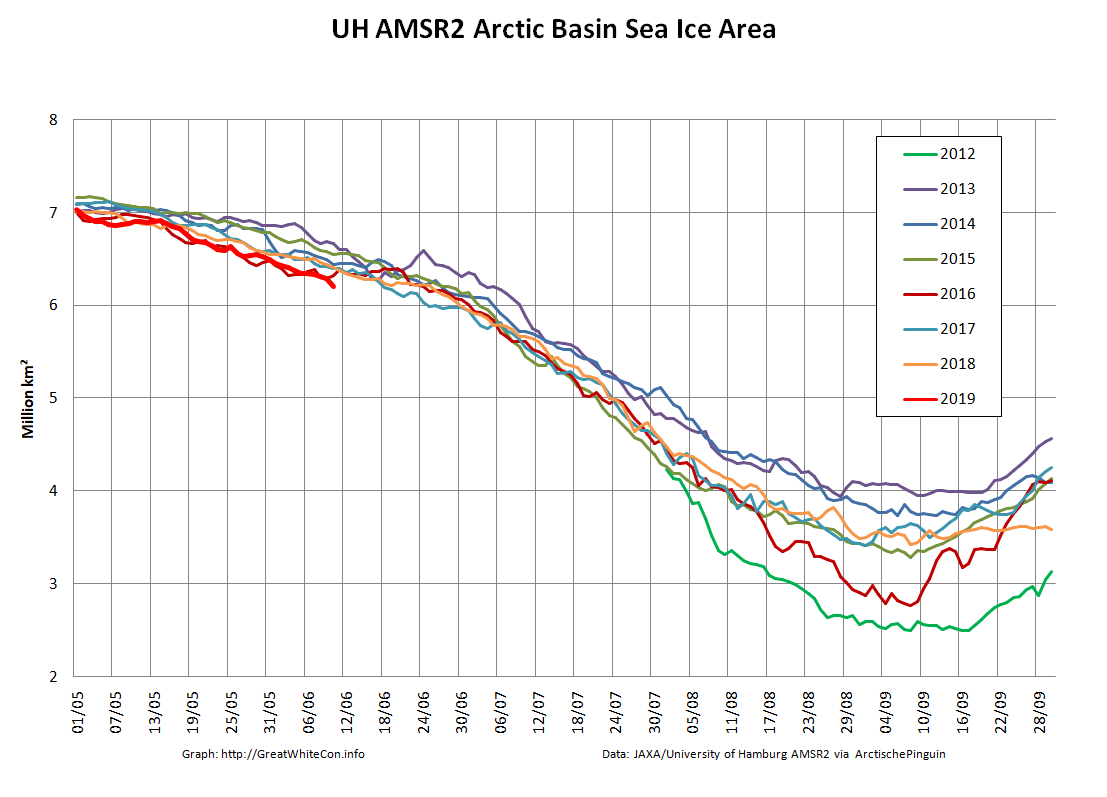
and Basin area currently looks poised to follow suit:
[Edit – June 11th]
There’s a beautifully clear view of the Siberian coast today, with vast areas of melt ponds visible on VIIRS false colour:
NASA Worldview “false-color” image of the Laptev & East Siberian Seas on June 11th 2019, derived from the VIIRS sensor on the Suomi satellite
The Arctic Basin area has indeed taken a nosedive into uncharted territory:
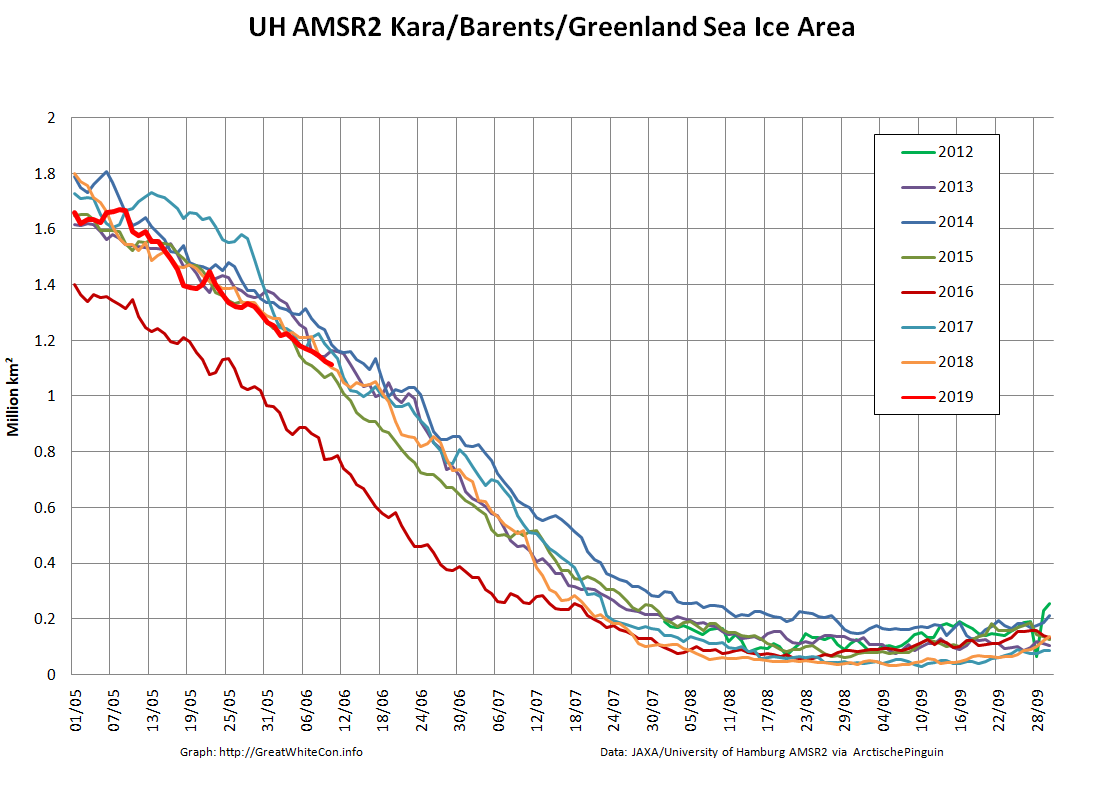
By way of comparison sea ice area on the Atlantic periphery is in amongst the recent pack, thanks to the almost continual drift in that direction over last winter:
[Edit – June 13th]
High resolution AMSR2 extent has been in a “statistical tie” with 2016 for a few days:
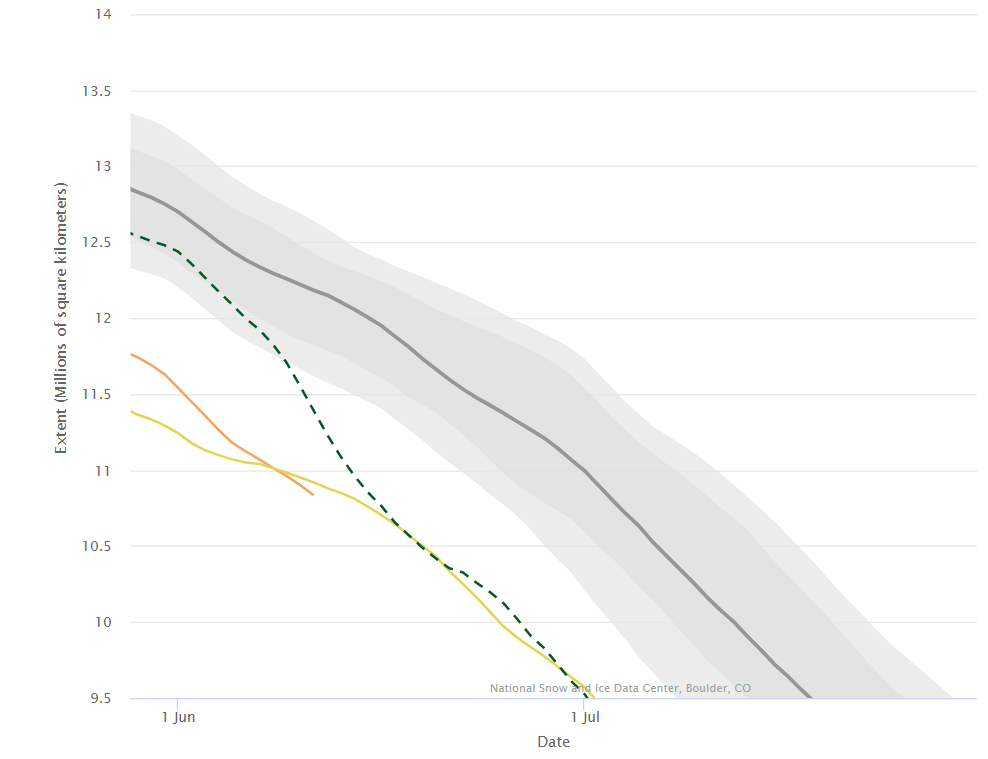
However the NSIDC’s 5 day average extent has reached a clear new low for the date, in the satellite record at least:
[Edit – June 14th]
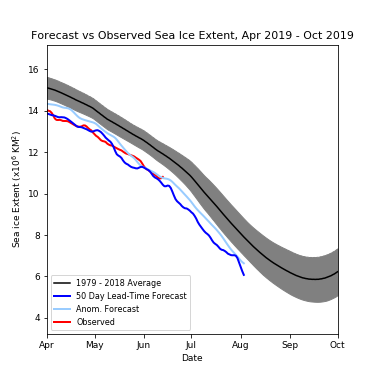
Especially for AJBT, here’s the Slater Probabilistic Ice Extent prediction for August 3rd:
and here’s the current DMI >80N temperature graph:
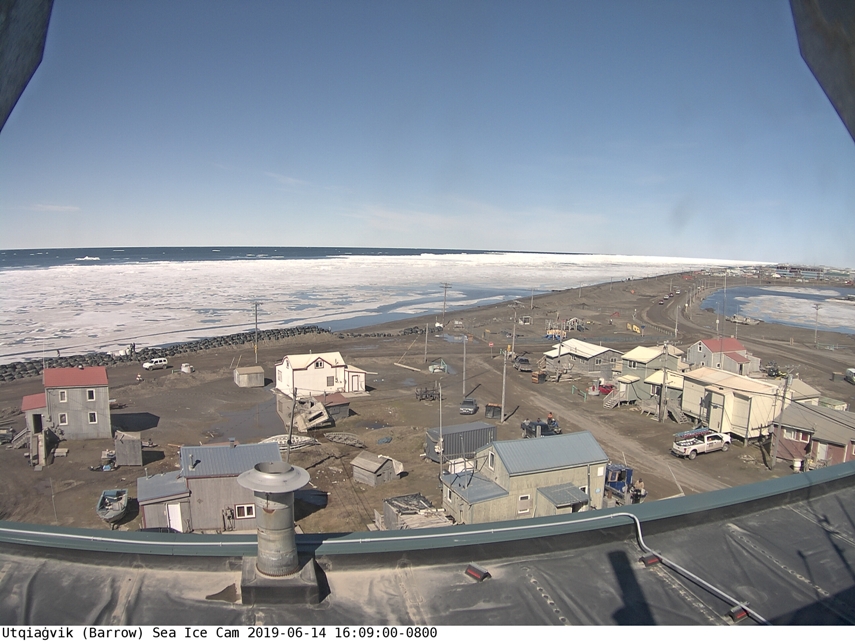
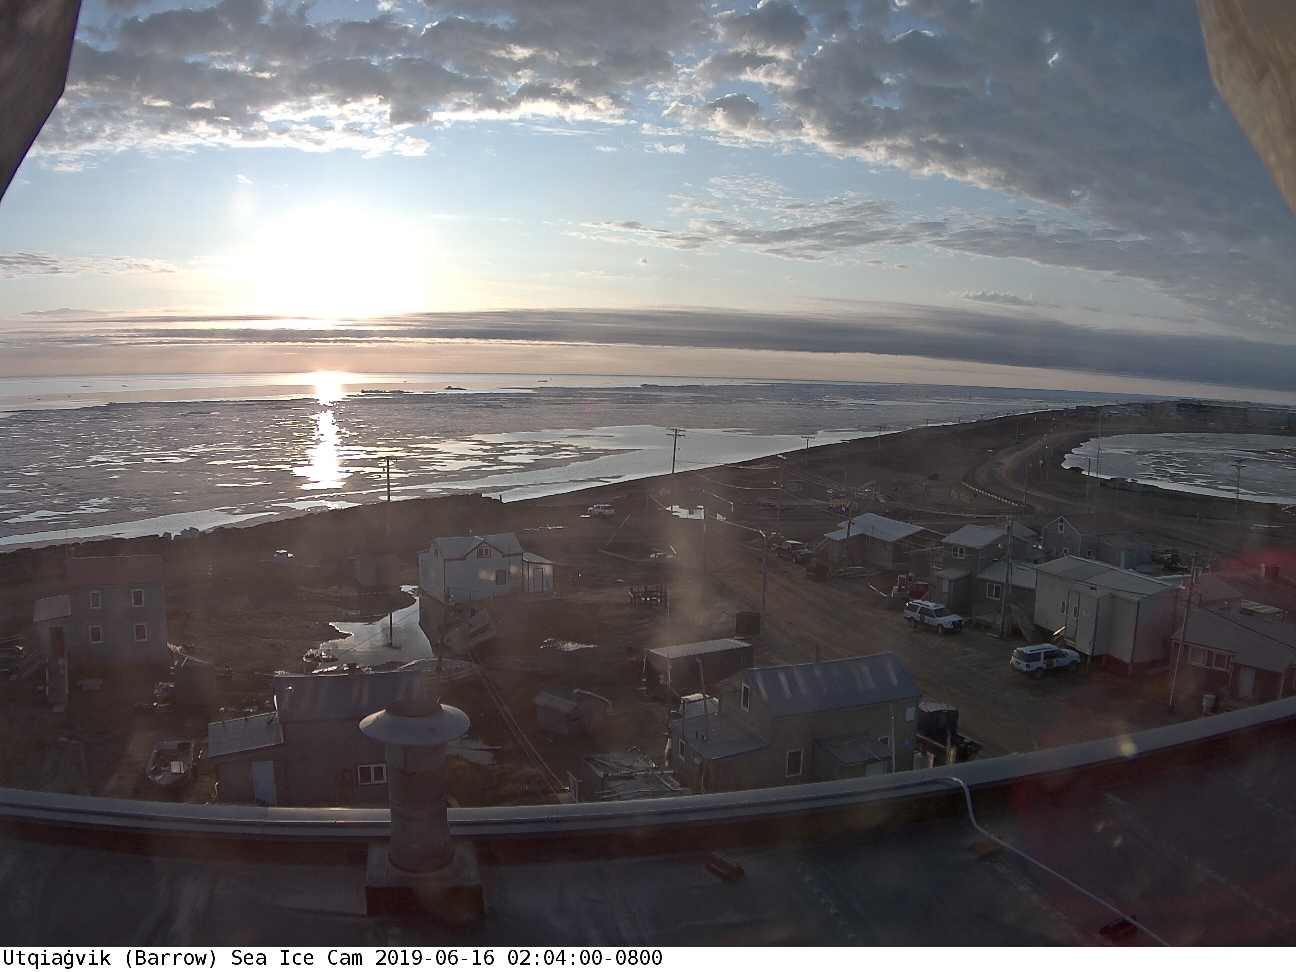
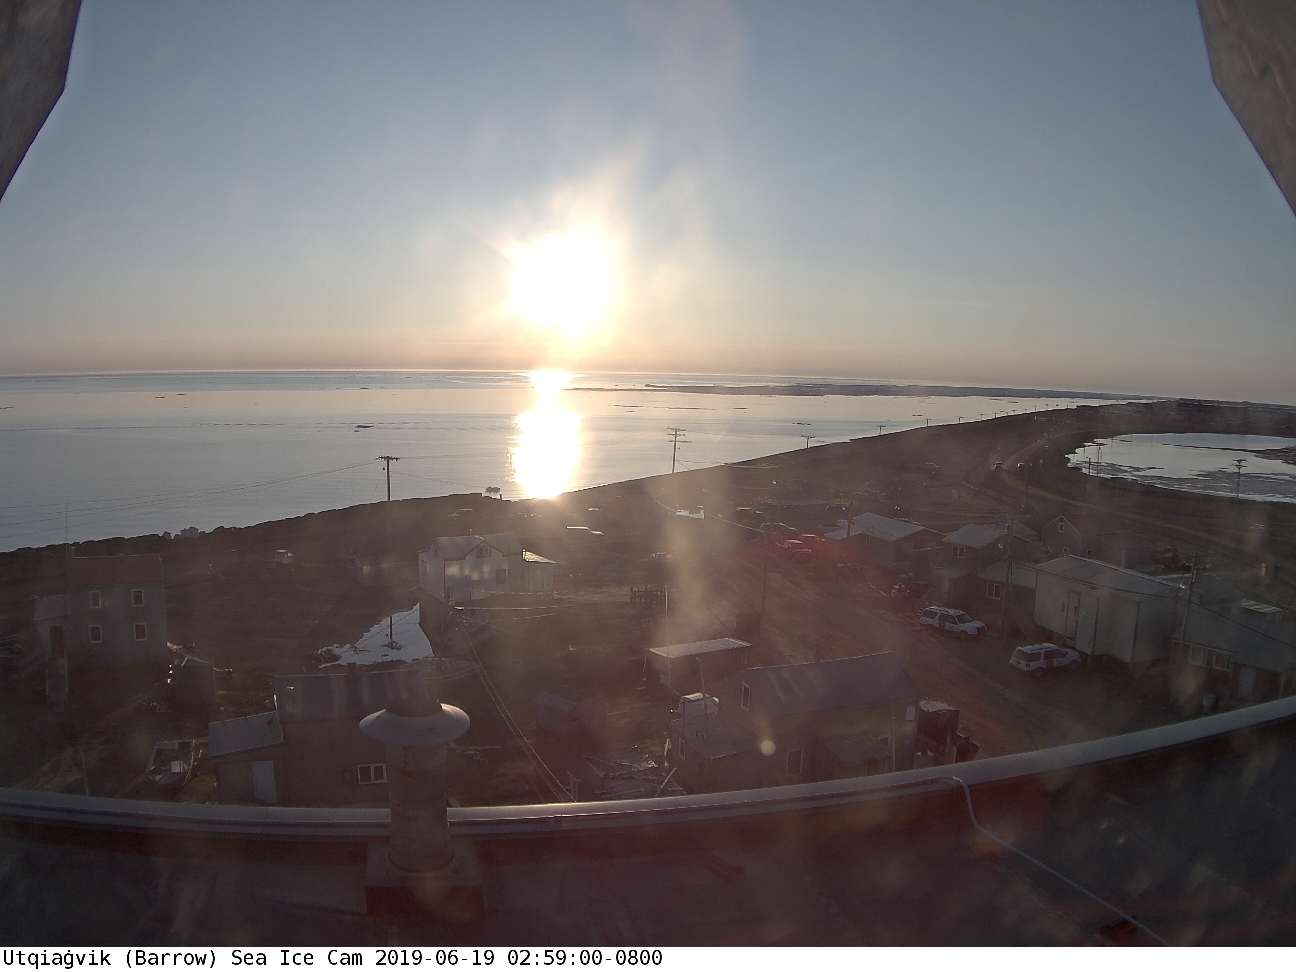
Finally, for the moment at least, there is not very much fast ice left at Utqiaġvik:
[Edit – June 15th]
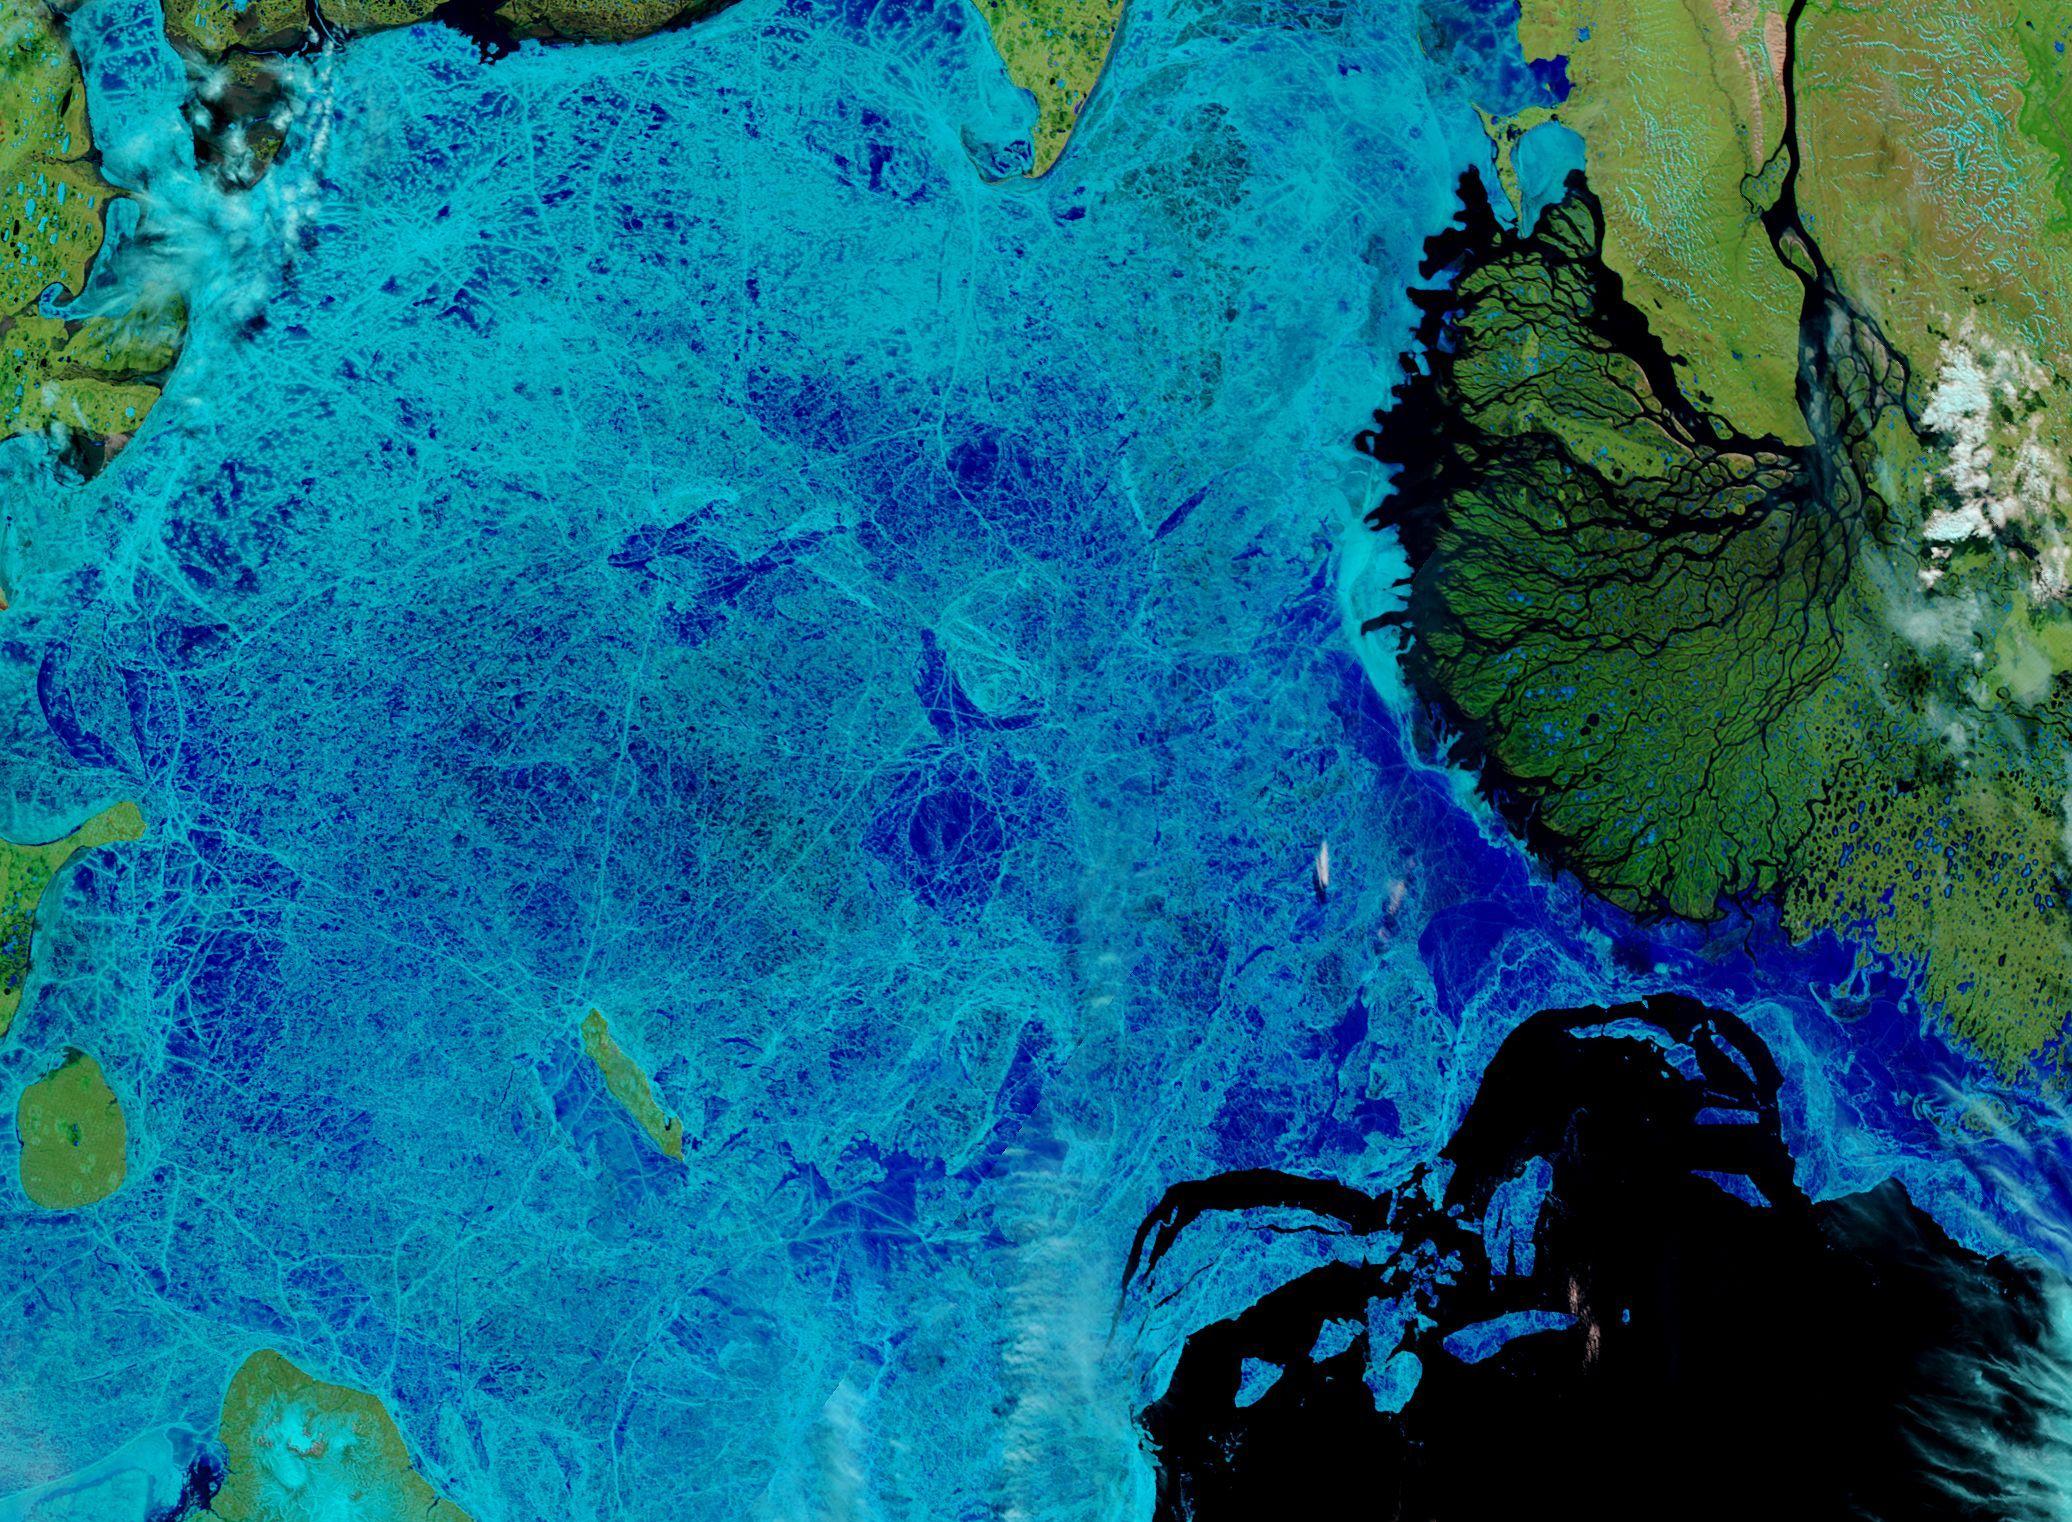
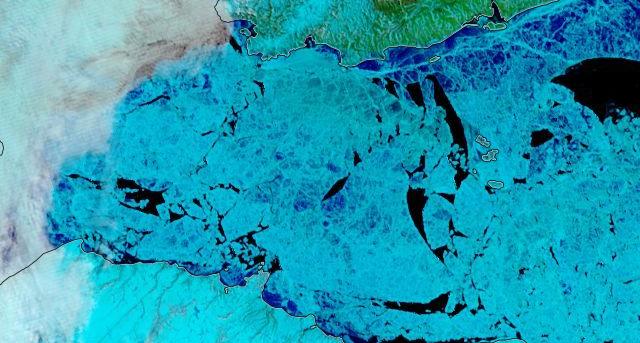
The sea ice in the Laptev Sea is starting to break up:
NASA Worldview “false-color” image of the Laptev Sea on June 15th 2019, derived from the MODIS sensor on the Terra satellite
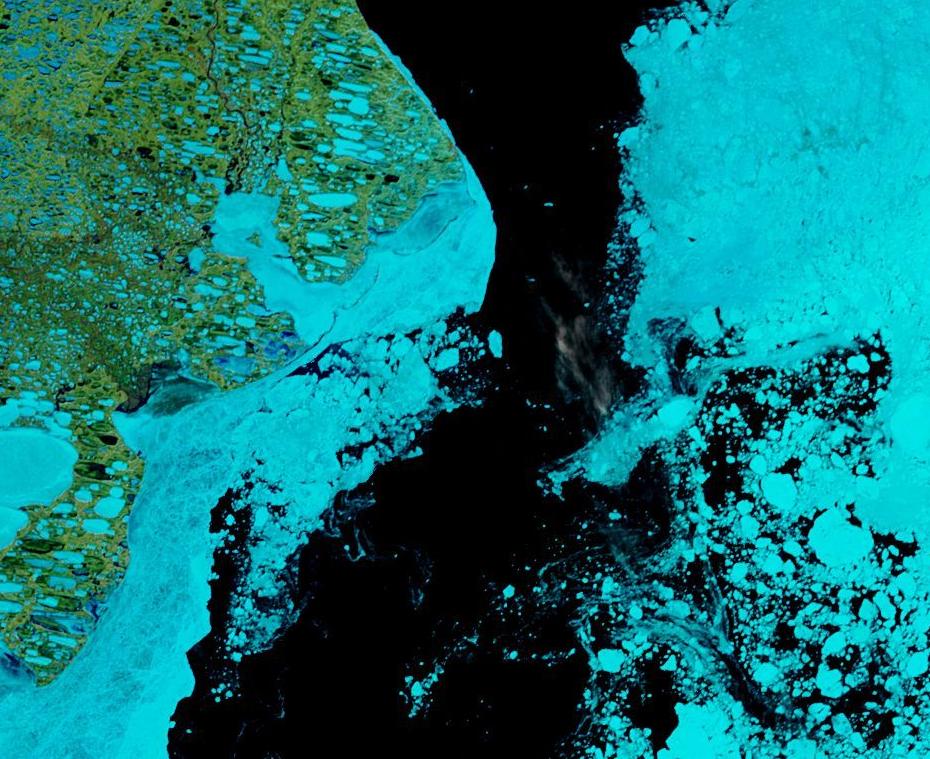
As is the fast ice in the Beaufort Sea:
NASA Worldview “false-color” image of the Beaufort Sea on June 14th 2019, derived from the MODIS sensor on the Terra satellite
Meanwhile the MSLP of the cyclone currently spinning over Severnaya Zemlya was down to 976 hPa at 06:00 UTC this morning:
NASA Worldview “false-color” image of the Kara Sea on June 15th 2019, derived from the MODIS sensor on the Terra satellite
Again, as in previous years, the spread in the dynamical models are larger compared with statistical models. Overall, the heuristic method has the lowest projected September sea-ice extent value with a median at 4.09 million square kilometers, and the dynamical models have the highest number with the median at 4.56 million square kilometers.
[Edit – June 23rd]
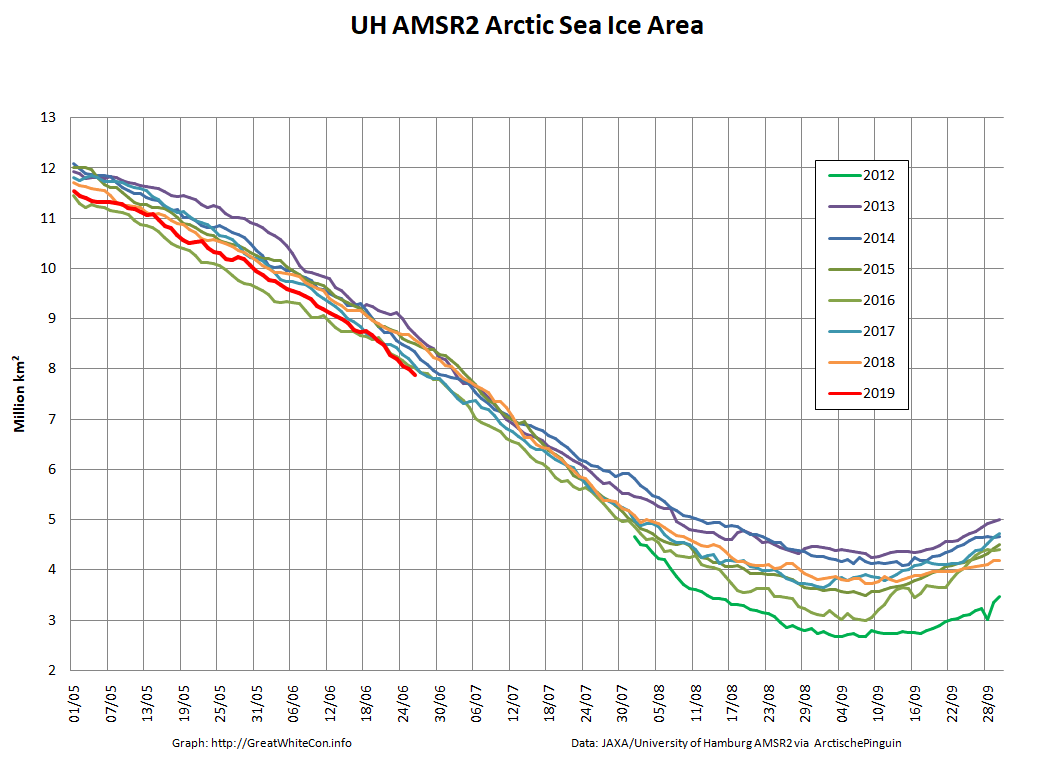
Arctic wide sea ice area is now lowest for the date in the high resolution AMSR2 record, although extent has yet to follow suit:
If you exclude the peripheral seas, which are all largely ice free by mid September in this day and age, the picture is extremely stark:
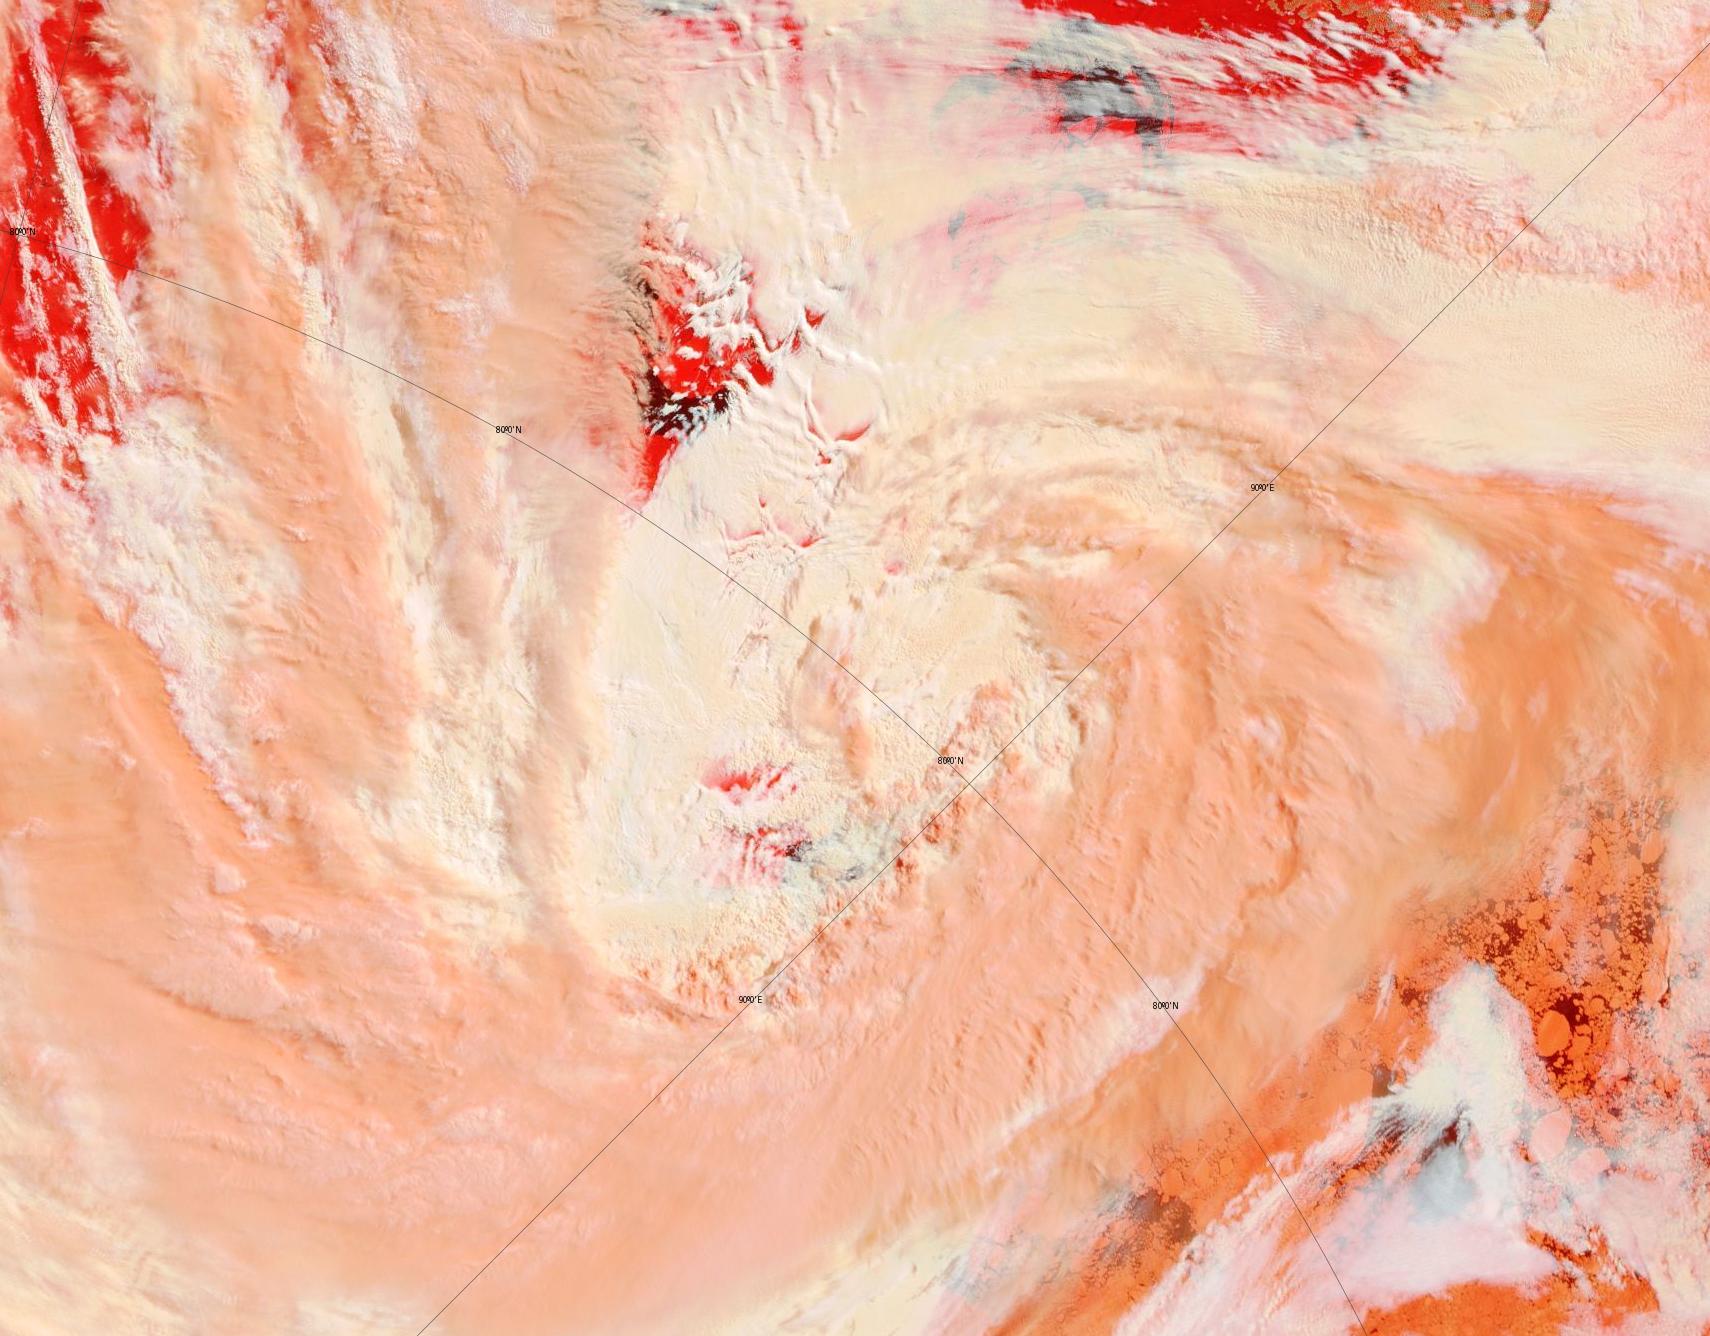
A brief glimpse through the clouds reveals that the North Pole is now starting to feel the recent heat:
NASA Worldview “false-color” image of the North Pole on June 22nd 2019, derived from the MODIS sensor on the Terra satellite
[Edit – June 27th]
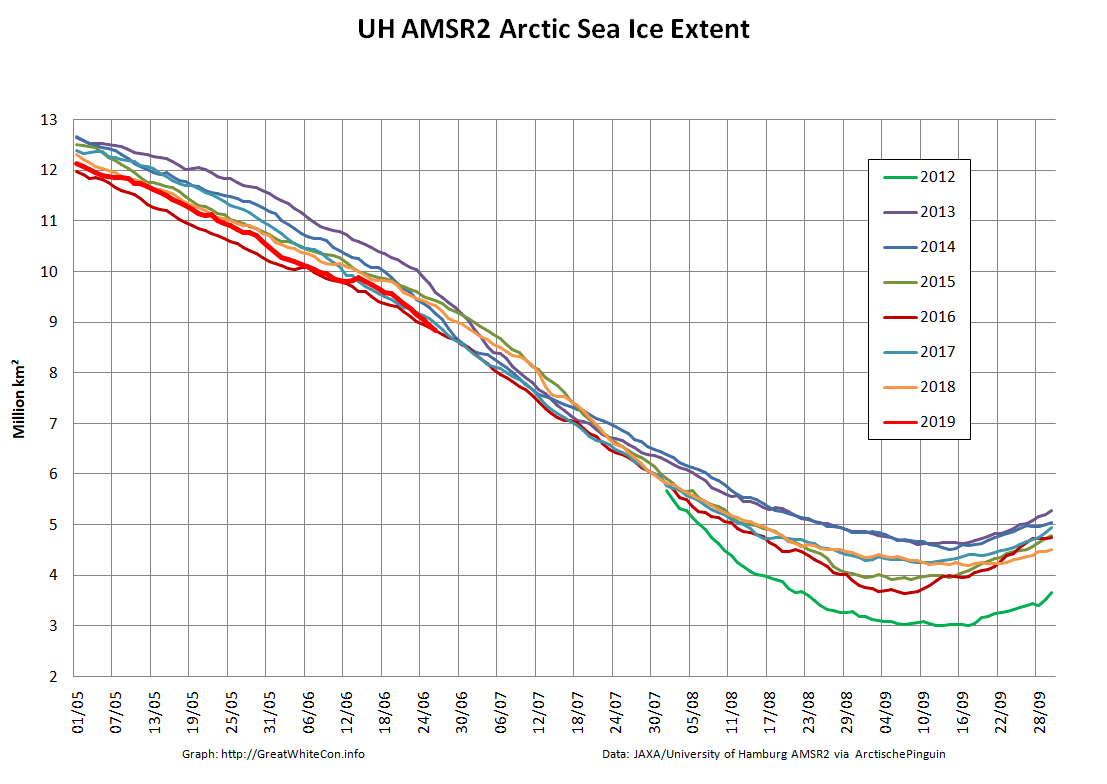
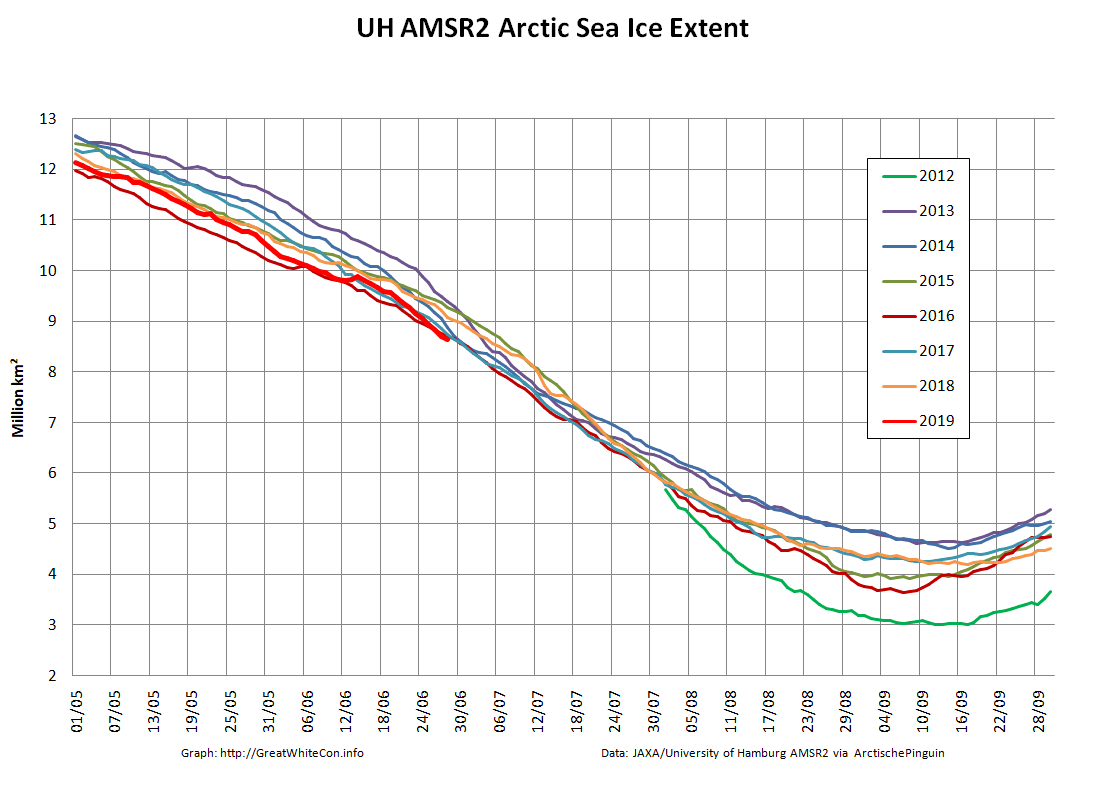
Arctic wide sea ice extent is now lowest for the date in the high resolution AMSR2 record:
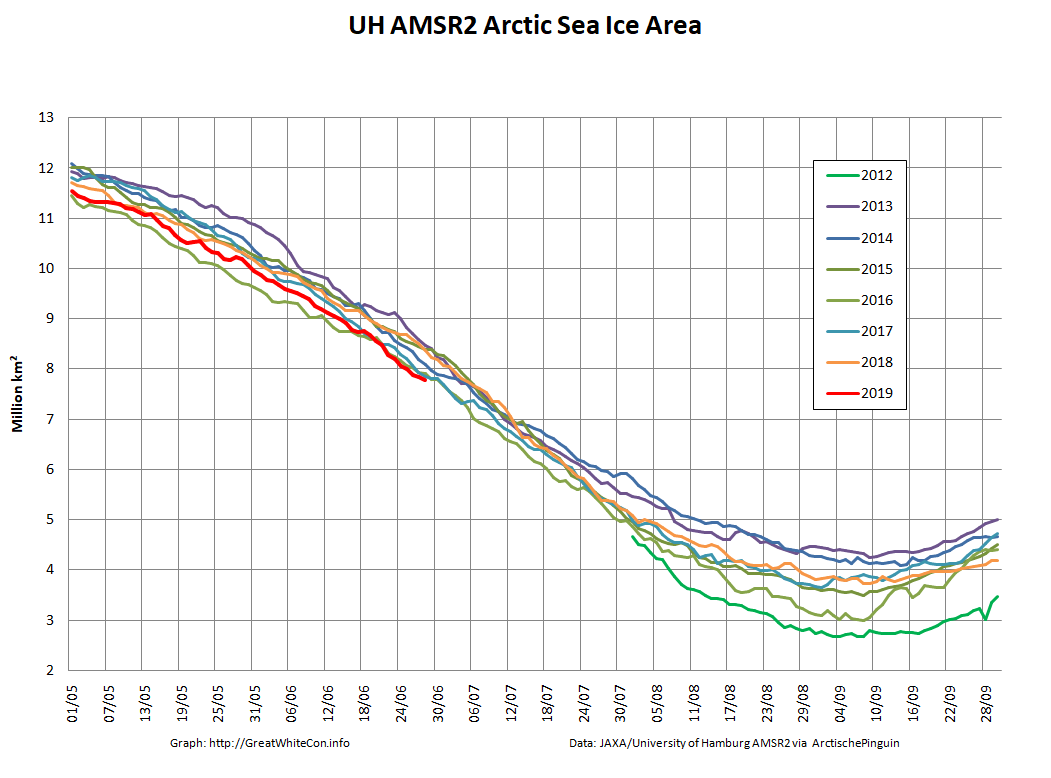
Here’s Arctic wide sea ice area, which is still well below the rest of the pack:
[Edit – June 29th]
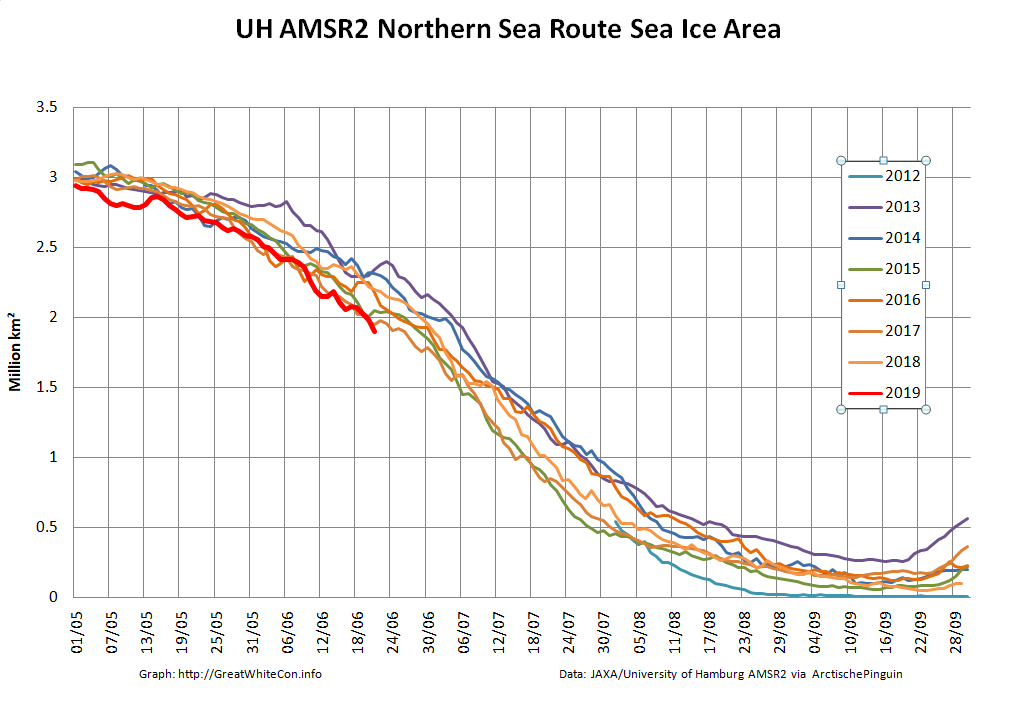
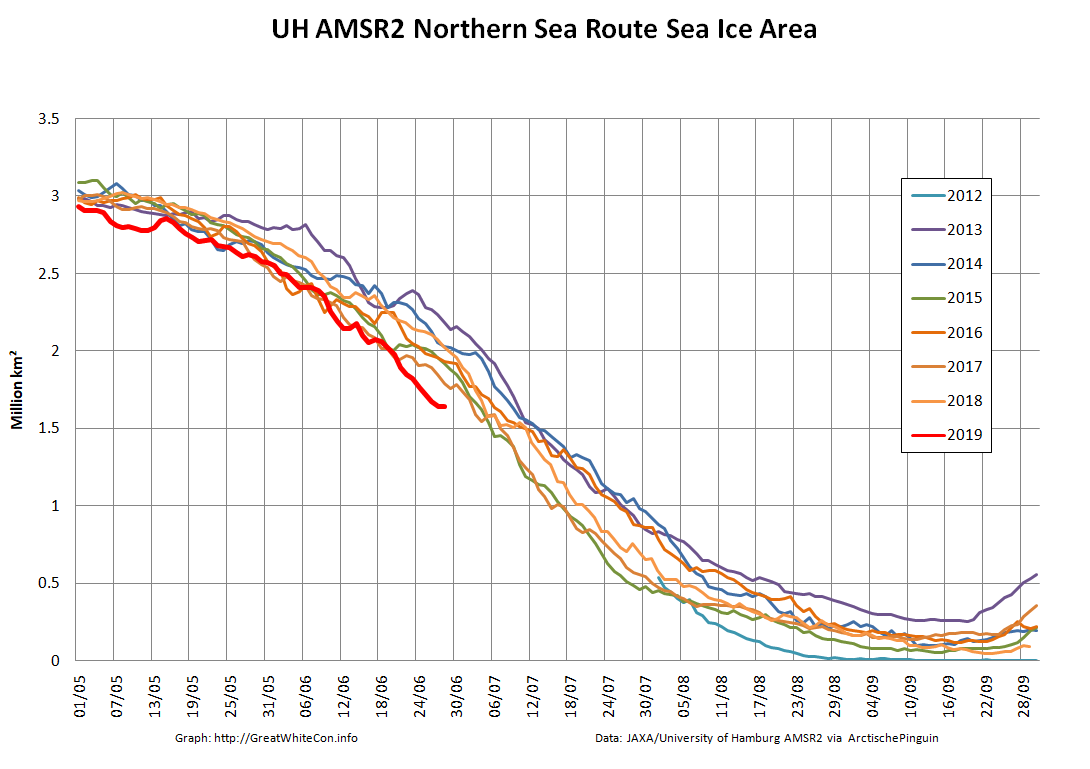
As the end of the month draws near let’s take a look at sea ice area along a couple of the famous sea routes above the Arctic Circle. First of all here’s the Northern Sea Route, comprising the Kara, Laptev, East Siberian and Chukchi Seas:
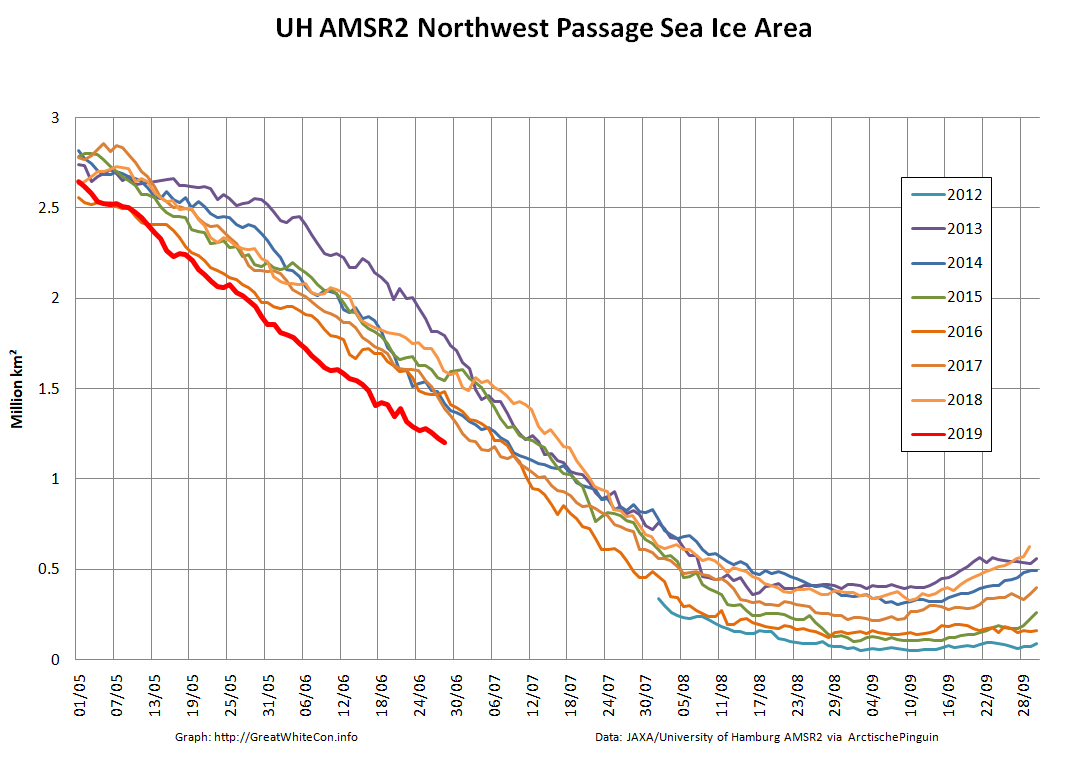
Next here’s the Northwest Passage, comprising the Chukchi and Beaufort Seas plus the channels of the Canadian Arctic Archipelago and Baffin Bay:
For completeness here too are the current Arctic wide area and extent numbers:
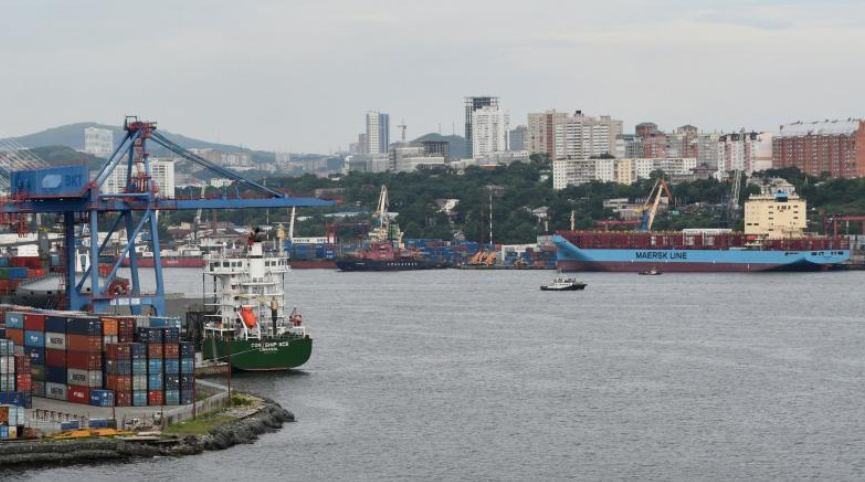
Our usual excuse for an article such as this is an attempt by a “pleasure craft” such as the plucky little yacht Northabout to journey past Russia’s northern shores. I’m not aware of any such plans for this year, but here is some interesting NSR 2018 news. According to Reuters:
A Maersk vessel loaded with Russian fish and South Korean electronics will next week become the first container ship to navigate an Arctic sea route that Russia hopes will become a new shipping highway.
The Arctic voyage by the 3,600 20-foot container capacity Venta Maersk is the latest step in the expansion of the so-called Northern Sea Route which is becoming more accessible to ships as climate change reduces the amount of sea ice.
The brand new Venta Maersk, one of the world’s largest ice-class vessels, will also collect scientific data, said Maersk, underlining that the voyage is a one-off trial for now.
The press release continues:
The decision by Maersk, the world’s biggest container shipping group, to test out the route is a positive sign for Russia, which hopes this could become a mini Suez Canal, cutting sea transport times from Asia to Europe.
“A well-respected company like Maersk sending a container ship through the Arctic, definitely signals there’s something there,” Malte Humpert, a senior fellow at U.S.-based think-tank Arctic Institute, said.
“Currently, we do not see the Northern Sea Route as an alternative to our usual routes. Today, the passage is only feasible for around three months a year which may change with time,” a spokeswoman for Maersk said.
Here’s the sea ice situation that the Venta Maersk is heading for:
According to AMSR2 there’s still some sea ice quite close to shore in the East Siberian Sea. Meanwhile according to Marine Traffic the Venta Maersk has already left Vladivostok:
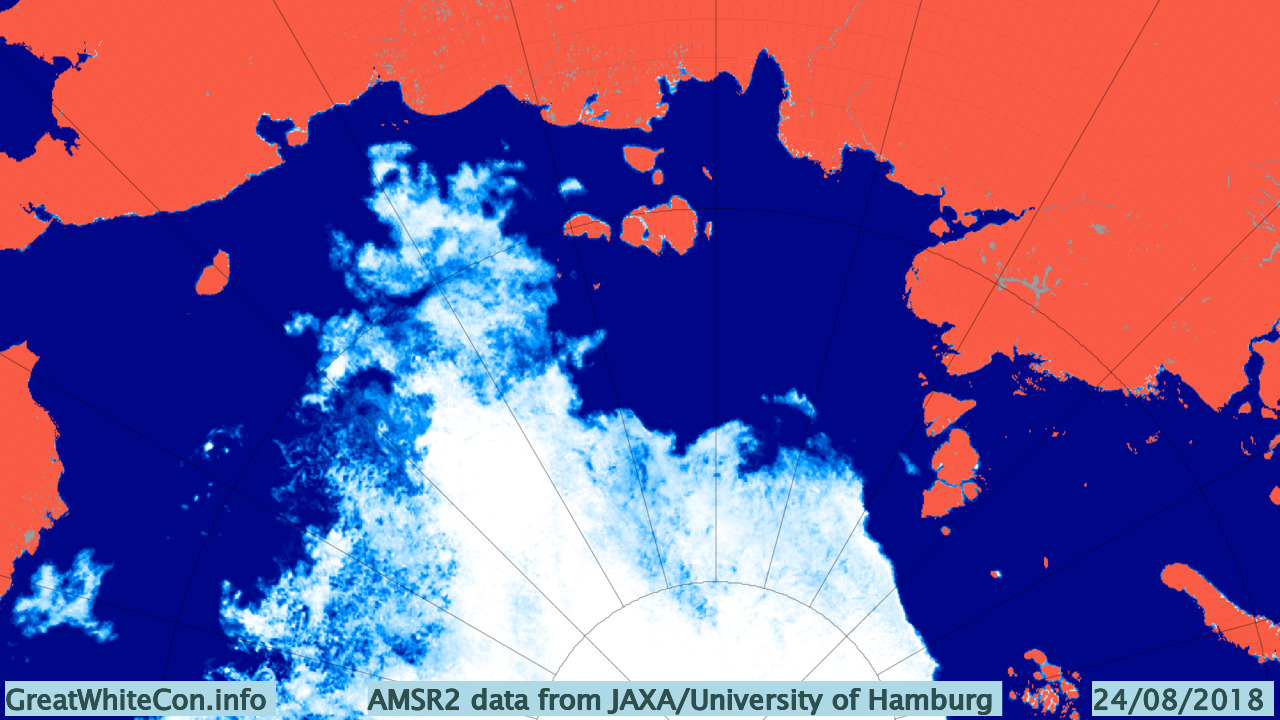
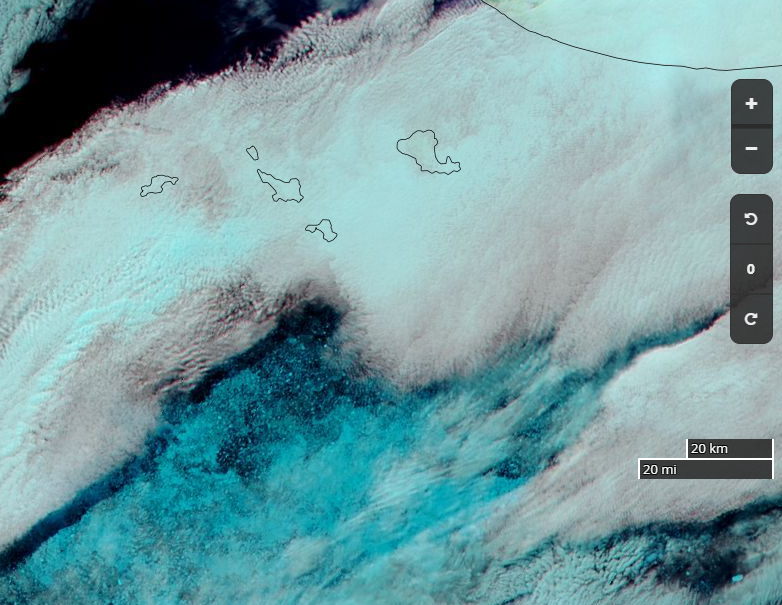
It will be a little while before she’s braving the dangers of the sea ice in the East Siberian Sea. Hopefully by that time we’ll have some clear satellite images at visual frequencies of anything solid in the path of all those containers. In the meantime here’s a glimpse through the clouds of the approximate ice edge on August 23rd:
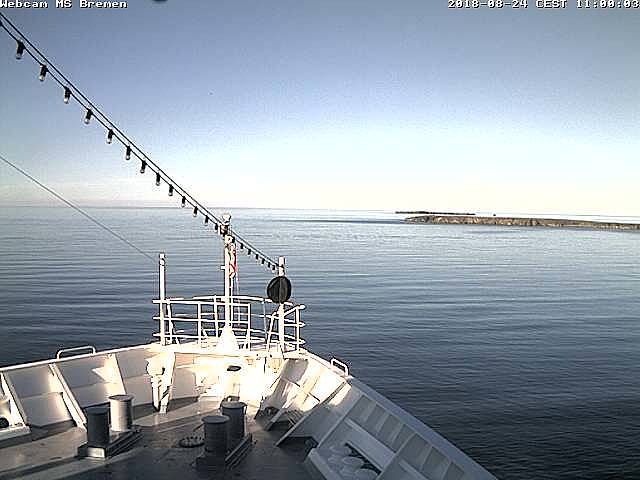
Meanwhile the Hapag Lloyd cruise ship Bremen is currently en route from Tromso to Nome via the Northern Sea Route. She is currently crossing the Laptev Sea heading for the ESS “choke point” from the opposite direction:
Depending on whether you’re reading an “alarmist” or a “skeptical” web site you may have been told either that the Northern Sea Route is already “open” or that the “icebreaker stuck in the sea ice off Pevek” escaped very late this summer. Here at Great White Con we like to think of ourselves as “realists”, so what are the actual facts of the matter.
Our customary way of looking at such things is to use the Canadian Ice Service’s definition of “open” for the Northwest Passage, which seems to be 3/10 or less concentration along the entire route. That would allow an intrepid little yacht like Northabout through without too much trouble, but that point has not quite been reached yet this year. The NSR looks to be eminently “open” already if you only look at an AMSR2 concentration map:
However according to the Russian Arctic and Antarctic Research Institute (AARI for short) there is still not a suitably simple way through Vilkitsky Strait. Here’s their latest ice chart of the area:
Convoys led by nuclear powered icebreakers have already passed through the Vilkitsky Strait this summer. See for example this tracking map of Yamal from a few days ago:
Also an unaccompanied liquid natural gas carrier has made it through the Vilkitsky Strait already this year. According to a Total press release:
After loading its cargo at the Snøhvit LNG export terminal in Norway, in which Total has an 18.4% interest, the Christophe de Margerie is taking the Northern Sea Route to Boryeong in South Korea, where it will deliver a cargo for Total Gas & Power. It’s the first unescorted merchant LNG vessel ever to take this route, which makes it possible to reach Asia via the Bering Strait in 15 days versus 30 days via the Suez Canal.
This technological feat was made possible through the participation of Total teams to the design of these next-generation LNG carriers. Compilations of technology, they efficiently transport large quantities of LNG year-round, without requiring escort icebreakers during the period from July to November. The Christophe de Margerie is the first of a total of 15 planned LNG carriers that will be gradually deployed.
As you can see, whilst it travels forwards in open water the Christophe de Margerie goes into reverse when breaking ice! Little yachts and other unaccompanied vessels lacking an ice class certificate will have to wait just a little longer however, unless of course they are inclined to be “intrepid”.
[Edit – August 19th]
As Cesium points out below, there is now a <= 3/10 concentration channel through the Vilkitsky Strait on the AARI maps.
Here’s a couple of Sentinel 1A tiles from this morning stitched together:
We can now safely declare the Northern Sea Route “open”, even for less intrepid little yachts.
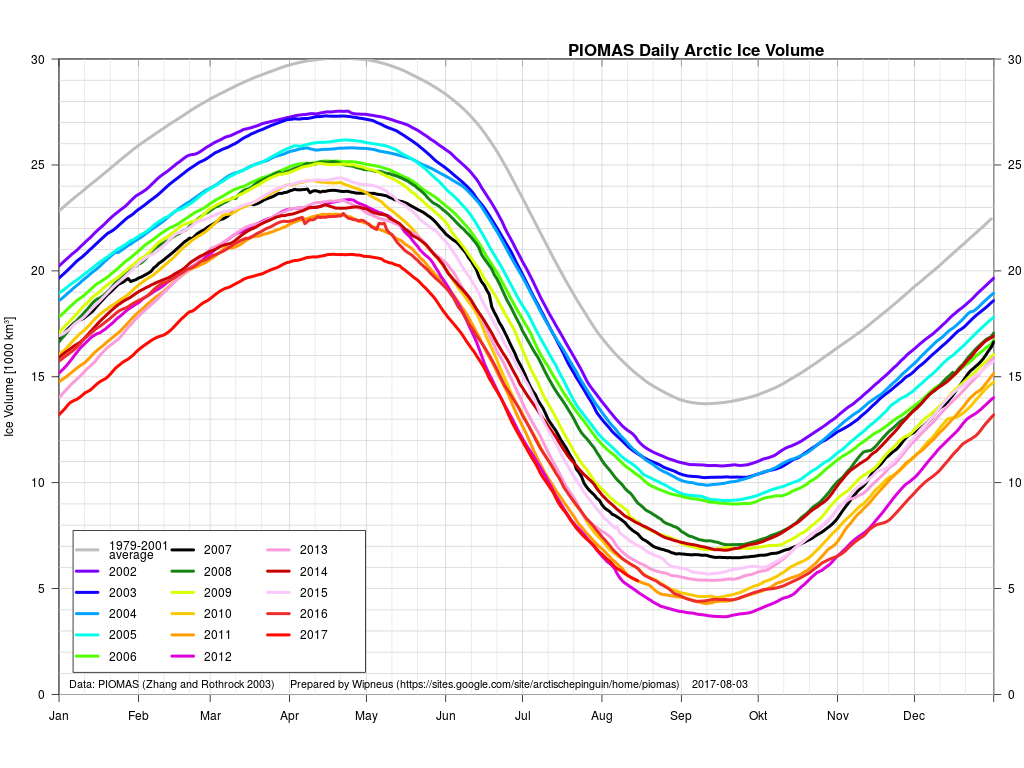
What seems likely to be the most interesting period of the 2017 Arctic sea ice melting season is upon us! The PIOMAS gridded data hasn’t been released yet, but the overall volume numbers reveal that 2017 has now relinquished its “lowest ever” position to 2012. Here’s Wipneus’ graph of the volume data:
plus his anomaly plot:
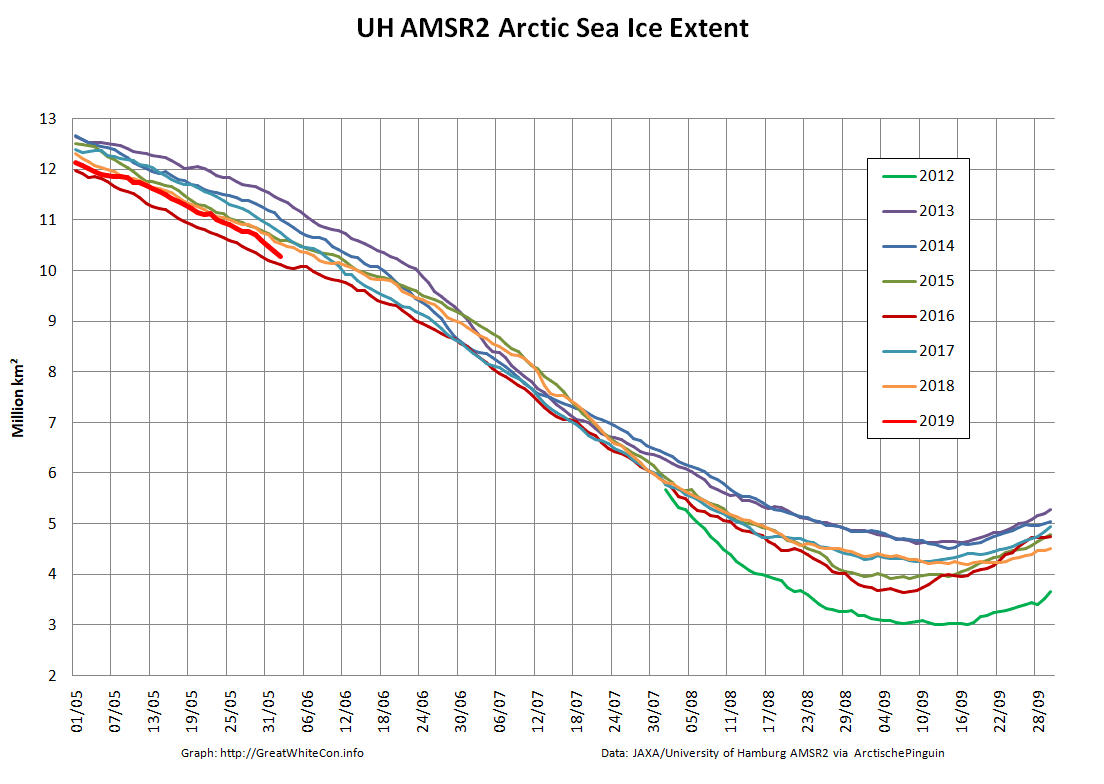
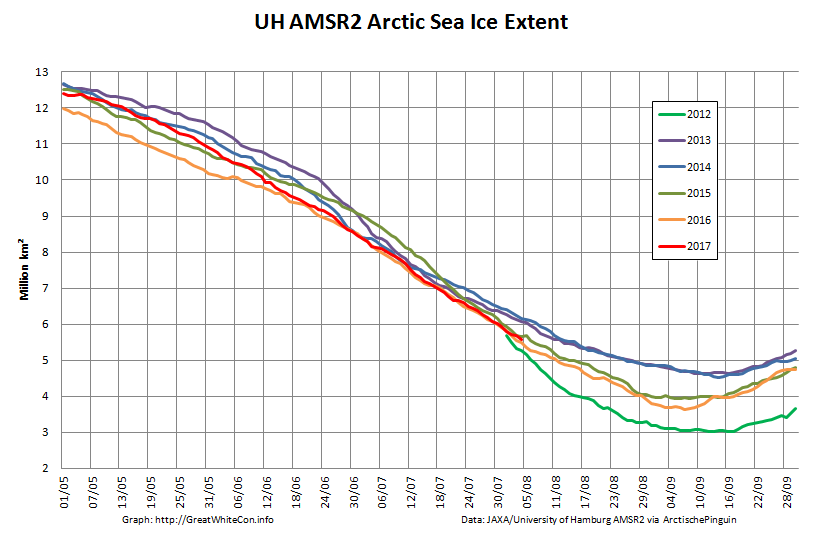
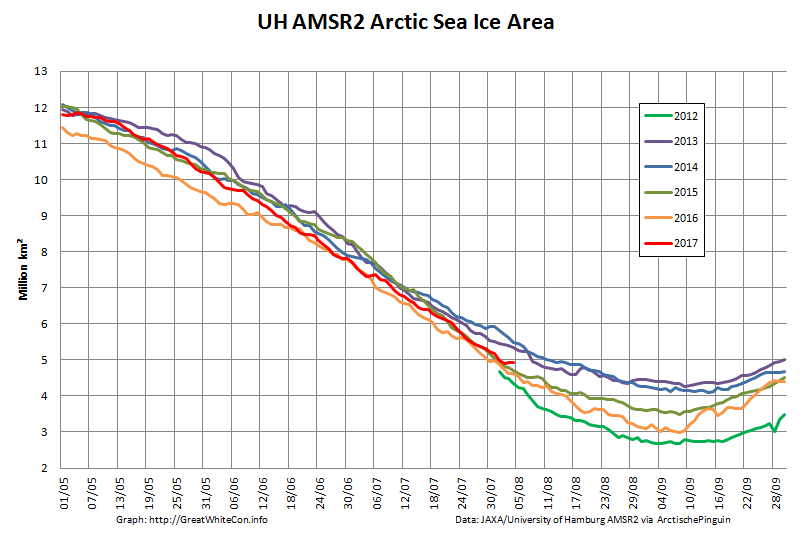
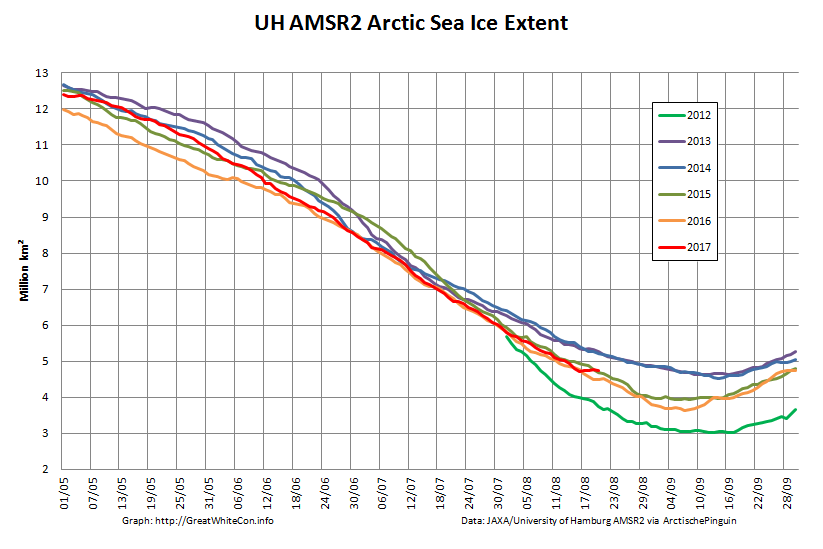
Our favourite high resolution AMSR2 area and extent graphs now also allow comparison with 2012. Here’s how they look at the moment:
As you can see, round about now is when 2012 Arctic sea ice extent started to noticeably race ahead of the rest of the pack. Will 2017 follow suit? Are there any Arctic cyclones on the horizon for example? Well, the one forecast for August 4th hasn’t materialised. Here’s this morning’s Environment Canada synopsis:
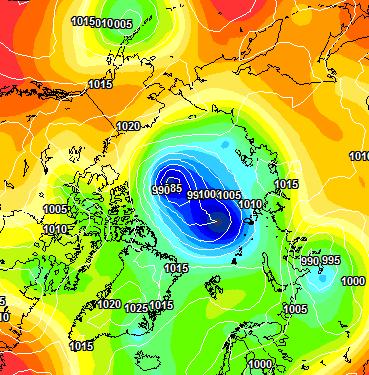
However both ECMWF and GFS agree that a sub 985 hPa storm should have arrived by Sunday morning. Here’s the ECMWF version from MeteoCiel:
There’s stronger storms in the forecast further out, but once again we’ll believe them if and when we see them!
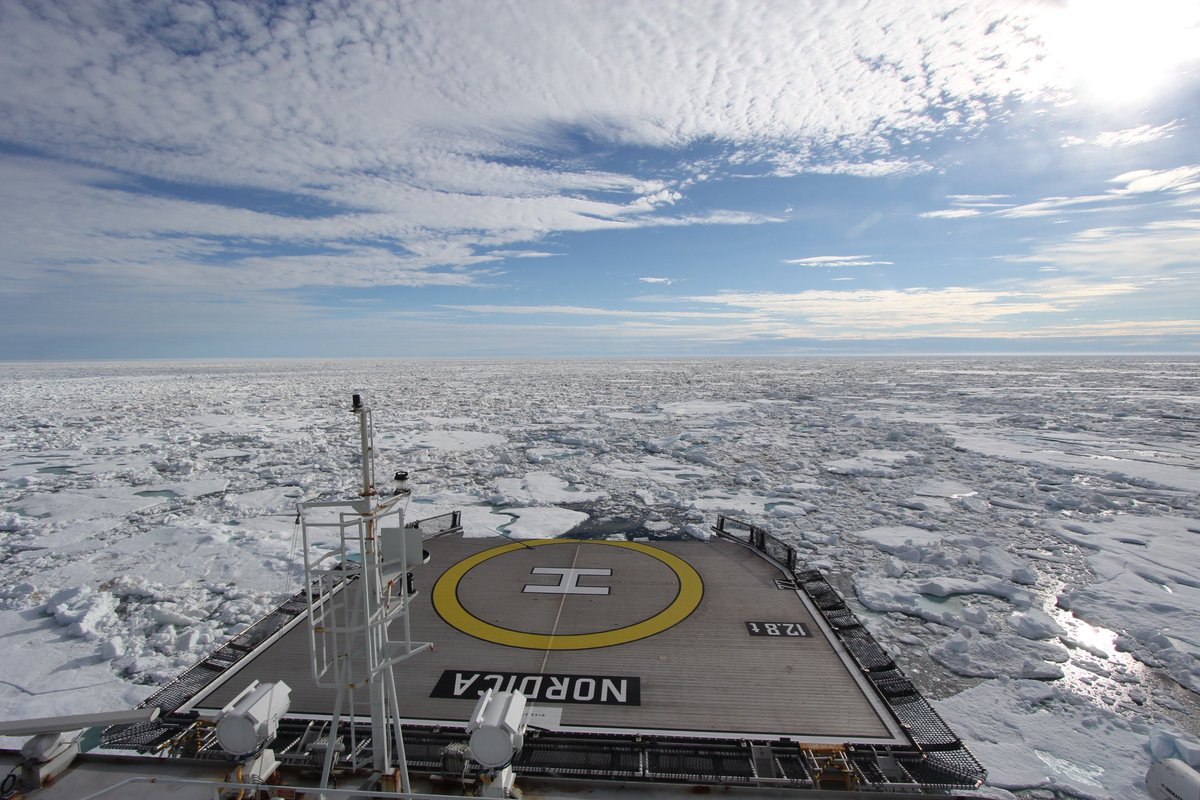
We’re keeping a close eye on the Northwest Passage once again this year. Most of the southern route is open already, but as we predicted the old ice in Larsen Sound has a lot of melting still to do. Here’s how it looked from the icebreaker Nordica a few days ago:
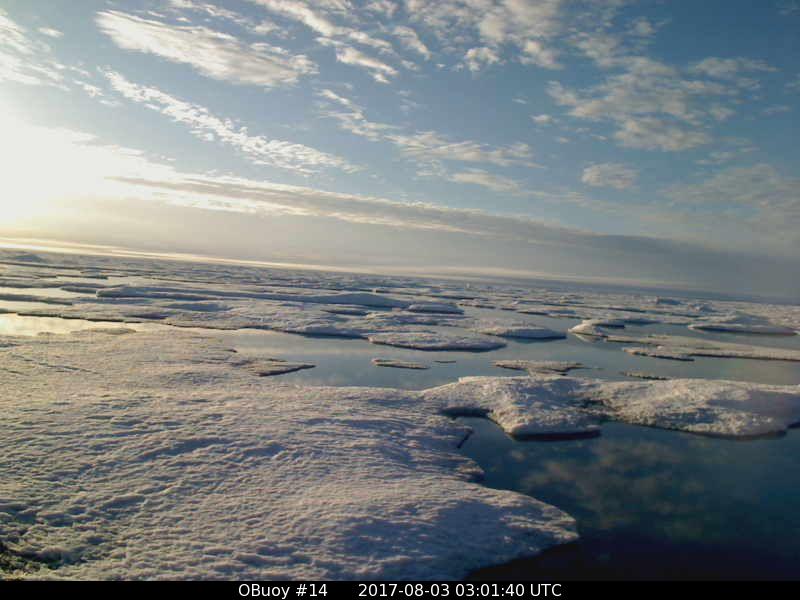
On top of that the old ice around O-Buoy 14 is currently rushing south down the McClintock Channel to replenish it. Here’s how that looks at the moment:
Meanwhile the melt along the Northern Sea Route is well ahead of last year. Here’s the University of Hamburg AMSR2 concentration map of the area:
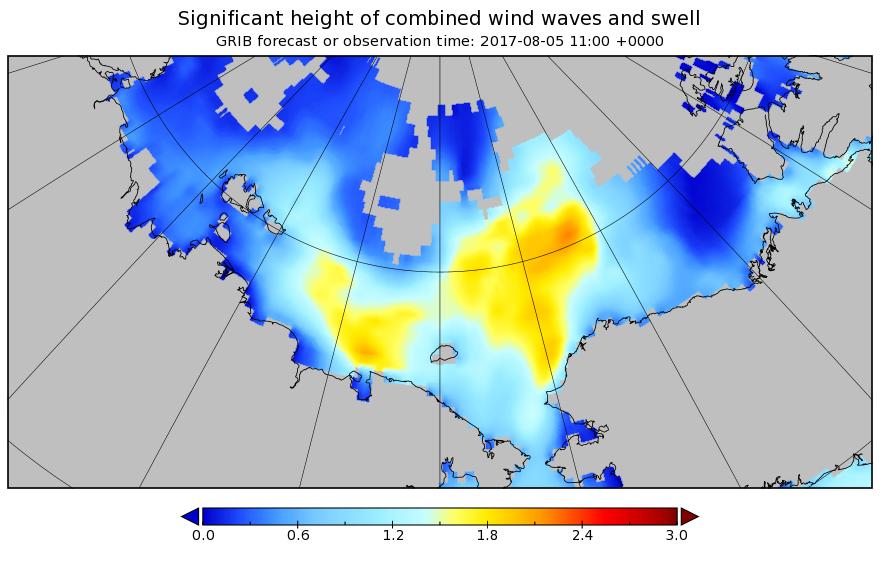
There’s also now a lot of open water on the Pacific side of the Arctic, and Sunday’s cyclone is forecast to create a large area of 2 meter plus waves heading in the direction of the ice edge:
I expect that to have a noticeable effect on the already fragile sea ice by early next week, assuming the storm arrives as forecast! There is an ice mass balance buoy handily placed out on the ice in the path of the storm. Buoy 2017A is currently located near 77 N, 147 W, and its assorted sensors suggest the ice underneath it is now less than 20 cm thick:
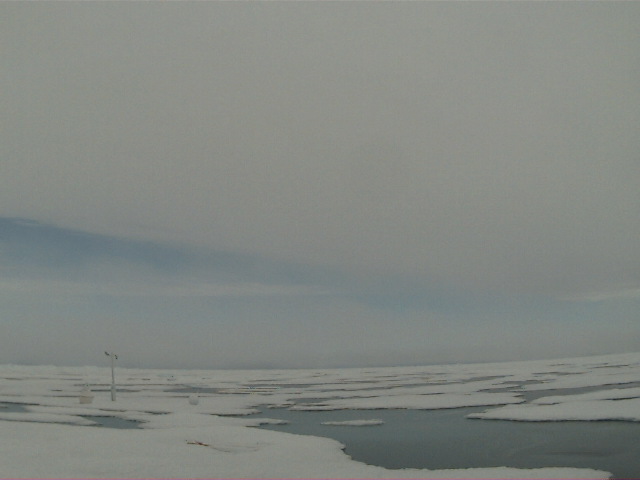
Here’s how the area around the buoy looked a couple of weeks ago:
Image of 2017A from WARM 6 on July 18th 2017. NSF project: NSF OPP #1603548
The $64,000 question now is will the 2017 Arctic sea ice metrics stay in amongst the recent pack, or race after 2012 instead?
[Edit – August 6th]
This morning’s synopsis from Environment Canada suggests the cyclone has bottomed out at a MSLP of 982 hPa:
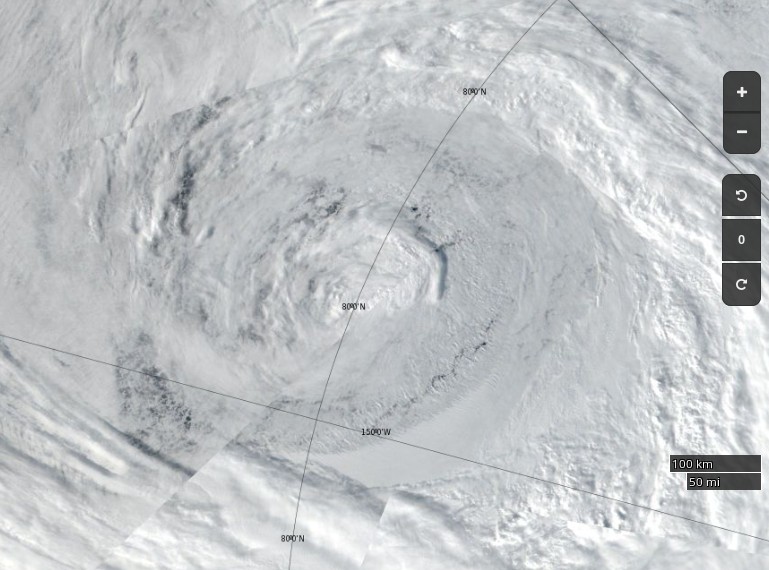
Here’s how the cyclone looked from space yesterday:
NASA Worldview “true-color” image of the sea ice north of the Beaufort Sea on August 5th 2017, derived from the VIIRS sensor on the Suomi satellite
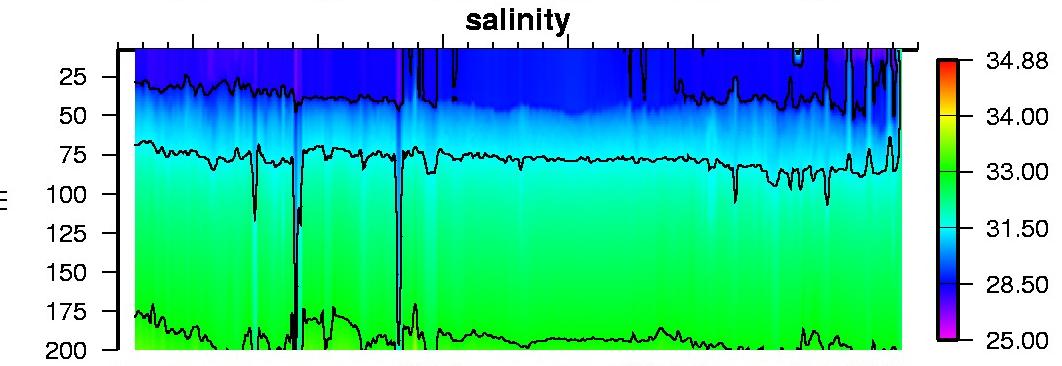
I think that I can convince myself that the salinity profile from ice tethered profiler 97, currently located at 73° N, 134° W, reveals mixing from depth in the wake of the storm:
The synthetic aperture radar on the Sentinel 1B satellite can certainly see through the clouds, and reveals open water in the Central Arctic north of the Beaufort Sea yesterday evening (UTC):
Sentinel 1B image of Arctic sea ice at 79° N, 160° W on August 5th 2017
The effects of this weekend’s storm are readily apparent! Just in case you’re wondering Wipneus reports:
Area: -172.0 (+324k vs 2016, +138k vs 2015, -669k vs 2014, -523k vs 2013, +493k vs 2012)
[Edit – August 8th]
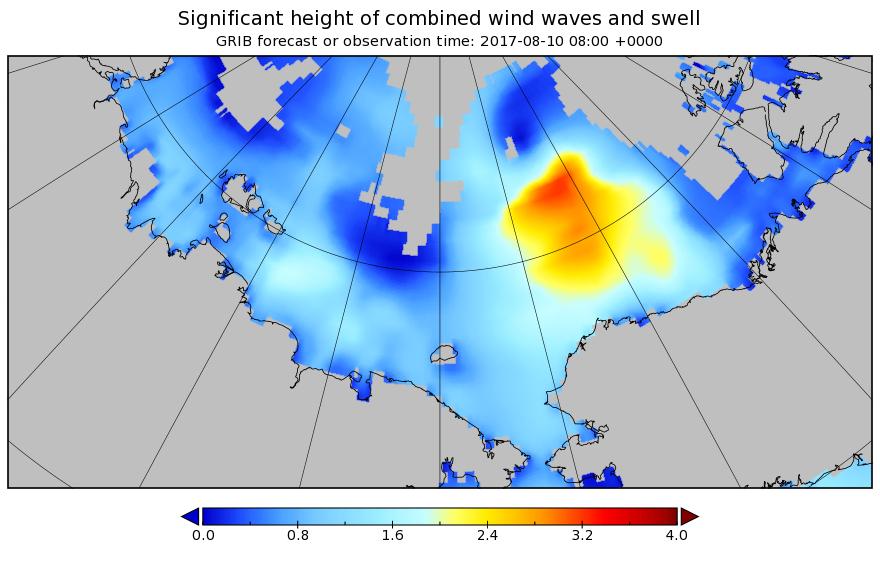
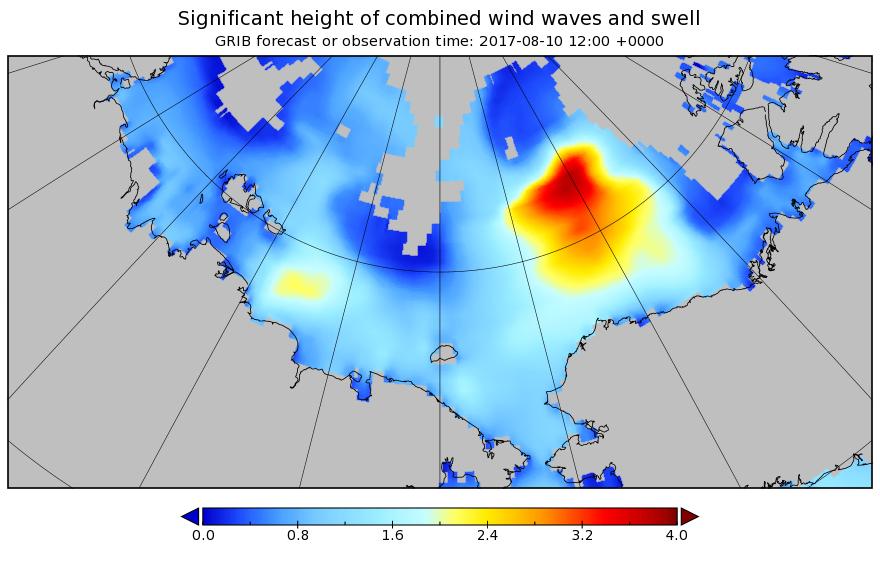
The next pulse of swell is currently forecast to be somewhat higher and longer period than the last one. This one is also taking aim at the Beaufort Sea MIZ:
[Edit – August 9th]
According to Environment Canada the latest cyclone is already down to 980 hPa MSLP:
[Edit – August 9th PM]
The MSLP of the current cyclone is now down to 976 hPA:
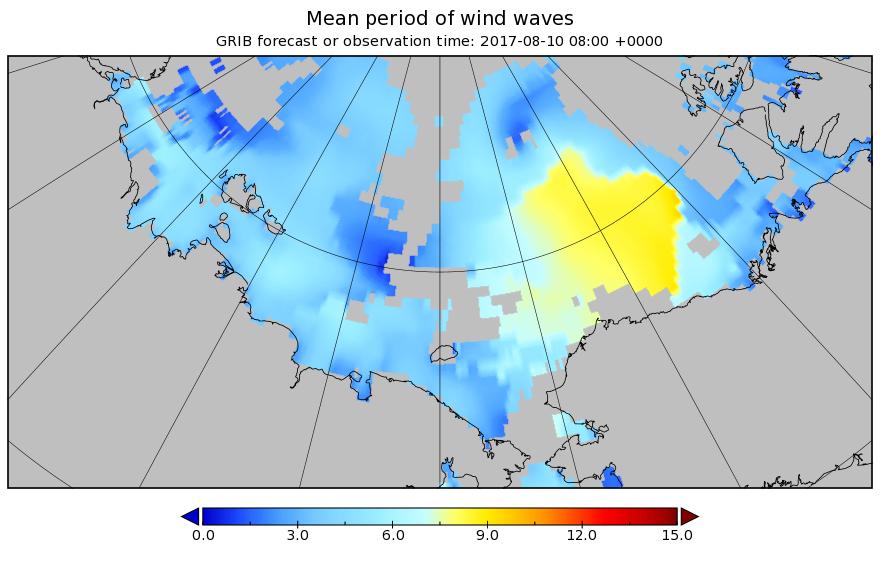
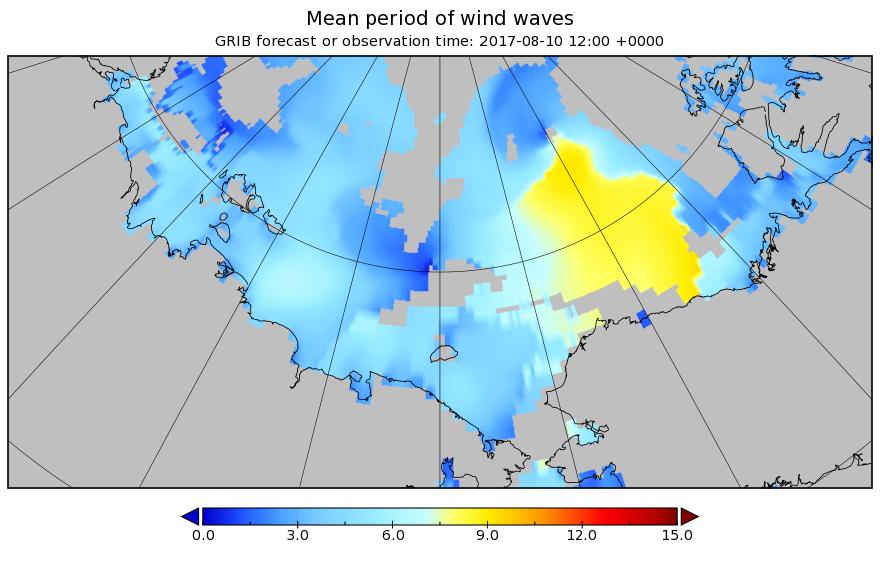
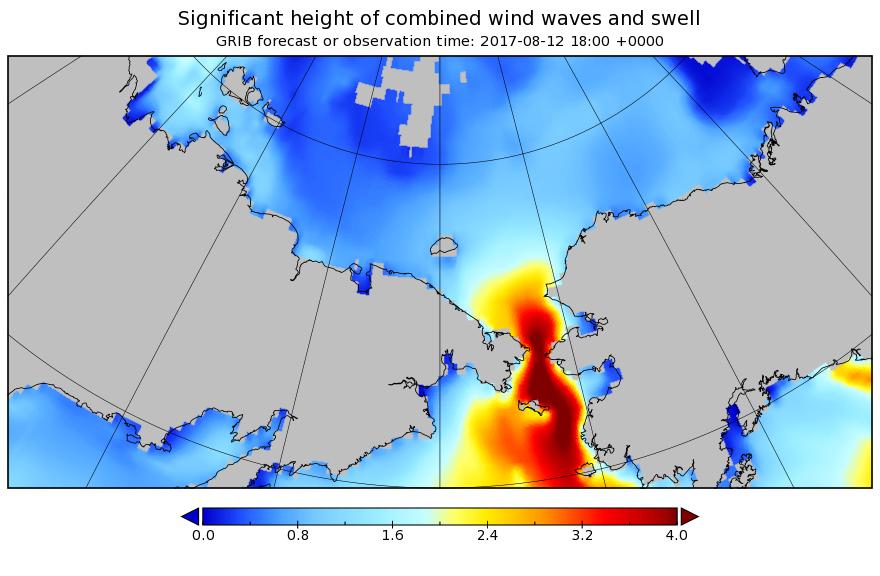
The latest WaveWatch III forecast has increased the predicted peak height and period of the resulting waves once again:
[Edit – August 10th]
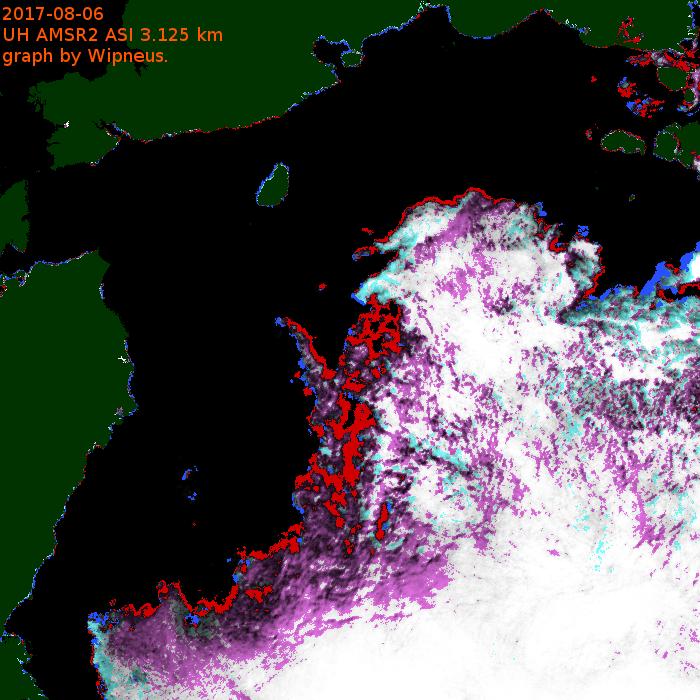
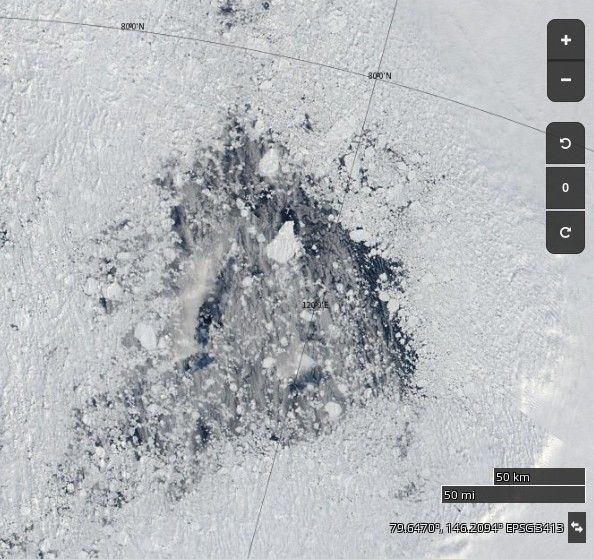
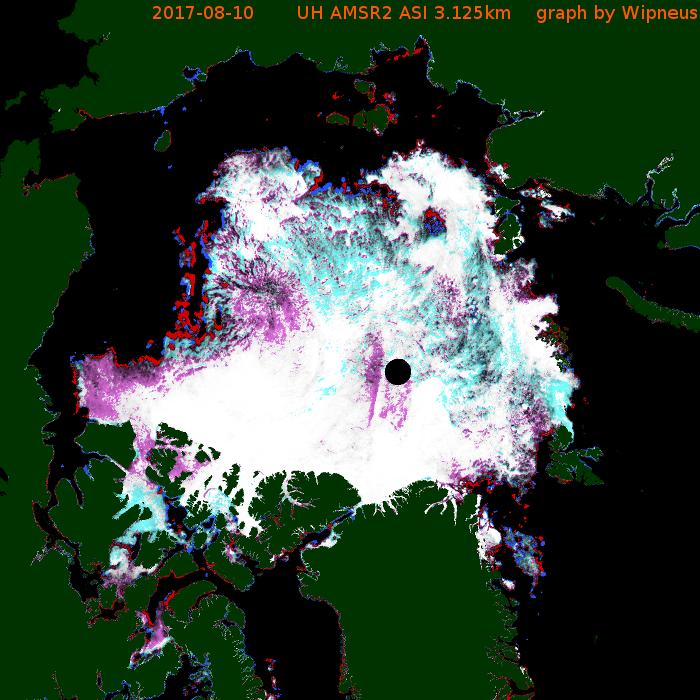
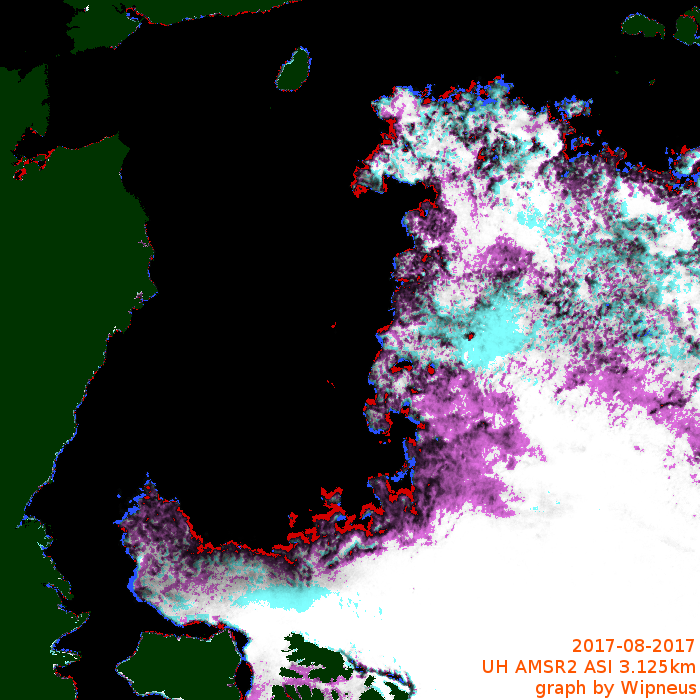
Large holes are appearing in the sea ice on the other side of the Arctic too. Take a look north of the Laptev Sea for example:
NASA Worldview “true-color” image of the “Laptev Bite” polynya on August 10th 2017
Meanwhile the current cyclone on the Pacific side of the North Pole appears to have bottomed out at 974 hPa:
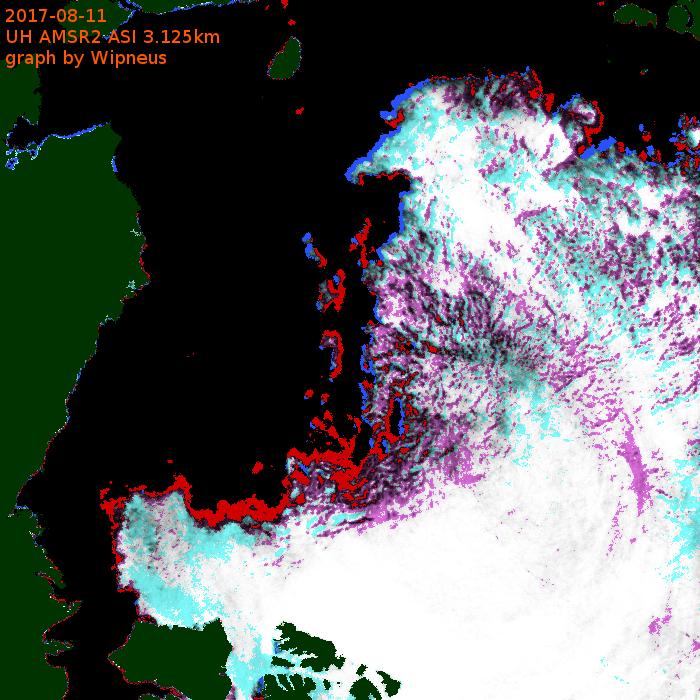
[Edit – August 11th]
Here’s the latest sea ice concentration one day delta map from Wipneus:
Despite the expected divergence caused by a low pressure area crossing the ice, both are and extent of sea ice on the Pacific side of the Arctic are still falling.
[Edit – August 12th]
The waves are considerably smaller in the Beaufort Sea today, but not in the Bering Strait!
Here’s the latest one day delta map:
and here’s video showing the motion of sea ice in the Beaufort & Chukchi Seas so far this summer:
[Edit – August 13th]
Here’s an animation from Wipneus revealing the effect of the two recent cyclones on the Pacific side, plus everything else that’s been going on in the Arctic:
Click the image to see a much larger (3.3 Mb) version.
[Edit – August 16th]
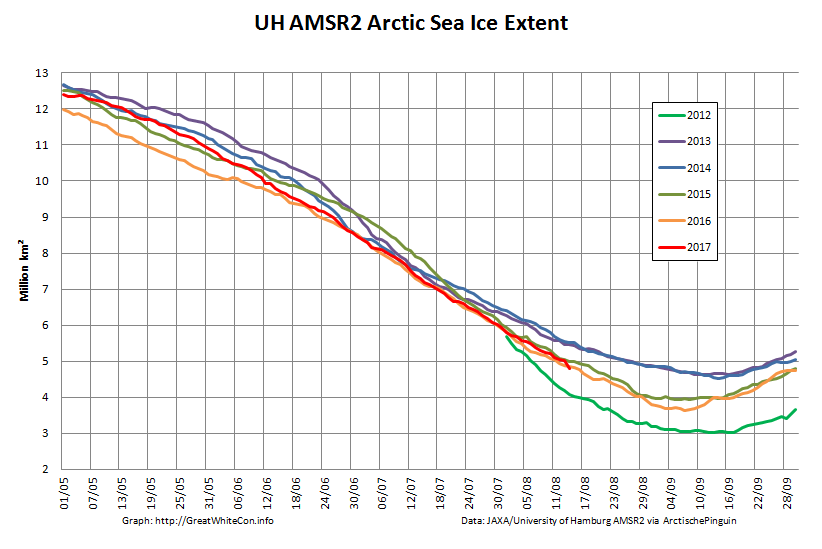
AMSR2 Arctic sea ice extent has taken another tumble, and has dropped below 2016:
Only 2012 left to beat!
[Edit – August 18th]
A PIOMAS mid month update has been released, including gridded thickness data. 2017 modelled volume has failed to follow 2012’s trajectory towards the September minimum, and is now on a par with 2011:
[Edit – August 21st]
After a “brief hiatus” in the wake of the recent cyclones Arctic sea ice area has posted a new low for the year:
Extent has yet to follow suit:
The main loss of area has been in the “Beaufort Bite” once again:
The United Kingdom Government has just published details of its Foresight “Future of the sea” project’s investigation into the implications of declining Arctic sea ice. According to the overview:
The Arctic is losing sea ice at a dramatic rate and this decline is expected to continue. This is creating opportunities for shorter global trade links between East Asia and the UK, via the Arctic.
Arctic routes are seasonally open most years, although normally icebreaker ships are required and available routes are close to the coast. Currently the Arctic shipping season is short and highly variable with optimum conditions in September and/or October.
Due to climate change, the Arctic shipping season could become three times longer and more reliable, so that by mid-century it will likely be possible to directly cross the North Pole during late summer. During this time, voyages from East Asia to the UK could save 10 to 12 days by using Arctic routes.
However, the extra costs associated with operating in the harsh Arctic environment may detract from their appeal.
The full report goes into much greater detail. According to the executive summary:
There are mixed views on whether trans-Arctic routes will become economically viable. The Russian government wishes to develop the Northern Sea Route as a commercial enterprise and offers substantial fee-based services such as ice-breaking support and pilotage, which are certainly necessary for future investment and development of the route. However Arctic transport is also likely to grow due to increased destination shipping to serve natural resource extraction projects and cruise tourism.
The UK is well positioned, geographically, geopolitically, and commercially, to benefit from a symbiotic relationship with increasing Arctic shipping. The UK has a prominent role in Arctic science and a world-leading maritime services industry based in London, including the International Maritime Organization (IMO), one of the world’s leading financial centres, and Europe’s largest insurance sector. Arctic economic growth is focused in four key sectors – mineral resources, fisheries, logistics, and tourism – all of which require shipping, and could generate investment reaching $100bn (US Dollars and hereafter) or more in the Arctic region over the next decade. The UK had a fundamental role in preparing the UN IMO Polar Code which came into operation in January 2017. The Polar Code is an historic milestone in addressing the specific risks faced by Arctic shipping and acts to supplement the existing Safety of Life at Sea (SOLAS) and Marine Pollution (MARPOL) conventions for protecting the environment while ensuring safe shipping in international waters.
Much of the investment into Arctic shipping projects is from China but northern European countries are also playing an increasing role. Potential opportunities for the UK include the development of UK-based Arctic cruise tourism, and a UK-based trans-shipment port – transferring goods from ice-classed vessels to conventional carriers. The UK’s active diplomatic role in many international organisations means it is well placed to ensure that increased activity in the Arctic is accomplished in line with established UN maritime conventions, many of which were written with significant UK contributions. The UK’s leading role in Arctic science has wide reaching positive implications for international collaboration. To enhance predictions of the future Arctic, further developments in climate modelling and science are required.
From the concluding remarks:
If anthropogenic greenhouse gas concentrations can be reduced sharply in line with the UN Paris climate change agreements, Arctic ice melt and shipping opportunities will still continue to increase for the majority of the 21st century. However, even with continually increasing greenhouse gas concentrations, climate models suggest there will always be some Arctic sea ice during winters through the 21st century. Although the Arctic shipping season length and reliability is likely to increase dramatically, for the vast majority of the current global shipping fleet sailing trans-Arctic will remain a seasonal endeavour. Based on the current activity and physical climate changes this suggests that trans-Arctic shipping is likely to increase, focused on the Northern Sea Route; however, it is likely to remain a niche market for specialist operators.
Finally, for the moment at least, here’s the latest IMO video on search and rescue in the polar environment:
https://youtu.be/N_gs9wgaHQo
The emphasis in the video is on Antarctica, but one cannot help but wonder when the next search and rescue operation will take place in the Arctic. Later this summer perhaps? Note that under the new Polar Code avoiding the use of heavy fuel oil is mandatory in the Antarctic, but merely “encouraged” in the Arctic:
I recently found myself in an extended discussion on Professor Judith Curry’s “Climate Etc.” blog with Tony Brown. Tony asserts that:
In 1932, a Soviet expedition led by Professor Otto Yulievich Schmidt was the first to sail all the way from Arkhangelsk to the Bering Strait in the same summer without wintering en route. After a couple more trial runs, in 1933 and 1934, the Northern Sea Route was officially defined and open and commercial exploitation began in 1935. The next year, part of the Baltic Fleet made the passage to the Pacific where armed conflict with Japan was looming.
and asks:
Are you SERIOUSLY suggesting that the northern sea route was not operable from the 1930’s onwards?
My response?
I’m still awaiting your pick of the year in the 1930s in which the NSR was most “open”. I have a sneaking suspicion it won’t conform to, for example, the current Canadian Ice Service definition.
I won’t bore you with the long list of questions I asked Tony that he has thus far failed to answer. Instead let’s take a closer look at the history of the Northern Sea Route than Tony is willing and/or able to undertake. Perhaps the most obvious place to start is the “History of the Northern Sea Route“? However this does rather gloss over the 1930s. For our initial reference let’s see what Bill Barr has to say in his “The Drift of Lenin’s Convoy in the Laptev Sea, 1937 – 1938″, published in 1980.
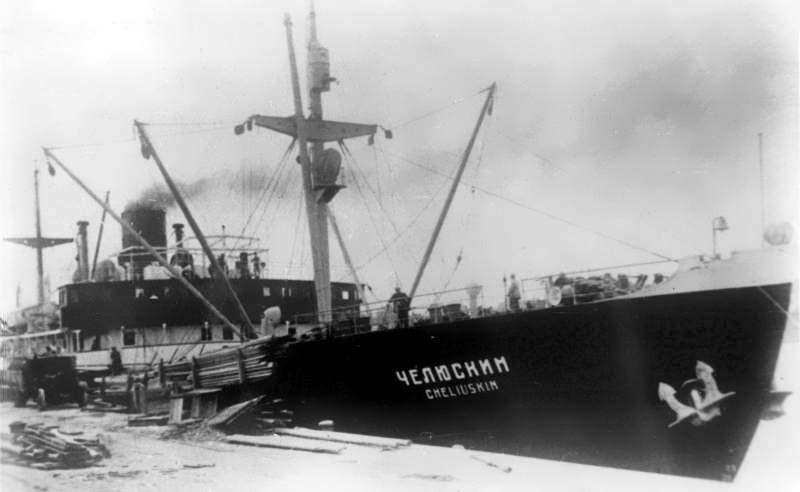
Only a few months after Sibiryukov‘s limited success in her attempt at a one-season passage of the Northern Sea Route, so eloquently embodied in her final emergence from the ice of the Chukchi Sea under improvised sails, on December 17, 1932 Sovnurkom (the Soviet of Peoples’ Commissars) took the momentous step of forming the Chief Administration of the Northern Sea Route (Gluvnoye Upruvleniye Severnogo Morskogo Puli), more commonly known as Gluvsevmorput’. Its primary task was to establish safe, reliable navigation from the White Sea to Bering Strait, but in a series of subsequent decrees over the next few years it also acquired a remarkable array of ancillary functions, and along with them, remarkably wide powers. In effect Gluvsevmorput’ was given almost complete control of the entire vast area of Siberia north of 62″ (the latitude of Yakutsk) not only in terms of transport and economic development, but also education, health services and cultural development. Even with these extensive powers, however, the new organization’s first attempt at demonstrating that it was capable of tackling its primary task was a disastrous failure. In her attempt at making a one-season passage of the Northern Sea Route in the summer of 1933 the steamer Chelyuskin became beset in the ice of the Chukchi Sea, and after drifting helplessly for several months, was ultimately crushed and sank on February 13, 1934. However, the new organization’s reputation was definitely redeemed the following year when the icebreaker Fyodor Litke reached Murmansk on September 20, 1934, having succeeded where Chelyuskin had so utterly failed.
To summarise, one of Tony’s “trial runs in 1933” was “a disastrous failure”!
On 1 October 1932 the icebreaking steamer Sibiryukov emerged from the ice in Bering Strait having completed the first one-season passage of the Northern Sea Route from Arkhangelsk. It was not an unqualified success, however; Sibiryakov had lost her propeller two weeks previously and had managed to reach the edge of the ice only under improvised sails and with a large measure of luck.
Moving on to another 1933 “trial run” Bill informs us that:
In 1933 the newly-formed Gluvsevmorput’ dispatched the first convoy of freighters via the Northern Sea Route to the mouth of the Lena to deliver cargoes bound for the Yakut ASSR. It consisted of three freighters and was escorted by the icebreaker Krasin. Despite heavy ice conditions in the Kara Sea two of the ships reached Tiksi, their destination, and unloaded their cargoes. The third ship, bound for Bukhta Nordvik with an oil exploration expedition, ran aground near its destination and turned back. Severe ice conditions in Proliv Vil’kitskogo forced all three ships to winter at the Ostrova Samuila. A shore station was built and a full scientific programme maintained all winter. Urvantsev, the chief scientist, took the opportunity to make a winter reconnaissance survey of the northern portion of Poluostrov Taymyr using half-tracks. The convoy was freed from the ice by the icebreaker Fyodor Litke in the summer of 1934 and having completed their tasks all three ships ultimately returned safely to Arkhangel’sk.
Not exactly an unqualified success either then, and certainly not a single season transit of the full Northern Sea Route! However despite all her assorted trials and tribulations the icebreaker Fyodor Litke did manage to complete a single season transit from Vladivostok to Murmansk, and according to Wikipedia “became a Soviet propaganda icon”.
Returning to Barr 1980, we discover that:
In the summer of 1935 Fyodor Litke escorted the first two laden freighters, Vantsetti and Iskra, through the Sea Route from west to east; sailing from Leningrad on July 8, they reached Vladivostok on October 8. Meanwhile two other steamers, Anadyr’ and Stalingrad, made the through-passage in the opposite direction, sailing from Vladivostok on July 23 and 25 and reaching Leningrad on October 16.
The following season (1936) saw a spectacular increase in activity along the Northern Sea Route; a total of 160 ships travelled parts of the route (the bulk of them from the west to the mouth of the Yenisey and back), while 16 vessels made the through-passage, 14 from west to east, and 2 from east to west, the latter being Vantsetti and Iskra homeward bound to Leningrad. The ships heading east included the first Soviet warships to utilize the Northern Sea Route, the destroyers Voykov and Stalin, escorted once again by Fyodor Litke
Hence 1935 and 1936 were far more successful years than the previous two, but then we come to 1937. Quoting Barr 1980 once again:
The plans for the 1937 season were equally ambitious, but by then the run of luck had ended. Due to a combination of abnormally severe ice conditions and some very unfortunate decisions as to routing of convoys and deployment of icebreakers towards the end of the season, 25 ships were obliged to winter on an emergency basis at various points in the Soviet Arctic. Perhaps the most critical aspect, however, was that of Gluvsevmorput’s fleet of icebreakers; only one, the veteran Yermak was not forced to winter in the Arctic.
One of the other questions I asked Tony Brown over at Prof. Judy’s was:
It would be helpful if you selected an ice chart from the 1930s to illustrate your point.
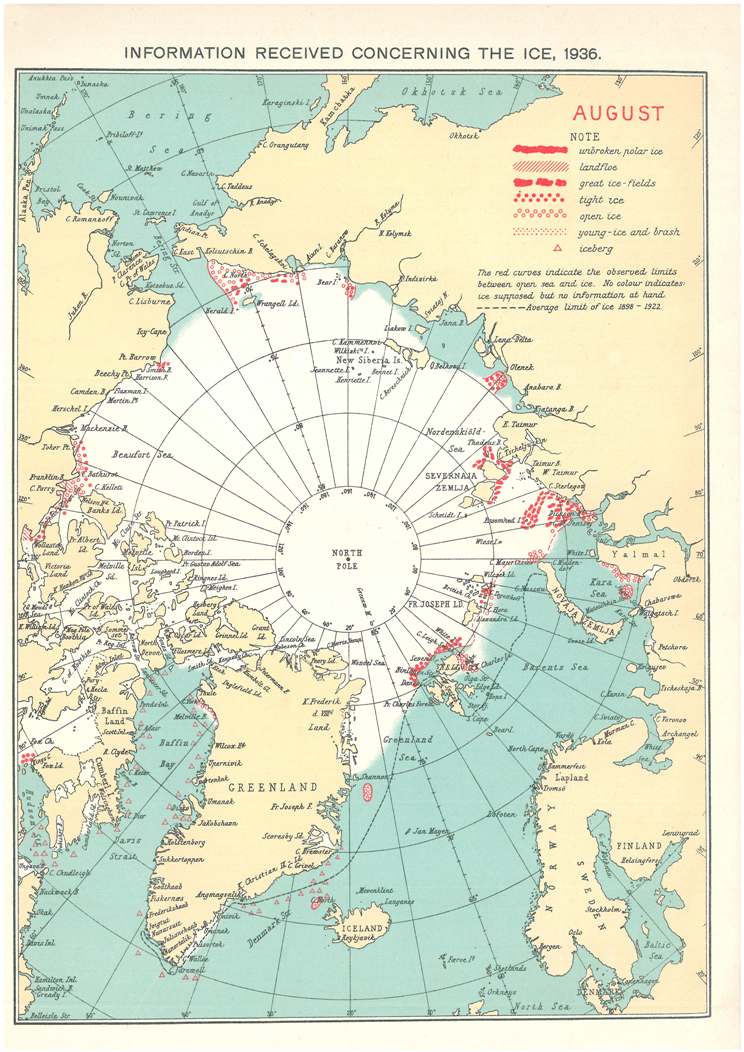
Tony still hasn’t got around to doing that, so why don’t we take a look at the August 1936 chart from the archives of the Danish Meteorological Institute:
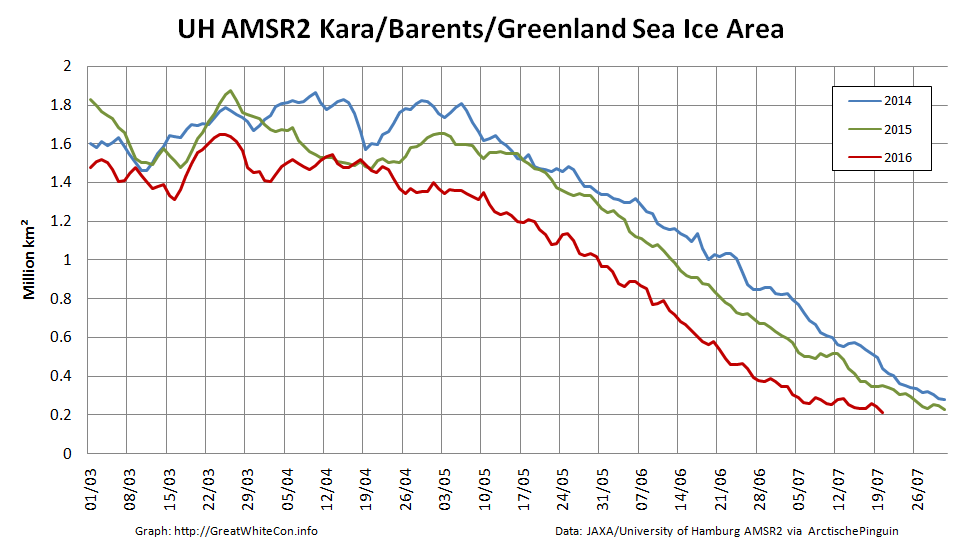
It certainly doesn’t look to me as though the entire Northern Sea Route was covered by no more than 3/10 concentration sea ice in August 1936. For comparison purposes here’s the Russian Arctic and Antarctic Research Institute ice chart for the end of August 2016:
For an eyewitness account of conditions along the Northern Sea Route in 2016 see our series of articles on the voyage of the yacht Northabout
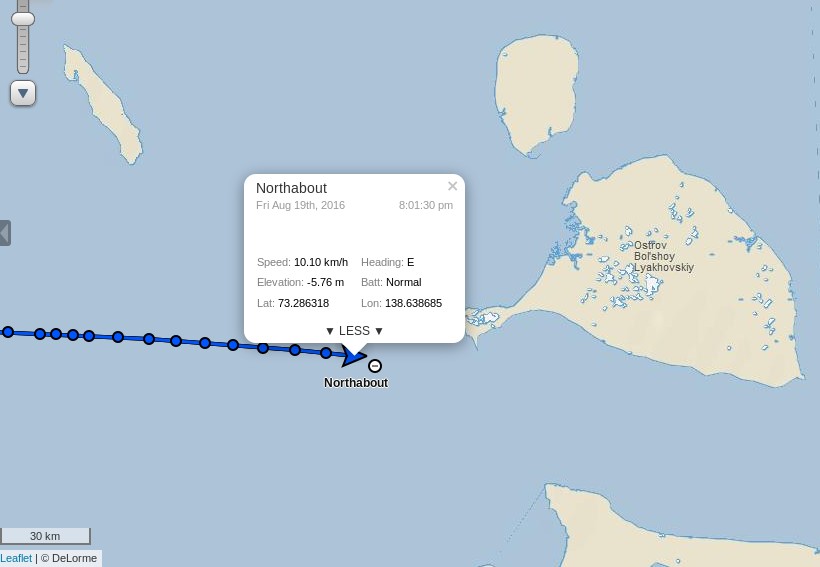
It’s time to open another chapter in the continuing adventures of Northabout. The Polar Ocean Challenge team have been plagued by sea ice along their route across the Laptev Sea, but currently they are hurrying towards the exit into the East Siberian Sea via the Dmitry Laptev Strait:
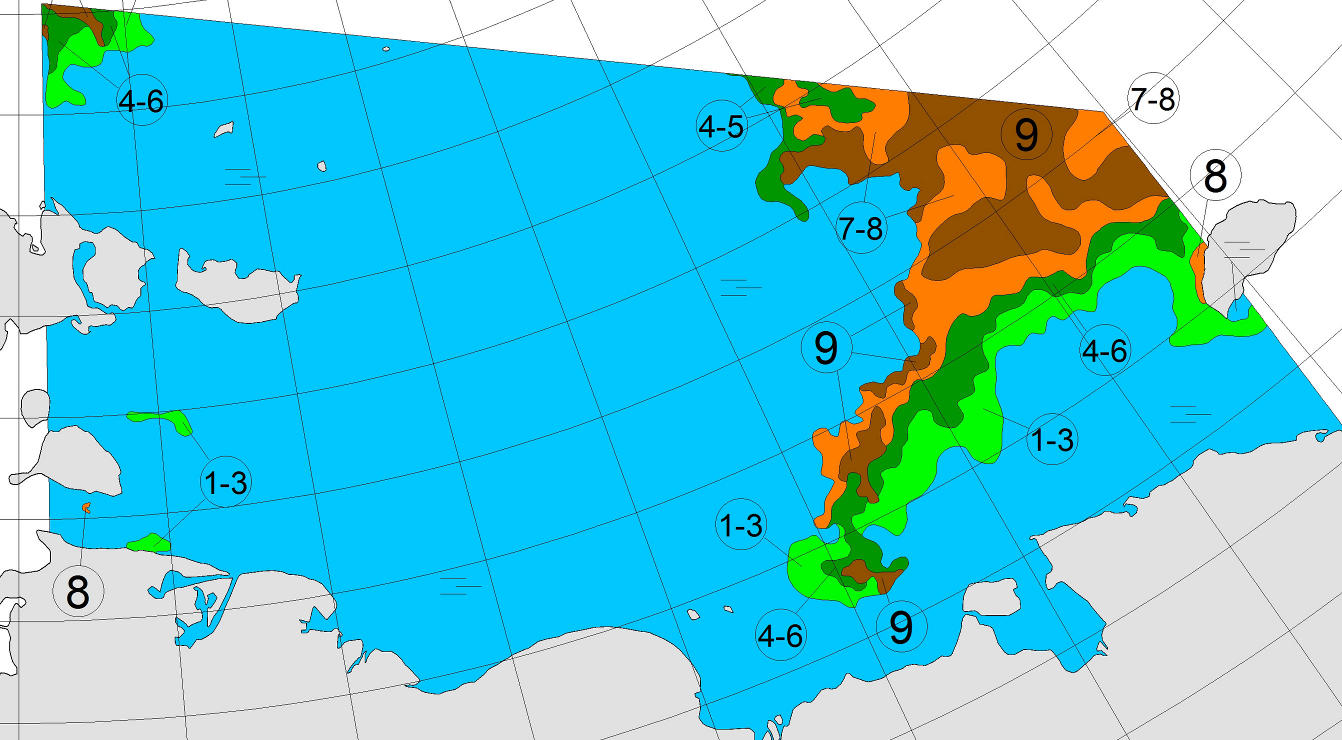
The latest chart of sea ice in the East Siberian Sea from the Arctic and Antarctic Research Institute suggest they should now have plenty of (comparatively!) plain sailing ahead of them:
Certain quarters of the cryodenialosphere have been questioning the plucky little yacht’s ability to make it through the Northwest Passage before it freezes up once again in the Autumn. As a crude reality check on that assertion let’s see how previous successful single season polar circumnavigations fared in that regard. The international date line runs through the Bering Strait, and effectively defines a boundary between the Northern Sea Route and the Northwest Passage. In 2010 Børge Ousland and Thorleif Thorleifsson in the catamaran Northern Passage crossed the date line on September 3rd:
Let’s wait and see when Northabout manages to pass that milestone, before heading to their next scheduled port of call at Barrow in Alaska.
[Edit – August 21st]
Northabout has spotted some more sea ice, this time in the Dmitry Laptev Strait. Presumably the small area shown in the AARI chart above? According to the latest “Ship’s Log”:
Well slowly making progress, and now into a new sea, East Siberian, Looks the same to be honest. Saw a ship,on the AIS , but couldn’t see it with the fog. Went between the Islands. We had a large patch of 8/10ths ice in the middle, but managed to keep north of it. Along the coast you could again see the remnants of an old Polar station. What a vast coast to look after.
Just as things were getting into a rhythm, the engine is over revving. We are so close but so far out here. My stomach is sometimes in my mouth, Comrades trying to work it out. If not, is a slow sail from here to Alaska.
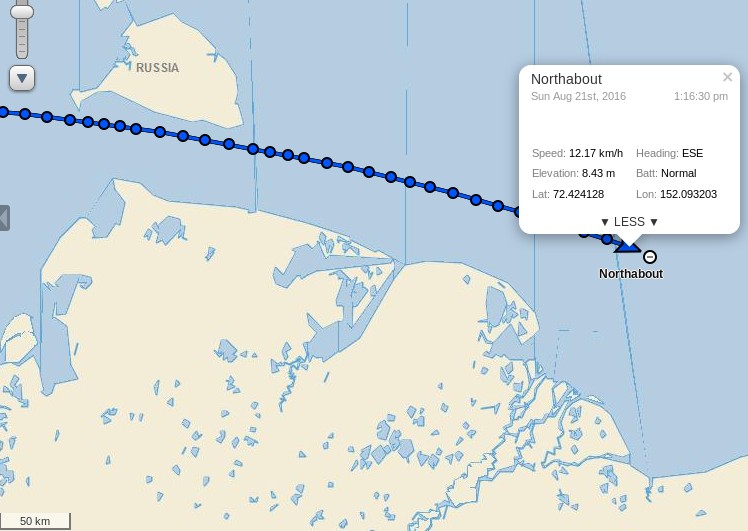
The reported engine trouble doesn’t seem to have slowed Northabout down. She crossed 150 east earlier this morning and is now passing the delta of the Indigigirka River:
[Edit – August 22nd]
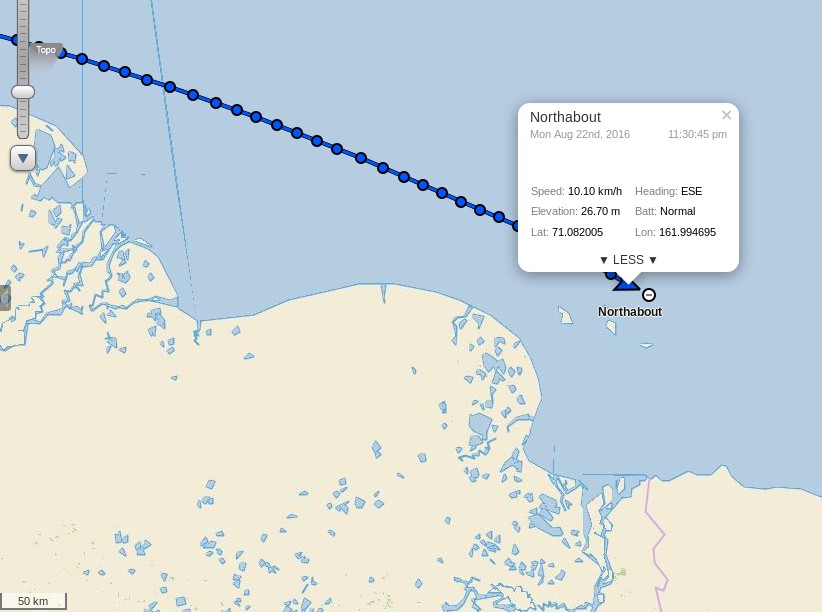
Her engine has been serviced, and Northabout continues to make good progress. She’s crossed 160 east, and is now passing the delta of the Kolyma River:
We’ve got enough wind to put the staysail out and the skies are clear. I think quite a lot of how I was feeling may have been that I hadn’t got any sunshine for over two weeks, the last couple of days however have been warm(ish) and bright. I at least am coming dangerously close to feeling actually happy, I don’t know about anyone else… Provided we continue like this we should be in Point Barrow in under a week.
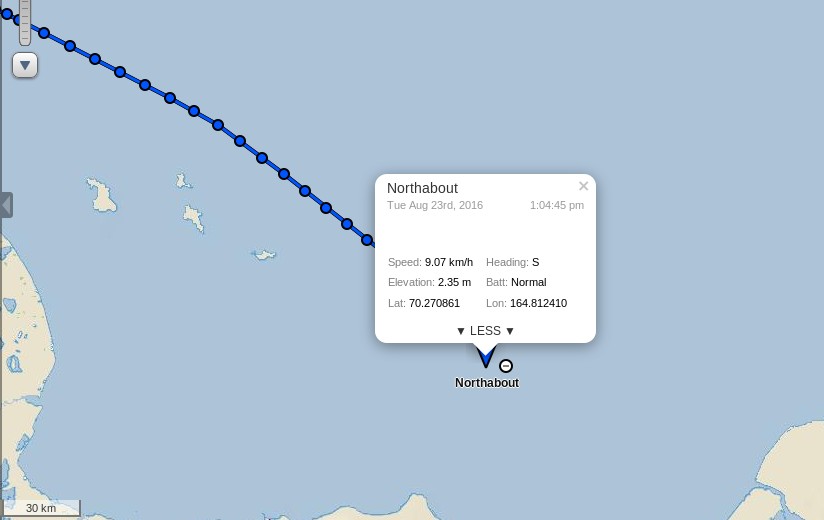
[Edit – August 23rd]
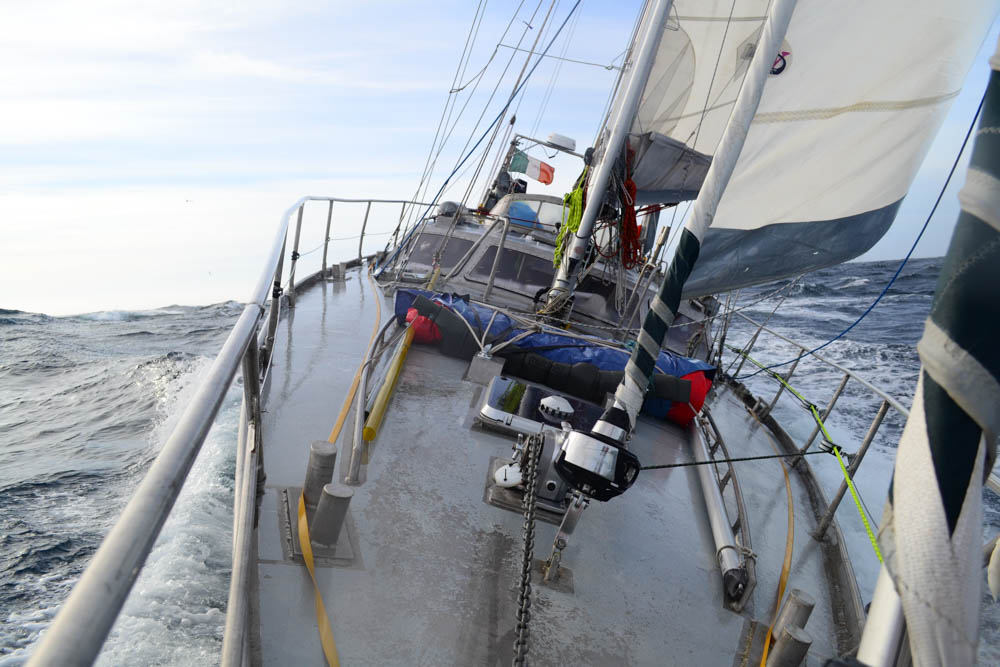
Northabout looks to be turning south:
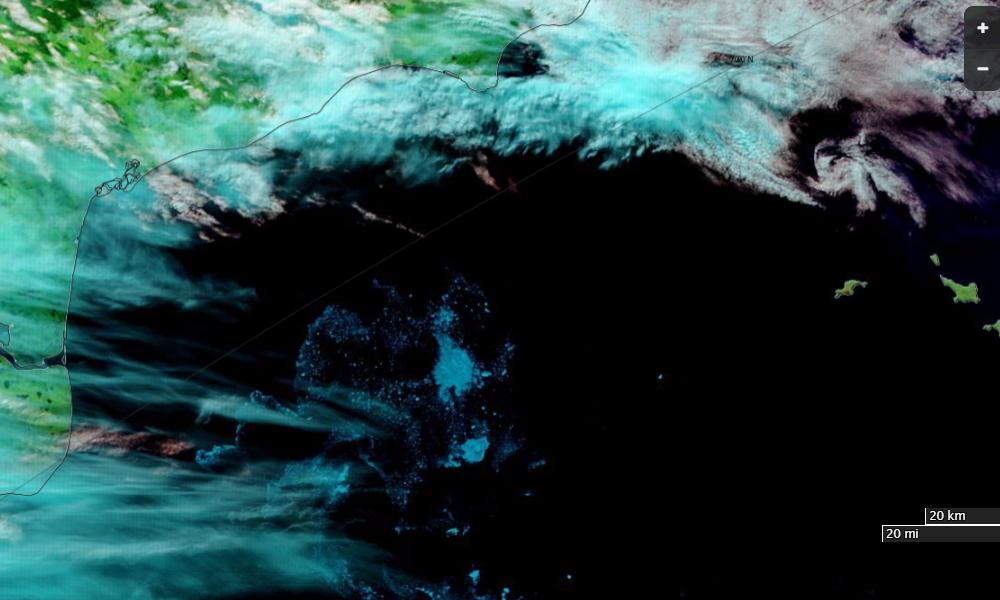
Presumably that is to skirt the patch of high concentration sea ice in their path, rather than try to break through the lower concentration area to the north (which is towards the bottom of this image!):
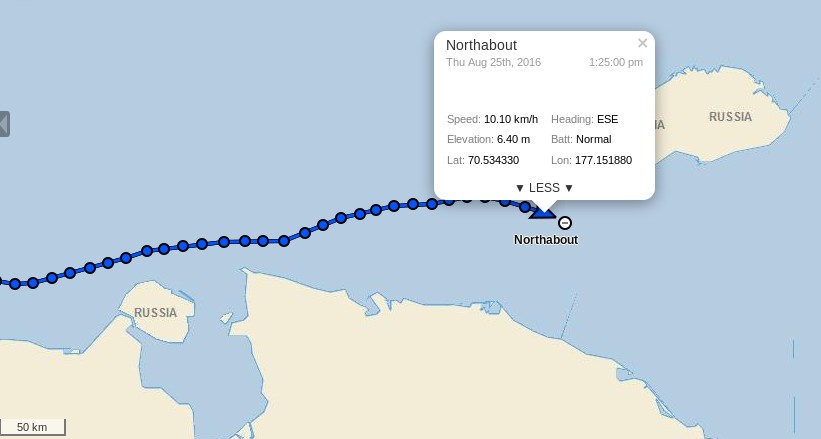
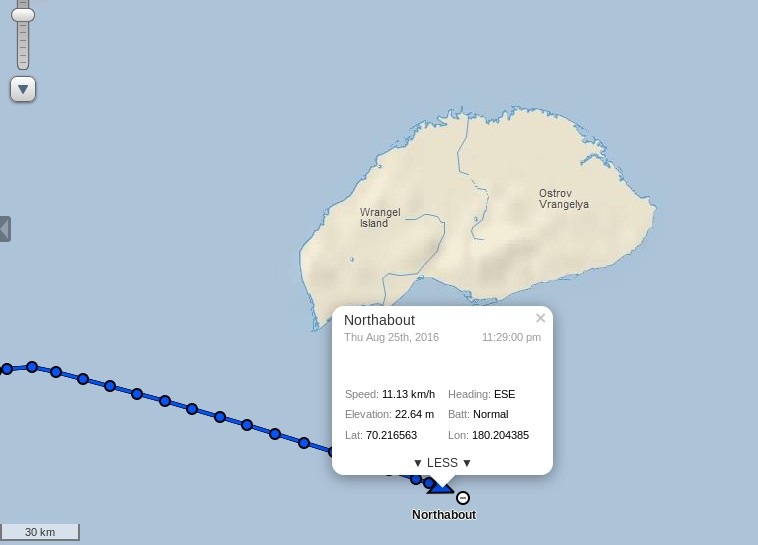
[Edit – August 25th]
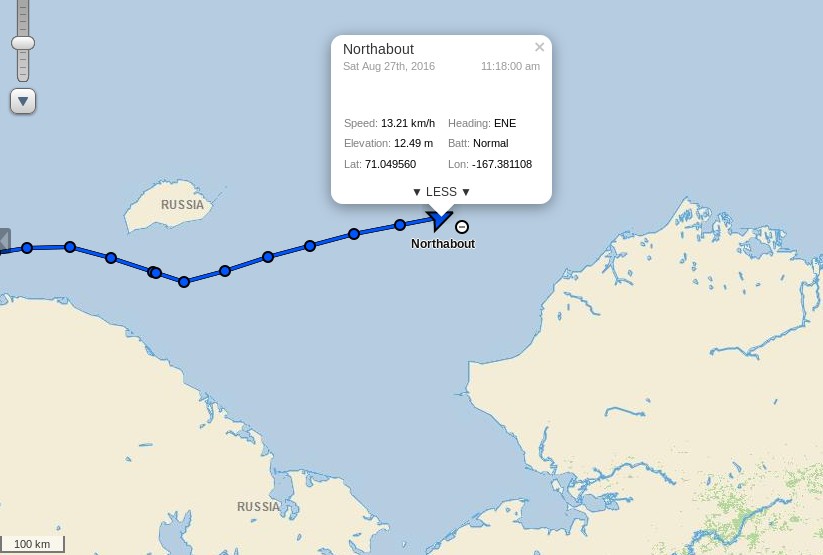
Northabout is currently closing in on “the edge of the world” at 180 degrees east and/or west:
Her crew aren’t entirely happy with the speed at which that is happening at present though:
A long slog of a day. Very choppy seas which makes living onboard difficult, especially sleeping, when you can be fast asleep and suddenly wake up in mid air.
The wind we had was a head wind, so slow going. Getting to the edge of the World is proving tiresome.
Our track to get the best wind is towards the ice, and north east, hoping this will change during the night, and bring us back south to our waypoint.
A long slog in the Chukchi Sea. Its renown for its wild weather and seas. With rising winds now in the 25/30 knots, we have had a bumpy ride, but fast and in the right direction.
Well, well, we passed the date line and the W 168 58 .620 at 16.57 boat time, that is the point we can inform the Russian Authorities that we have finished their Northern Sea Route, and we no longer have to report to them daily. I will celebrate this milestone when we get to Point Barrow. It’s only just sinking in what we have all done.
Next stop Barrow, and after that Northabout takes on one of the Southern routes through the NorthWest Passage. It looks like she’ll have much more difficulty spotting some sea ice than on the first half of her polar circumnavigation!
According to the old saying “A change is as good as a rest”, so rather than plagiarise today’s title from a “skeptical” web site we’ve invented this one all by ourselves. Northabout is a small yacht with big ideas. (S)he wants to circumnavigate the North Pole in one summer season. However certain cryoblogospheric commenters are somewhat skeptical that this can be achieved this year. Take Tony Heller for example:
There has been very little melt going on in the Arctic Ocean the last few days, due to cold cloudy weather.
A group of climate clowns were planning on sailing around the entire Arctic Ocean through the Northeast and Northwest Passages (to prove there isn’t any ice in the Arctic) but are stuck in Murmansk because the Northeast Passage is completely blocked with ice.
The “group of climate clowns” aboard Northabout that Mr. Heller refers to are led by David Hempleman-Adams. According to the Polar Ocean Challenge web site:
David is one of the most experienced and successful adventurers in the world.
In his forty years as an adventurer, David was the first person to reach the highest peaks on all seven continents and journey fully to the North and South Geographical and Magnetic Poles. He has broken forty-seven Federation Aeronautique Internationale ballooning records
My name is Tony Heller. I am a whistle blower. I am an independent thinker who is considered a heretic by the orthodoxy on both sides of the climate debate.
I have degrees in Geology and Electrical Engineering, and worked on the design team of many of the world’s most complex designs, including some which likely power your PC or Mac. I have worked as a contract software developer on climate and weather models for the US government.
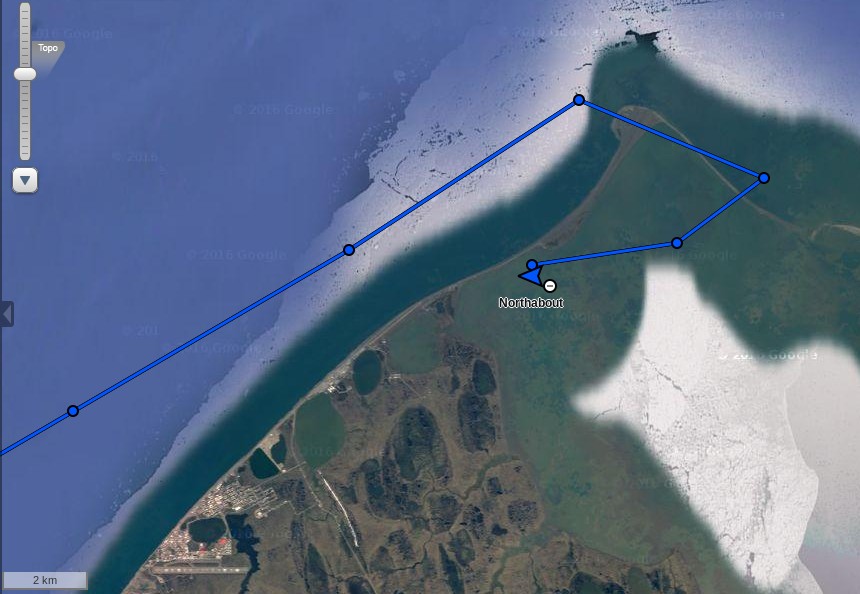
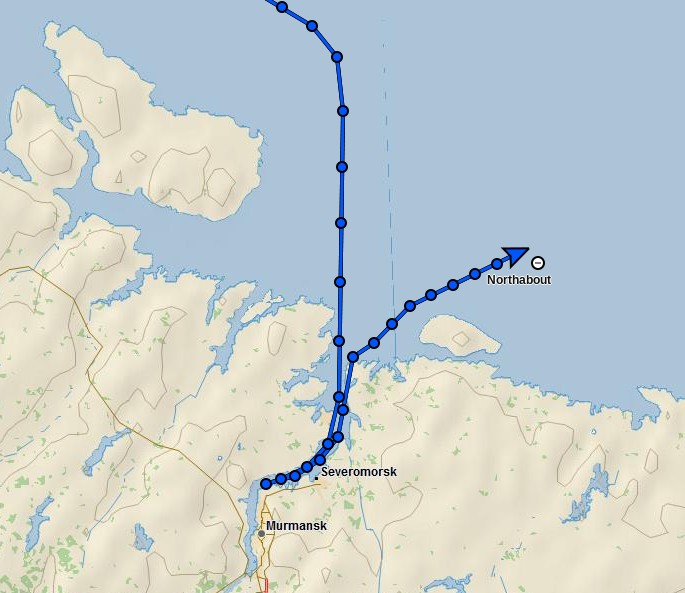
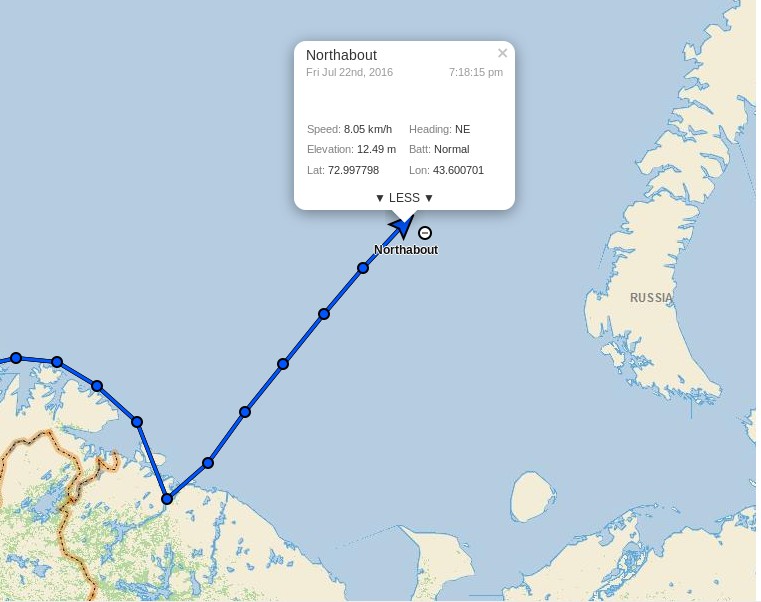
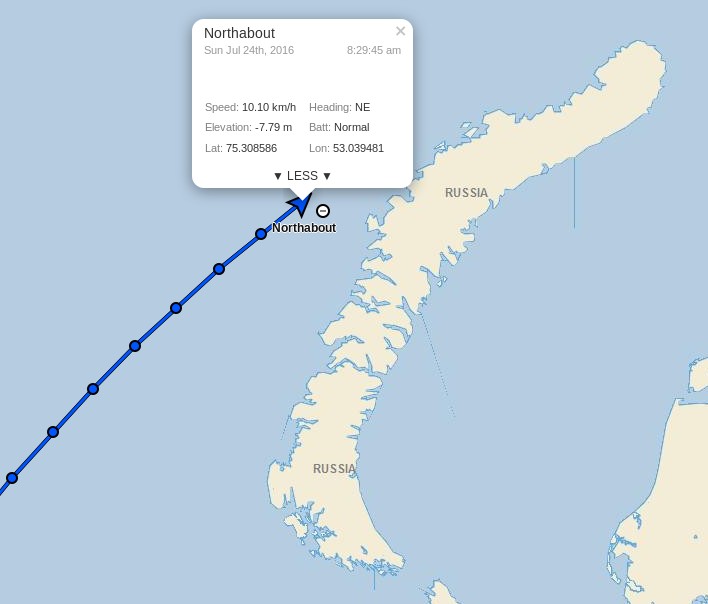
However despite Tony’s long list of qualifications he is evidently currently quite confused, since according to the Polar Ocean Challenge live tracking map David and Northabout are not in actual fact “stuck in Murmansk” at all:
This shouldn’t come as surprise to anyone with an internet connection and a desire to check the facts, since as we speak there is currently remarkably little sea ice cover on the Atlantic side of the Arctic Ocean:
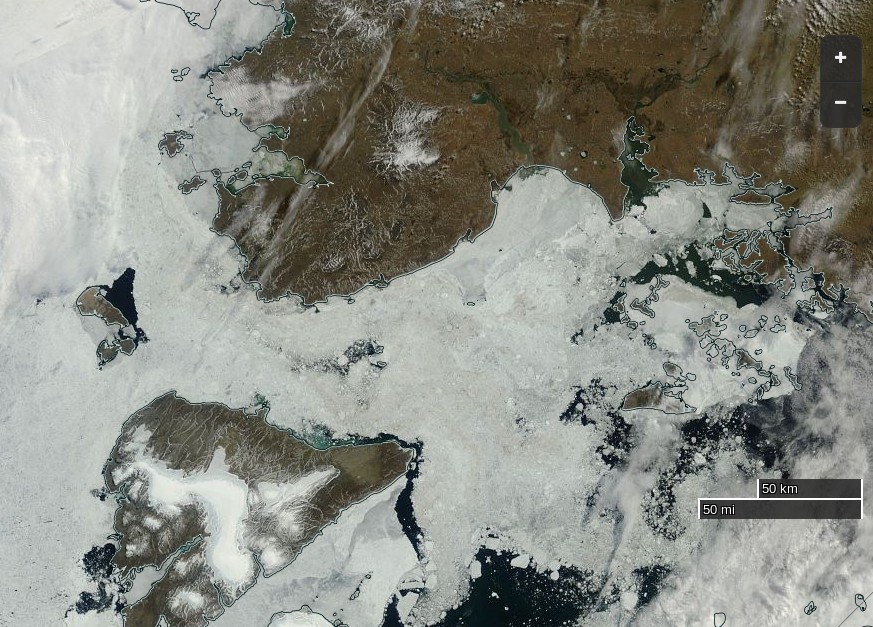
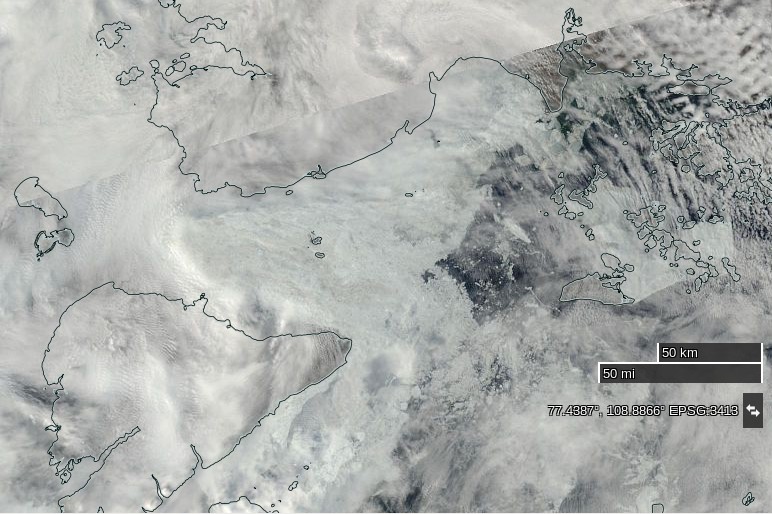
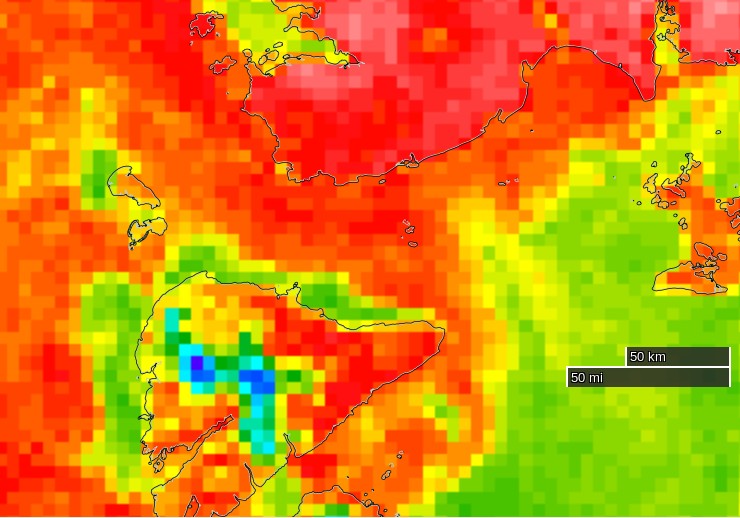
Hence Northabout should find the next leg of his/her voyage across the Barents and Kara Seas pretty plain sailing. However Vilkitsky Strait, the passage from the Kara into the Laptev Sea, is currently looking a trifle tricky:
NASA Worldview “true-color” image of the Vilkitsky Strait on July 20th 2016, derived from the MODIS sensor on the Terra satellite
Do you suppose Tony Heller suffers from precognitive dreams?
[Edit – July 22nd 2016]
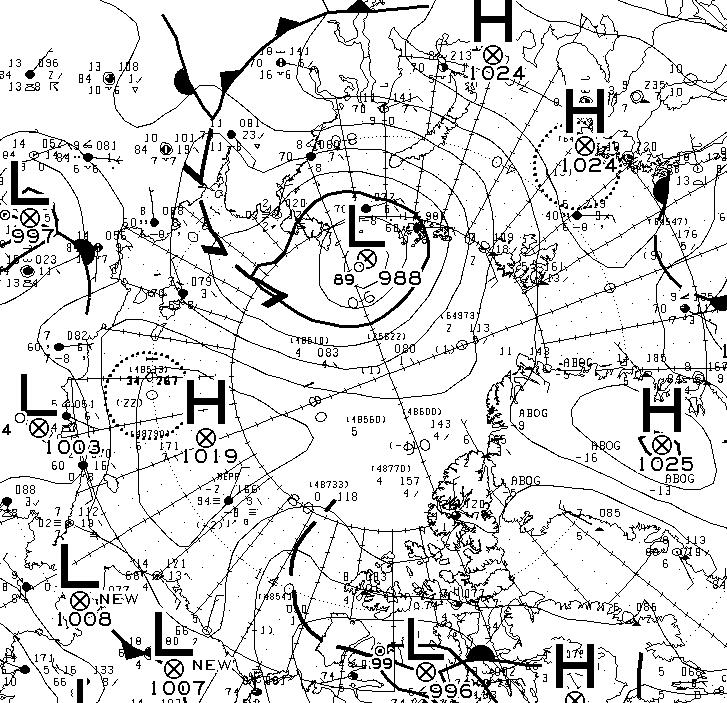
According to Environment Canada this morning there’s a 988 hPa central pressure cyclone causing a bit of a blow in the Vilkitsky Strait at the moment:
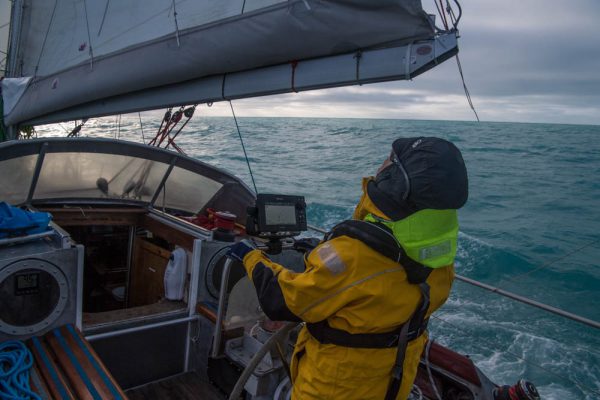
Sea and air temperature getting colder as we venture further north. Saw quite a lot of Dolphins for the first time around the Yacht. Still sea gulls flying behind and skimming the waves.
Had some promising Canadian ice charts yesterday, but that’s a long way off. Today we should get an update with the Russian side. fingers crossed it is still not solid around the cape and Laptev sea. That could slow us down considerably. The wind has been blowing the pack ice against the land, so very difficult to get around the shore, but let’s see what Santa brings.
P.S. Maintaining his usual modus operandi, Tony Heller has penned a new article today, containing a satellite image remarkably similar to the one just above. Under the headline “The 2016 Franklin Expedition” he tells his loyal readership:
The Polar Ocean Challenge is headed off into the ice.
They will run into this in three days – hundreds of miles of solid ice. Without an icebreaker, they are going nowhere. I asked them on Twitter if they have an icebreaker. I haven’t received a response, and will be monitoring them by satellite to see if they are cheating.
By some strange coincidence we’re “monitoring them by satellite” too:
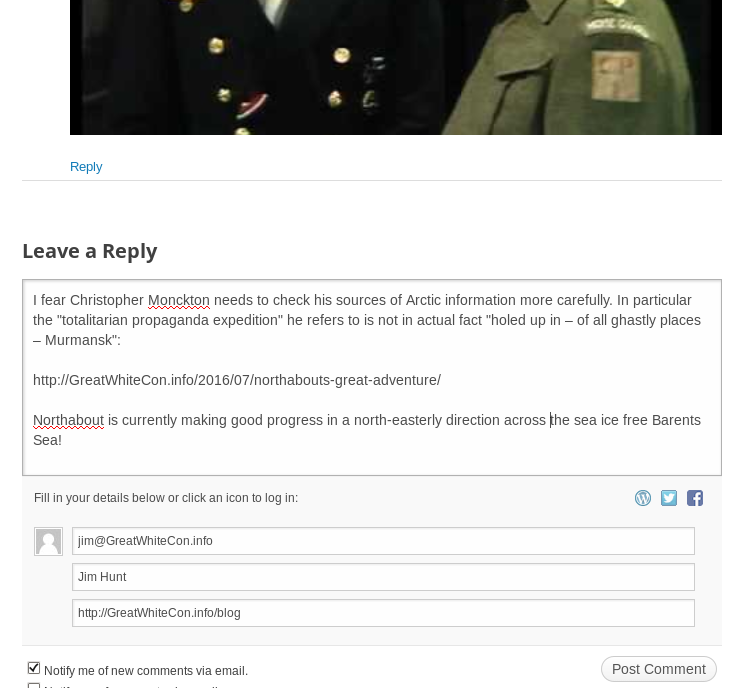
As for ice melt, yet another totalitarian propaganda expedition intended to “raise awareness” of climate “catastrophe” by trying to sail around the Arctic in the summer has just come a cropper owing to – er – too much ice. Neither the North-East Passage nor the North-West Passage is open, so the expedition is holed up in – of all ghastly places – Murmansk. That’ll teach Them.
However my corrective comment has yet to see the light of day at WUWT:
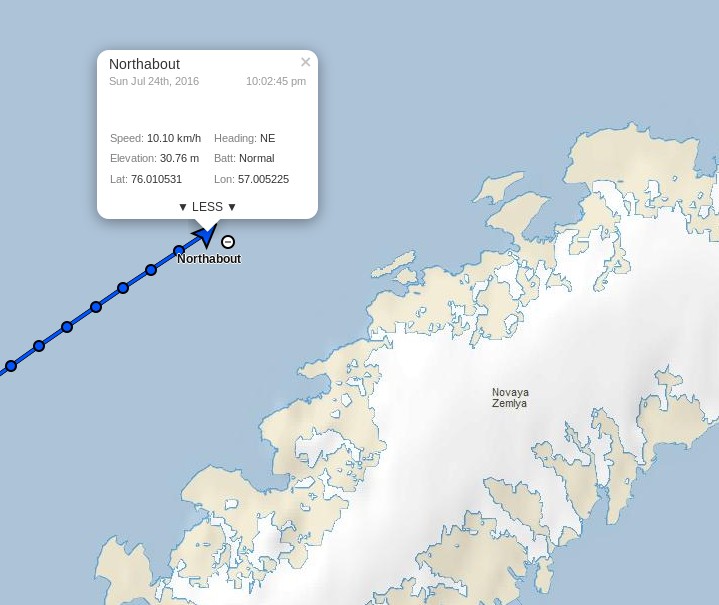
Meanwhile Northabout resolutely presses on regardless, and has just passed 74 degrees North:
whilst the sea ice edge in the north-eastern Kara Sea has retreated somewhat over the last three days:
NASA Worldview “true-color” image of the Vilkitsky Strait on July 23rd 2016, derived from the MODIS sensor on the Terra satellite
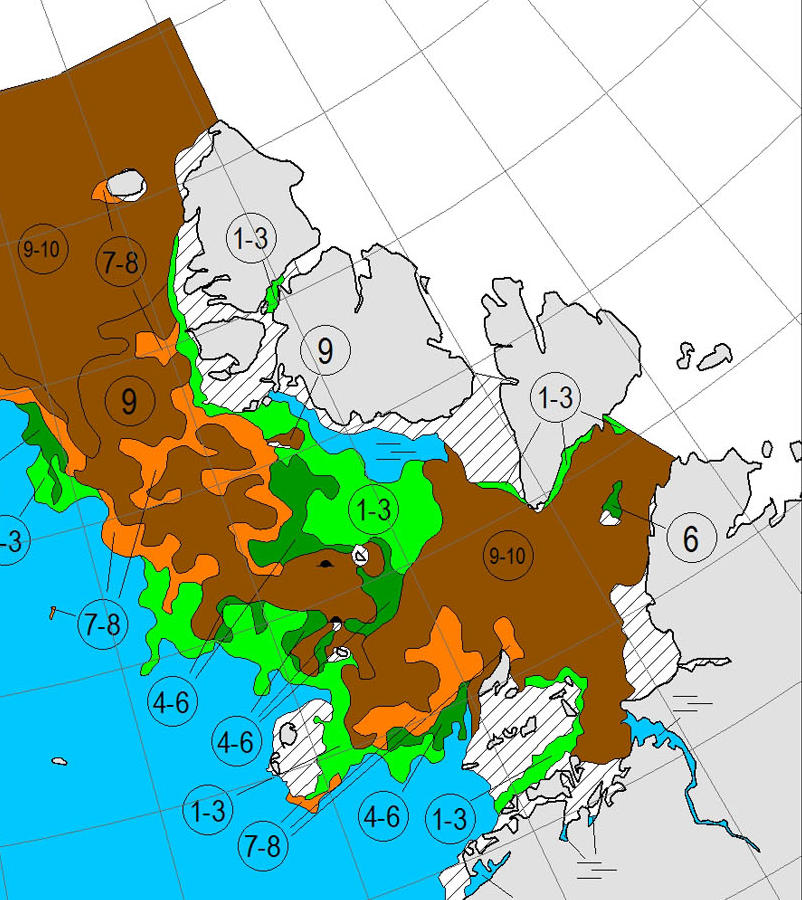
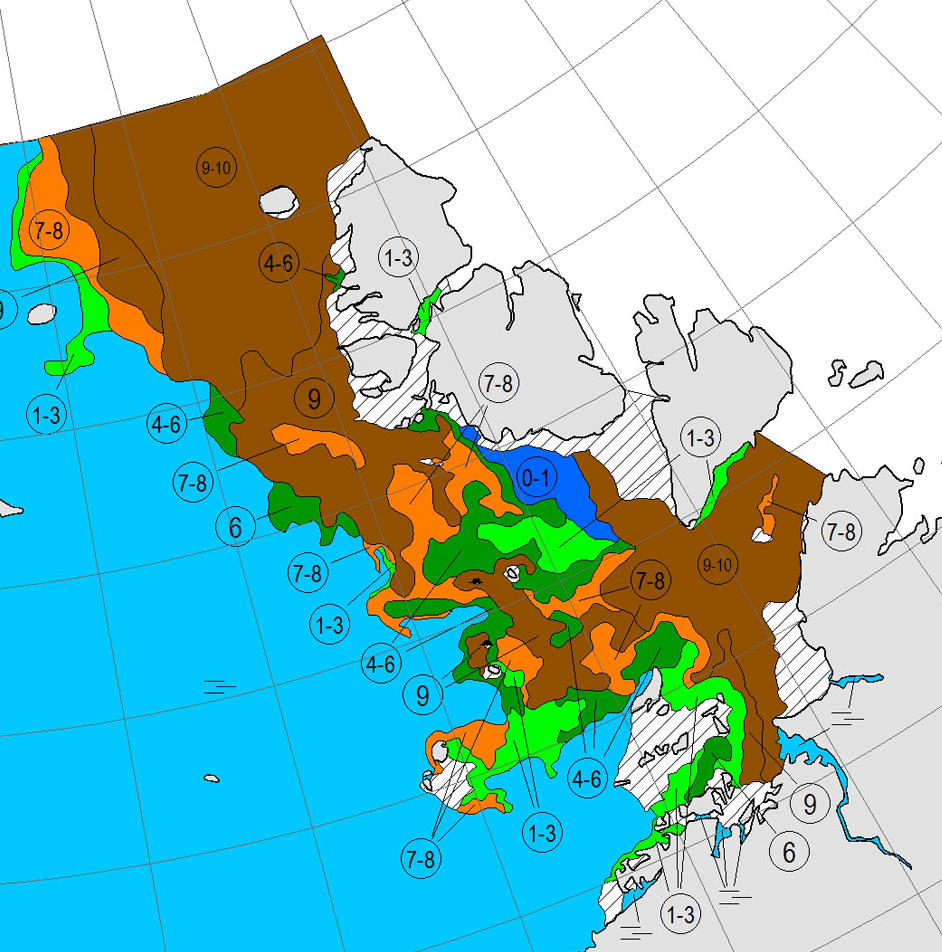
Here’s the July 20-22nd AARI map of the Vilkitsky Strait area:
On the topic of Arctic sea ice melt in general Viscount Monckton opines over on WUWT that:
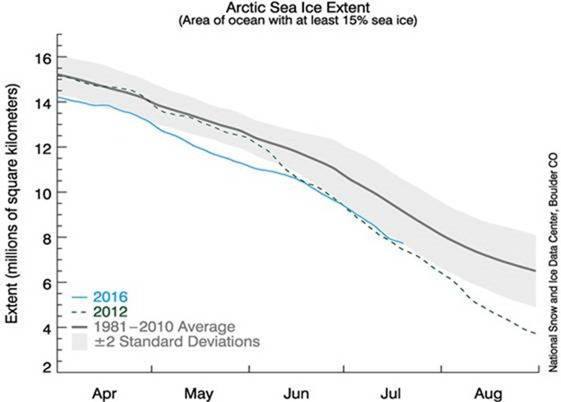
According to the National Snow and Ice Data Center’s graph, also available at WUWT’s sea-ice page, it’s possible, though not all that likely, that there will be no Arctic icecap for a week or two this summer:
Even if the ice disappears for a week or two so what? The same was quite possibly true in the 1920s and 1930s, which were warmer than today in the northern hemisphere, but there were no satellites to tell us about it.
The Good Lord seems to have a very tenuous grasp on reality, since the NSIDC’s graph shows nothing of the sort. Perhaps he is merely indulging in irony?
[Edit – July 24th 2016]
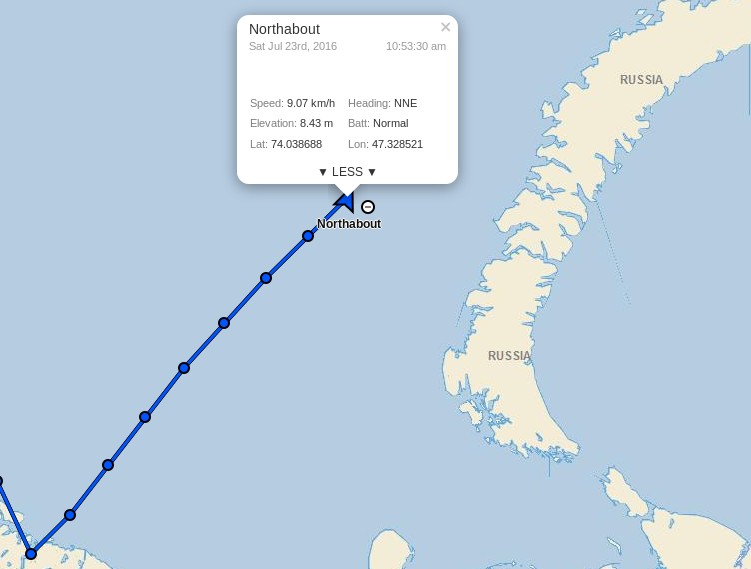
Northabout passed the 75 degrees North milestone overnight:
Clouds obscure the Vilkitsky Strait in visible light this morning but passive microwaves make it through the murk, albeit with reduced resolution. They reveal the sea ice edge in the Kara Sea receding and a narrow passage opening up along the Northern side of the Strait (North is down in the image):
NASA Worldview passive microwave image of the Vilkitsky Strait on July 24th 2016, derived from the AMSR2 instrument on the Shizuku satellite
According to Ben Edwards’ latest blog post from the Barents Sea:
I just wore a T-shirt on my first watch out of Murmansk. Today I wore my trawler suit and a primaloft under it with gloves and a hat….
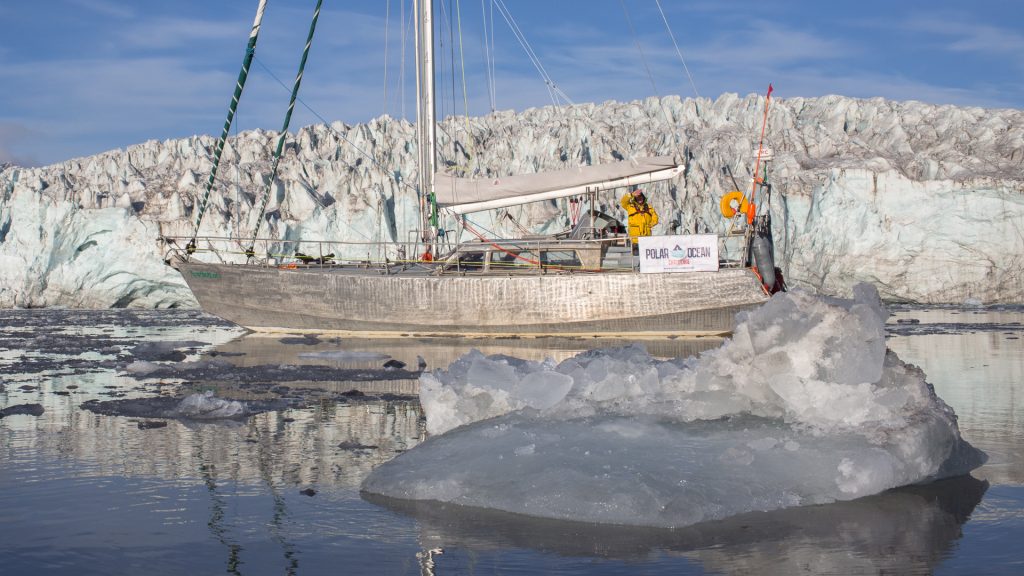
As the cryodenialosphere continue to retweet and reblog their regurgitated rubbish here’s a picture from last year of Northabout amidst some ice, especially for those apparently unable to distinguish a small yacht from a large icebreaker:
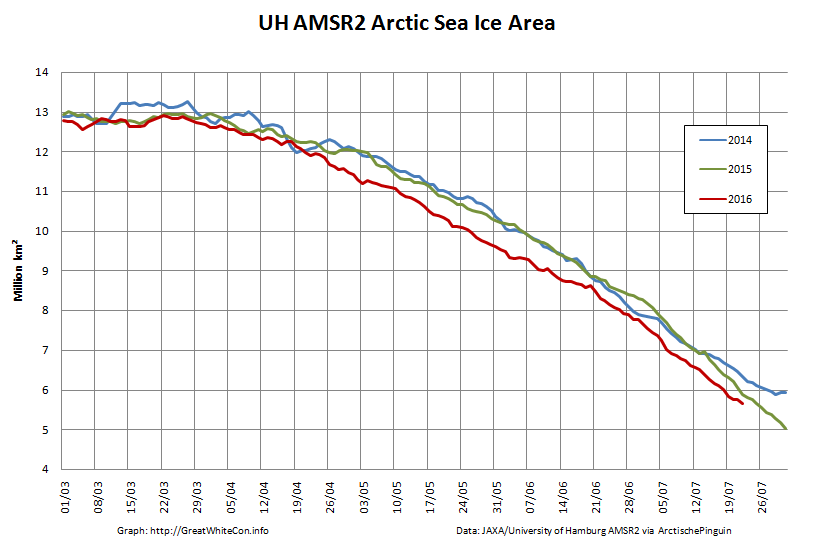
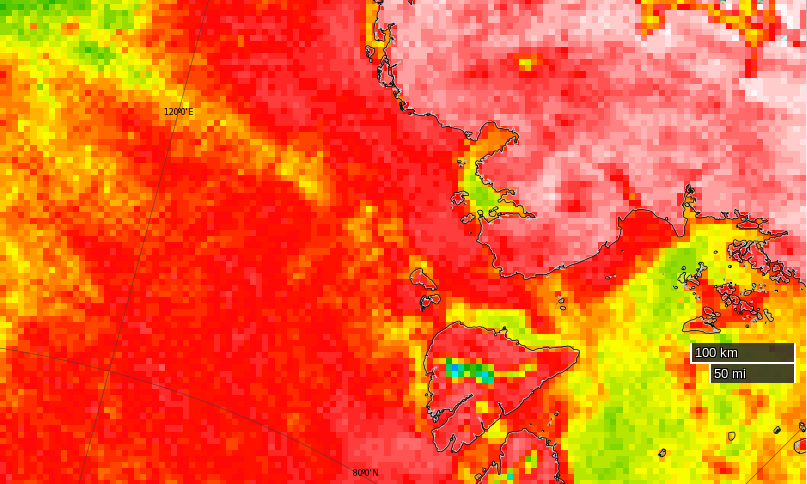
Meanwhile Arctic sea ice continues its inexorable decline:
[Edit – July 24th 2016 PM]
Shock News! Tony Heller has just published yet another article about Northabout’s Great Adventure, and yours truly gets a mention. In the headline no less!! Read all about it at:
Meanwhile the commenters over at unReal Science keep blathering on about icebreakers even though one of the more inquisitive denizens posted thisextract from the “Ship’s Log” over there yesterday:
Partly checked the new ice charts on www.nsra.ru, we still have no chance of getting through yet, not past the cape or through the Laptev sea. Nikolai, Our Russian Captain who is very familiar with this route, impresses on me that this is a very unusual year and normally clear, Not what I want to hear. We are under sail, so saving fuel, and will find a small island to shelter until we get improvements. We are still 5 days from the ice, so lets hope for some southerly winds to push the ice from shore.
Northabout is heading for the Kara Sea past the northern tip of Novaya Zemlya, and has now passed 76 degrees North:
[Edit – July 25th 2016]
The skies are still cloudy over the Vilkitsky Strait and Cape Chelyuskin, so here’s another AMSR2 passive microwave visualisation of the state of play. Note the change of scale:
NASA Worldview passive microwave image of the Vilkitsky Strait on July 25th 2016, derived from the AMSR2 instrument on the Shizuku satellite
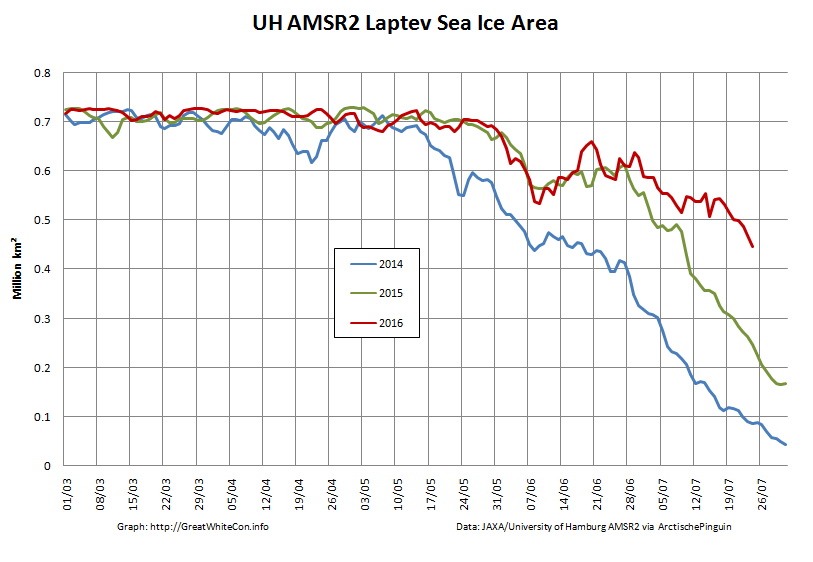
The sea ice area in the Laptev Sea has finally started decreasing at a more “normal” rate for late July, but still has a lot of catching up to do compared to recent years:
Meanwhile over at “Watts Up With That” at least one reader of Christopher Monckton’s purple prose is clearly confused. Needless to say my clarifying comment is still invisible to him:
Finally, for the moment at least, here’s some moving pictures of dolphins having fun in the Barents Sea:
[Edit – July 26th 2016]
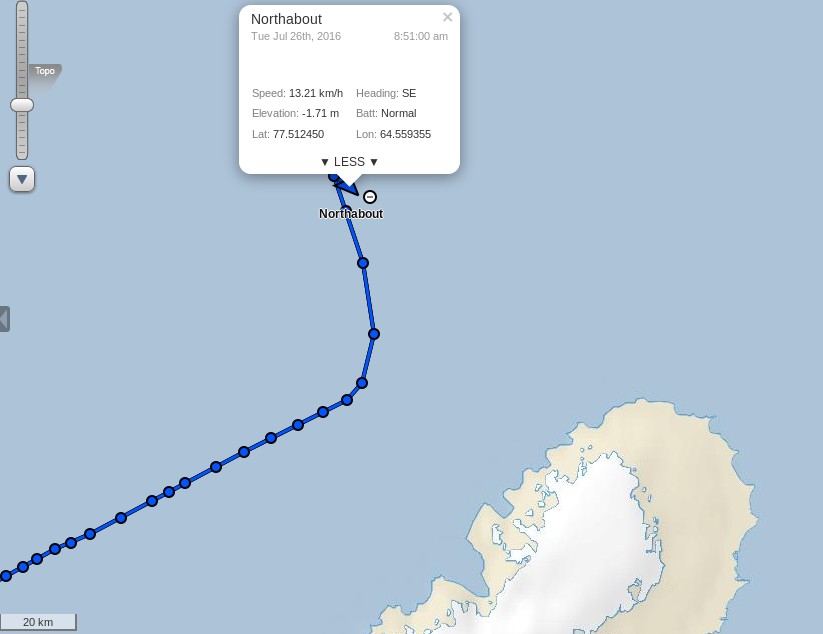
I was expecting Northabout to have entered the Kara Sea by now, but instead (s)he has headed north, and is now well above the 77th parallel:
It’s still pretty cloudy up there so here once again is the latest AMSR2 passive microwave visualisation of the Vilkitsky Strait area, with a few place names added for a bit of variety:
NASA Worldview passive microwave image of the Vilkitsky Strait on July 26th 2016, derived from the AMSR2 instrument on the Shizuku satellite
P.S. The Polar Ocean Challenge team explain via Twitter:
@GreatWhiteCon Ha ha! Thanks for interest! Waiting game, manoeuvring, strategy. Difficult to update in choppy conditions! New SHIPSLOG now
— PolarOceanChallenge (@PolarOceanChall) July 26, 2016
Choppy sea, taking four hour tacks. These sea conditions make it hard to sleep, cook or relax.
We are considering many elements all the time. We are due new Russian Ice charts today.
We know the North west is pretty clear, but this year is a very unusual year in the north east passage. Normally the Laptev Sea would be pretty open now as in previous years. It is not. This is also partly due to the wind blowing the pack ice down south and consolidating next to the land.
So, we need to get through the straight and through the Laptev Sea. So where do we wait until we can do this? We have deliberately taken our time to get to this point, and used the wind as much as we can to conserve fuel.
Now the weather has changed, the wind direction has also changed. From the calm turquoise seas, to choppy short seas, wet, windy and cold.
So we took a long tack north, and then tacked east again. There is No hurry. We will slowly make our way east, and if we can find an island with no fast ice around, will look for a sheltered spot, until we get better ice conditions.
The other options are to Heave to and wait, but this is a sailing Yacht, she needs to sail. And if we get a Southerly blow, it could change our chances very quickly to get around, so we need to be close to react.
So, another day at the office.
There was a report on the BBC Radio 4 Today programme this morning from the crew of Northabout, and an interview with Dr. Ed Blockley from the UK Met Office about the current state of sea ice in the Arctic:
Note in particular the part at 2:59:00 where Justin Webb says to Ed:
I thought that I’d read somewhere that [Northabout] had got stuck.
I cannot help but wonder what on Earth gave him that idea?
[Edit – July 27th 2016]
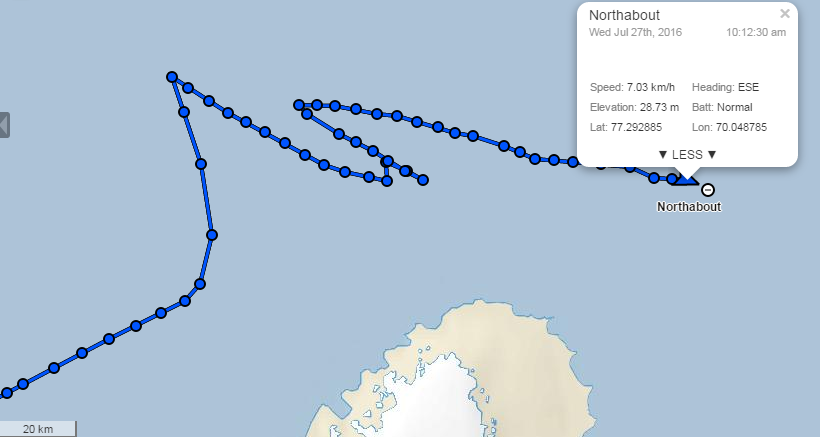
After “going round in circles” north of Novaya Zemlya yesterday Northabout is now heading East across the Kara Sea:
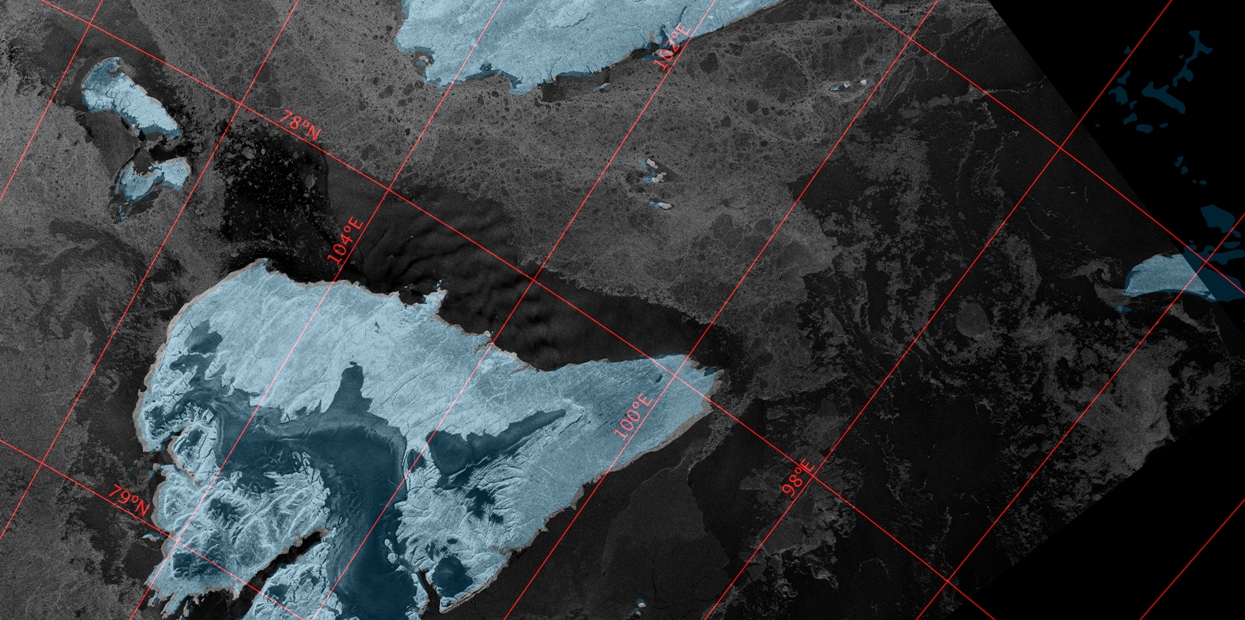
Synthetic aperture radar images from the European Space Agency’s Sentinel 1A satellite have started flowing through Polarview once again, so here’s one of where Northabout is heading:
Sentinel 1A synthetic aperture radar image of the Vilkitsky Strait on July 26th 2016
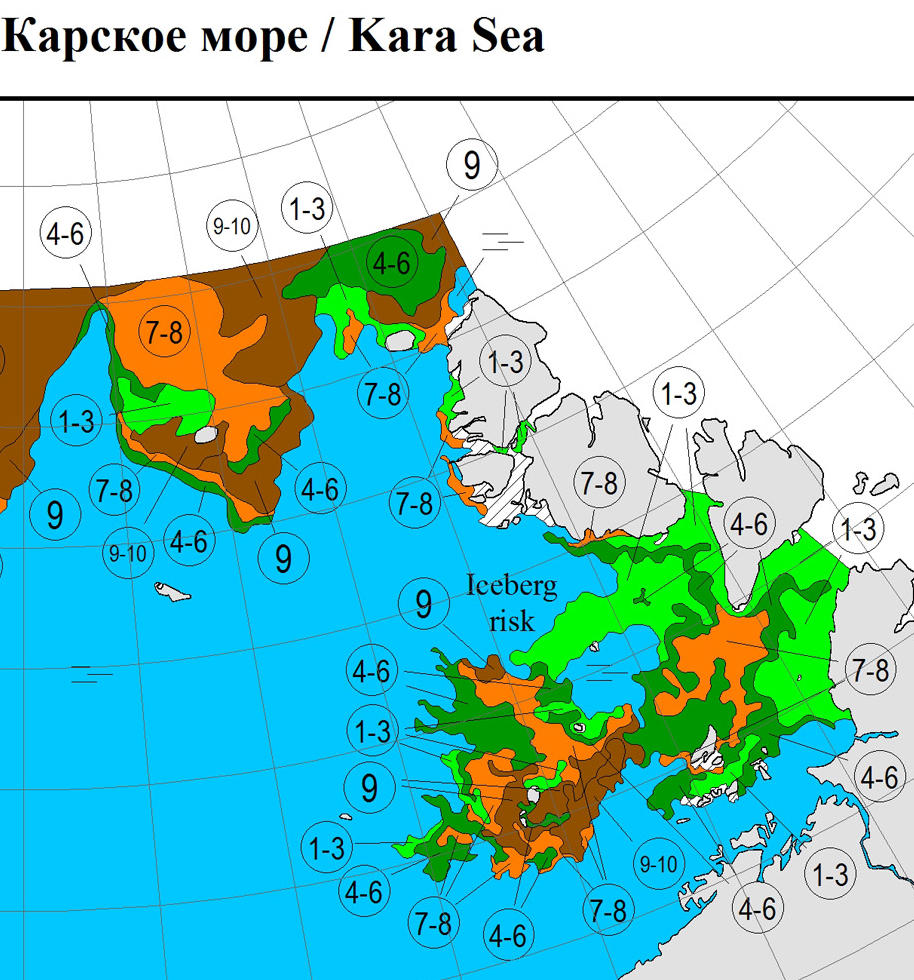
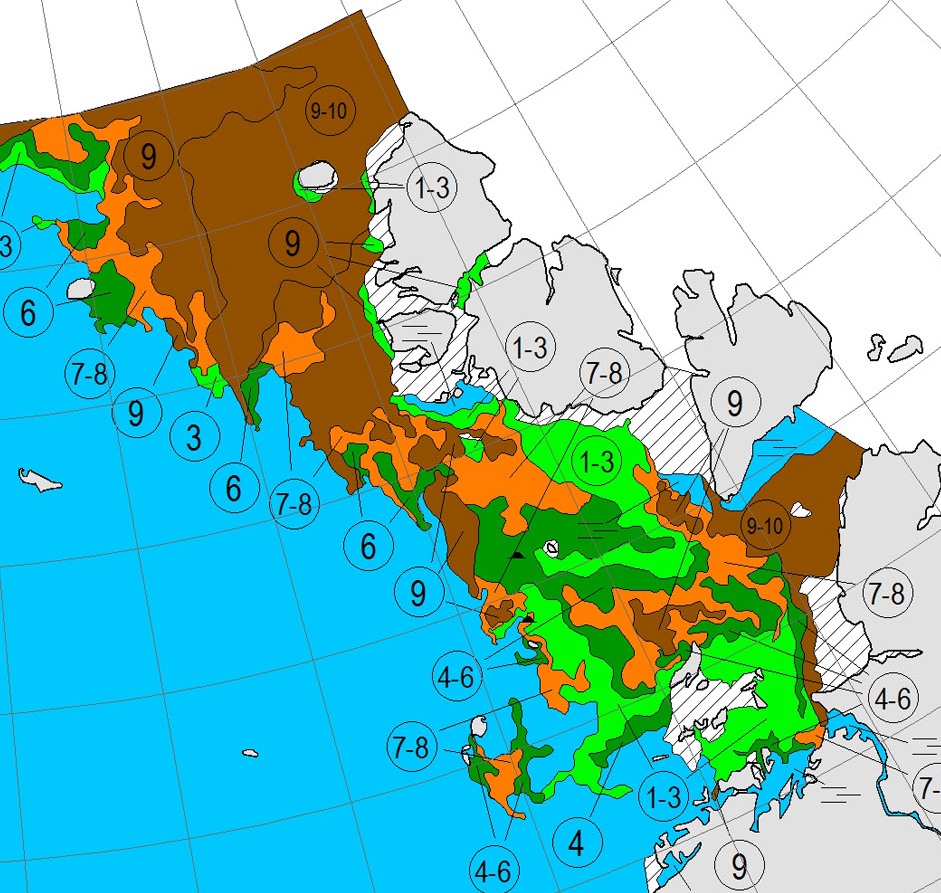
Here’s the current Arctic and Antarctic Research Institute map of the same area:
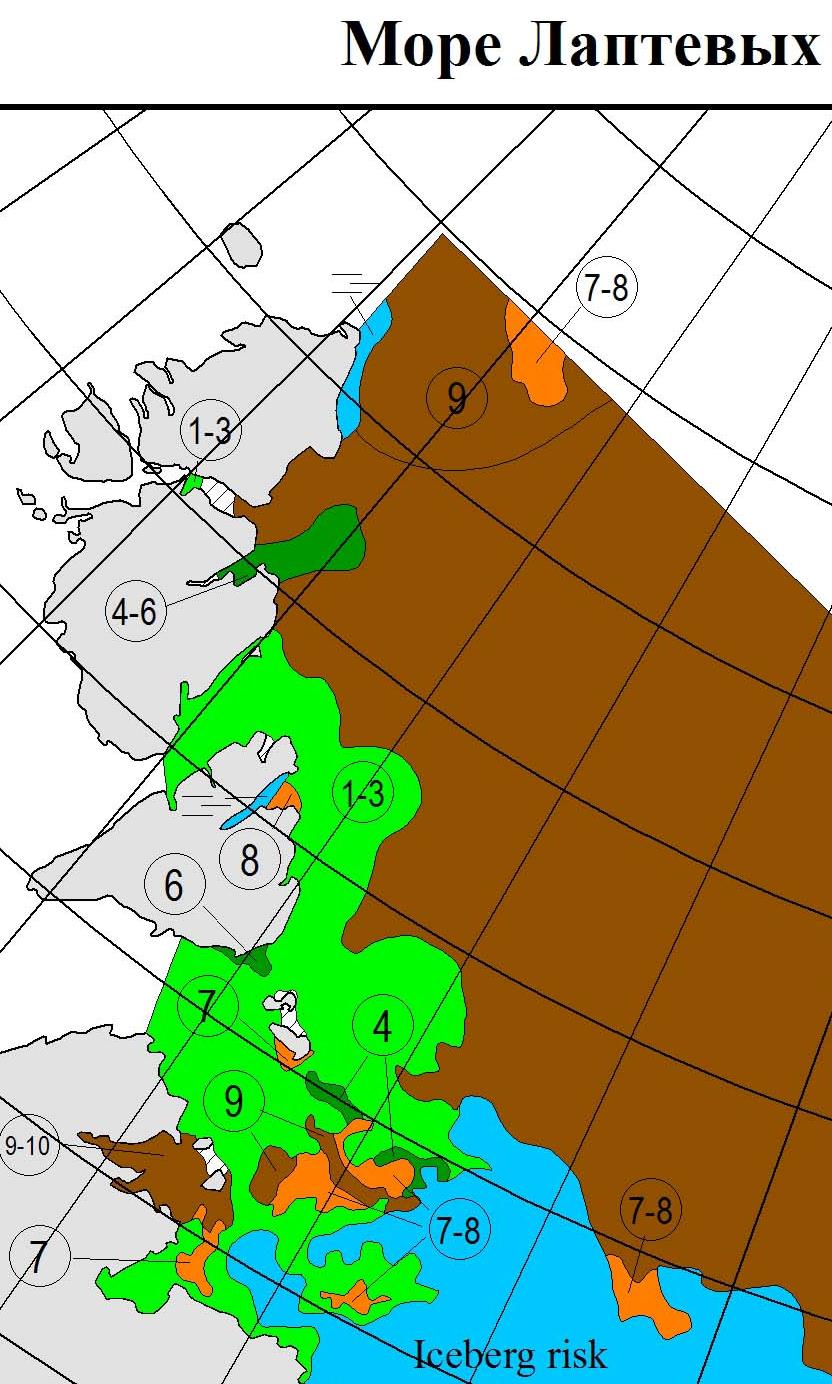
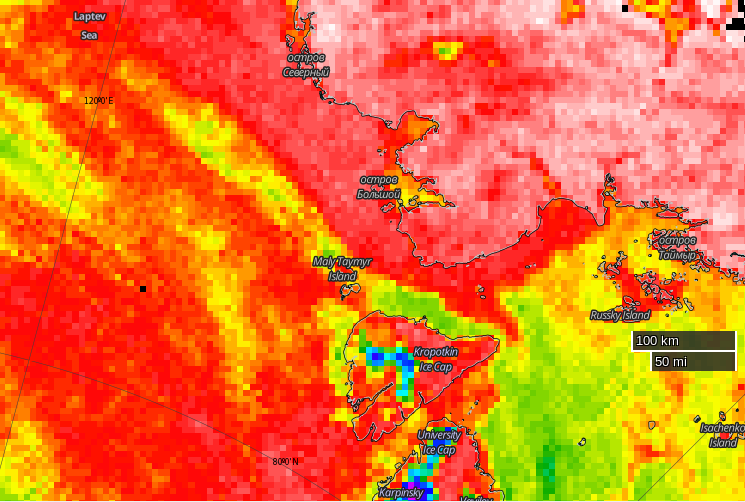
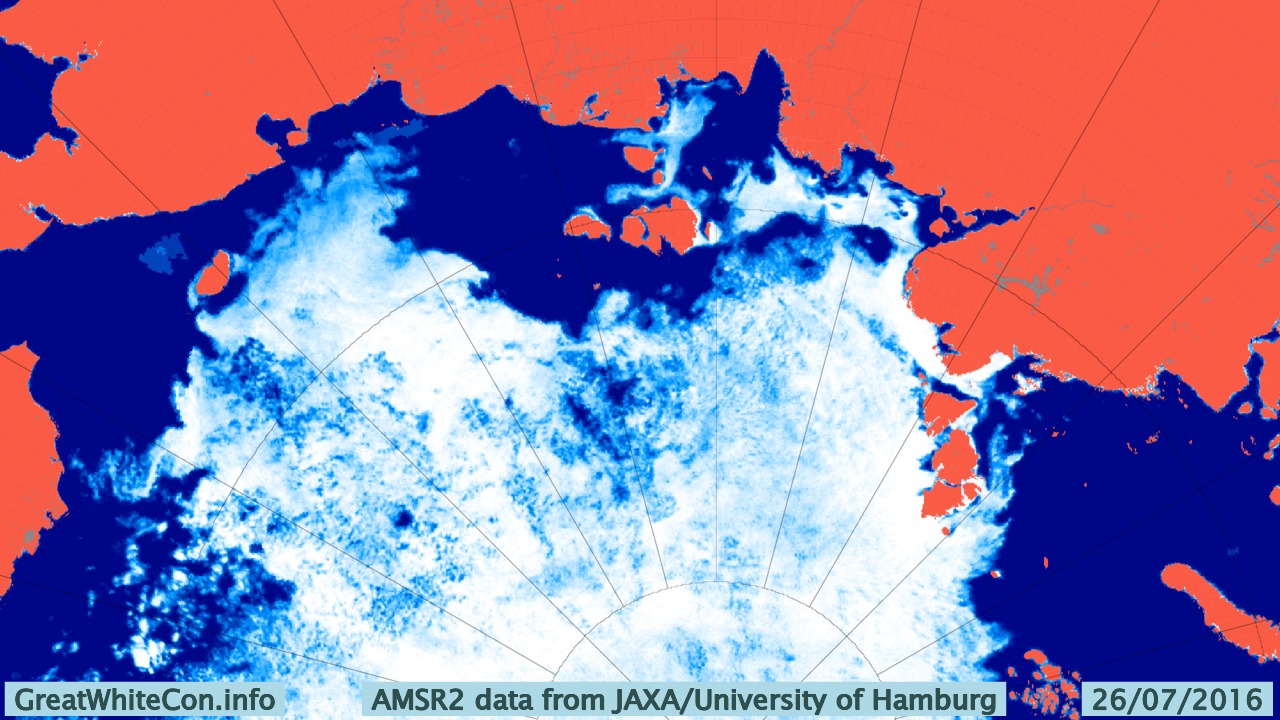
There’s still no way through by which Northabout might avoid an encounter with 9-10 tenths sea ice coverage. Then of course there’s the Laptev Sea to contend with too. Here’s the latest AMSR2 visualisation from the University of Hamburg:
It’s not exactly plain sailing there either just yet!
[Edit – July 28th 2016]
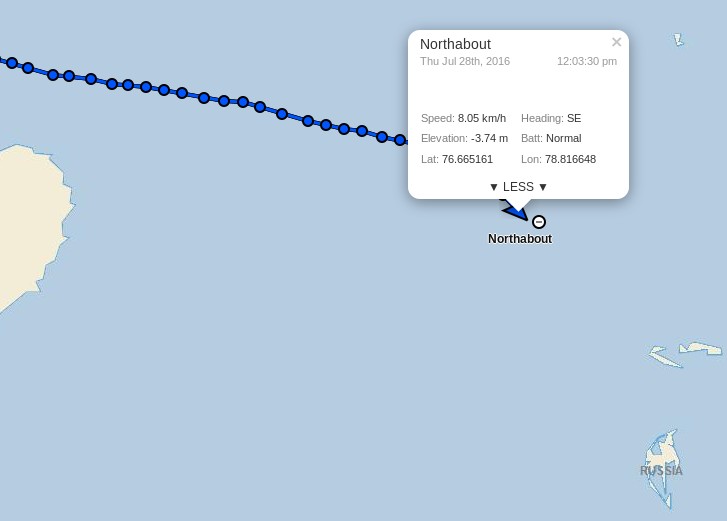
This morning Northabout has almost reached 79 degrees East, and appears to be heading in the direction of Ostrov Troynoy:
The clouds over the Laptev Sea have cleared somewhat as the recent cyclone heads for the Beaufort Sea, to reveal that the “brick wall” of ice referred to in certain quarters now looks more like Swiss cheese:
NASA Worldview “false-color” image of the Laptev on July 28th 2016, derived from the MODIS sensor on the Terra satellite
Here’s a close up look at the Vilkitsky Strait from the Landsat 8 satellite this morning. Note that unlike the MODIS image above, north is at the top of this one:
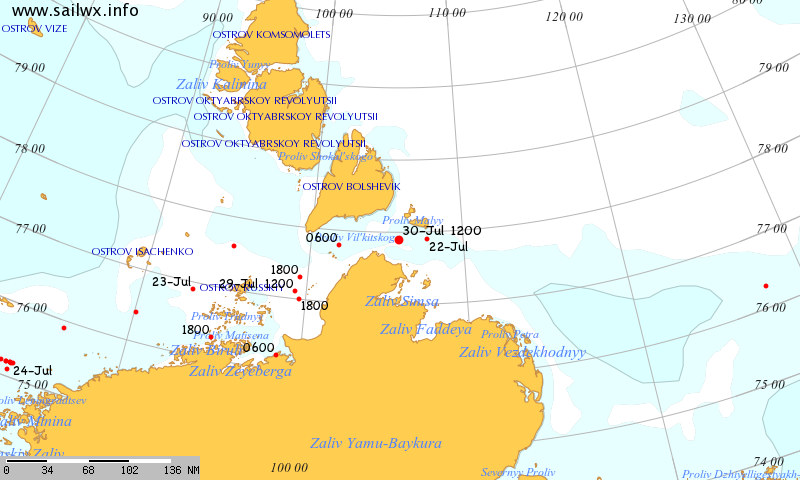
Meanwhile according to SailWX the Russian icebreaker Yamal is traversing the Vilkitsky Strait from east to west:
This website uses cookies to improve your experience. We'll assume you're ok with this, but you can opt-out if you wish. Cookie settingsACCEPT
Privacy & Cookies Policy
Privacy Overview
This website uses cookies to improve your experience while you navigate through the website. Out of these, the cookies that are categorized as necessary are stored on your browser as they are essential for the working of basic functionalities of the website. We also use third-party cookies that help us analyze and understand how you use this website. These cookies will be stored in your browser only with your consent. You also have the option to opt-out of these cookies. But opting out of some of these cookies may affect your browsing experience.
Necessary cookies are absolutely essential for the website to function properly. This category only includes cookies that ensures basic functionalities and security features of the website. These cookies do not store any personal information.
Any cookies that may not be particularly necessary for the website to function and is used specifically to collect user personal data via analytics, ads, other embedded contents are termed as non-necessary cookies. It is mandatory to procure user consent prior to running these cookies on your website.