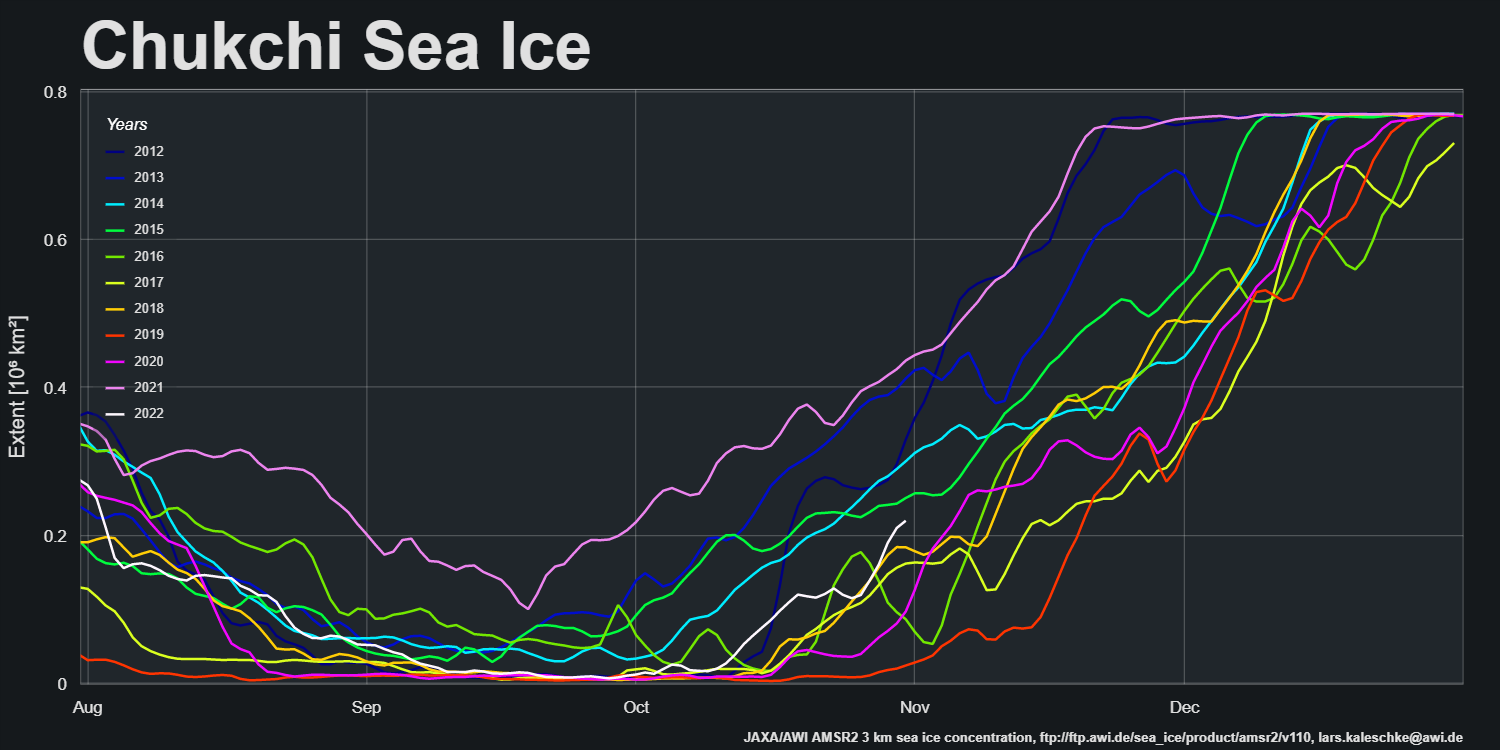
A change is allegedly as good as a rest, so here’s an alternative view of high resolution AMSR2 area and extent created using the experimental tools provided by the AWI’s Lars Kaleschke at: https://sites.google.com/view/sea-ice/
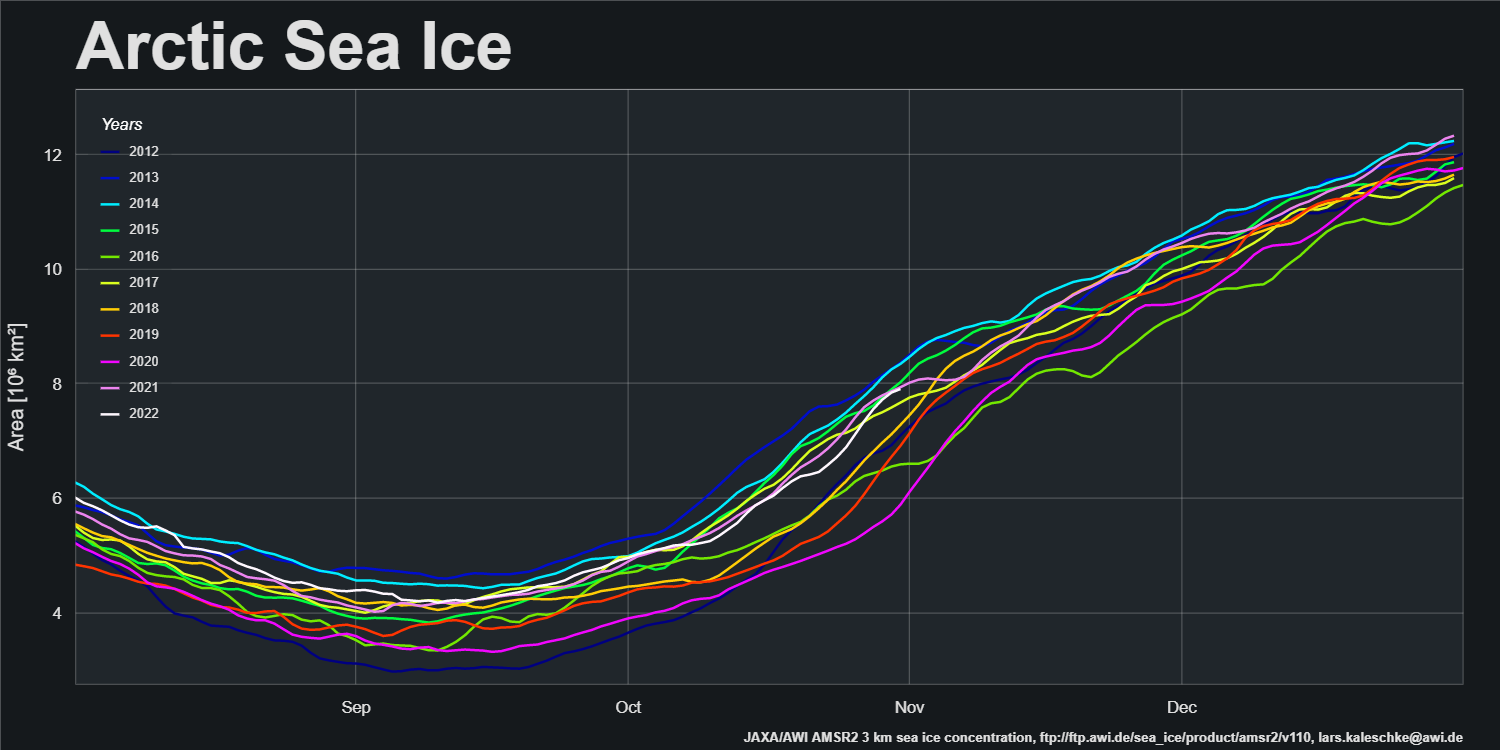
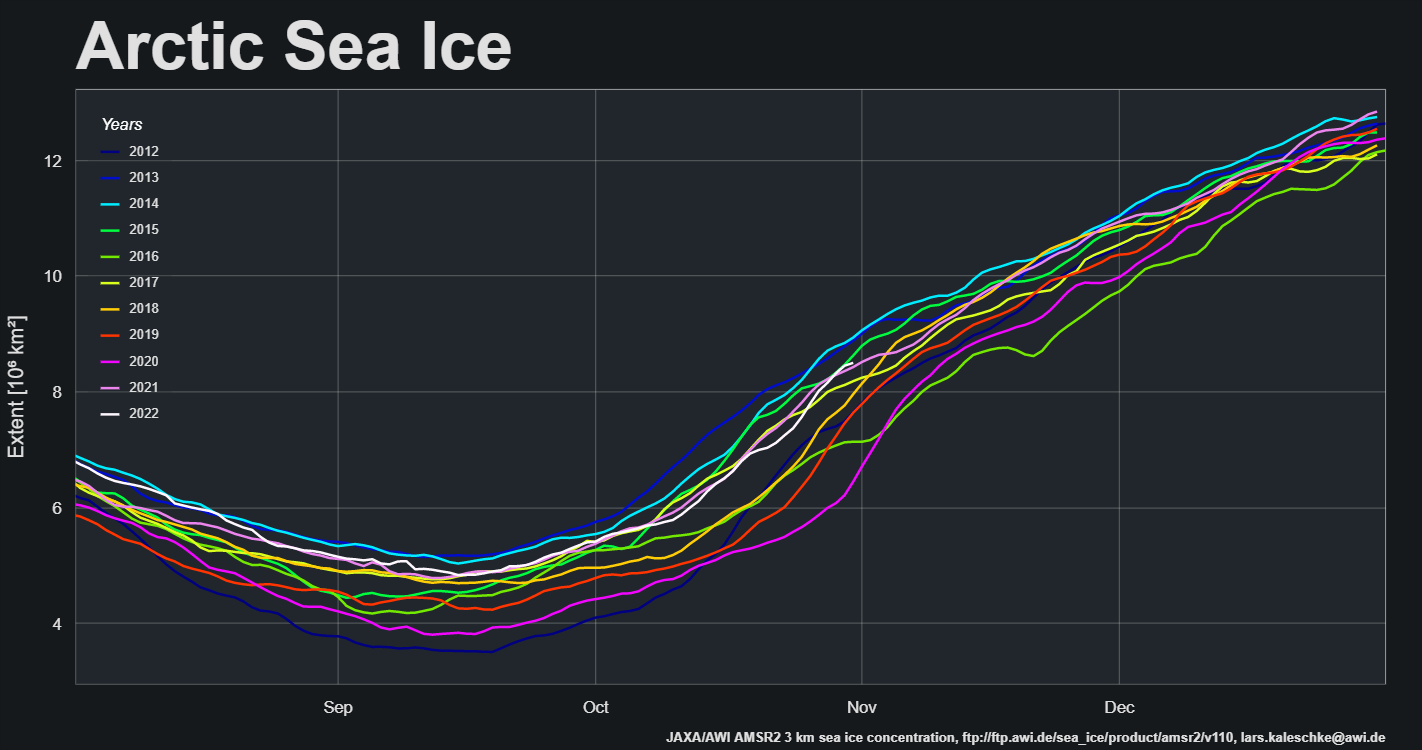
After a brief pause mid-month the refreeze has accelerated again. Both metrics are in the upper half of the decadal range, with extent this year just above 2021 and area just below last year.
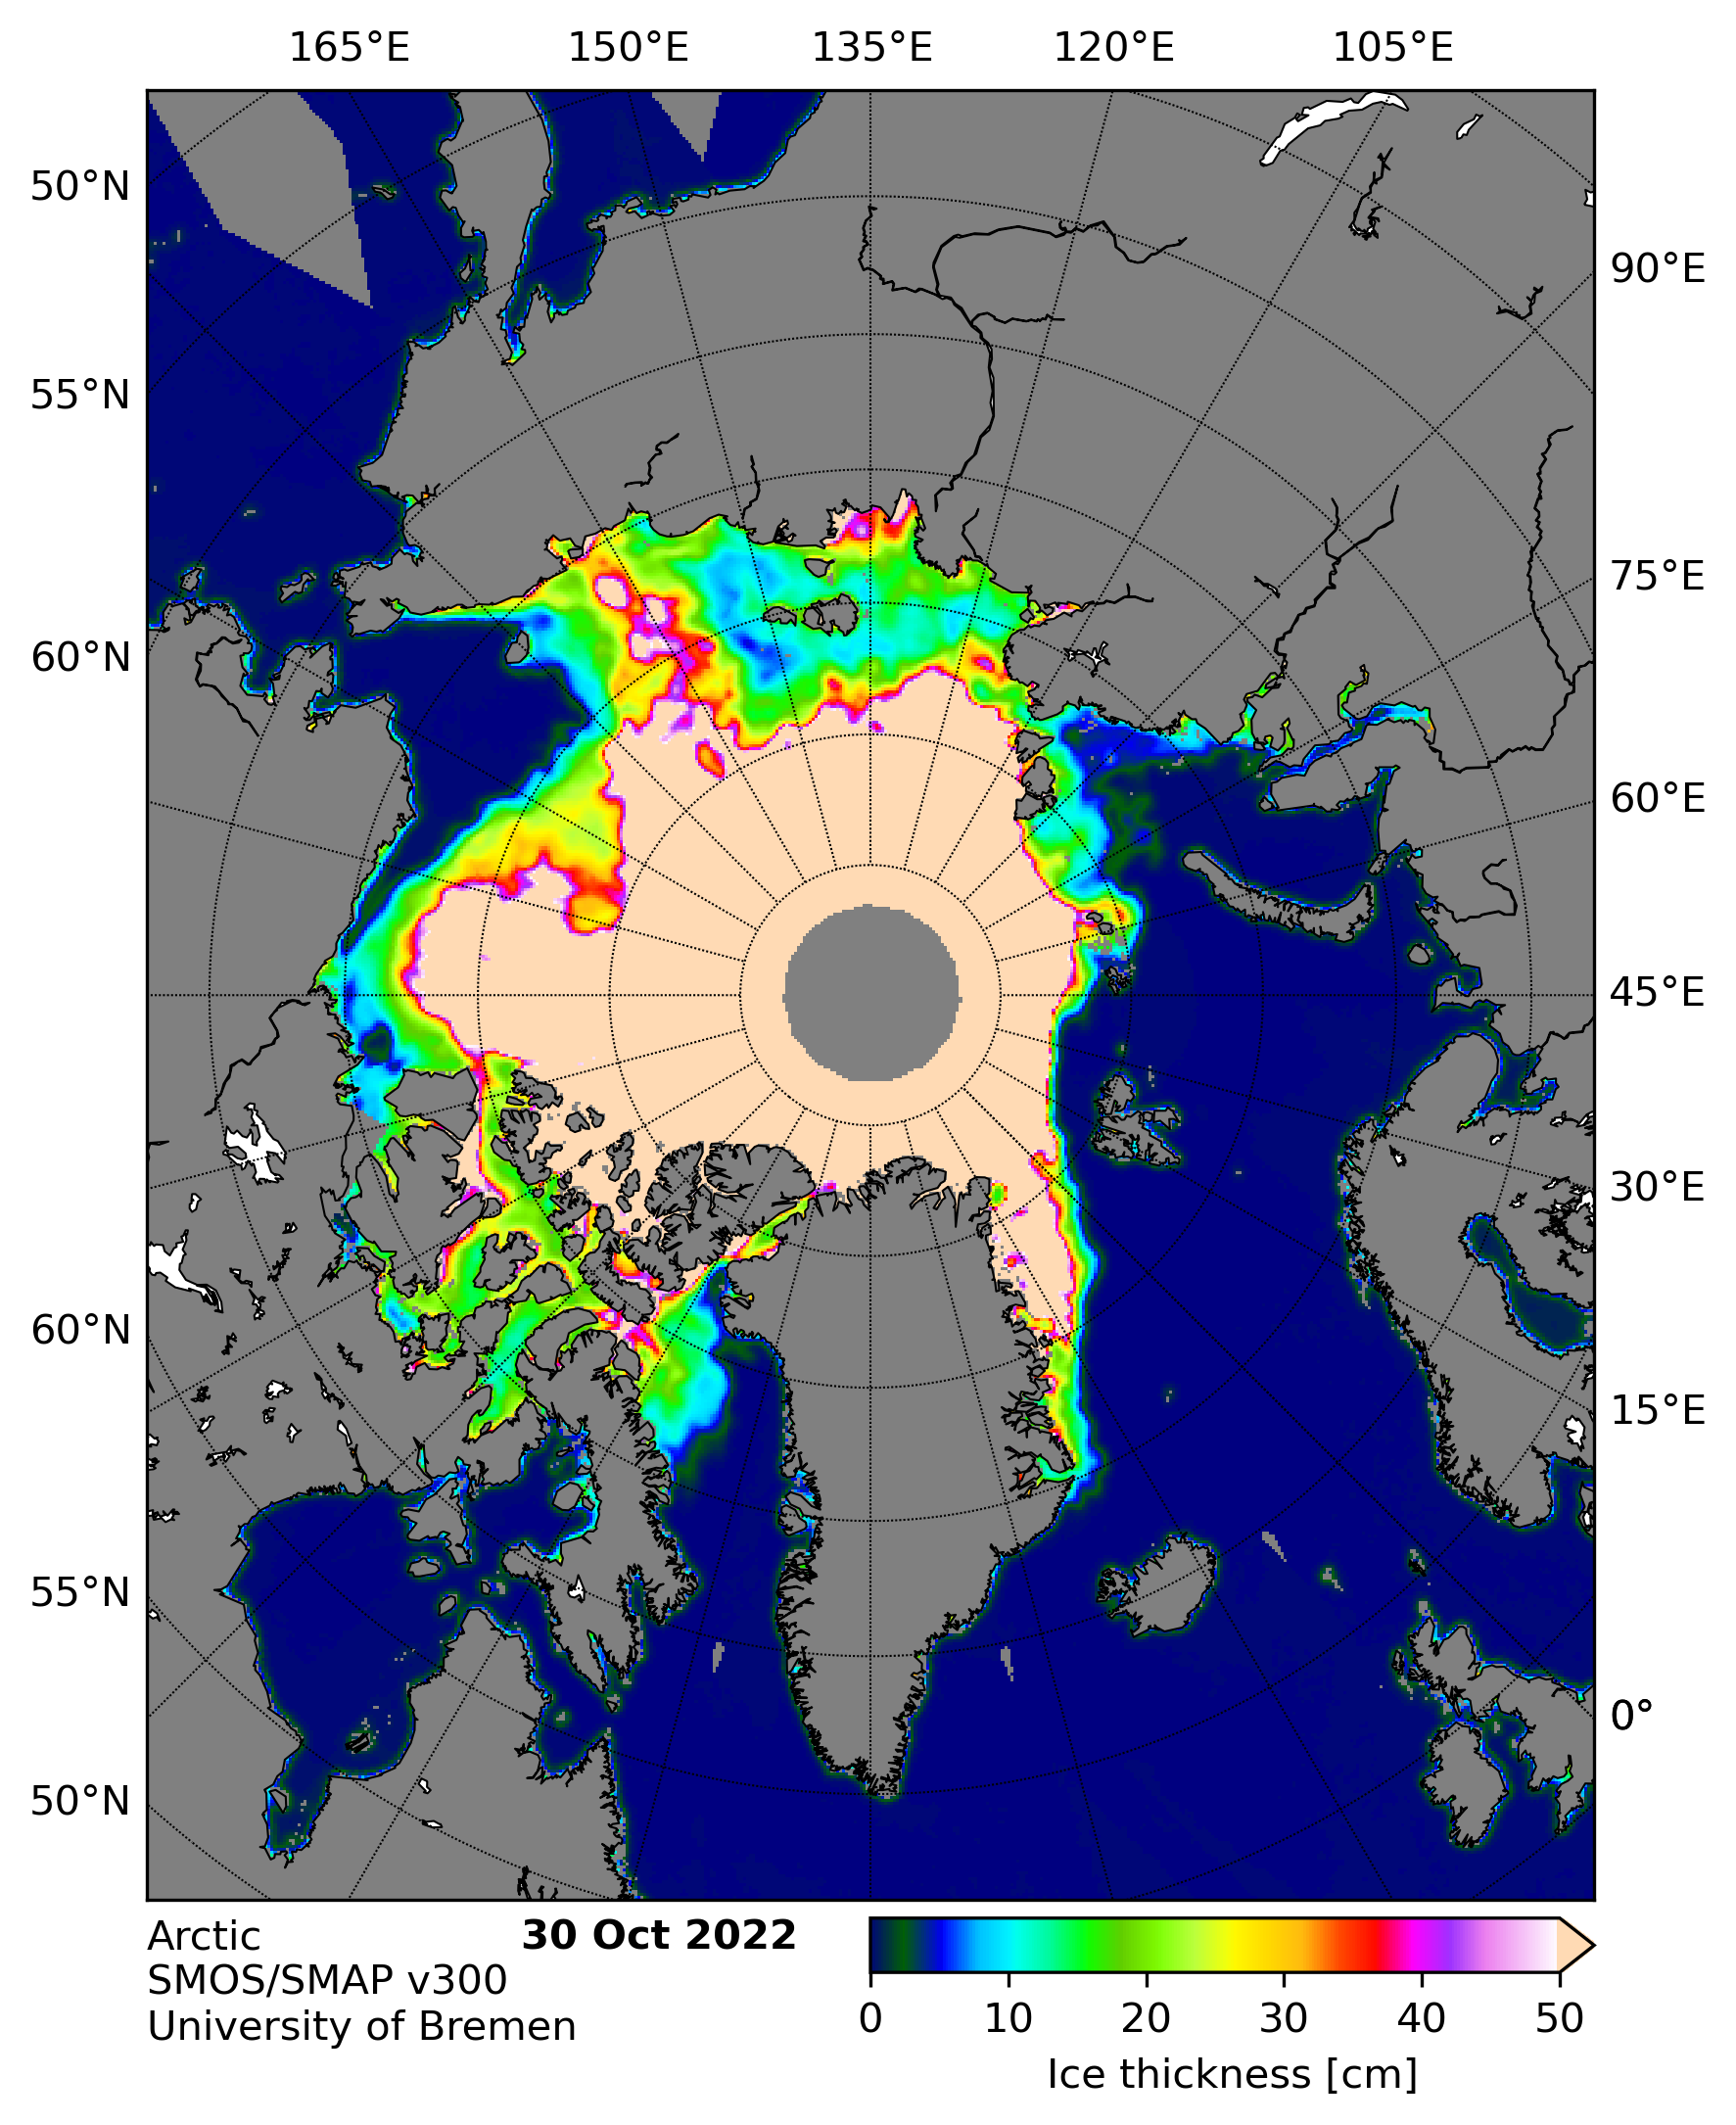
Next let’s take a look at sea ice concentration at the end of October:
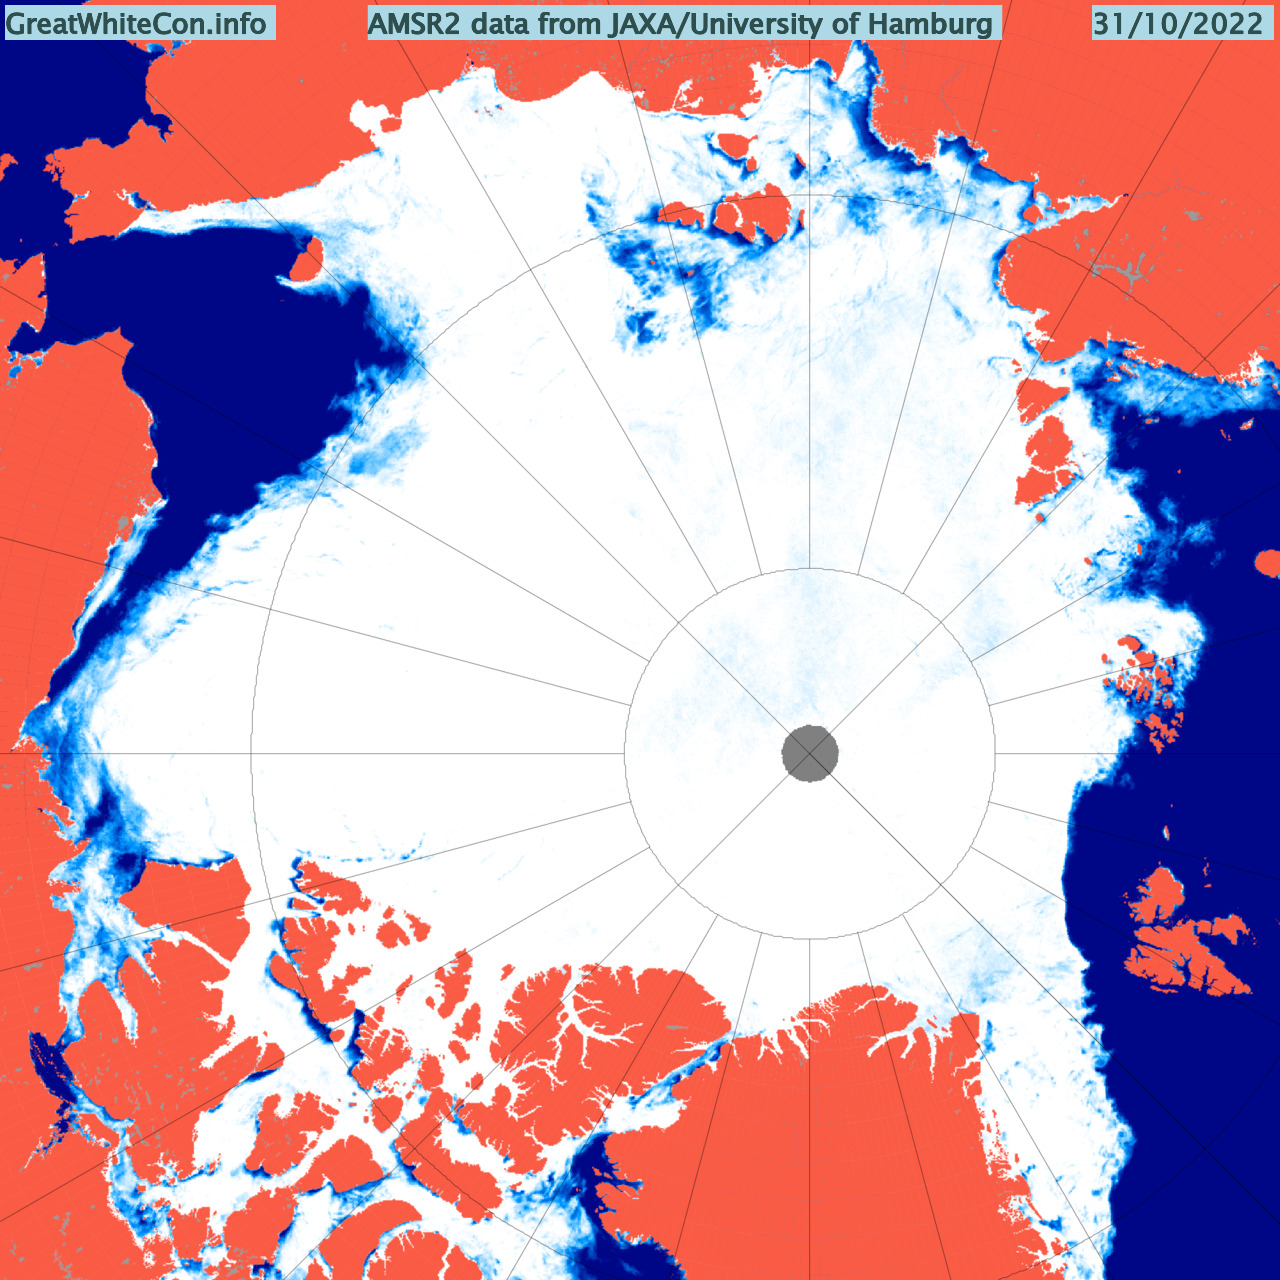
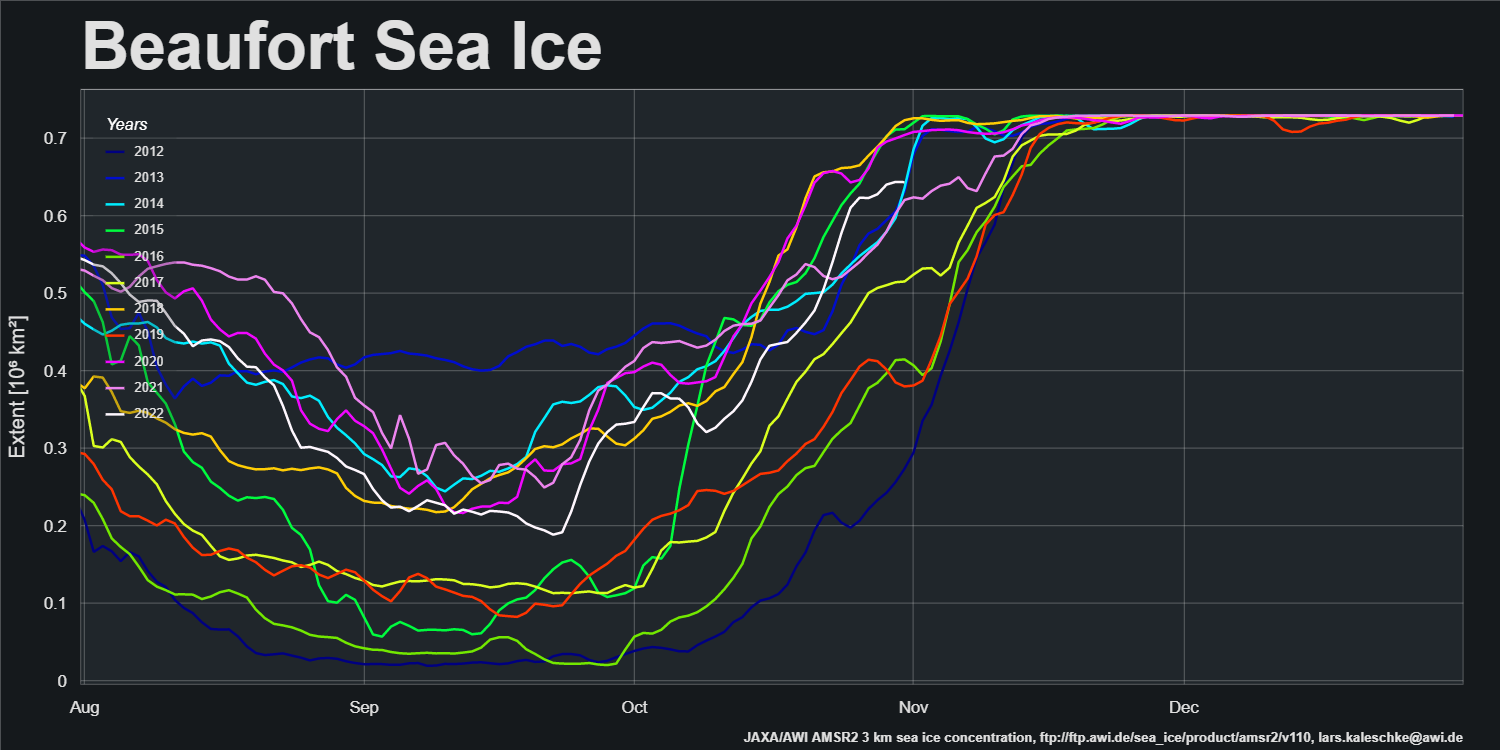
The Laptev and East Siberian Seas are now largely frozen over, but there is still some open water in the Beaufort Sea, and particularly in the Chukchi Sea:
The SMOS thin ice thickness map seems to be stuck on October 25th at the moment, so here’s the latest combined SMOS/SMAP map instead:
The National Snow and Ice Data Center has published another edition of Arctic Sea Ice News. Especially for Peter here is their latest extent trend graph, in this case for the October monthly average:
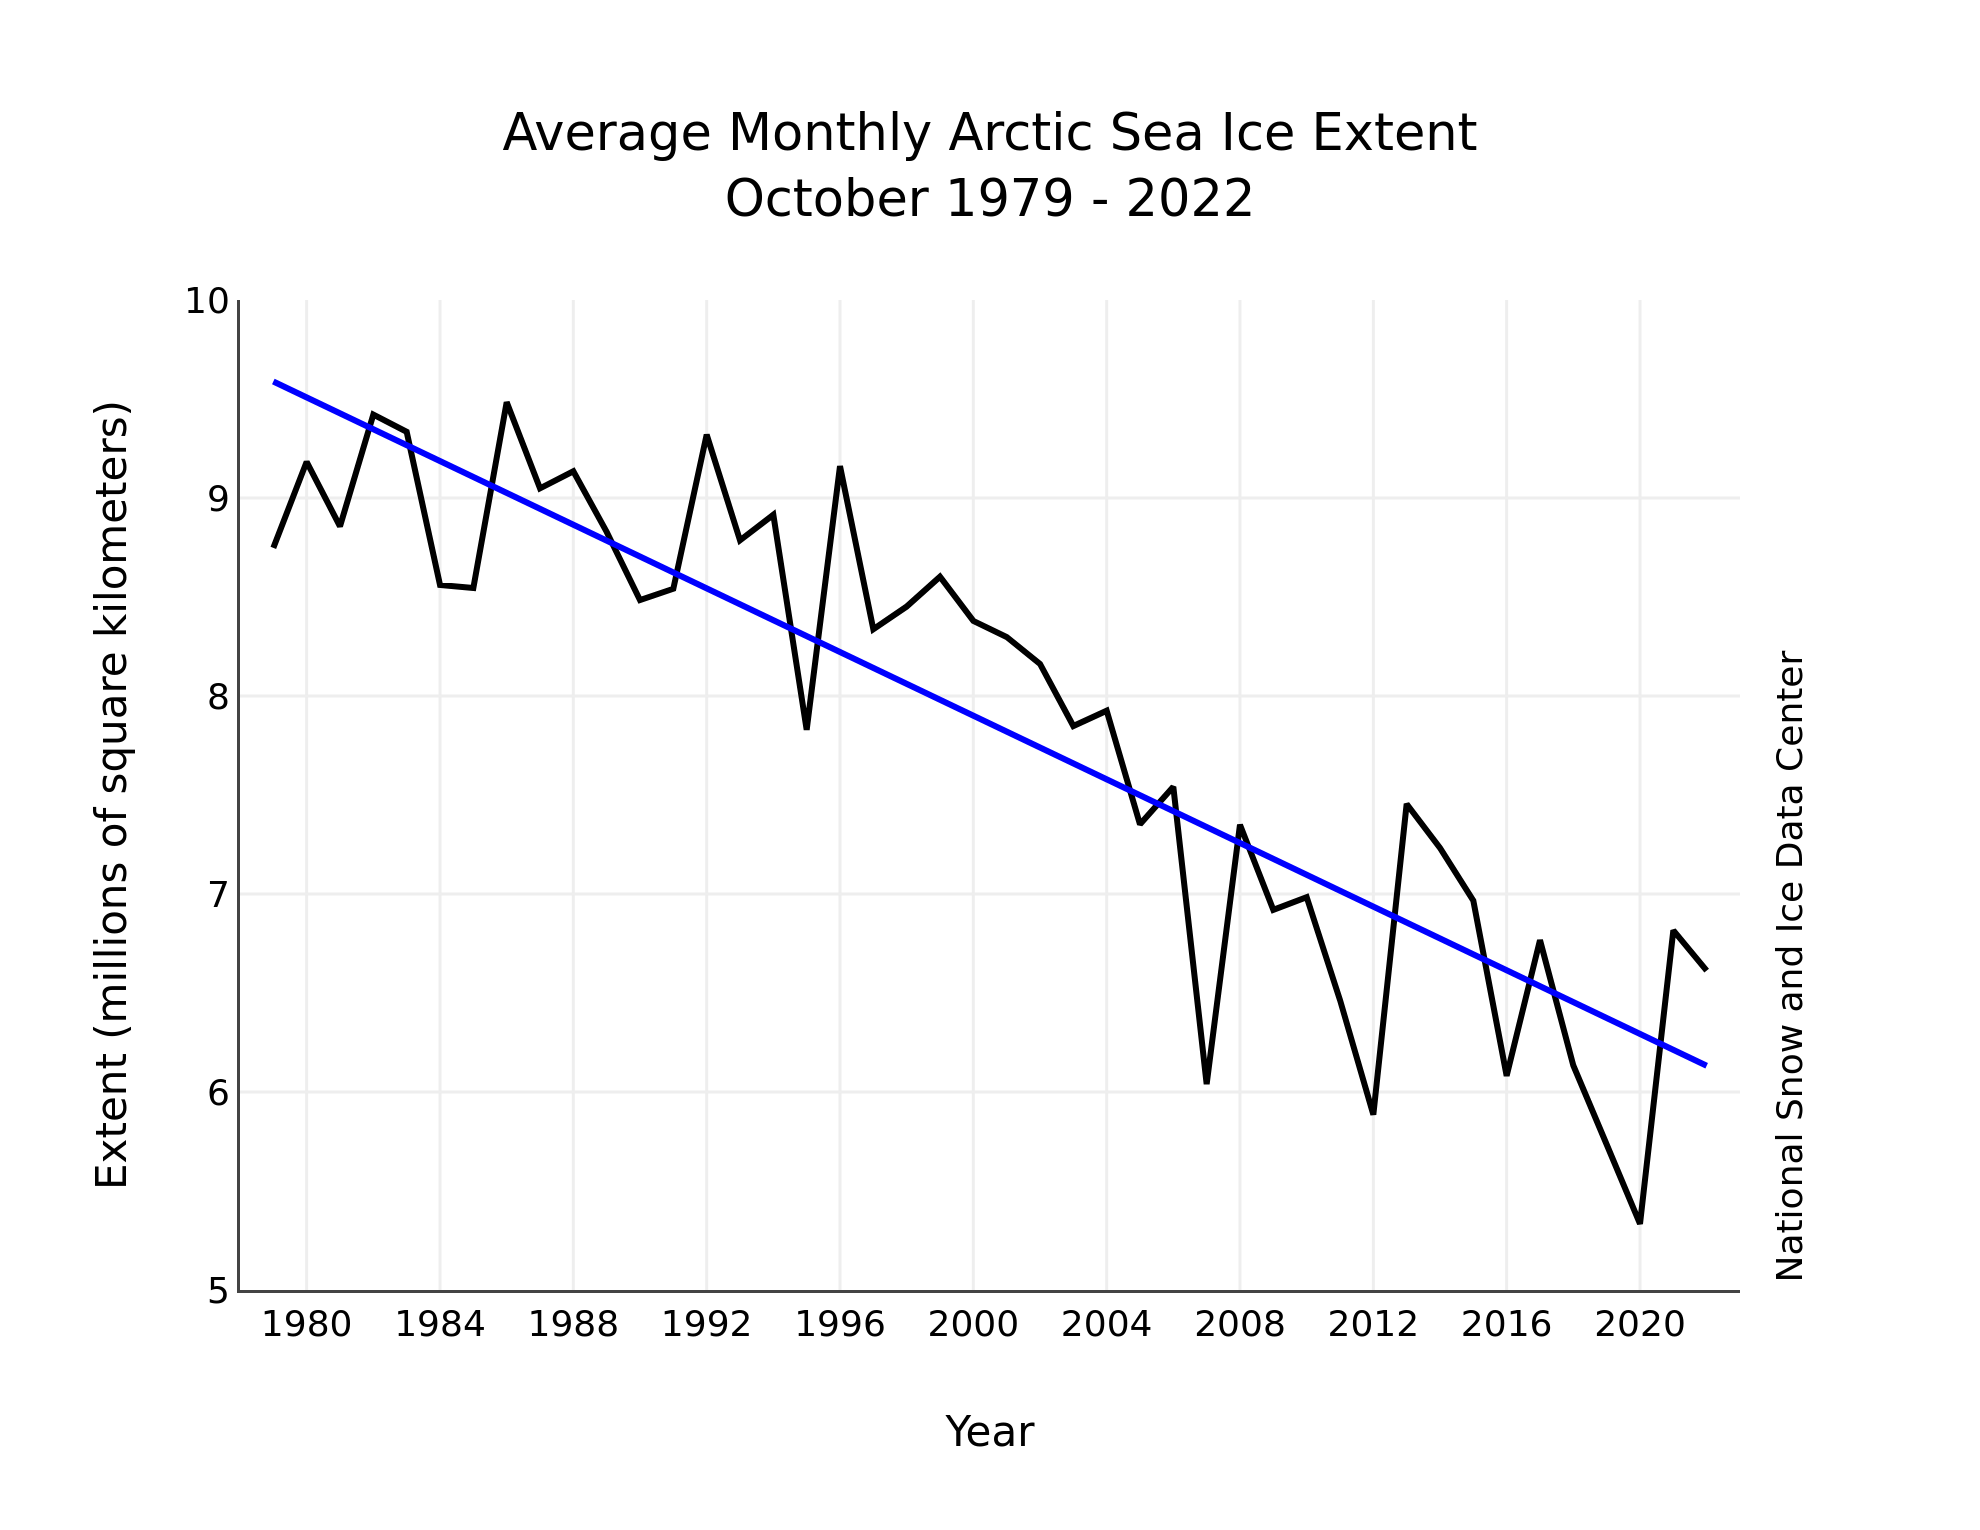
Ice extent increased at a below average rate at the beginning of the month, and open water persisted for some time in the Laptev Sea, whereas the East Siberian Sea was among the first regions to freeze up. In the last ten days of the month, ice extent rapidly increased as the Laptev Sea iced over. The delayed freeze up in the Laptev Sea could be partly a result of ocean heating from the extended period of open water this past spring and summer. However, slow freeze up in this region in recent years is also consistent with observations of eddies within the Arctic Circumpolar Boundary Current that maintain a generally upward ocean heat flux, bringing warm Atlantic water along the eastern Arctic continental slope. The Arctic Circumpolar Boundary Current is a shallow, 200- to 400-meter-deep eastward-flowing current that follows the edge of the continental shelf and carries warm water at 2 to 3 degrees Celsius in shallow depths around the Arctic Ocean. The configuration of the continental shelf in the Russian Arctic brings this water very near the coastal Laptev Sea.
Moving on to weather conditions during October the NSIDC point out that:
Air temperatures during October at the 925 millibar level (approximately 2,500 feet above the surface) were near to above average over most of the Arctic Ocean (Figure 2a). The largest departures from average for this time of year were over the Kara Sea, where air temperatures averaged for October remained above freezing.
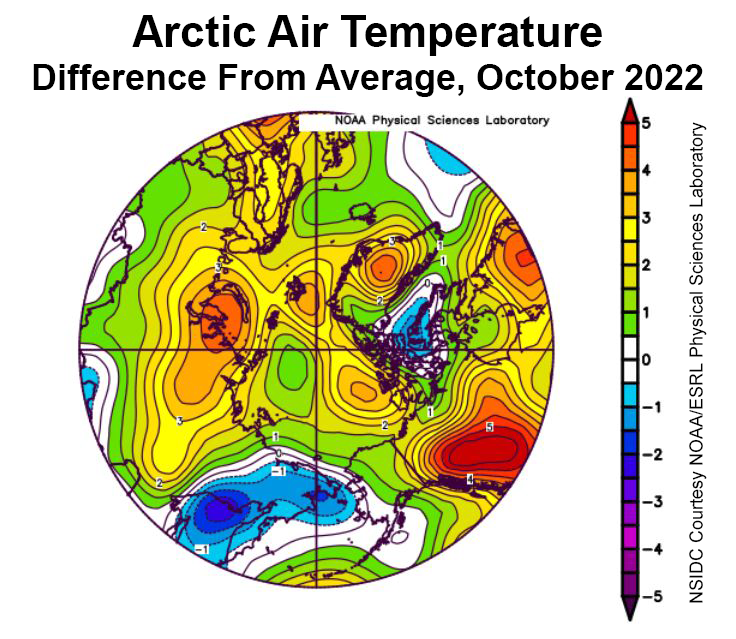
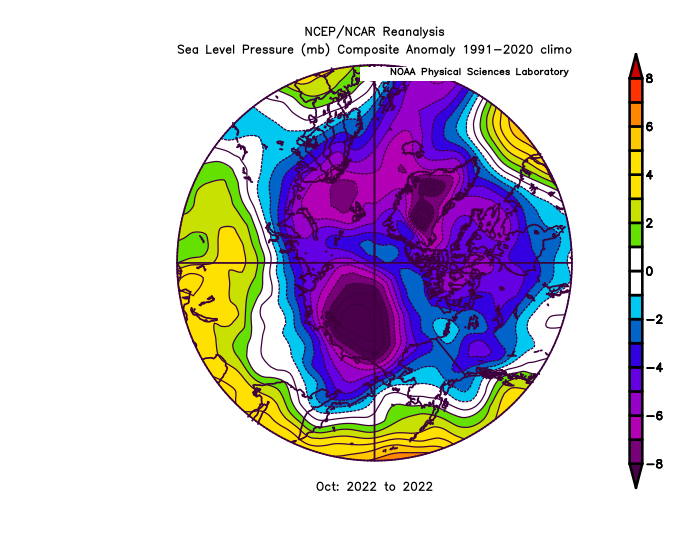
The average atmospheric circulation pattern was dominated by below average sea level pressure over nearly the entire Arctic. Pressures were as much as 10 to 12 millibars below average over the Chukchi and East Siberian Seas and stretching across the pole. This pattern is reflected in the persistence of positive values of the Arctic Oscillation Index for most of the month.
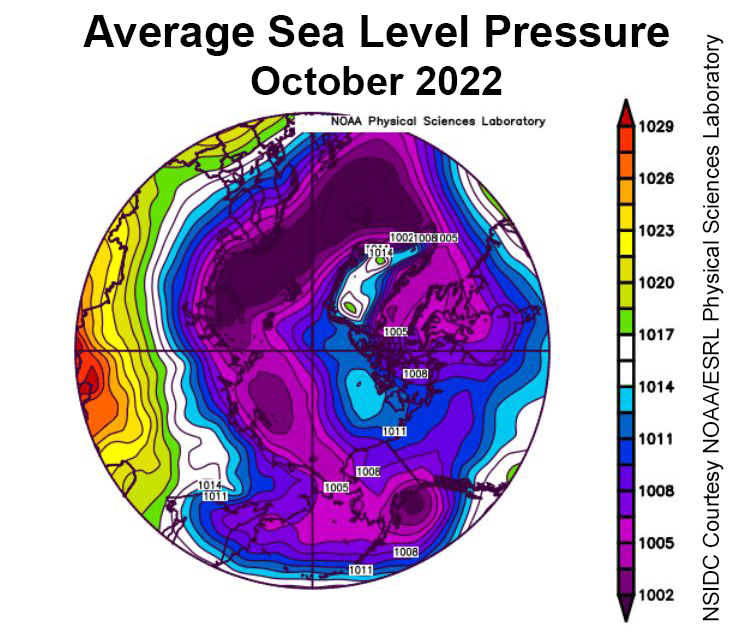
I’m not sure why the NSIDC didn’t provide an MSLP anomaly plot, so here’s one of those for good measure:
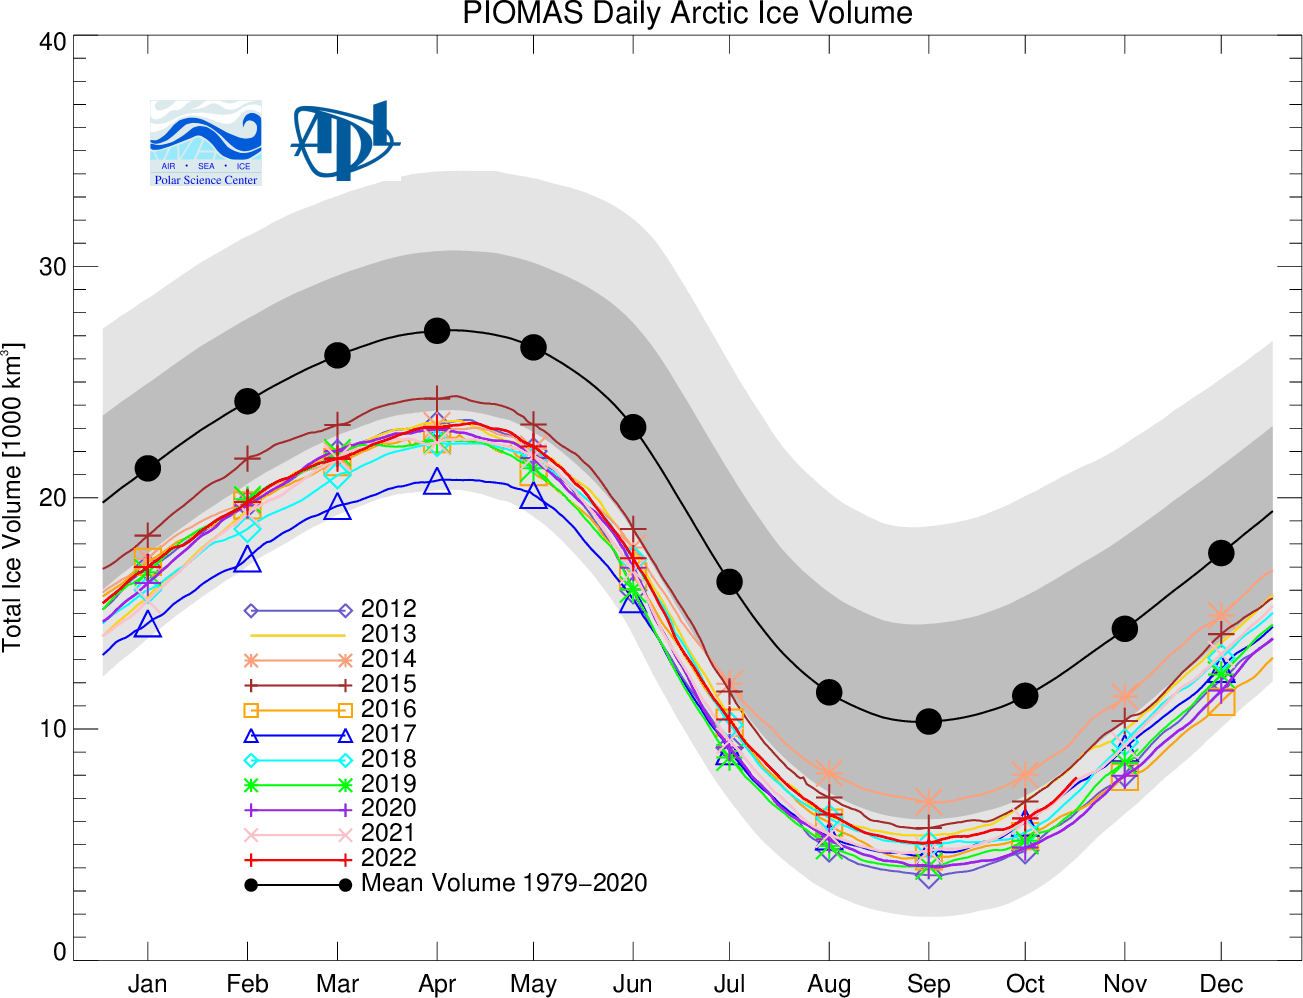
Somewhat belatedly, here is the PIOMAS Arctic sea ice volume graph up to the end of October 2022:
together with the thickness anomaly map:

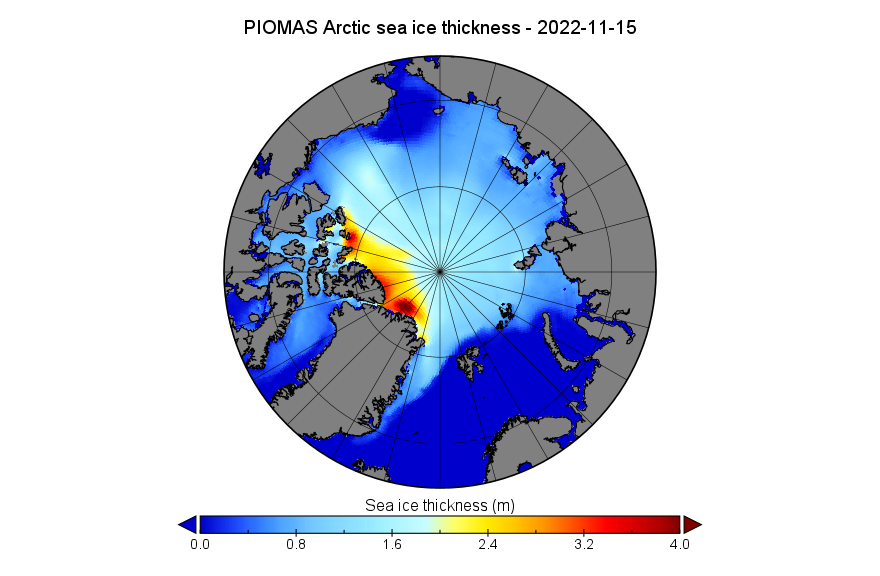
The PIOMAS mid month gridded thickness data has also been released. Here is the map for November 15th:
Further news is now available on the December open thread.
Since August last year the month-end sea ice extent has only been below the 2010’s average ONCE at the end of March!
ALL other months the month-end sea ice extent has been ABOVE the 2010’s average.
Jan.31.—-16th.lowest. +333,064 sq.km. above 2010’s average.
Feb.28.—-11th.lowest +116,764 sq.km. above 2010’s average
Mar.31.—-10th.lowest -127,470 sq.km. below 2010’s average
Apr. 30.—-14th.lowest +16,886 sq.km. above 2010’s average
May. 31.—15th lowest +395,097 sq.km. above 2010’s average
Jun. 30.—-10th.lowest +35,744 sq.km above 2010’s average
Jul. 31.—–12th lowest +228,905 sq.km. above 2010’s average
Aug.31.—-11th.lowest +203,902 sq.km. above 2010’s average
Sep.30.—–7th lowest +115,918 sq.km. above 2010’s average
Oct.31.—– 11th lowest, +269,119 sq.km. above 2010’s average
Let’s see if the trend continues into 2023
After low extent from late 2015 to mid 2021, the sea ice has rebounded a little lately, maybe like 2013-14…
The Antarctic has been lower than normal in the meantime.
We await 2023 with interest.
We’ll start to get particularly interested if the extent graph wanders outside the range of the previous 10 years for an extended period of time.
Like it did in 2016 at this time of year. And again in 2019. And again in 2020.
The numbers don’t lie, but why are some being ignored?
Because “science”(read: INTERNET SCIENCE) has always been political. (That’s why wine is so cheap!)
The Chuckchi sea is holding out well,mid month, quite mild on the 17th.
I see ice beginning to form in the North of Hudson Bay!
Thickness???
The thickest ice is more or less to be found within the boundaries of last Septembers minimum (to state the obvious;) )
Question is, could that leave the Pacific side Thinner for next season!
November month end sea ice extent falls BELOW 2010’s average.
Jan.31.—-16th.lowest. +333,064 sq.km. above 2010’s average.
Feb.28.—-11th.lowest +116,764 sq.km. above 2010’s average
Mar.31.—-10th.lowest -127,470 sq.km. BELOW 2010’s average
Apr. 30.—-14th.lowest +16,886 sq.km. above 2010’s average
May. 31.—15th lowest +395,097 sq.km. above 2010’s average
Jun. 30.—-10th.lowest +35,744 sq.km above 2010’s average
Jul. 31.—–12th lowest +228,905 sq.km. above 2010’s average
Aug.31.—-11th.lowest +203,902 sq.km. above 2010’s average
Sep.30.—–7th lowest +115,918 sq.km. above 2010’s average
Oct.31.—– 11th lowest, +269,119 sq.km. above 2010’s average
Nov30.——5th lowest, -183,803 sq.km. BELOW 2010’s average
Will the trend continue into 2023?
You’re quick off the mark Neil! See also the new December open thread.
Will the lies continue?
Temperatures above 80° seem to have shot up, extent gain was slow enough the last month or so. I wonder what piomas will reveal?
Being only a one day spike so I would guess, “Not Much!”
Dr. C.V. Haynes, Jr. excellent work on North American Younger Dryas sapropel (“black mats”) establishes the Rancholabrean Termination as having been caused by a hydrologic event of such catastrophic proportions as to render extinct all so-called “megafaunal” species in a geological instant.
Western education and science are being corrupted. International science is oriented more towards politics than truth and must be corrected.
Hi Vilos,
“Western education and science are being corrupted.”
However you nevertheless seem to be happy to link to some “Western science”?
What relevance do you suppose “black mats” have to Arctic sea ice?