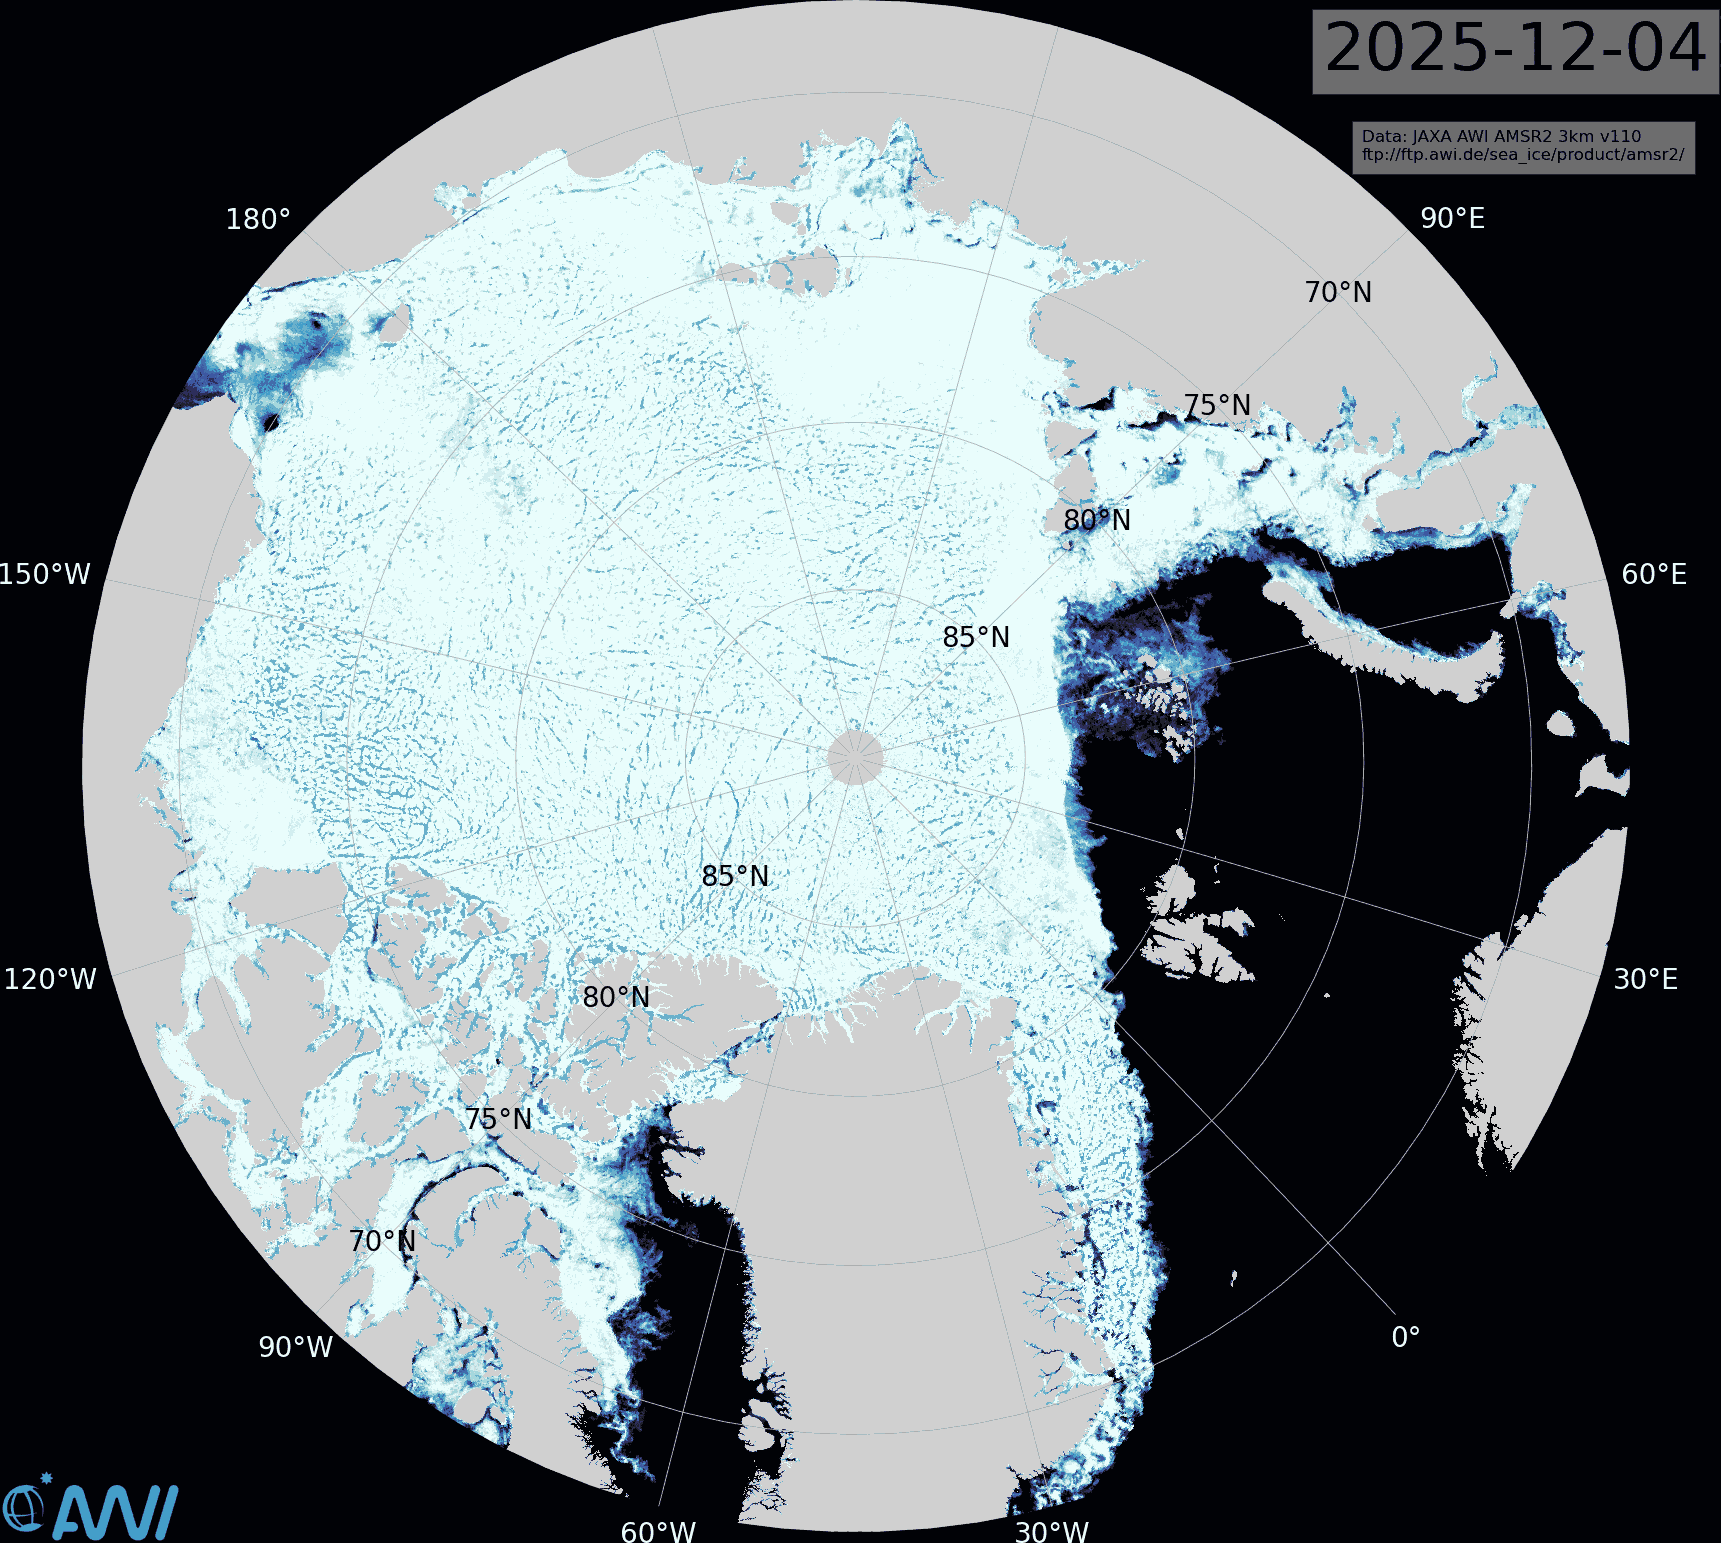
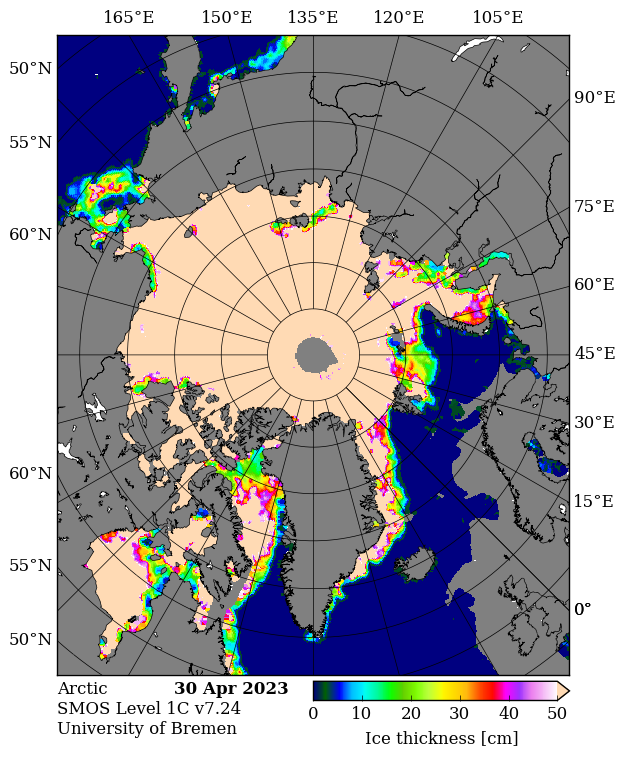
The latest Alfred Wegener Institute sea ice concentration map shows that the Pacific side of the Central Arctic Basin is now almost completely refrozen:
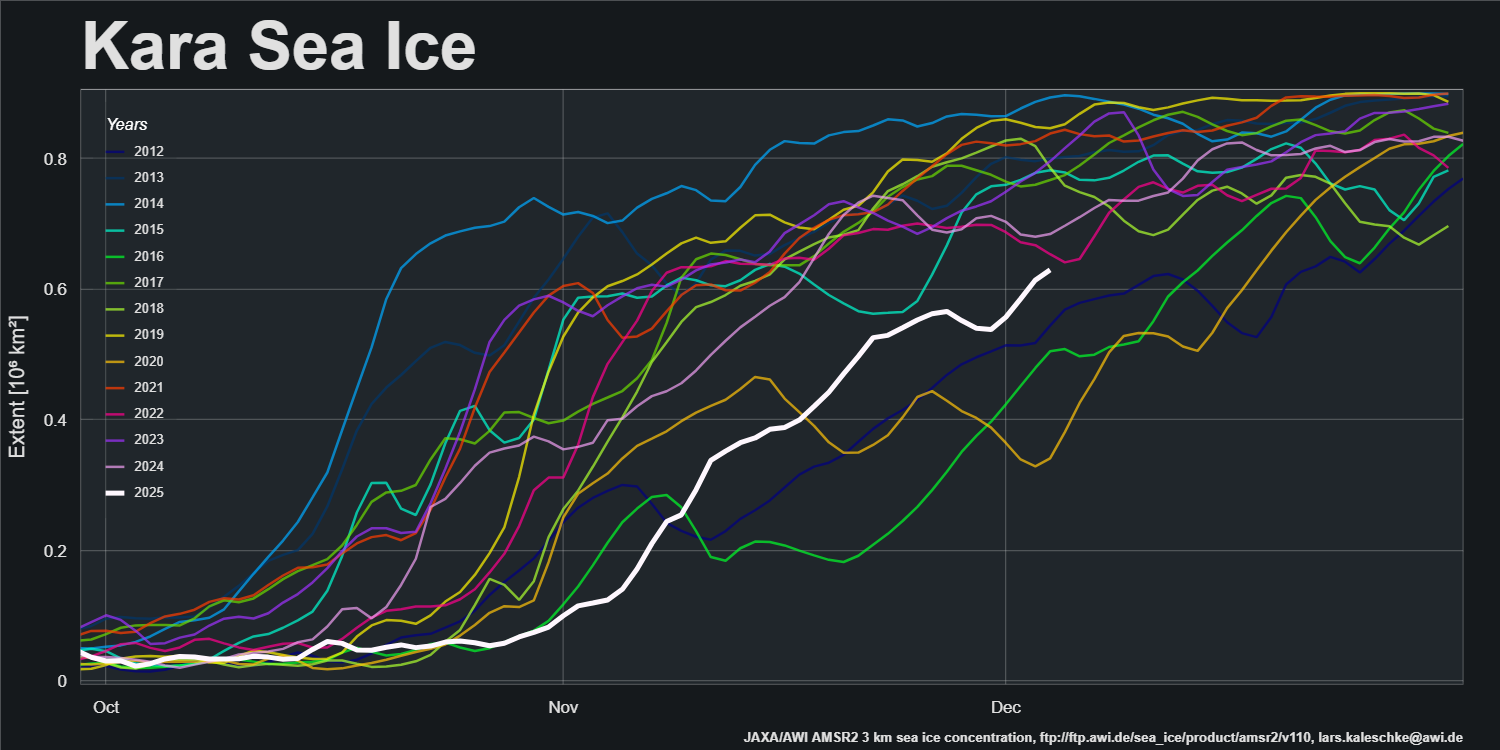
On the Atlantic side of the Arctic the Kara Sea is rapidly refreezing:
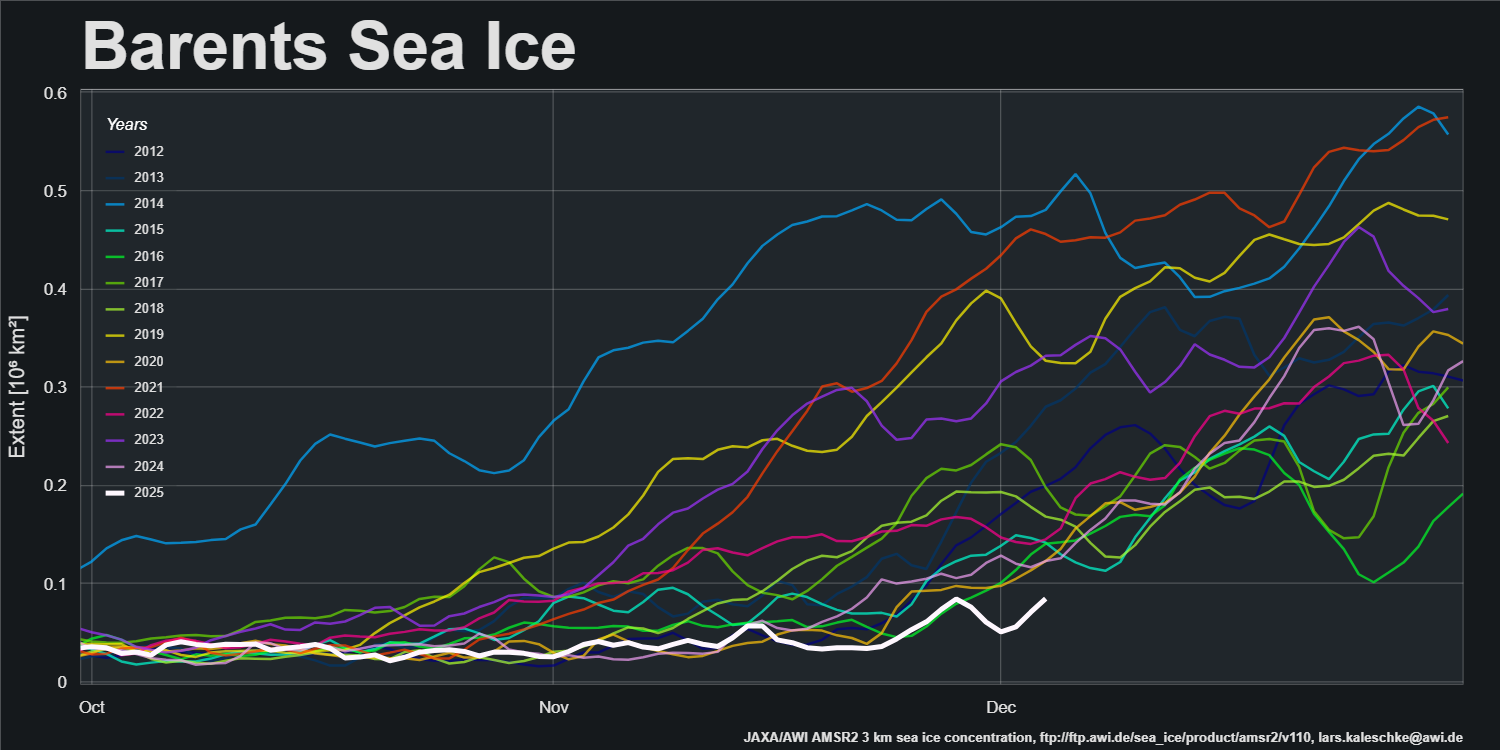
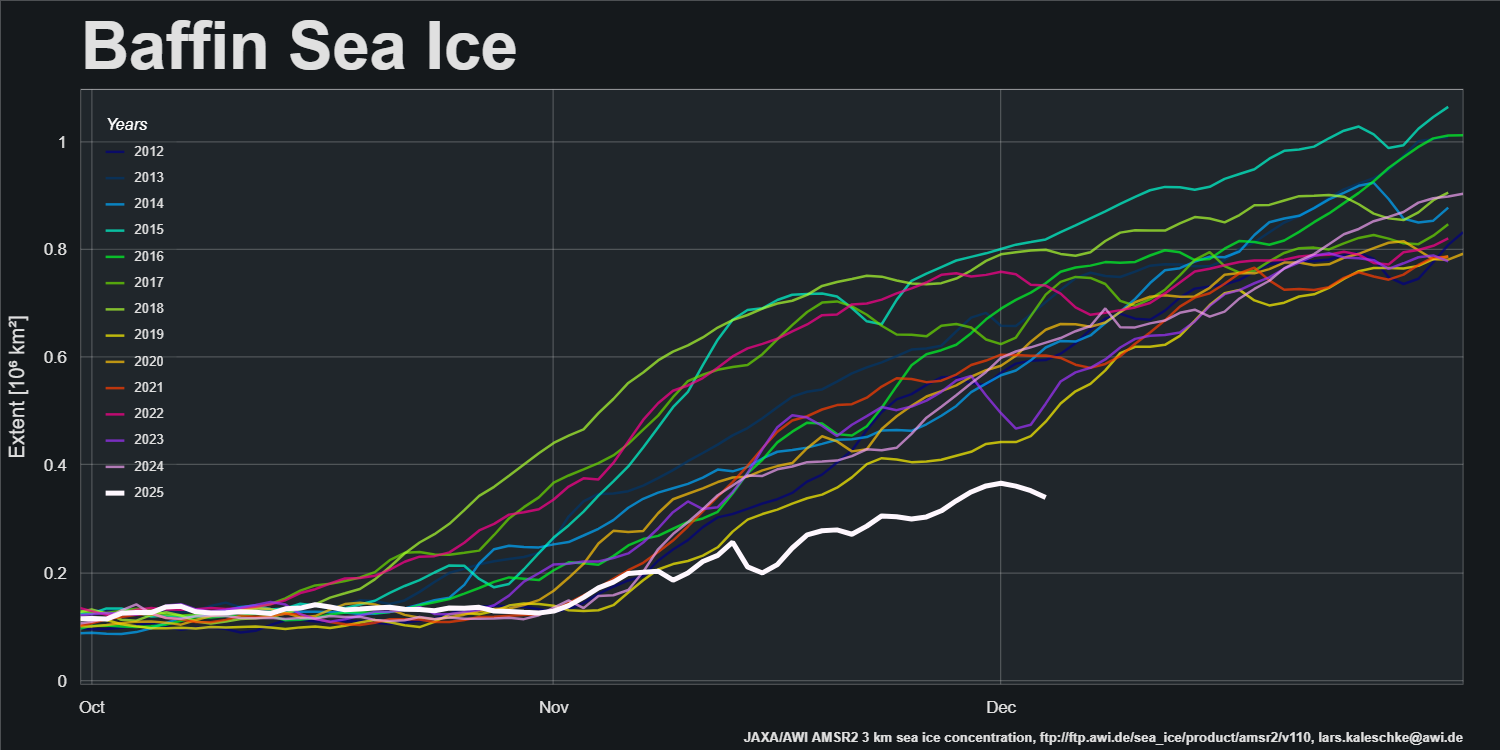
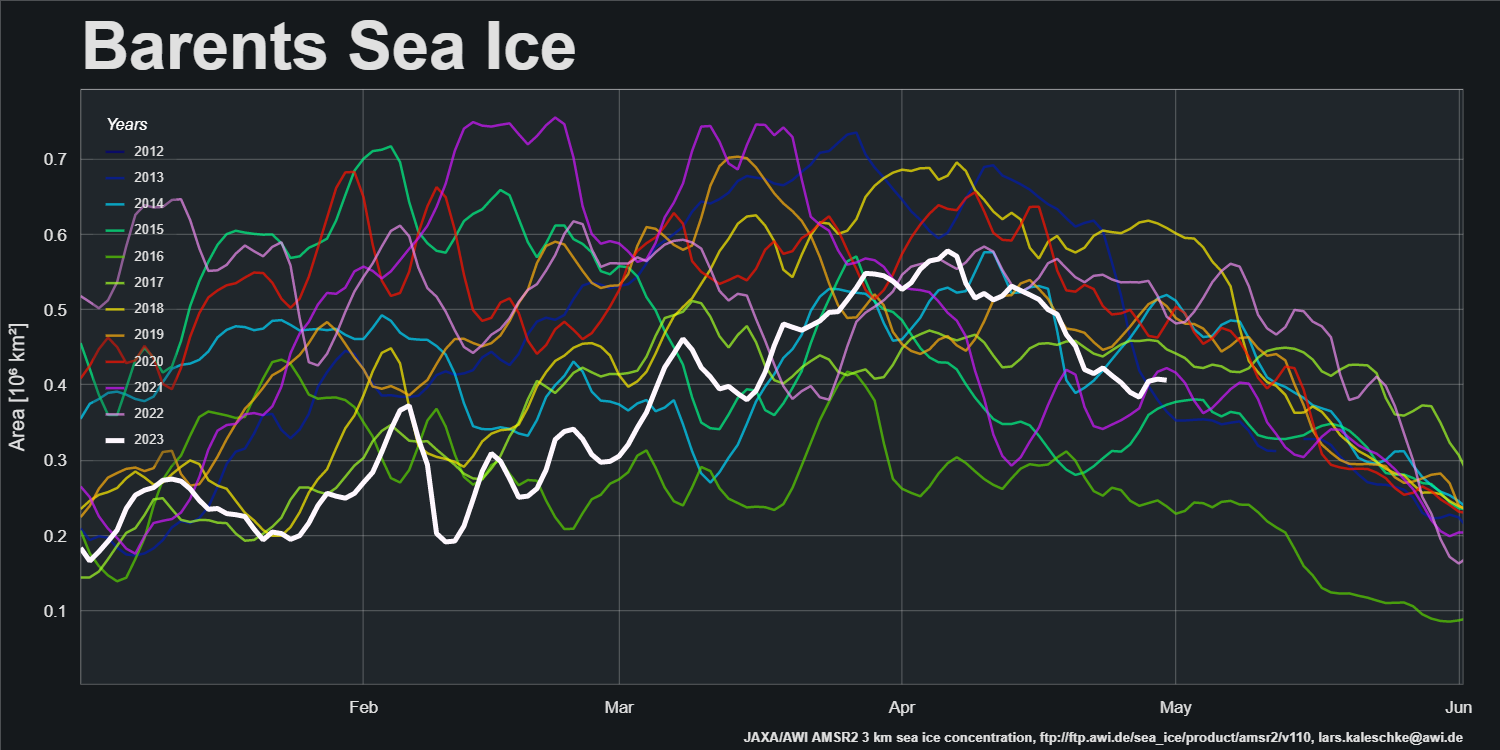
However, sea ice extent in the Barents Sea and Baffin Bay is currently lowest for the date in the AMSR2 record:
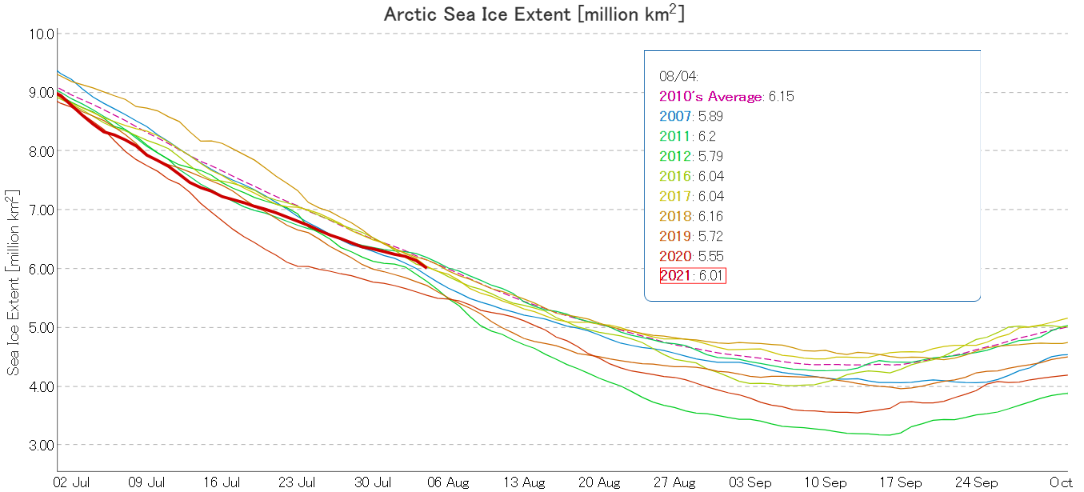
Pan Arctic JAXA/ViSHOP extent is currently lowest for the date in the satellite era:
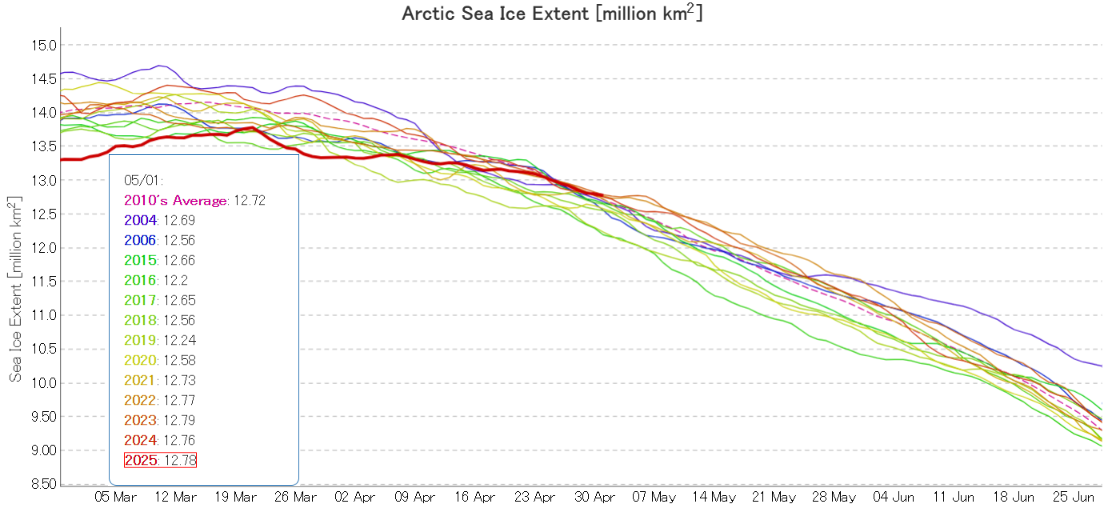
JAXA/ViSHOP extent is no longer “lowest for the date”! After “flatlining” for most of April the metric is now in the midst of a close knit group of the other years in the 2020s:
The high pressure area over the Central Arctic persisted through the second half of April, and so did the consequent drift of ice from the Pacific side of the Arctic to the Atlantic periphery:
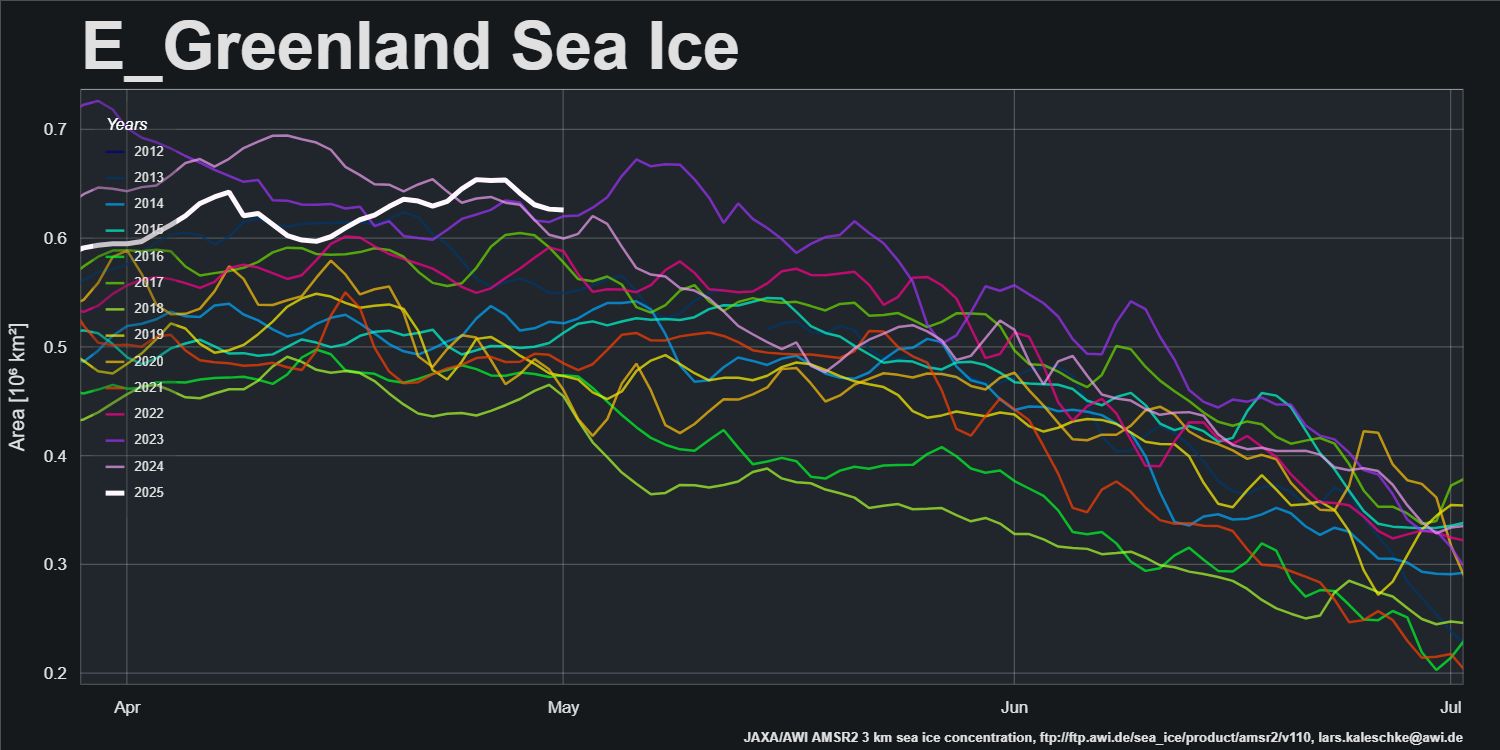
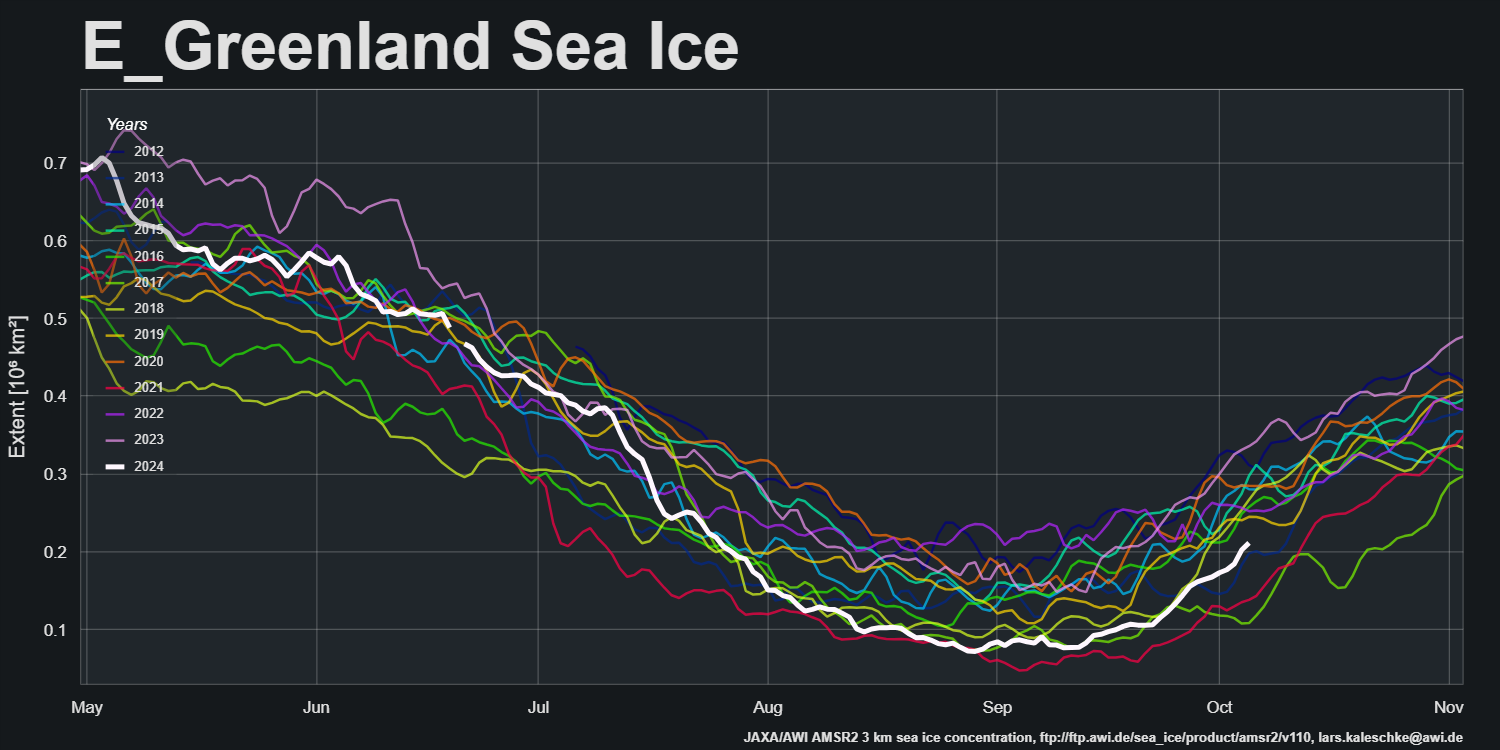
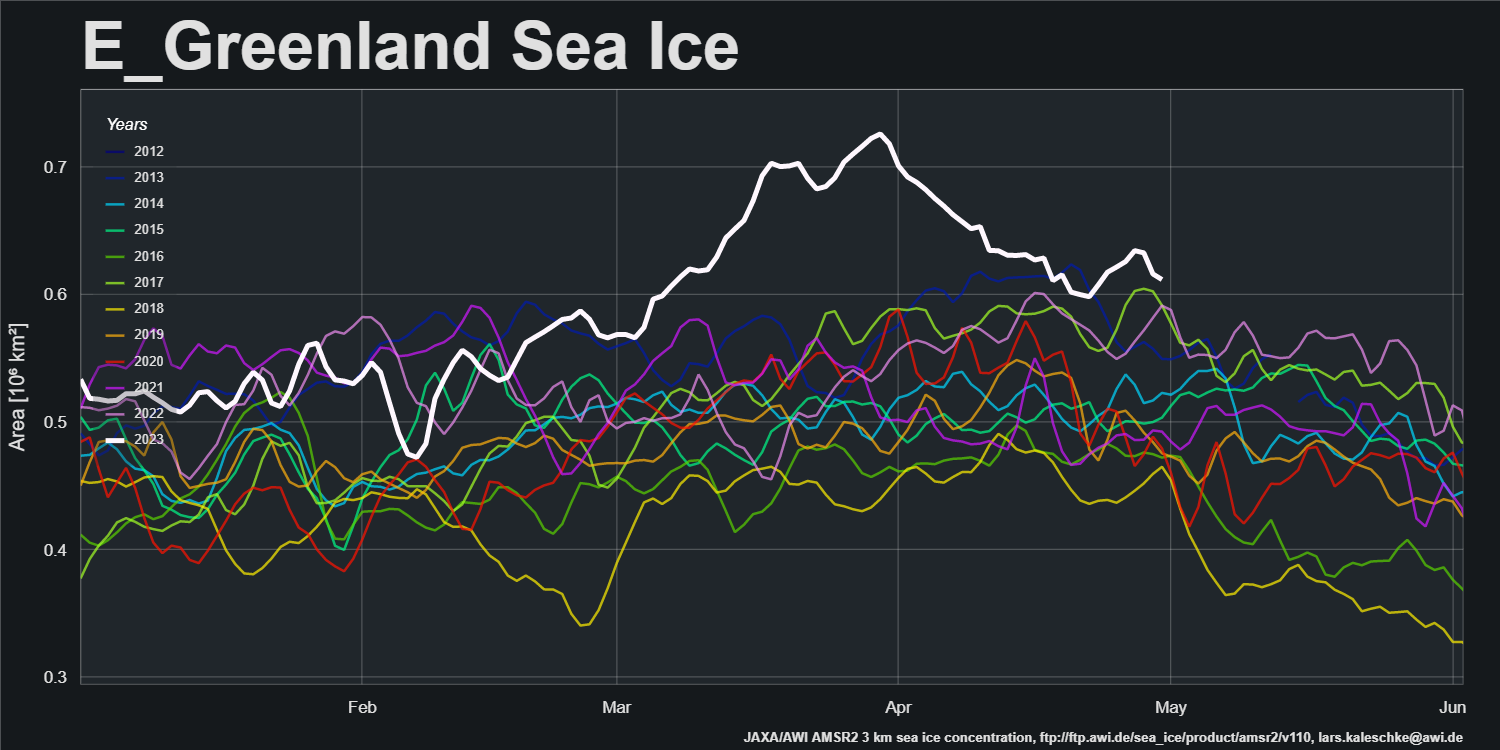
AWI’s sea ice area for the Greenland Sea is currently “highest for the date” in the AMSR2 record that started in July 2012:
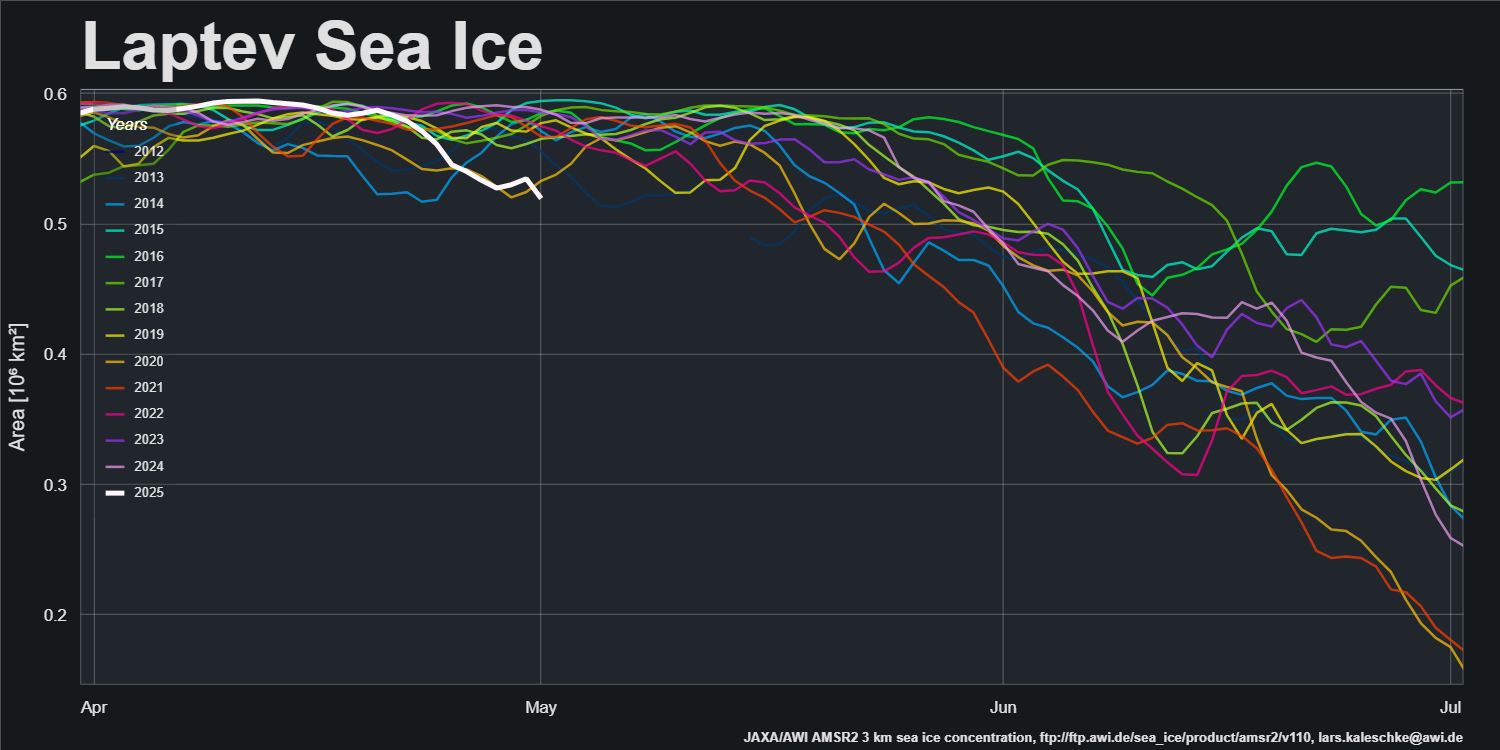
The offshore winds along the Laptev Sea coast have continued, and sea ice area is now “lowest for the date”:
The first signs of a break in the high pressure dominance are appearing. GFS currently forecasts that a low pressure area will enter the Central Arctic, bring above zero temperatures over the Kara Sea on Sunday:
The JAXA extent graph is currently not updating, so let’s begin this month with the latest AMSR2 sea ice concentration map from the Alfred Wegener Institute. Click the image to see a ~10 Mb animation of the last four weeks:
Note in particular the restart of export into the East Greenland Sea via the Fram Strait:
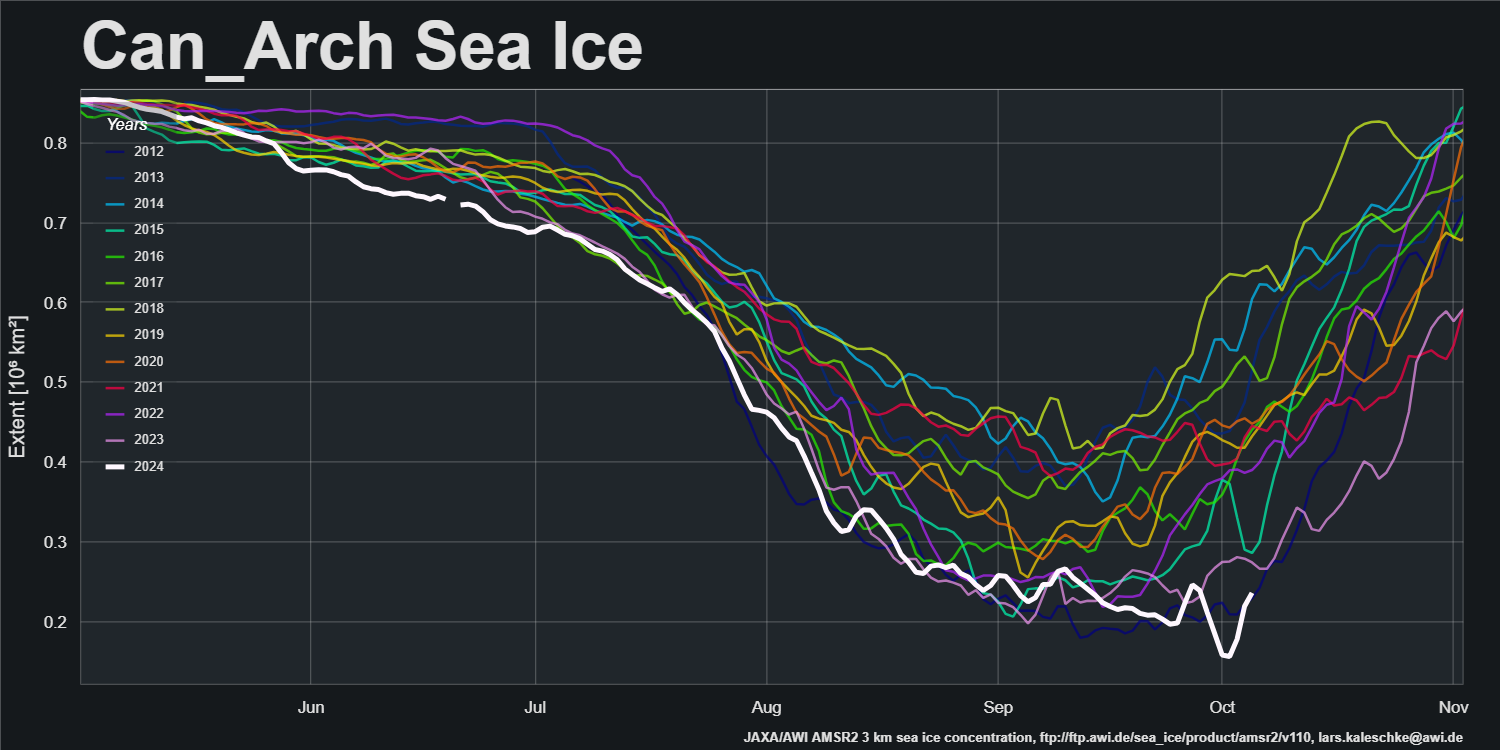
and the movement of ice within the Canadian Arctic Archipelago:
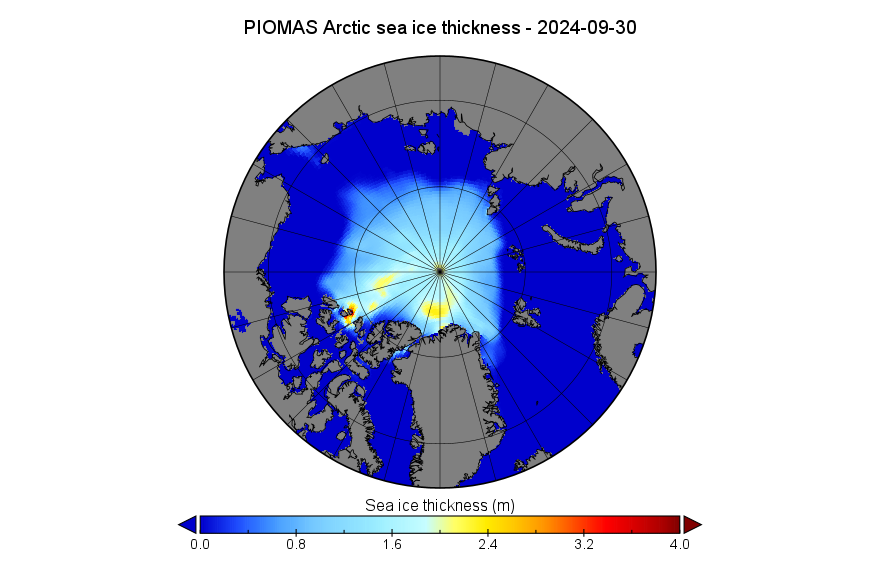
The PIOMAS gridded thickness data for September 2024 has been released:
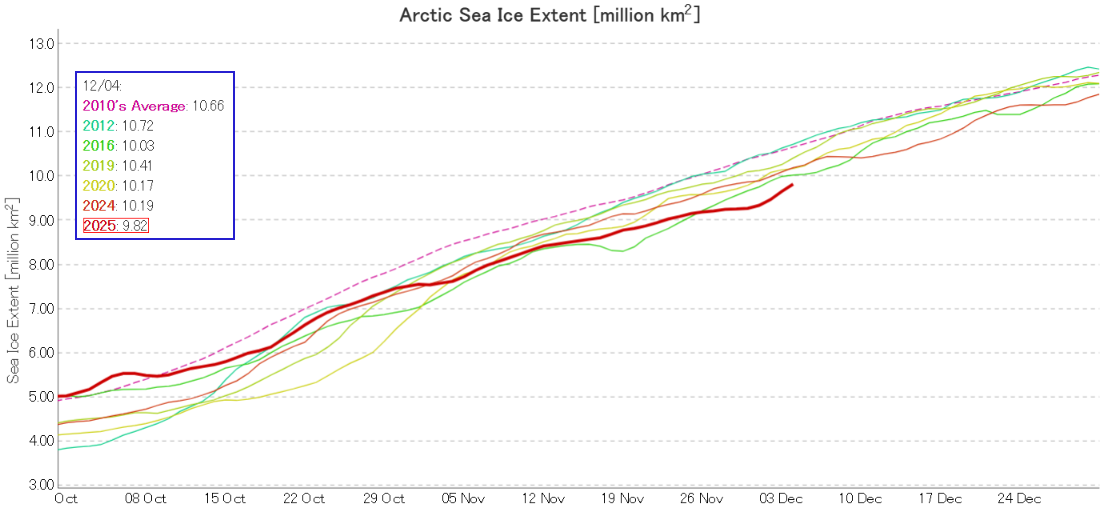
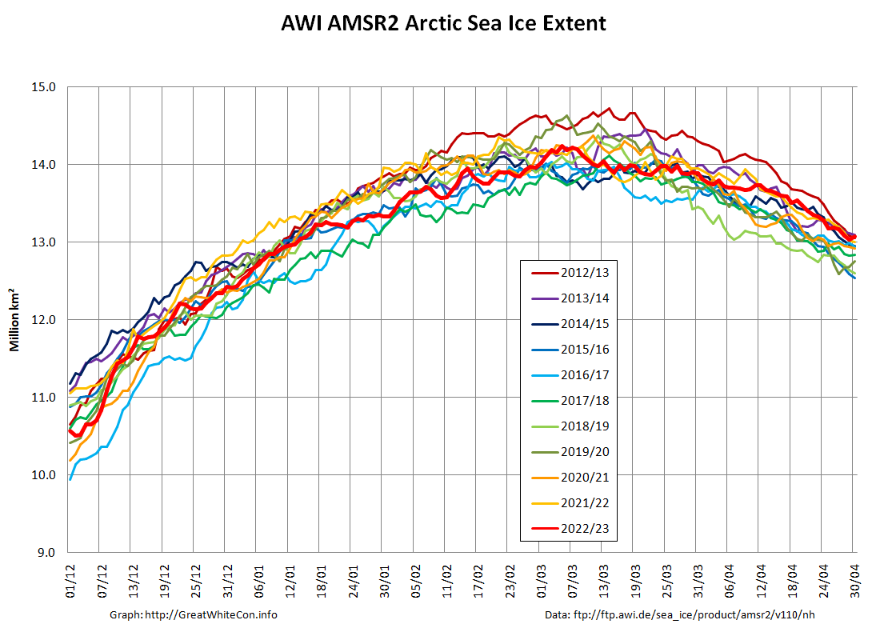
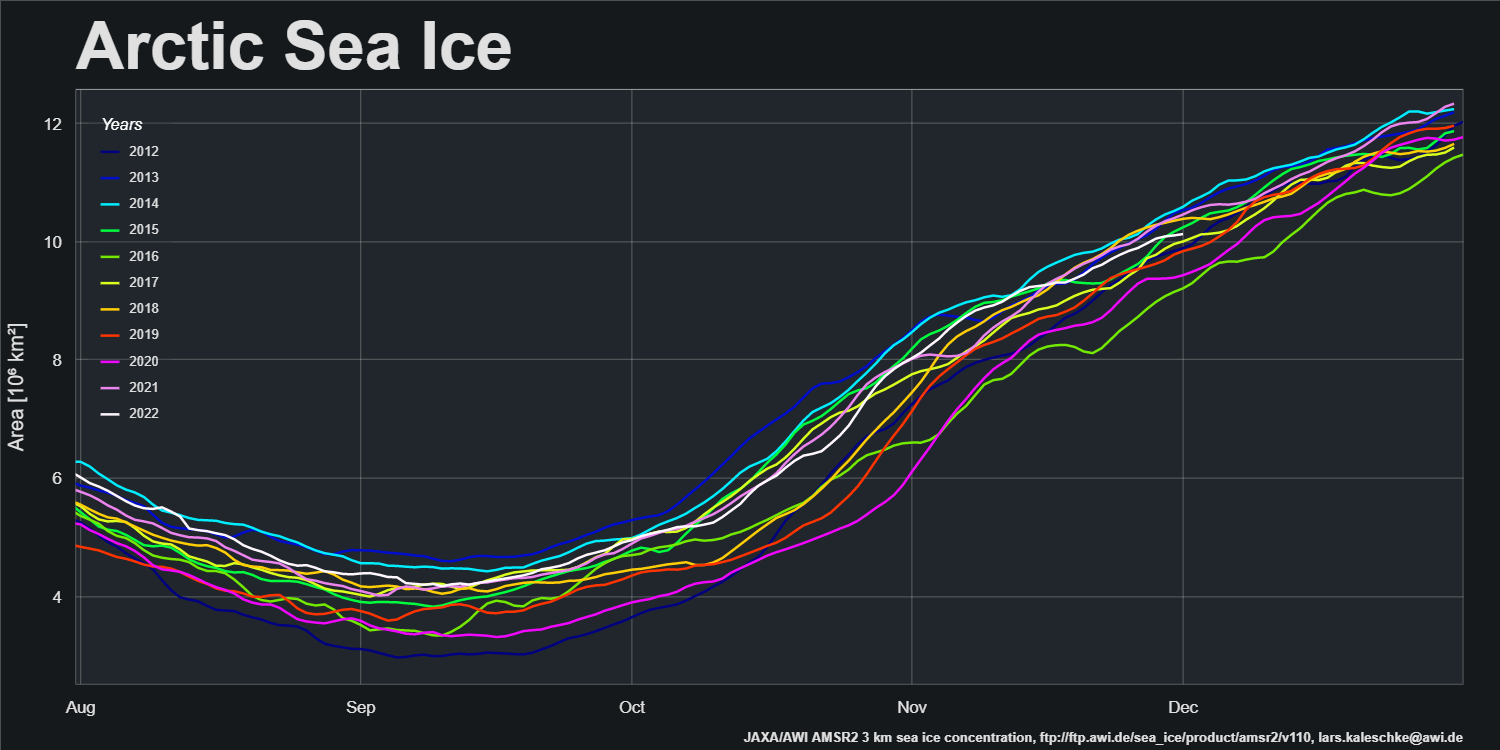
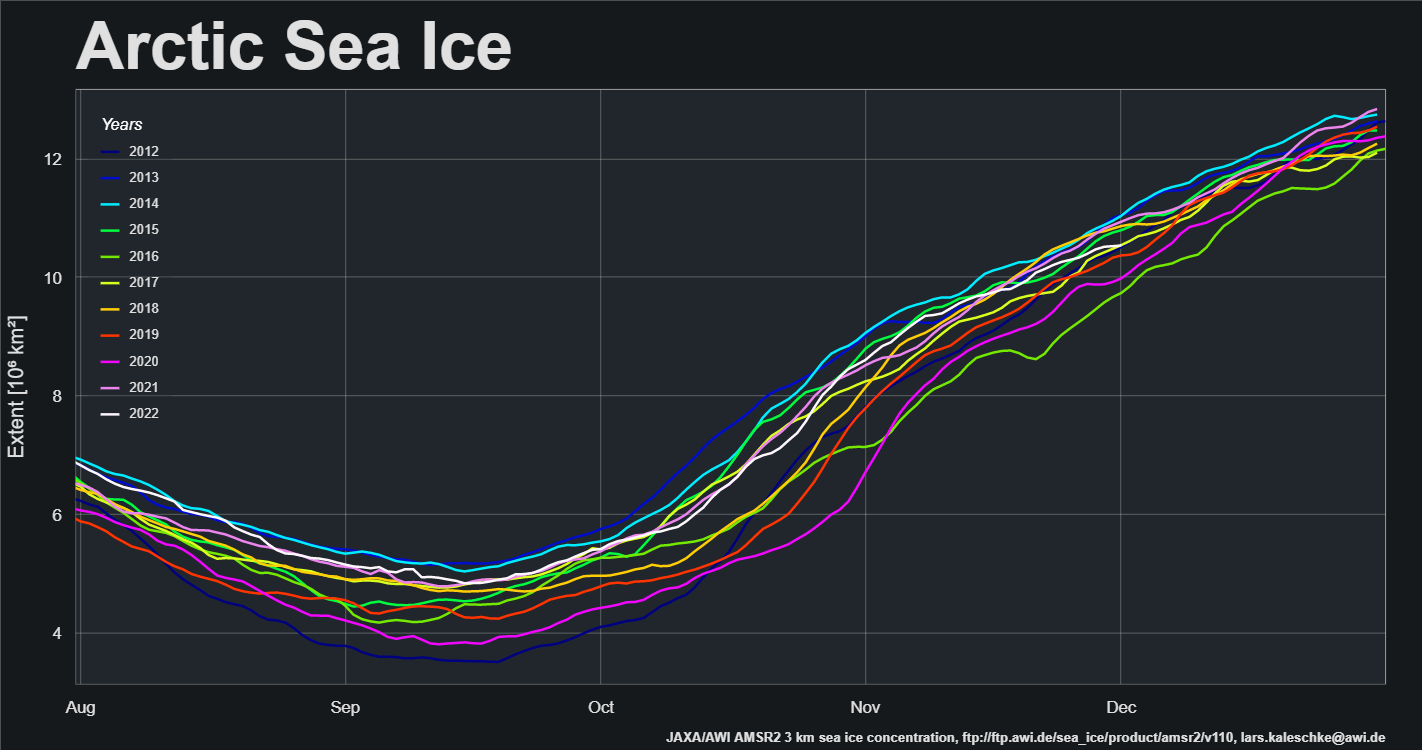
A new month is upon us and Christmas is coming! Here’s another look at Lars Kaleschke’s high resolution AMSR2 area and extent graphs for the Arctic as a whole:
Extent increase stalled for the last few days of November, and as a result extent is now in a “statistical tie” with 2017 for 4th lowest extent for the date in the AMSR2 record.
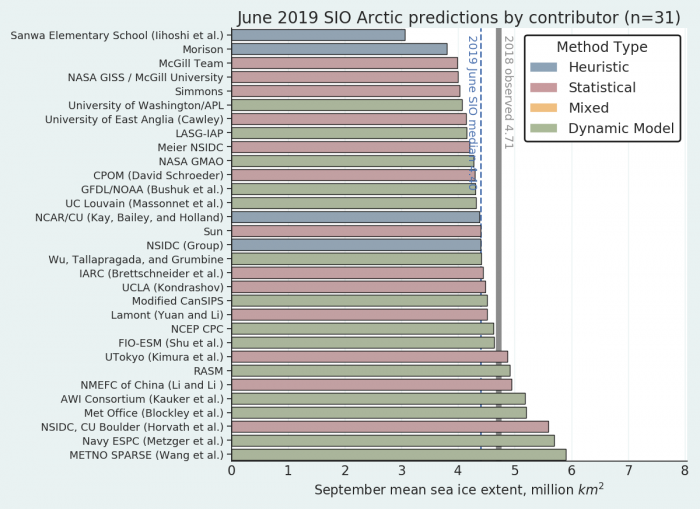
The results of the ARCUS Sea Ice Prediction Network August call have been released, and here is the outlook for the 2021 minimum September mean Arctic sea ice extent:
The median prediction for the mean sea ice extent during the month of September 2021 is 4.39 million km2. According to ARCUS:
As of 22 August 2021, the Arctic sea-ice extent was 5.58 (compared with 25 August 2020 value of 4.43) million square kilometers. Arctic sea-ice extent in 2021 remains well below the climatological median and has closely followed the 2012 values for much of the summer but has diverged to higher sea-ice extent starting in early August. The forecasts continue to support September 2021 mean sea-ice extent being well above the September 2020 value. July sea-ice retreat has been greatest in the Eurasian seas, particularly in the East Siberian Sea, making the 2021 ice edge well north of the long-term median edge in Eurasia. Sea ice retreated since the end of July along the northern coast of Alaska, although the ice edge is near its climatological position, which makes the Beaufort and Chukchi sea ice extent the largest at this time of year since 2006. A tongue of sea ice that has been present all summer continues to extend close to land in the Kara Sea, making the northeast passage likely to remain blocked for the first time in several years. Half the models which provide spatial data to the SIO predict that the tongue is likely to survive.
Now let’s take a look at a range of assorted extent measurements. Here’s the NSIDC’s 5 day average extent:
Let’s first of all take a look at JAXA’s flavour of Arctic sea ice extent:
After reaching lowest extent for the date in early July, the weather in the Arctic Basin was stormy, cloudy and cool compared to other recent years until the last few days of the month:
Here’s the same period in 2020 for comparison purposes:
Consequently the rate of extent loss in the second half of July was significantly less than last year.
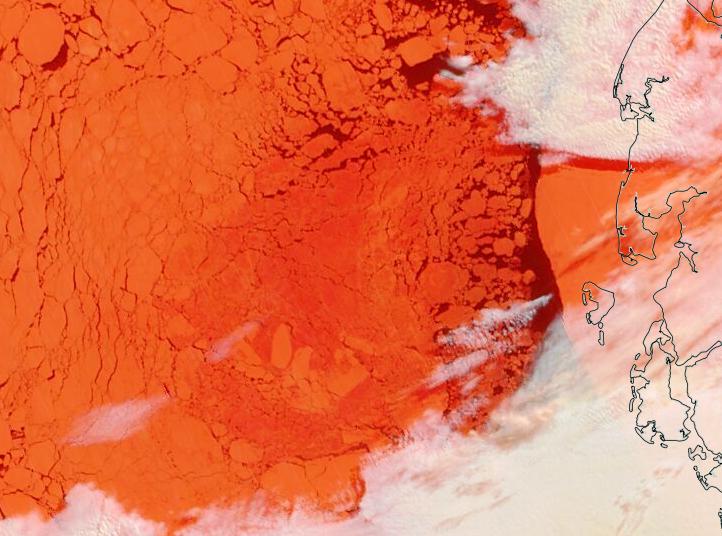
It’s May Day 2021, and just for a change we’re going to start the month off with a pretty picture!
Parts of the Laptev Sea are starting to look distinctly “warm” in the infra-red. Here’s a “false colour” image taken by the Terra satellite during a gap in the clouds:
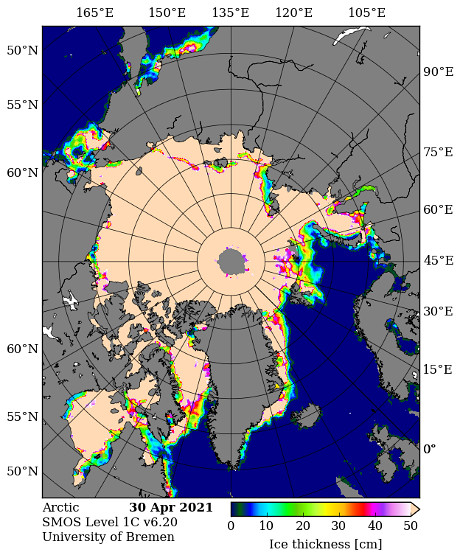
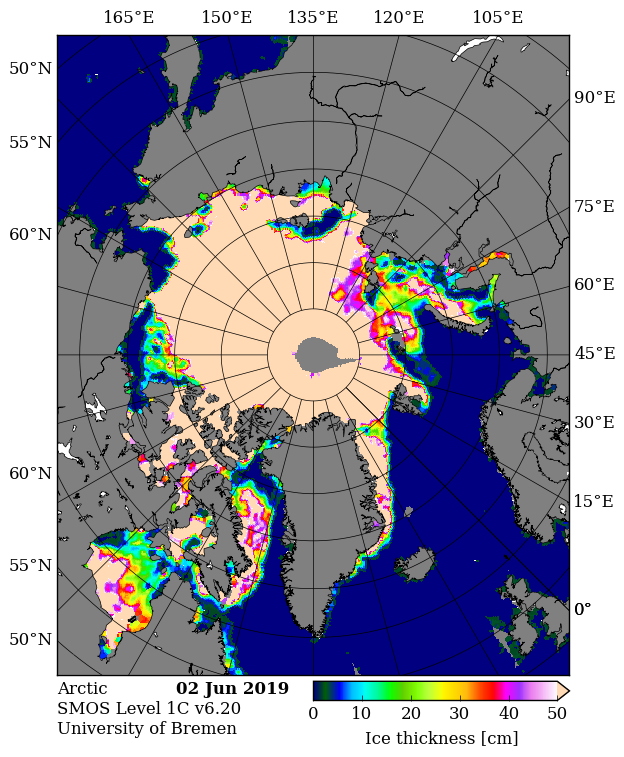
We have reached the time of year when the SMOS “thin ice thickness” readings start being affected by surface melt, but let’s take a look anyway:
That area of the Laptev certainly appears to be either thin or melting.
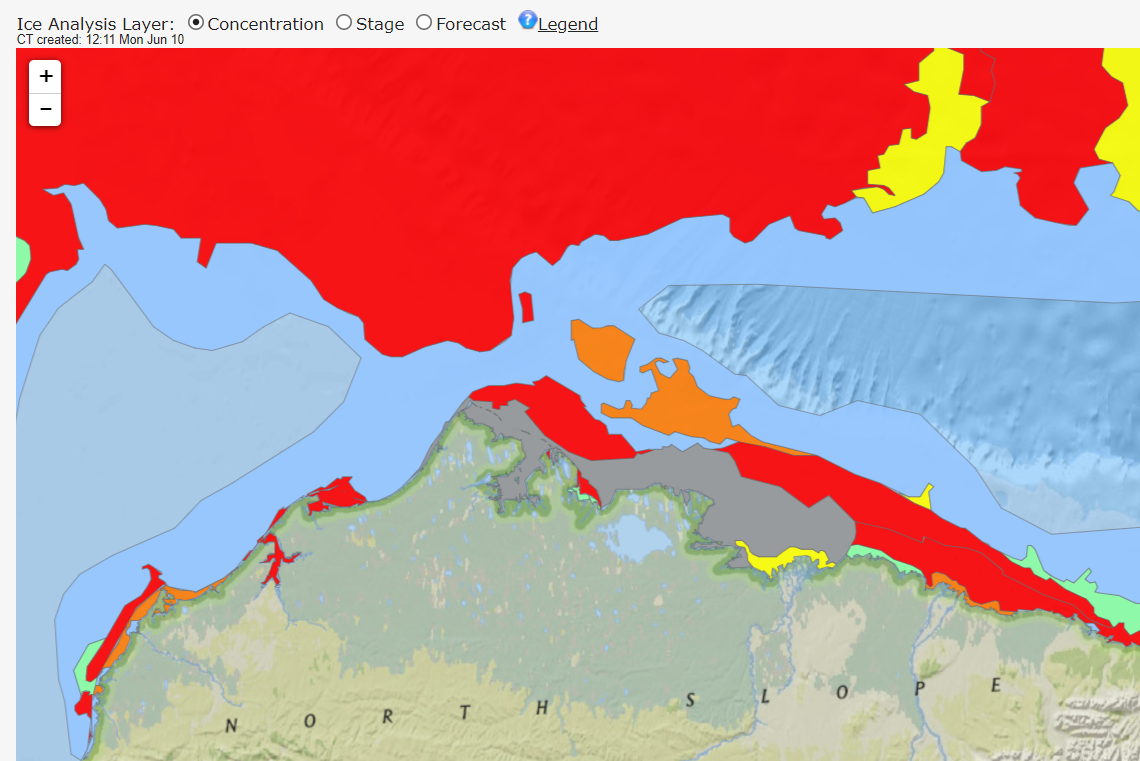
Meanwhile on the Canadian side of the Arctic the fast ice off the Mackenzie Delta is starting to get damp, even though the river itself still looks to be fairly well frozen:
It will also be interesting to follow the progress of this large floe as it heads towards oblivion through the Fram Strait:
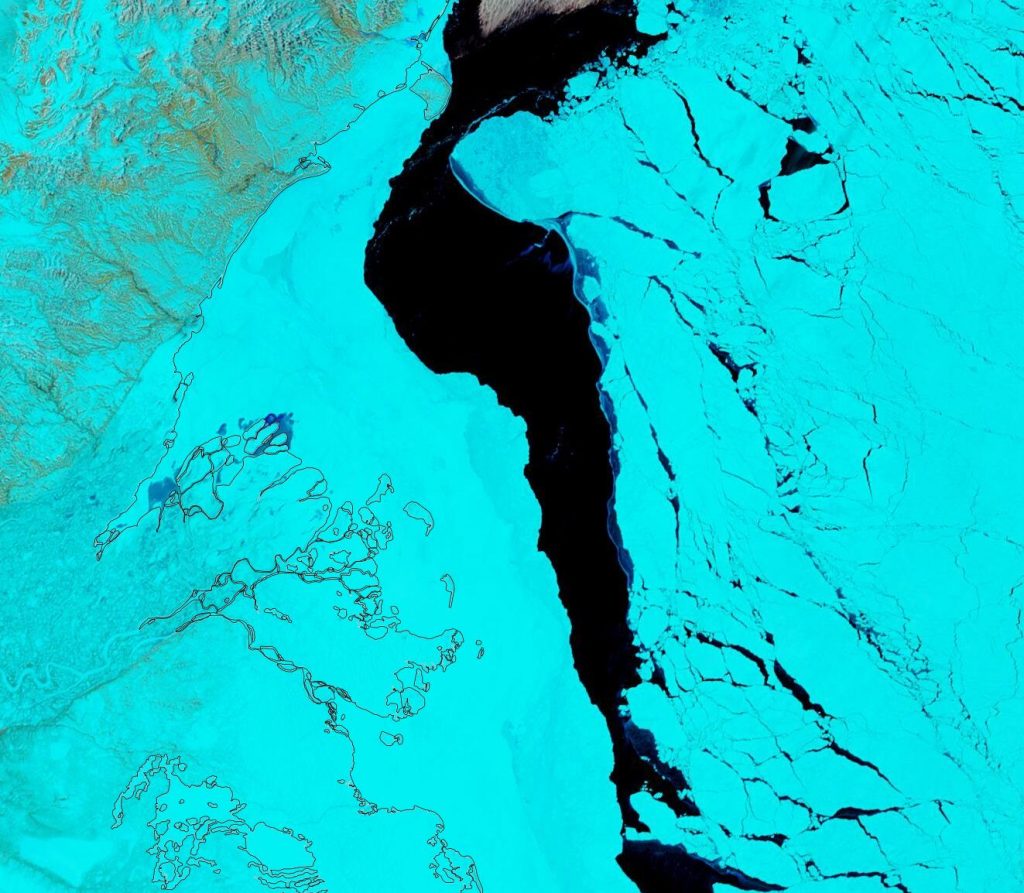
In my humble opinion summer in the Arctic summer starts on June 1st, so let’s check the current sea ice situation in the once frozen North. For details of the preconditioning of the ice during the Arctic spring see “Melt Pond May“, where I concluded that:
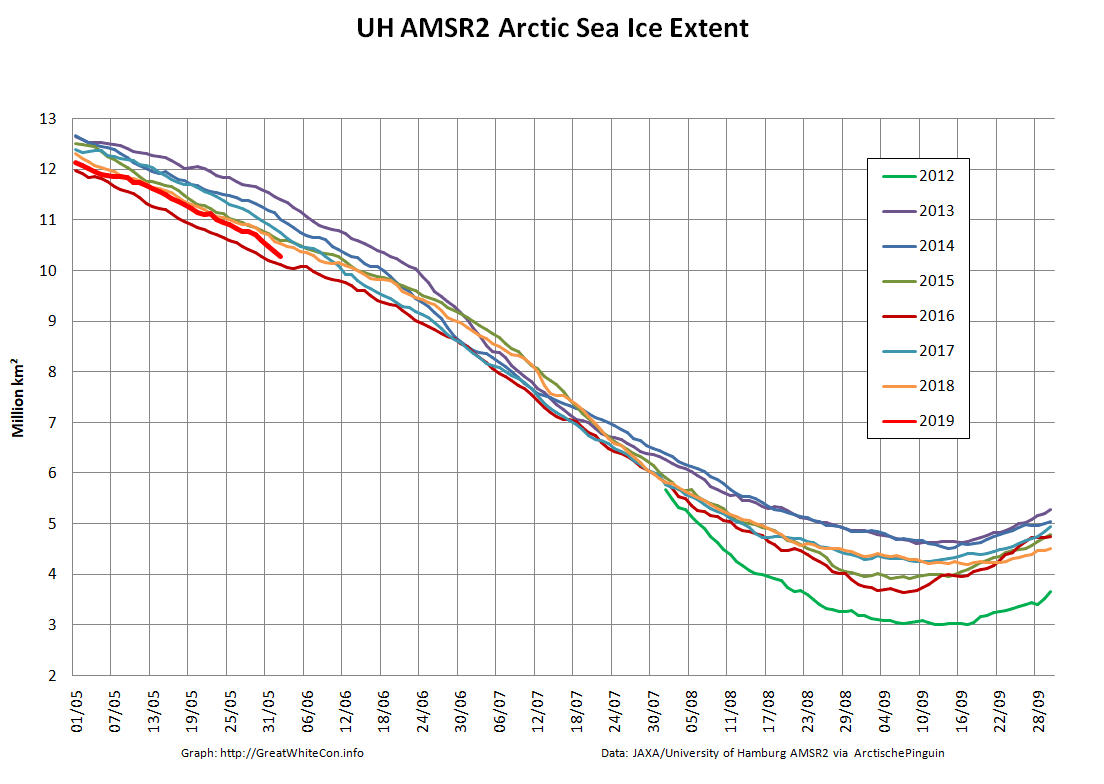
Compared with 2016 at the same time of year I am compelled to say that with June 1st just around the corner the 2019 summer melting season is primed to progress more quickly.
Currently extent is significantly below 2012, albeit somewhat above 2016 at the same time of year. And what of melt ponds? In 2012 there was evidence of less snow cover over land and more surface water on the ice on the Siberian side of the Arctic. Other than that Arctic sea ice in 2019 looks to be in worse shape than in 2012.
And how have things progressed over the last few days? Take a look at this:
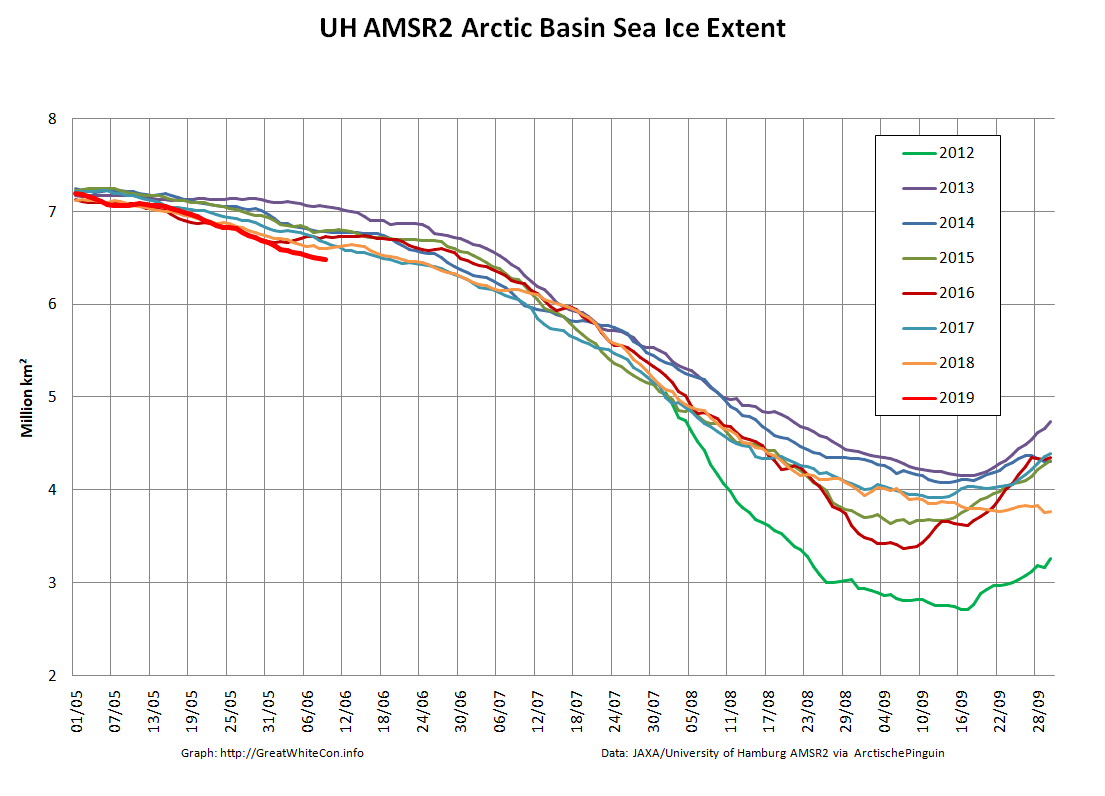
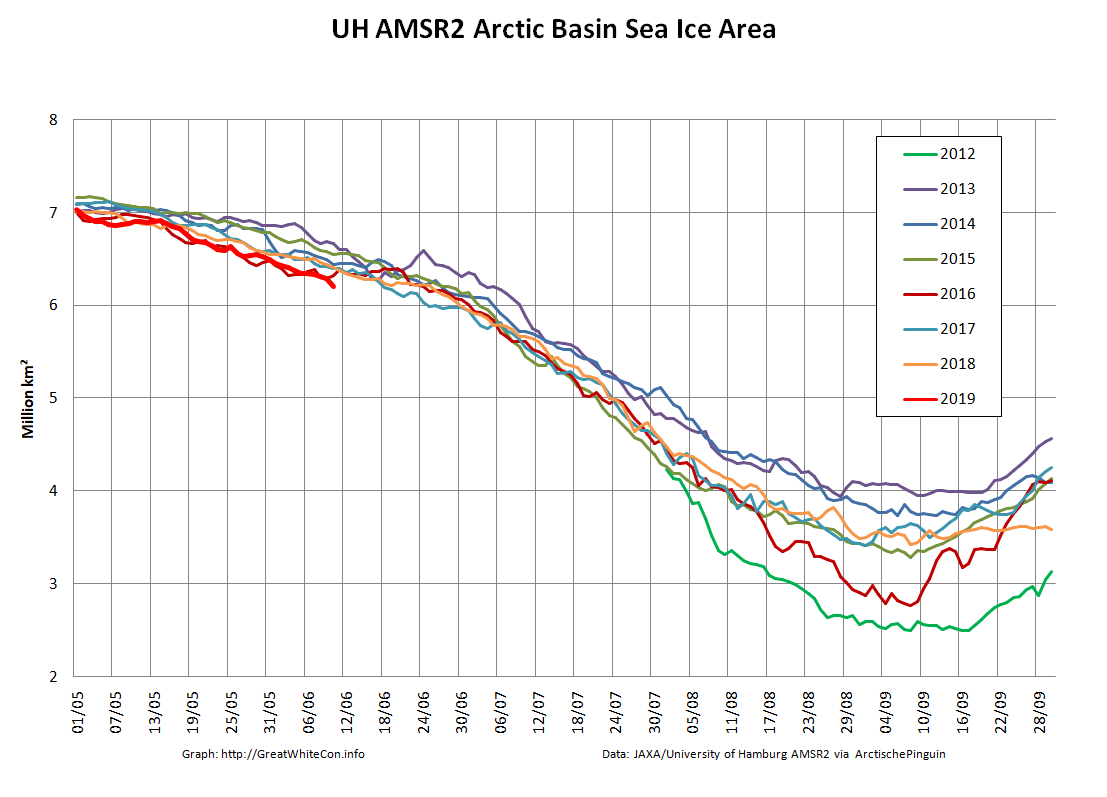
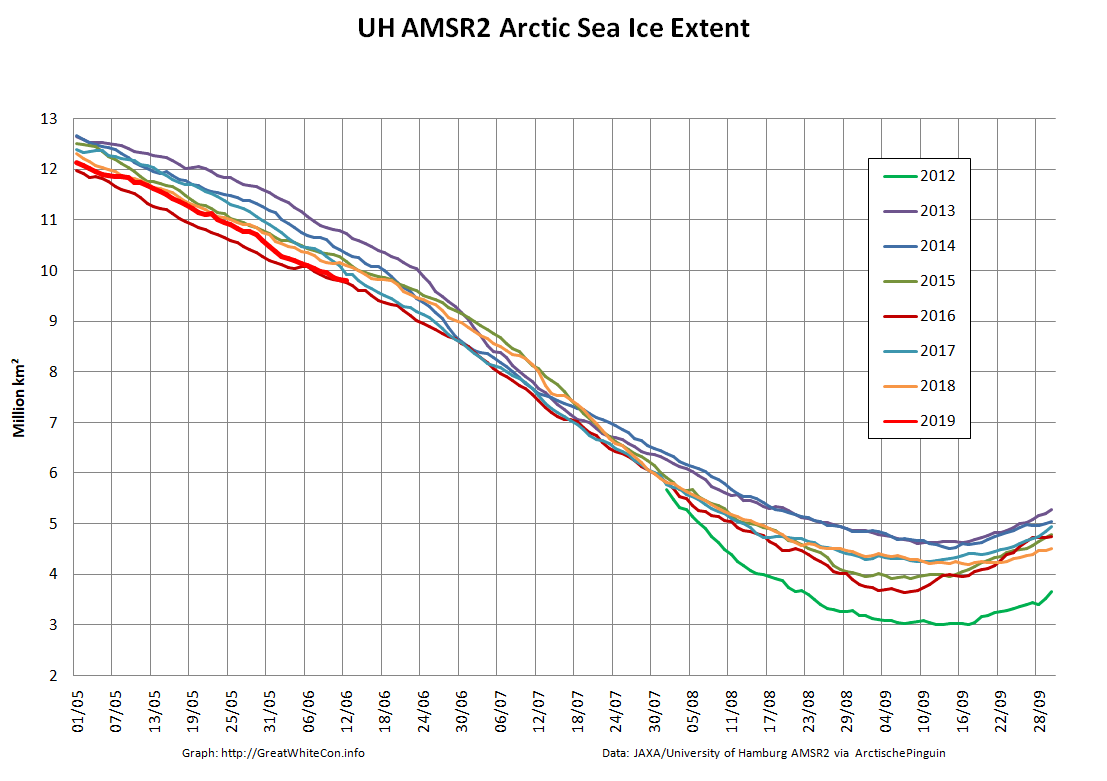
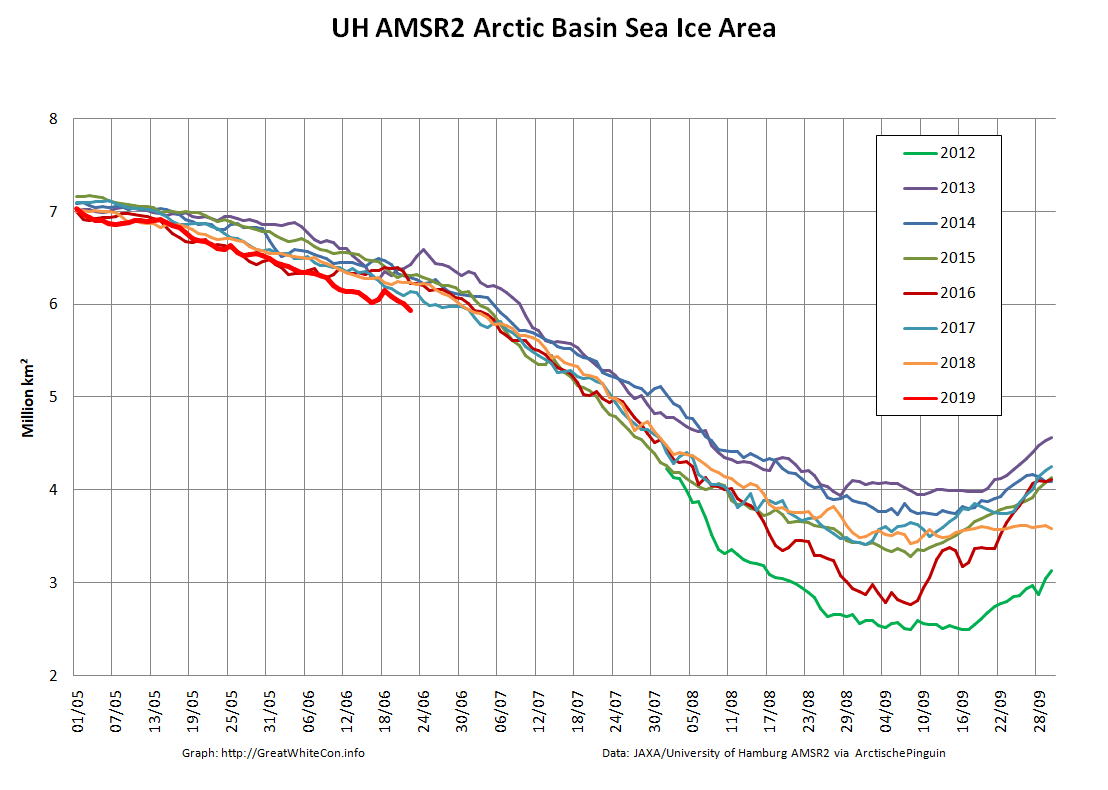
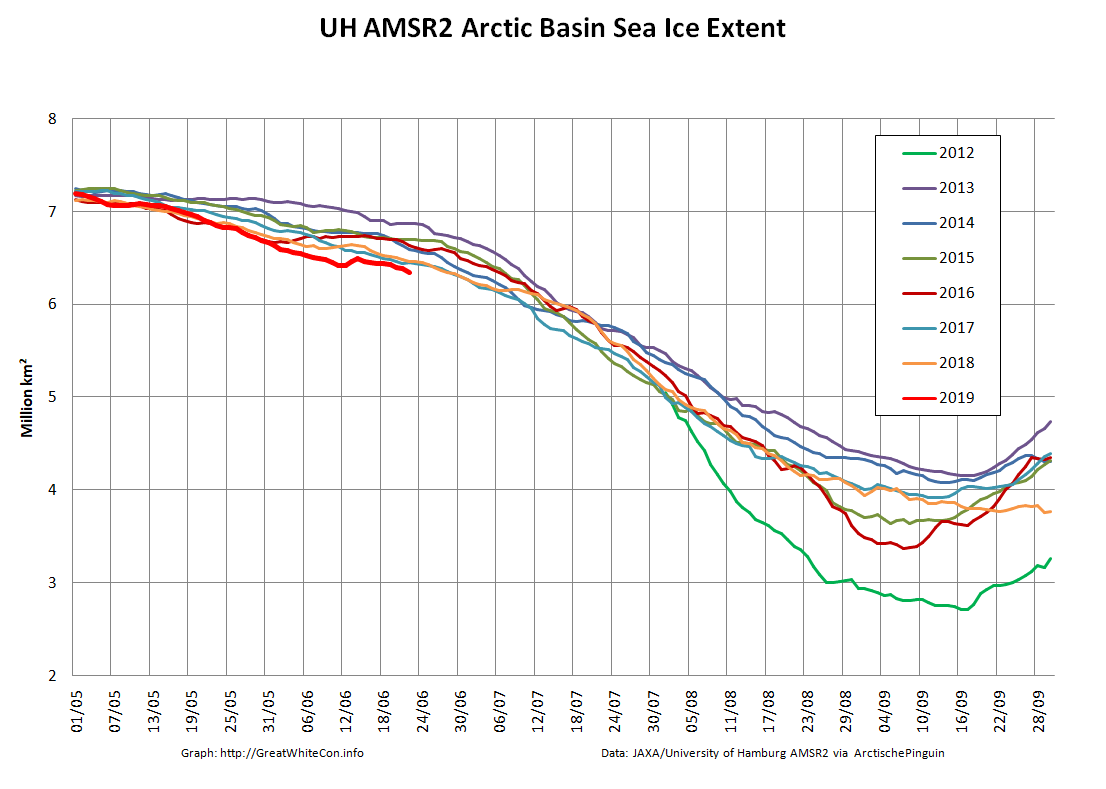
Our “Arctic Basin” metric encompasses the Central Arctic plus the Beaufort, Chukchi, East Siberian and Laptev Seas. It is currently headed into uncharted waters. The effect on overall Arctic sea ice extent is also readily visible:
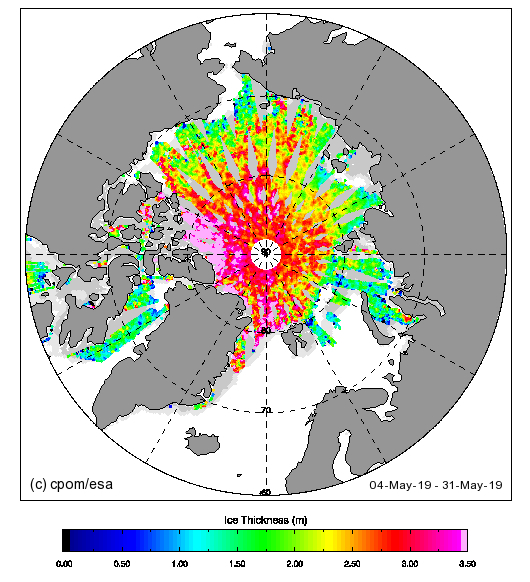
This year both the CPOM version of CryoSat-2 thickness and the University of Bremen’s SMOS thickness maps are continuing to be published during the melting season:
Take them with a large pinch of salt at this time of year!
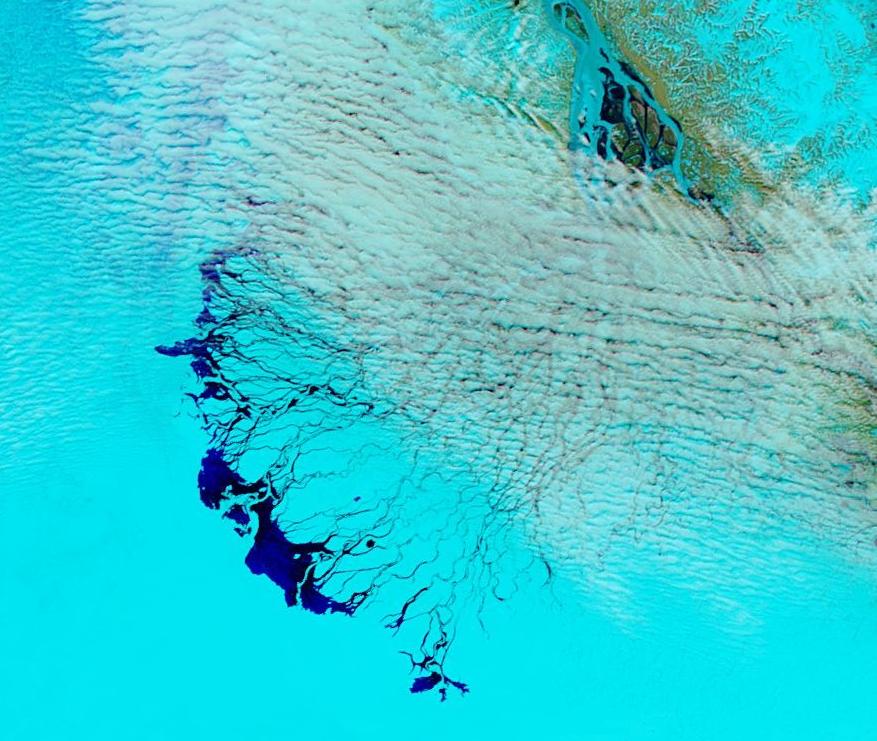
Finally, for the moment at least, liquid water is starting to seep out of the Lena Delta:
NASA Worldview “false-color” image of the Lena Delta on June 3rd 2019, derived from the MODIS sensor on the Aqua satellite
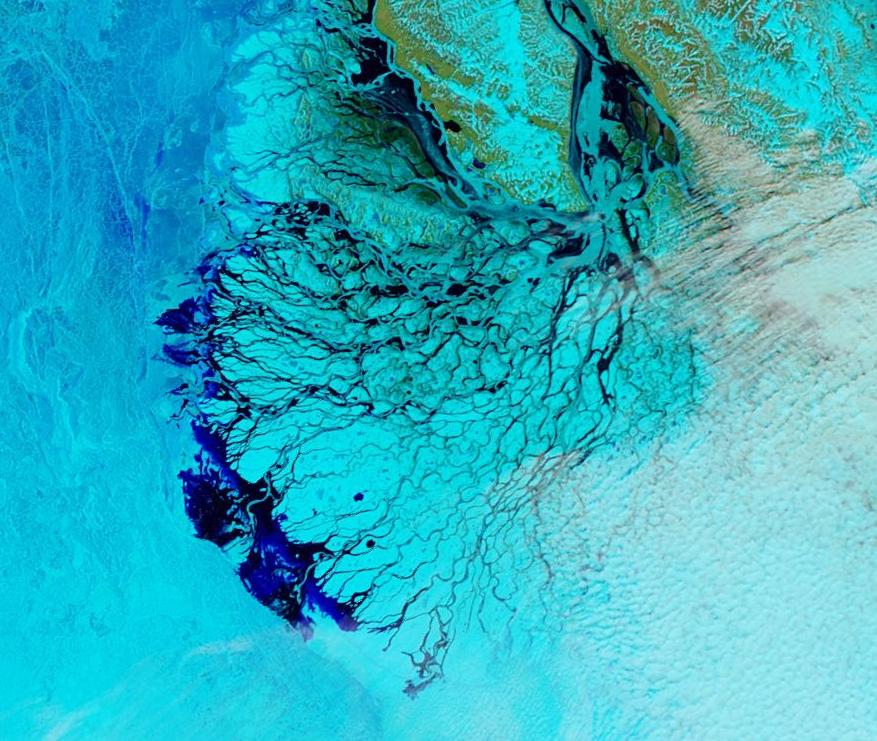
For comparison purposes please also take a look at the same date in 2016:
NASA Worldview “false-color” image of the Lena Delta on June 3rd 2016, derived from the MODIS sensor on the Aqua satellite
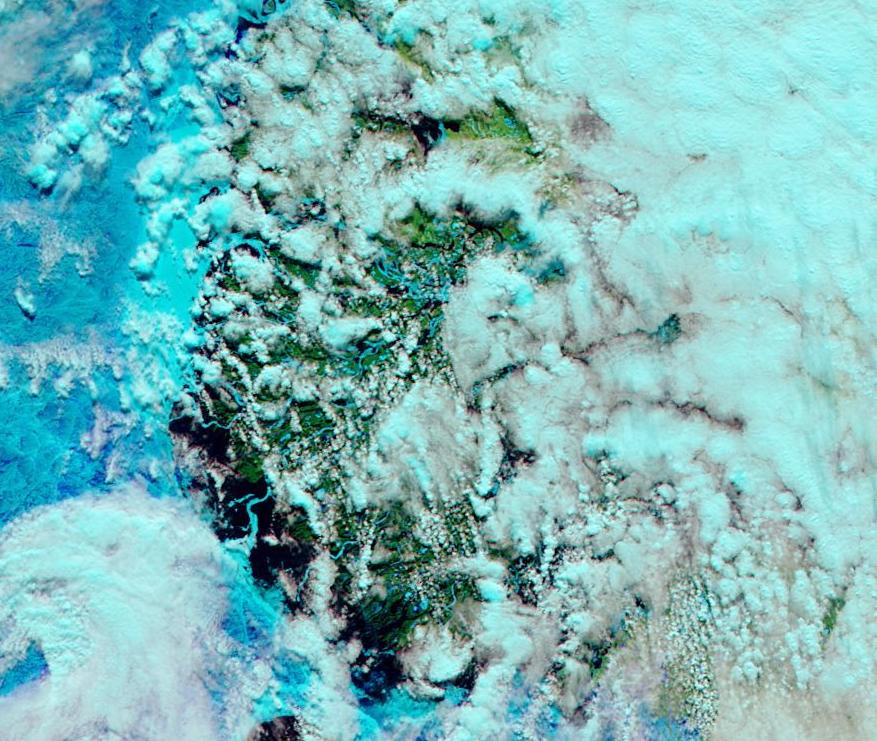
and the previous date in 2012:
NASA Worldview “false-color” image of the Lena Delta on June 2nd 2012, derived from the MODIS sensor on the Aqua satellite
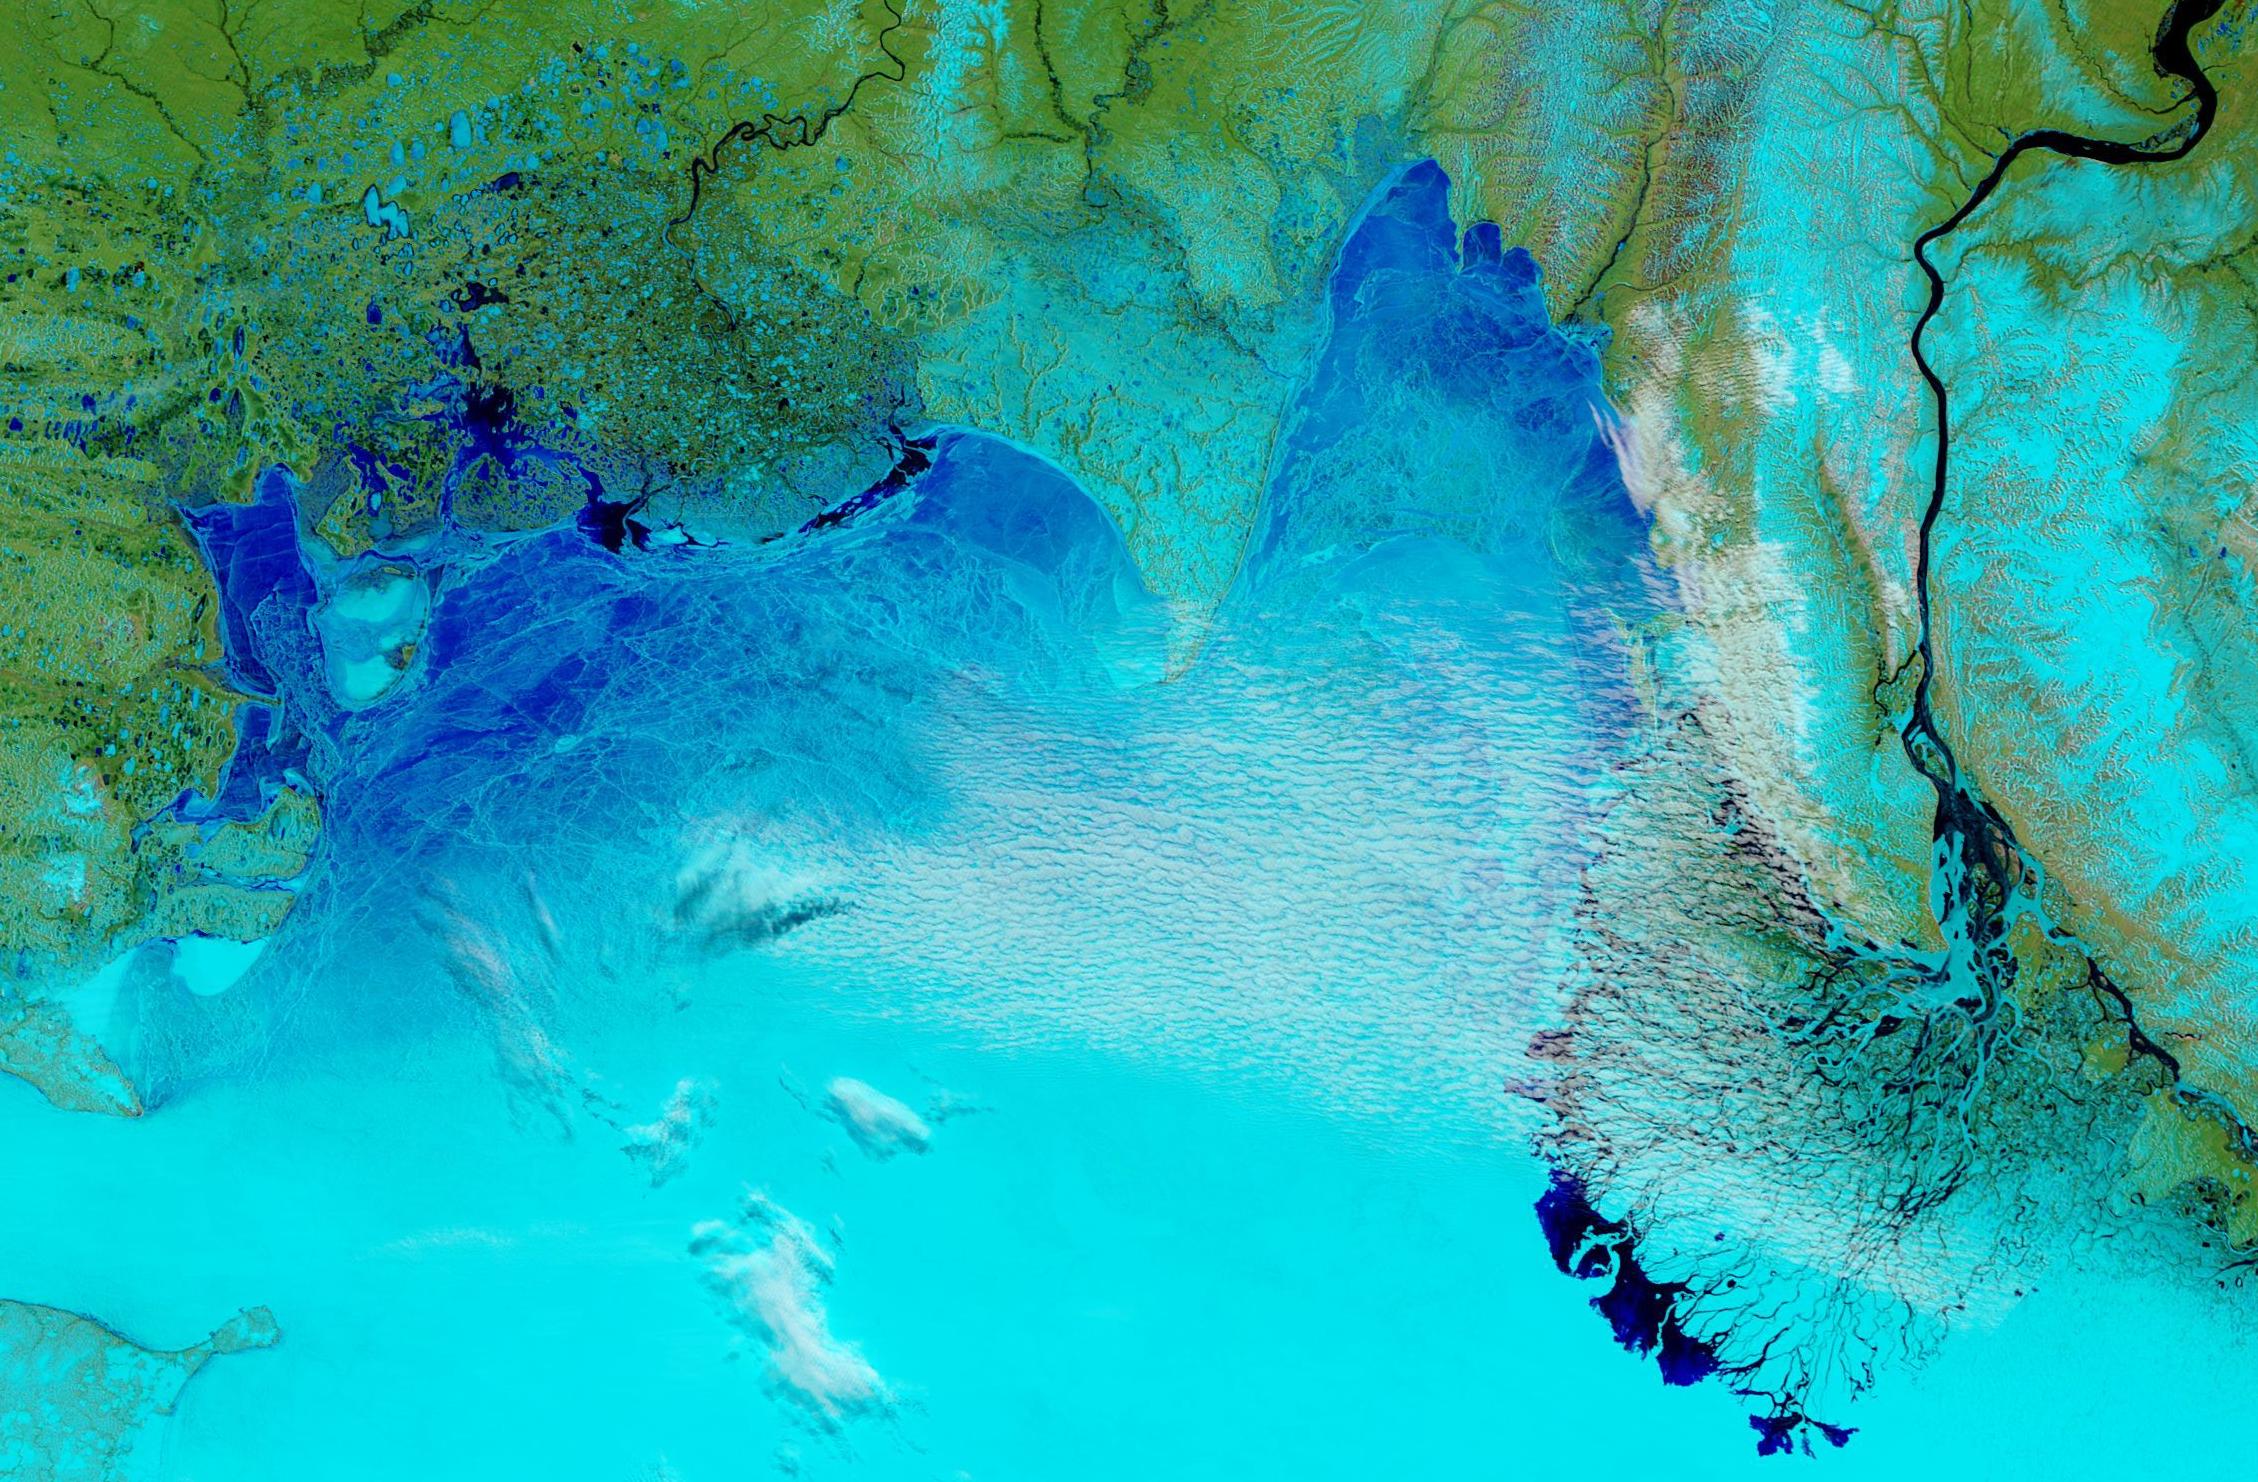
[Edit – June 4th]
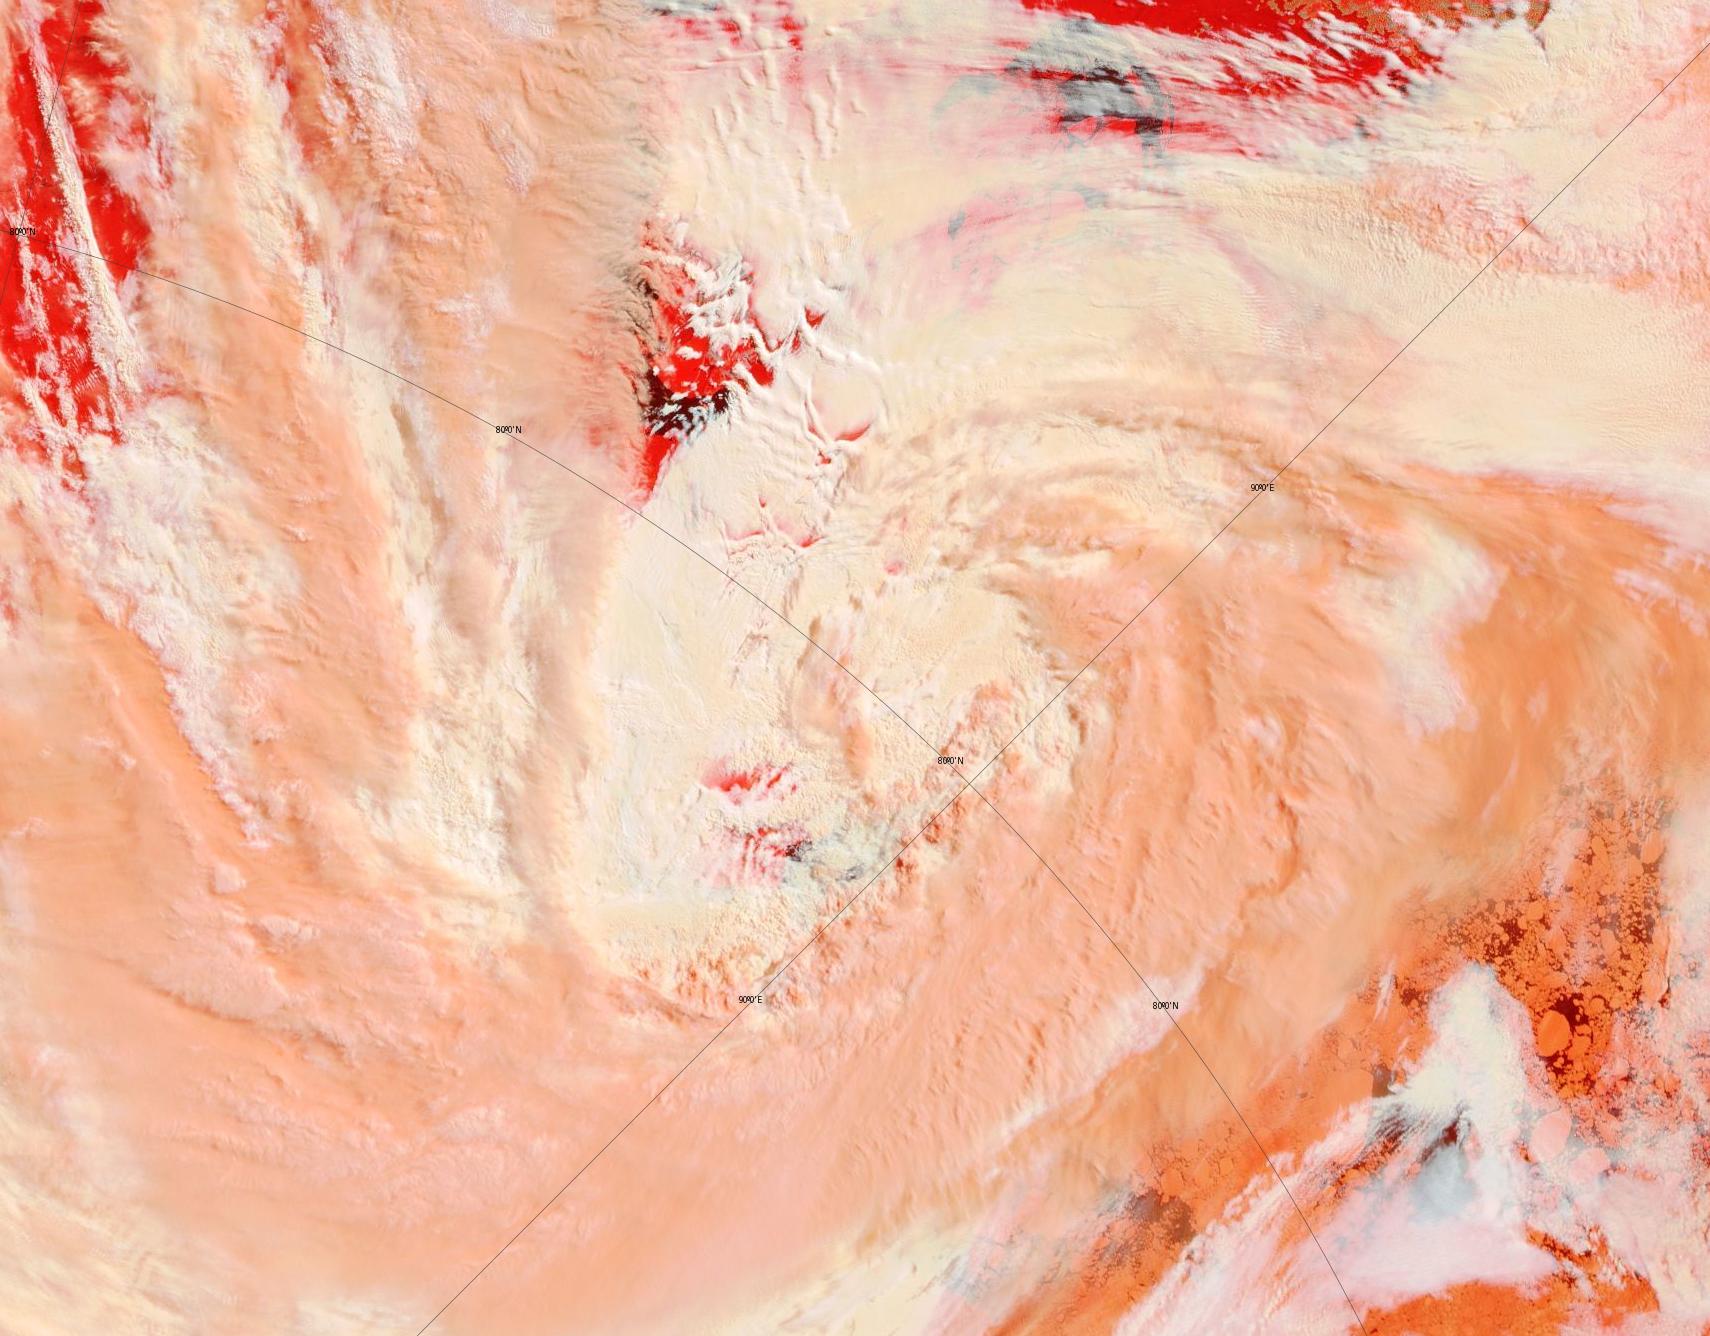
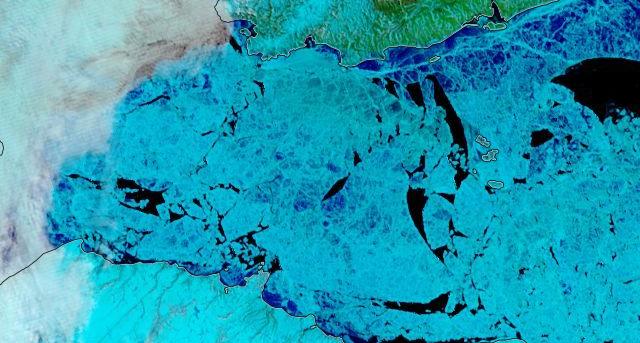
A significant area of the Laptev Sea ice is now turning a much darker shade of blue using the band 7-2-1 false colour combination:
NASA Worldview “false-color” image of the Laptev Sea on June 4th 2019, derived from the MODIS sensor on the Terra satellite
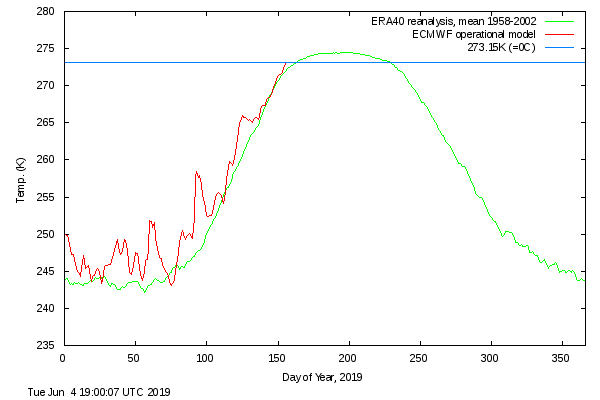
In addition the DMI >80N temperature metric has reached the zero Celsius line well ahead of schedule:
[Edit – June 5th]
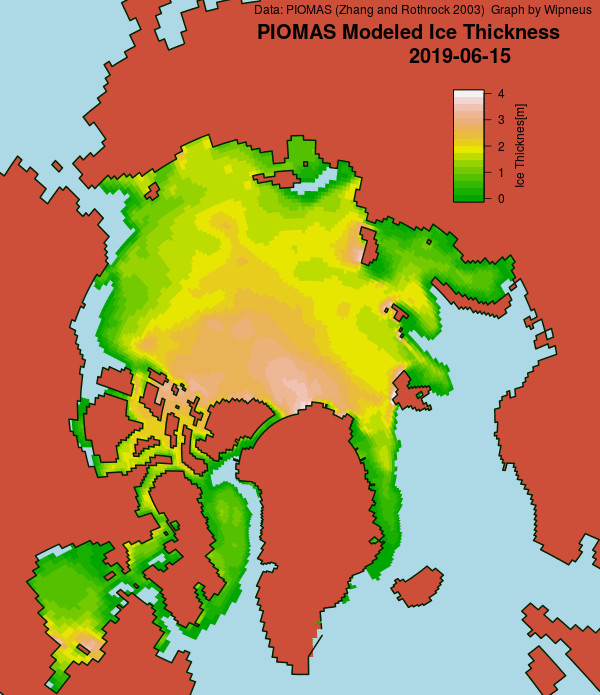
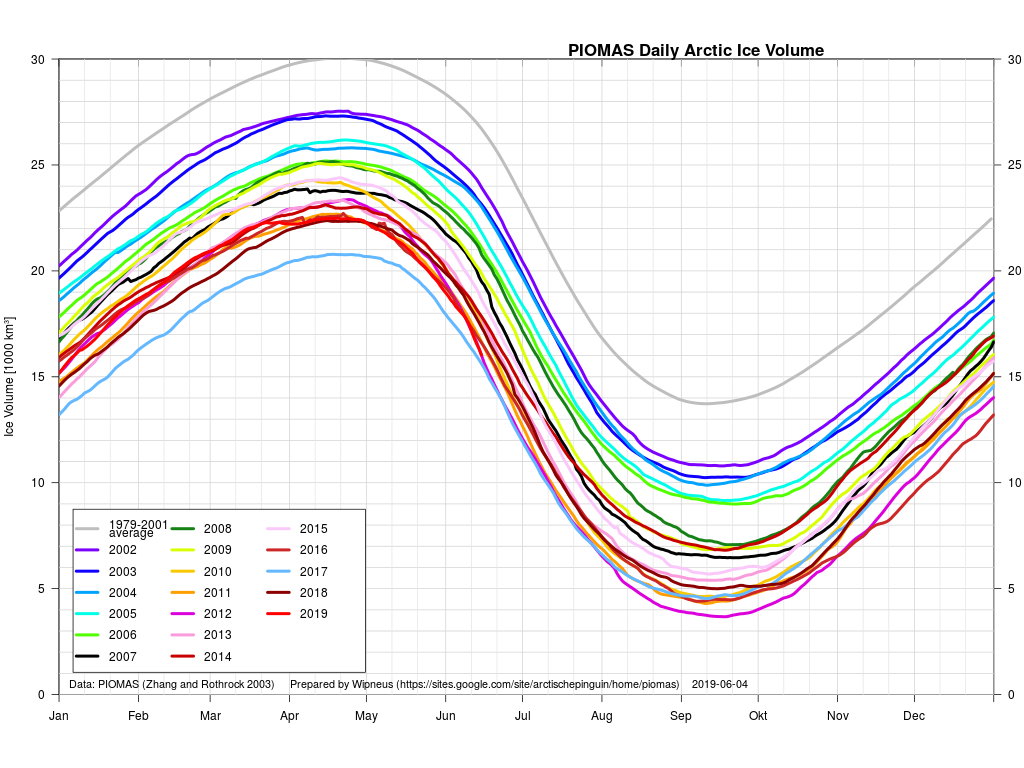
The May PIOMAS numbers have been released! Here is the Wipneus generated state of play on May 31st:
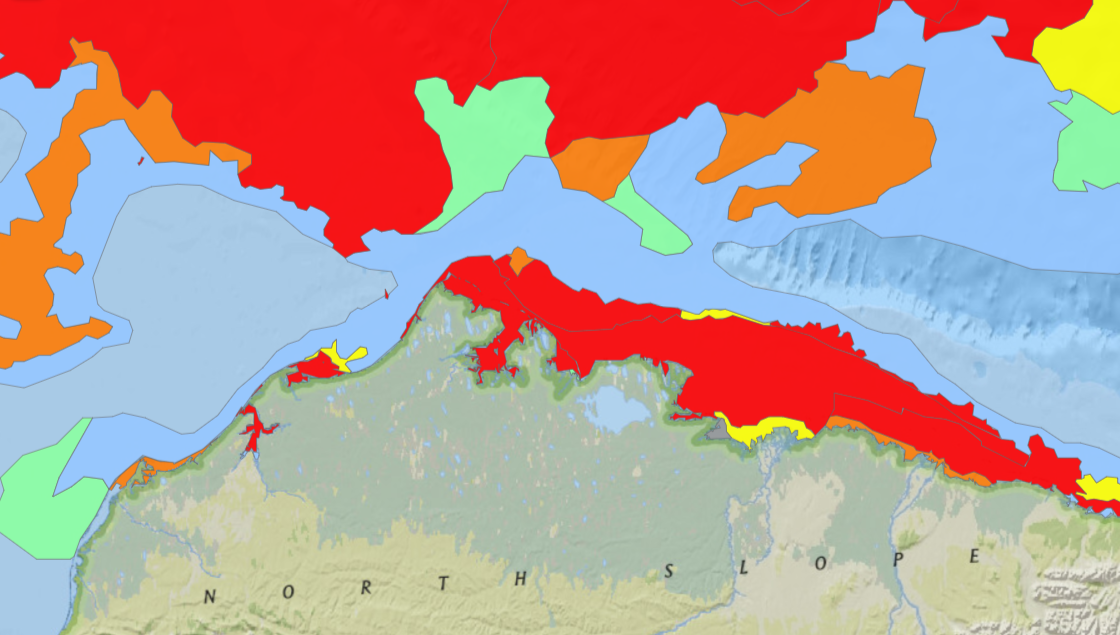
Any early bird traversing the Northwest Passage from west to east could now sail through open water around Point Barrow, along the Alaskan and Canadian coast and into the Amundsen Gulf:
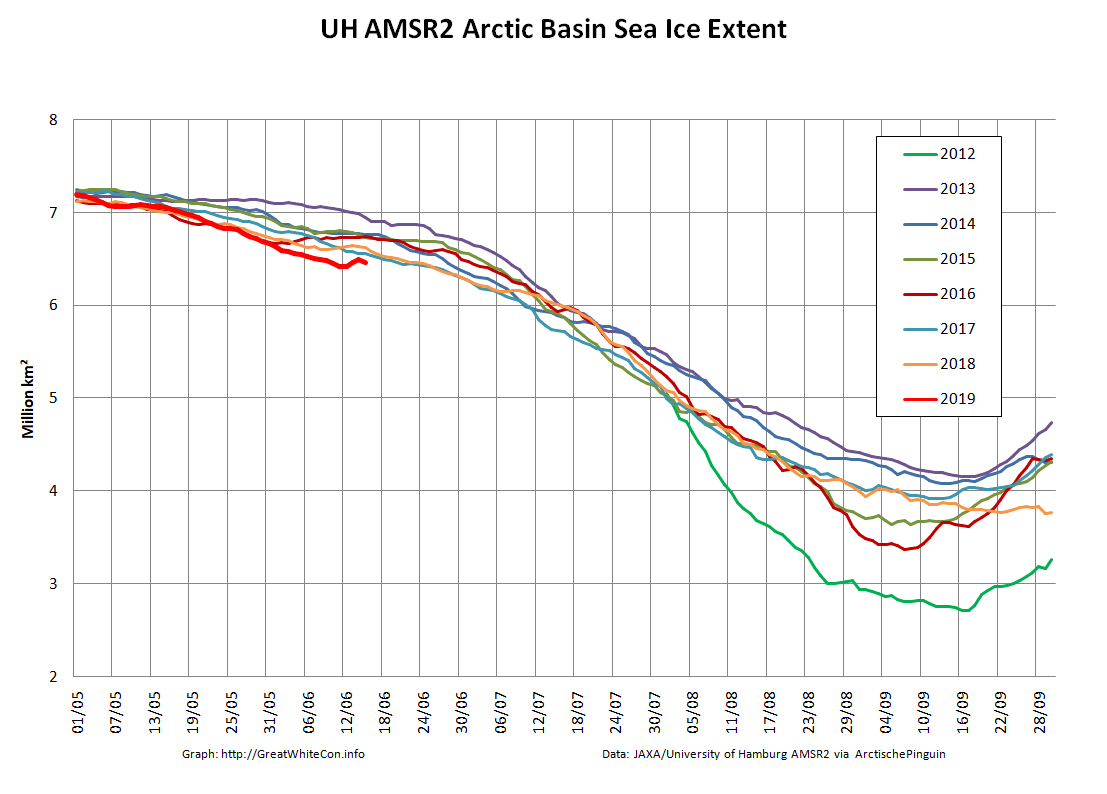
Arctic Basin sea ice extent is still descending through uncharted territory:
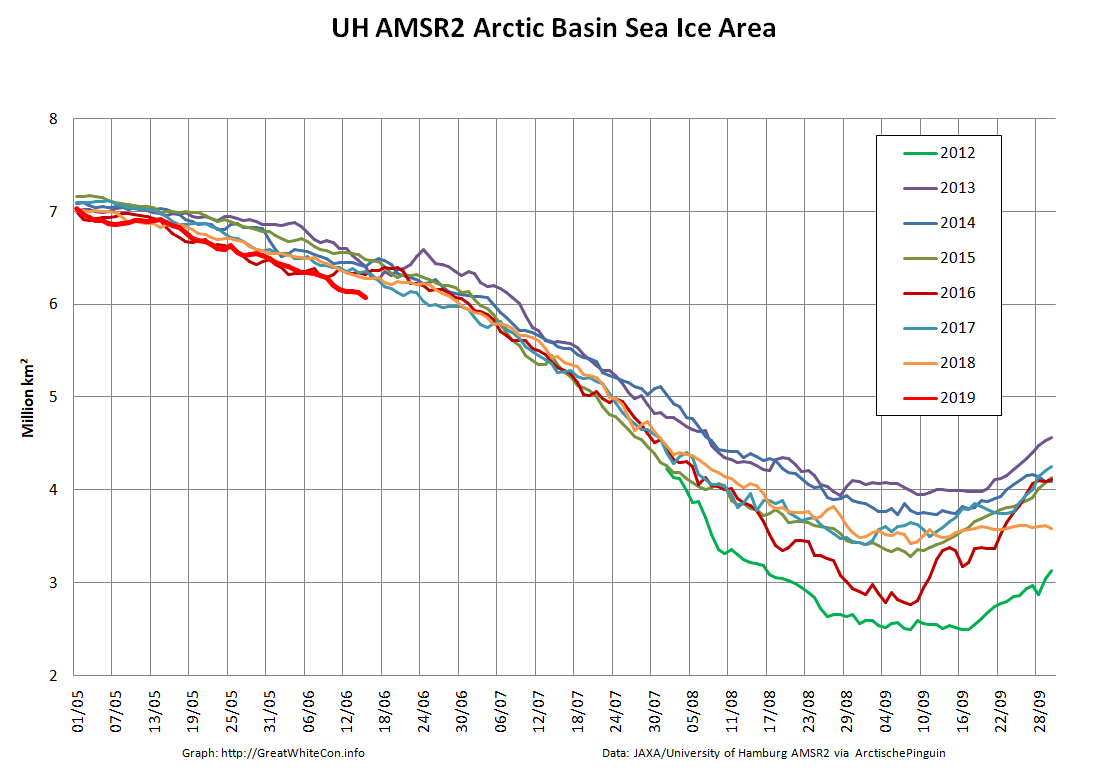
and Basin area currently looks poised to follow suit:
[Edit – June 11th]
There’s a beautifully clear view of the Siberian coast today, with vast areas of melt ponds visible on VIIRS false colour:
NASA Worldview “false-color” image of the Laptev & East Siberian Seas on June 11th 2019, derived from the VIIRS sensor on the Suomi satellite
The Arctic Basin area has indeed taken a nosedive into uncharted territory:
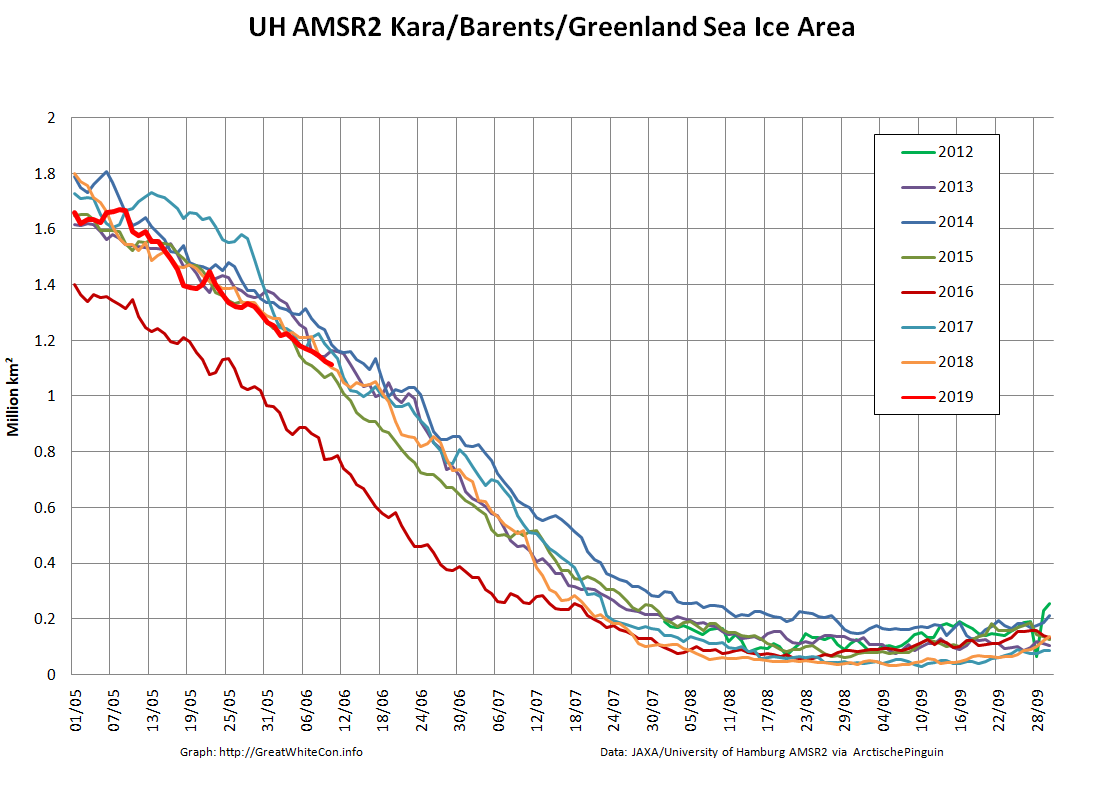
By way of comparison sea ice area on the Atlantic periphery is in amongst the recent pack, thanks to the almost continual drift in that direction over last winter:
[Edit – June 13th]
High resolution AMSR2 extent has been in a “statistical tie” with 2016 for a few days:
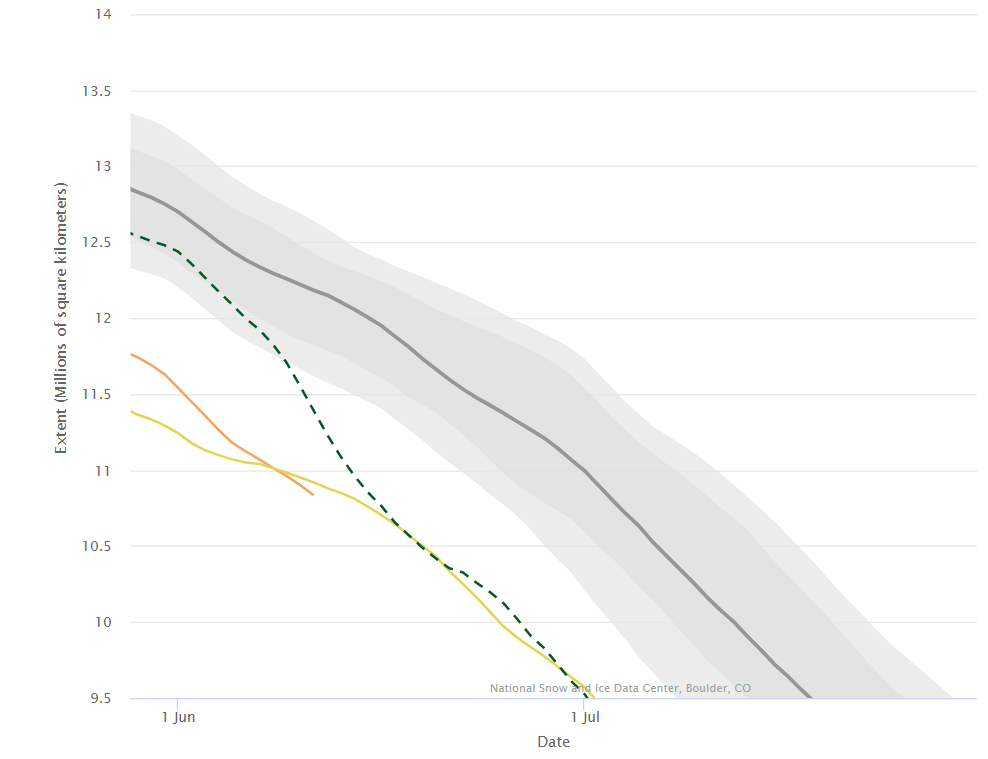
However the NSIDC’s 5 day average extent has reached a clear new low for the date, in the satellite record at least:
[Edit – June 14th]
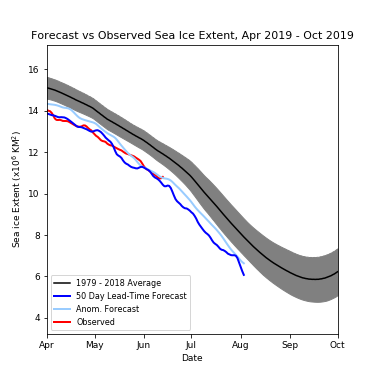
Especially for AJBT, here’s the Slater Probabilistic Ice Extent prediction for August 3rd:
and here’s the current DMI >80N temperature graph:
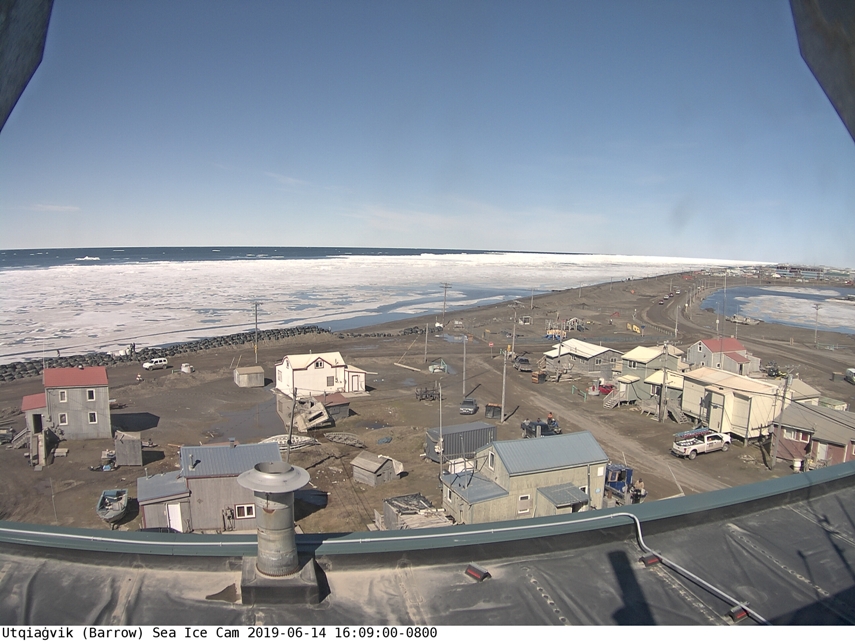
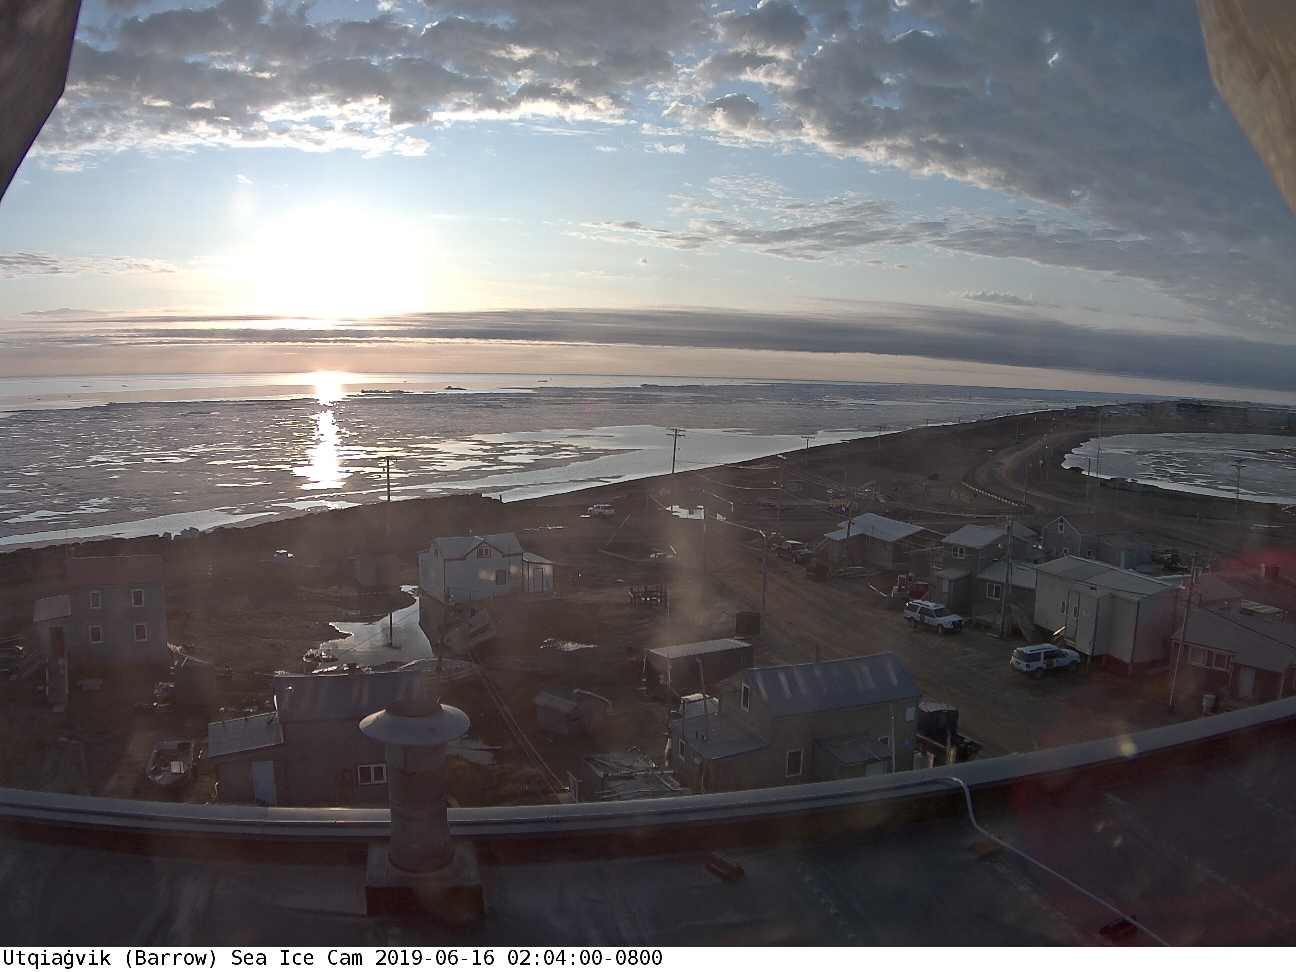
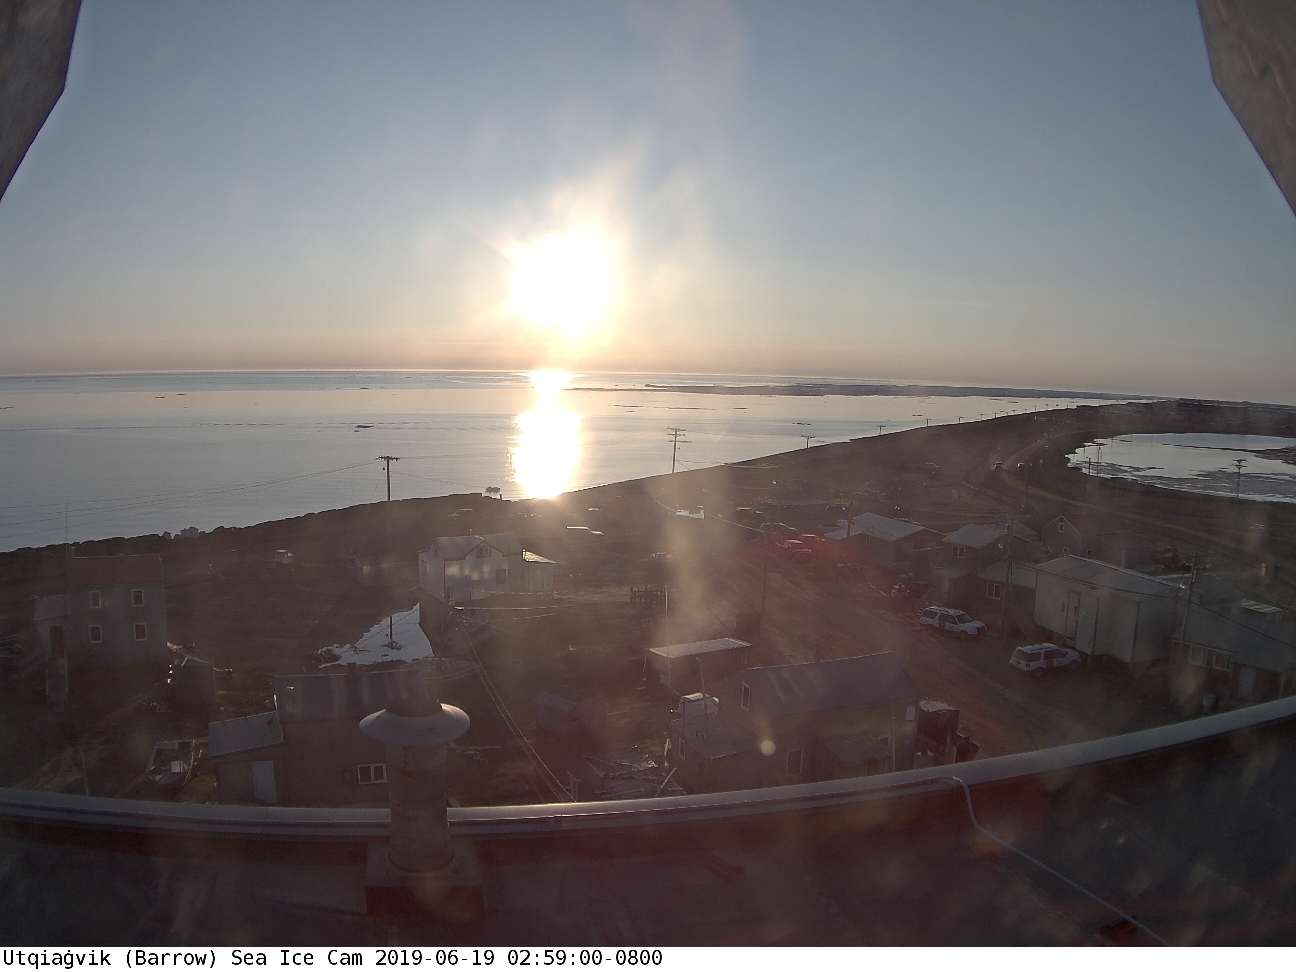
Finally, for the moment at least, there is not very much fast ice left at Utqiaġvik:
[Edit – June 15th]
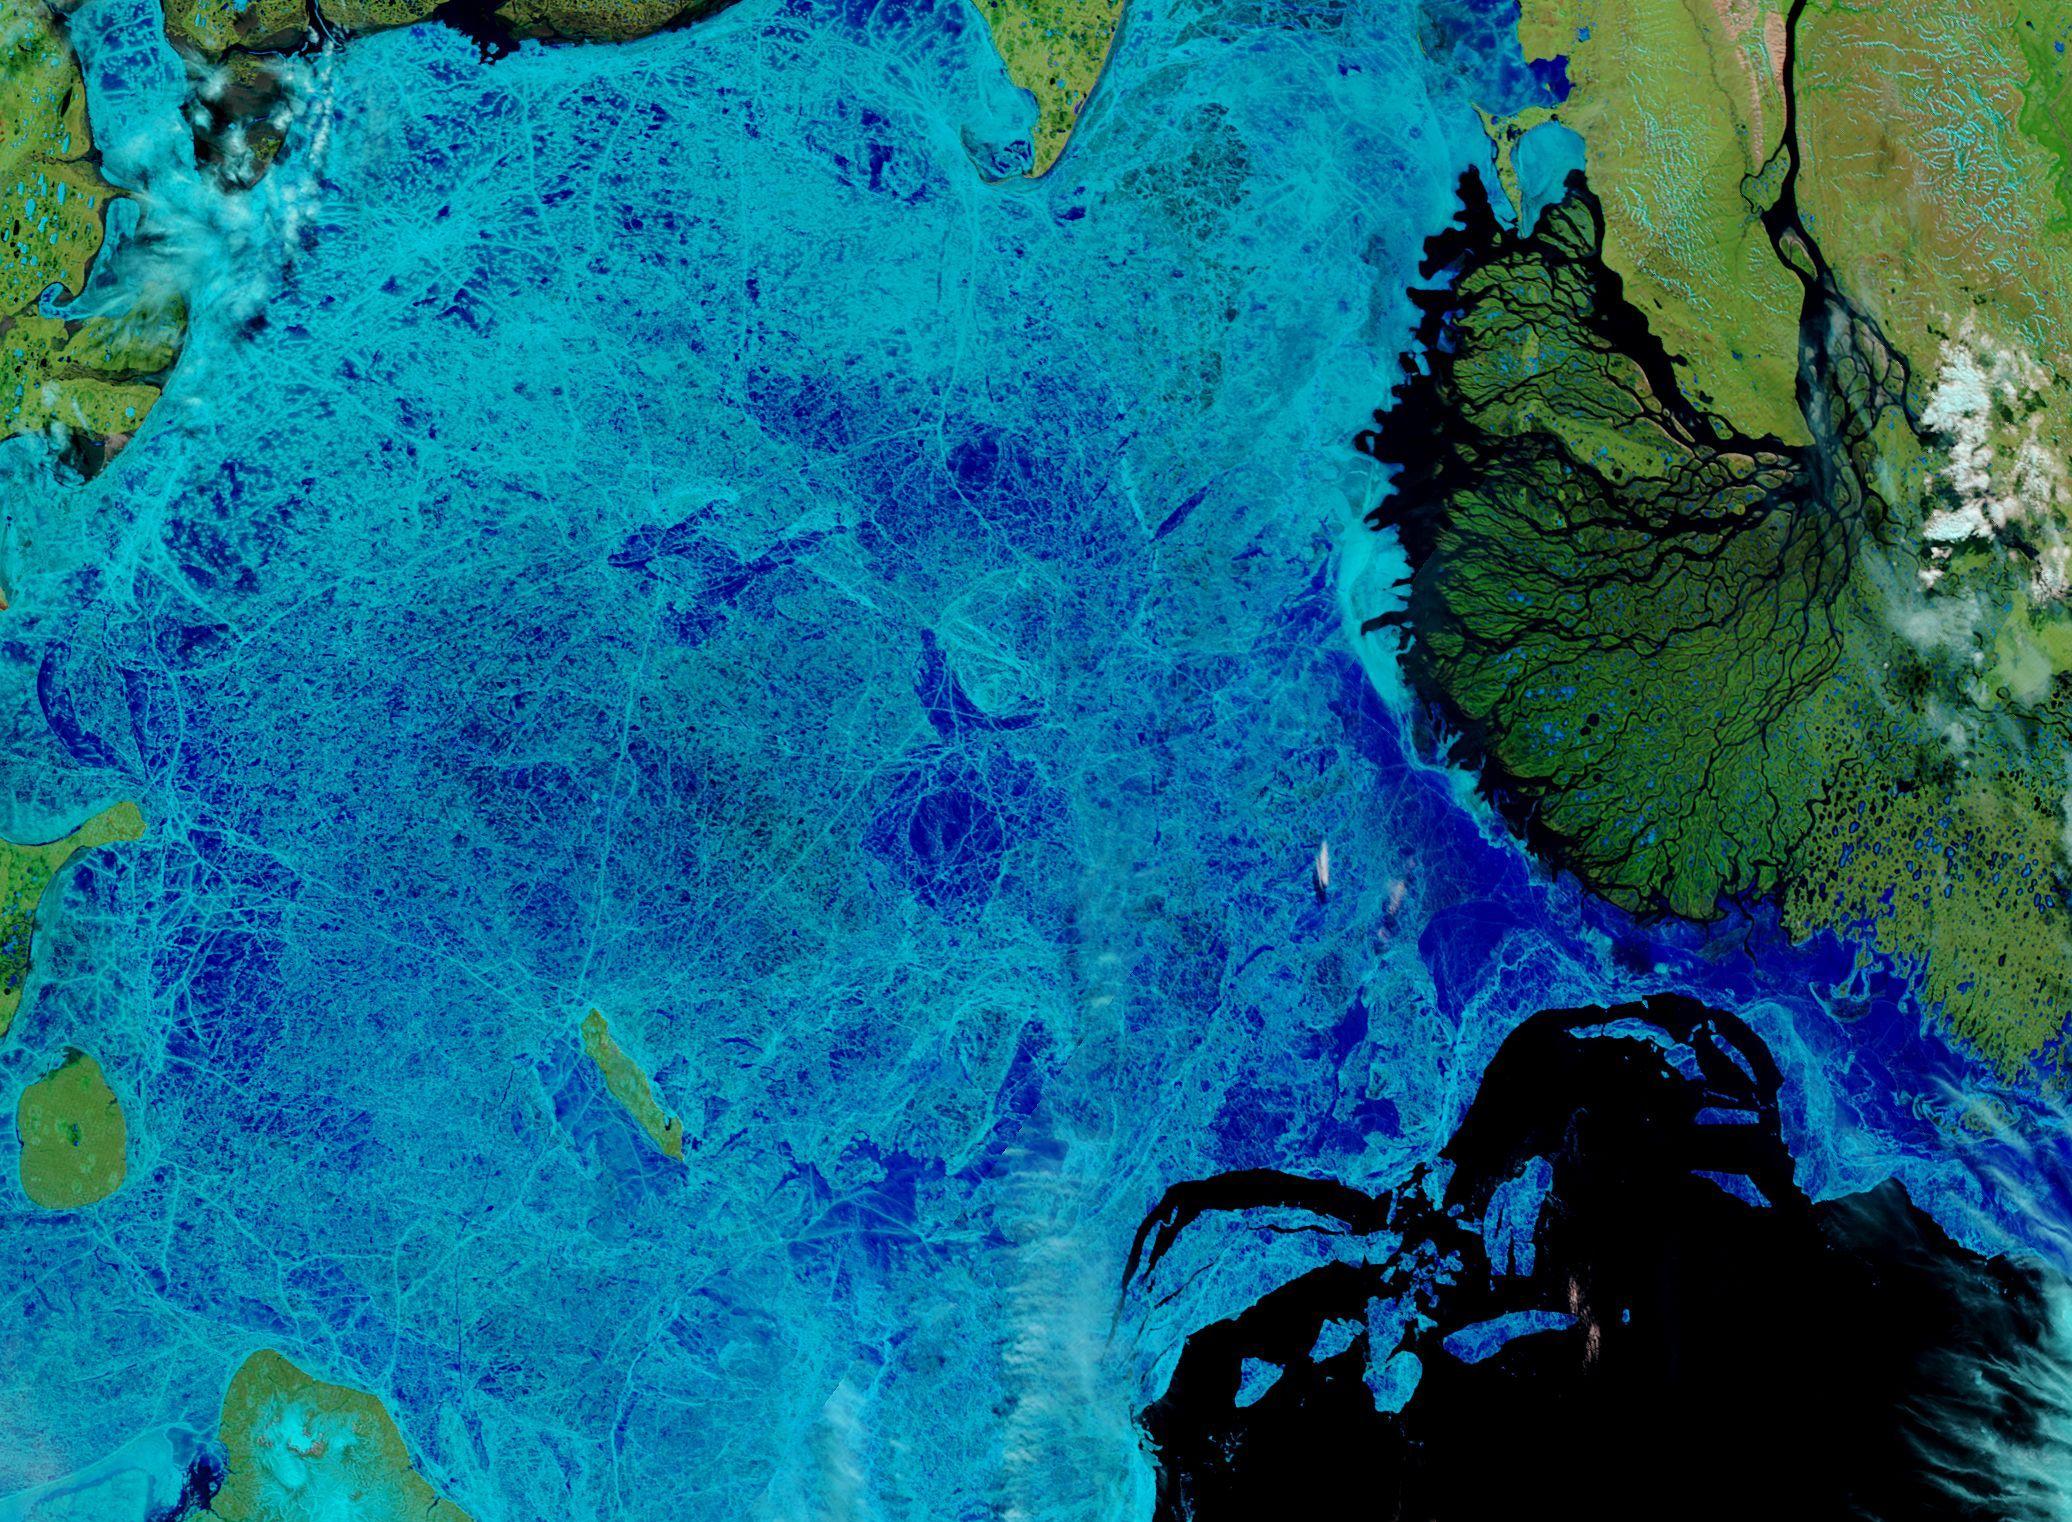
The sea ice in the Laptev Sea is starting to break up:
NASA Worldview “false-color” image of the Laptev Sea on June 15th 2019, derived from the MODIS sensor on the Terra satellite
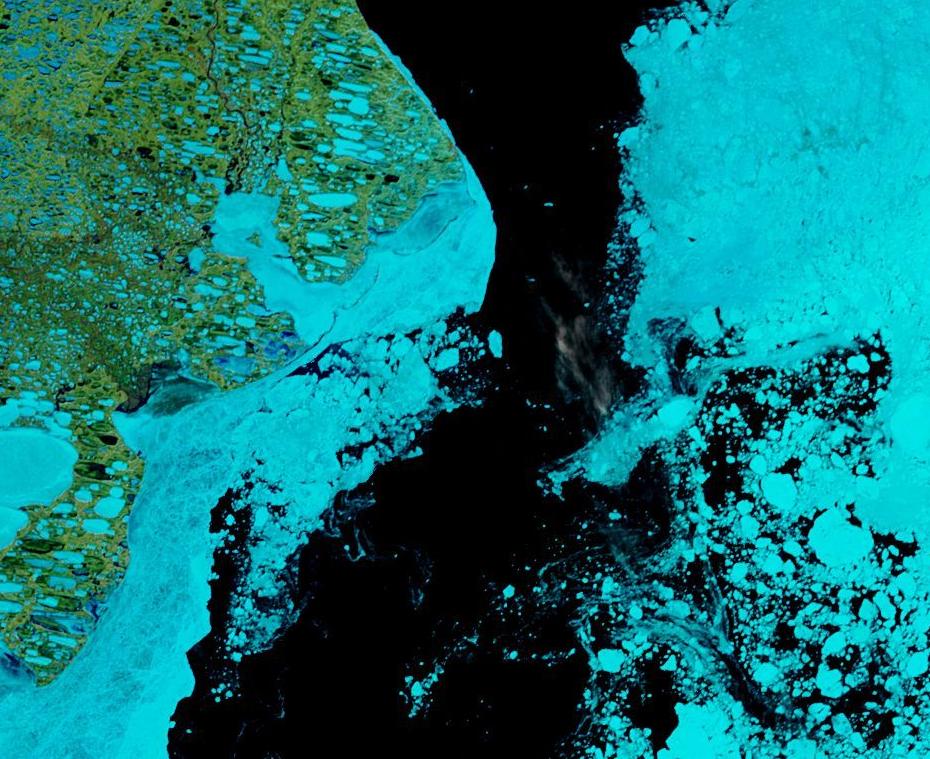
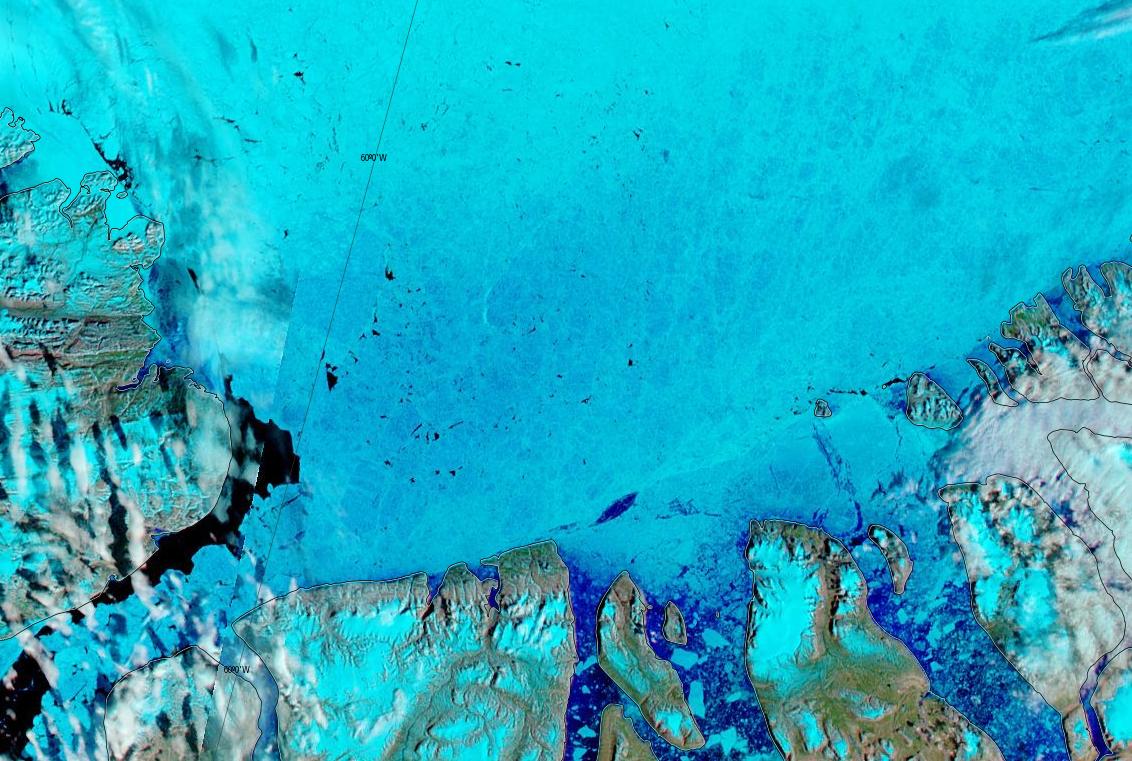
As is the fast ice in the Beaufort Sea:
NASA Worldview “false-color” image of the Beaufort Sea on June 14th 2019, derived from the MODIS sensor on the Terra satellite
Meanwhile the MSLP of the cyclone currently spinning over Severnaya Zemlya was down to 976 hPa at 06:00 UTC this morning:
NASA Worldview “false-color” image of the Kara Sea on June 15th 2019, derived from the MODIS sensor on the Terra satellite
Again, as in previous years, the spread in the dynamical models are larger compared with statistical models. Overall, the heuristic method has the lowest projected September sea-ice extent value with a median at 4.09 million square kilometers, and the dynamical models have the highest number with the median at 4.56 million square kilometers.
[Edit – June 23rd]
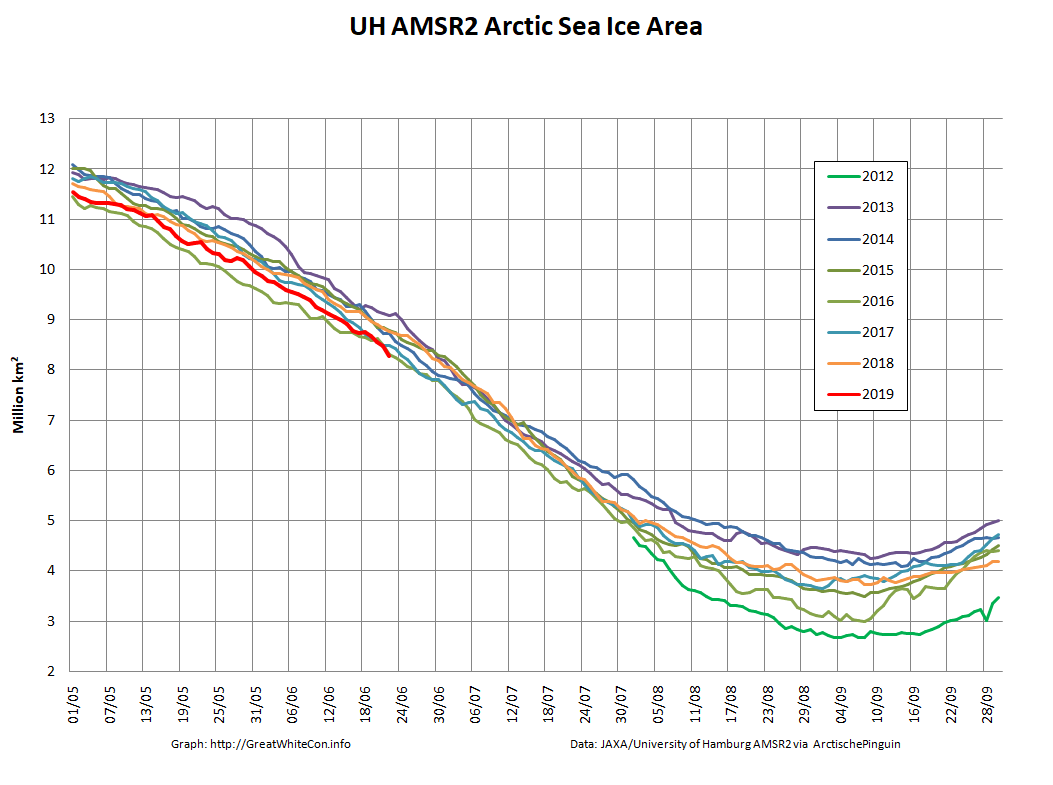
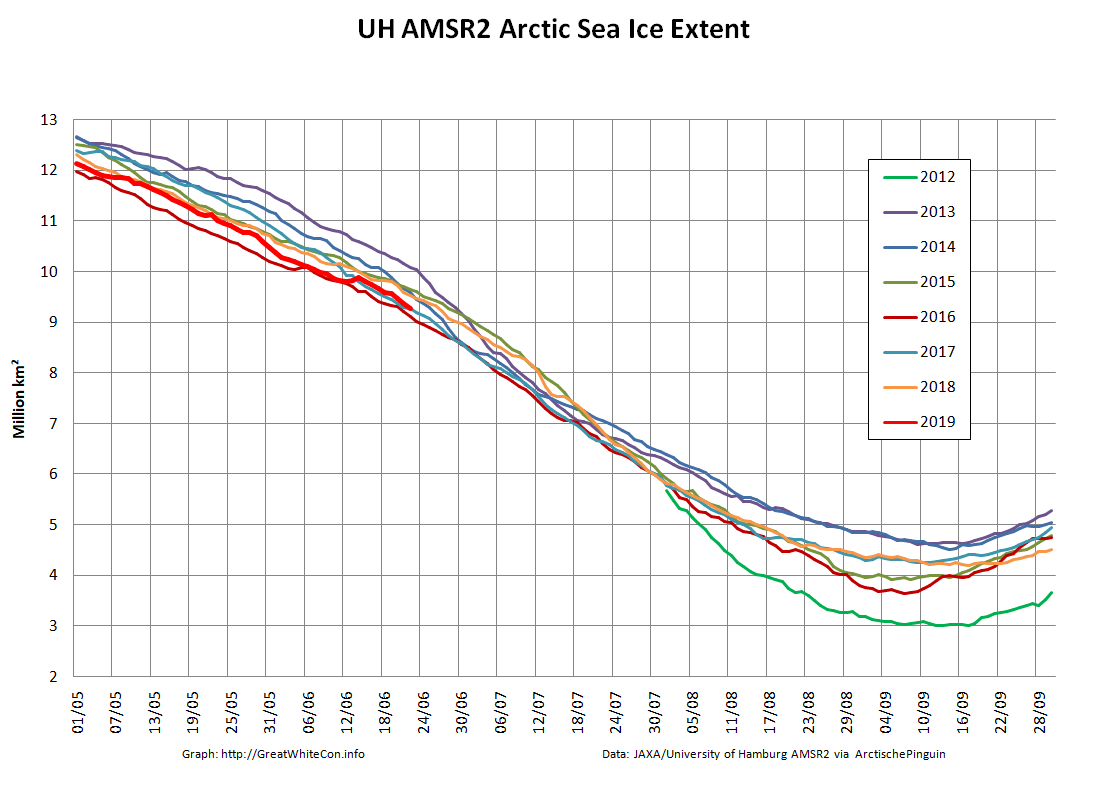
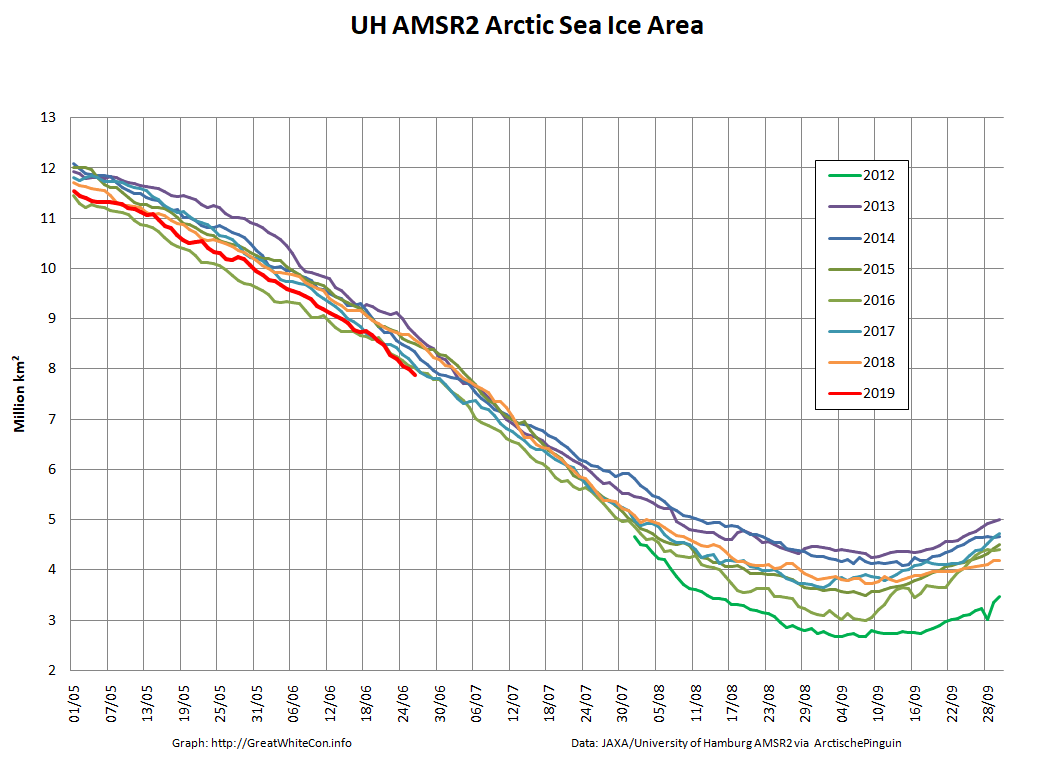
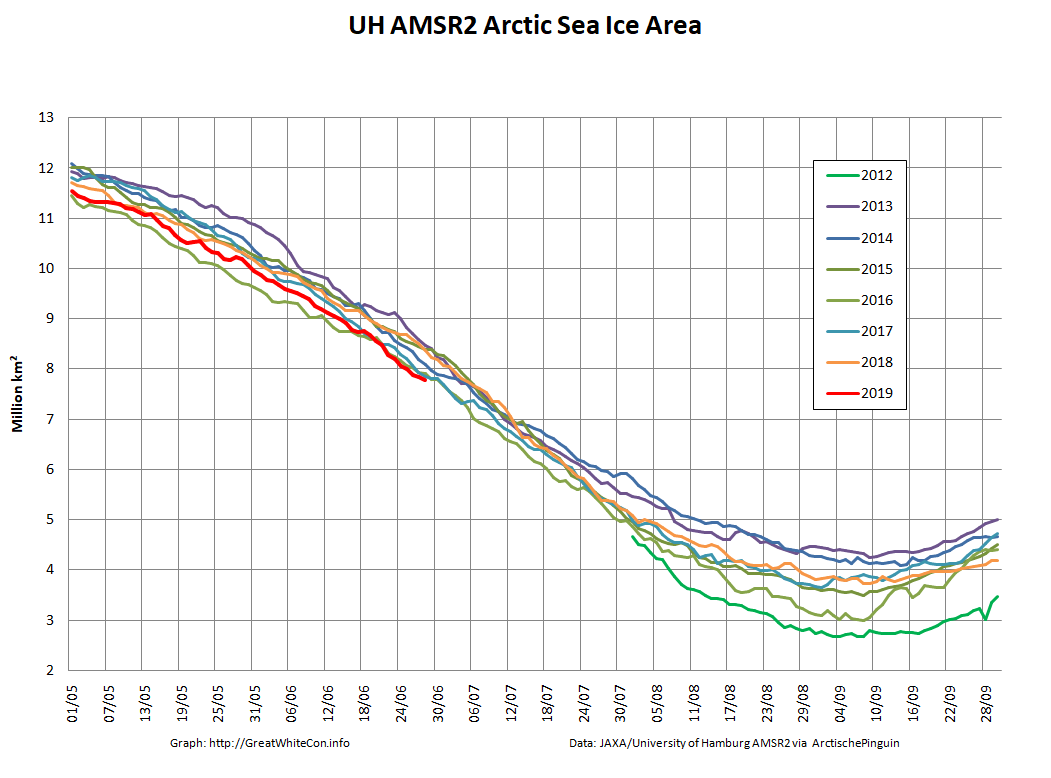
Arctic wide sea ice area is now lowest for the date in the high resolution AMSR2 record, although extent has yet to follow suit:
If you exclude the peripheral seas, which are all largely ice free by mid September in this day and age, the picture is extremely stark:
A brief glimpse through the clouds reveals that the North Pole is now starting to feel the recent heat:
NASA Worldview “false-color” image of the North Pole on June 22nd 2019, derived from the MODIS sensor on the Terra satellite
[Edit – June 27th]
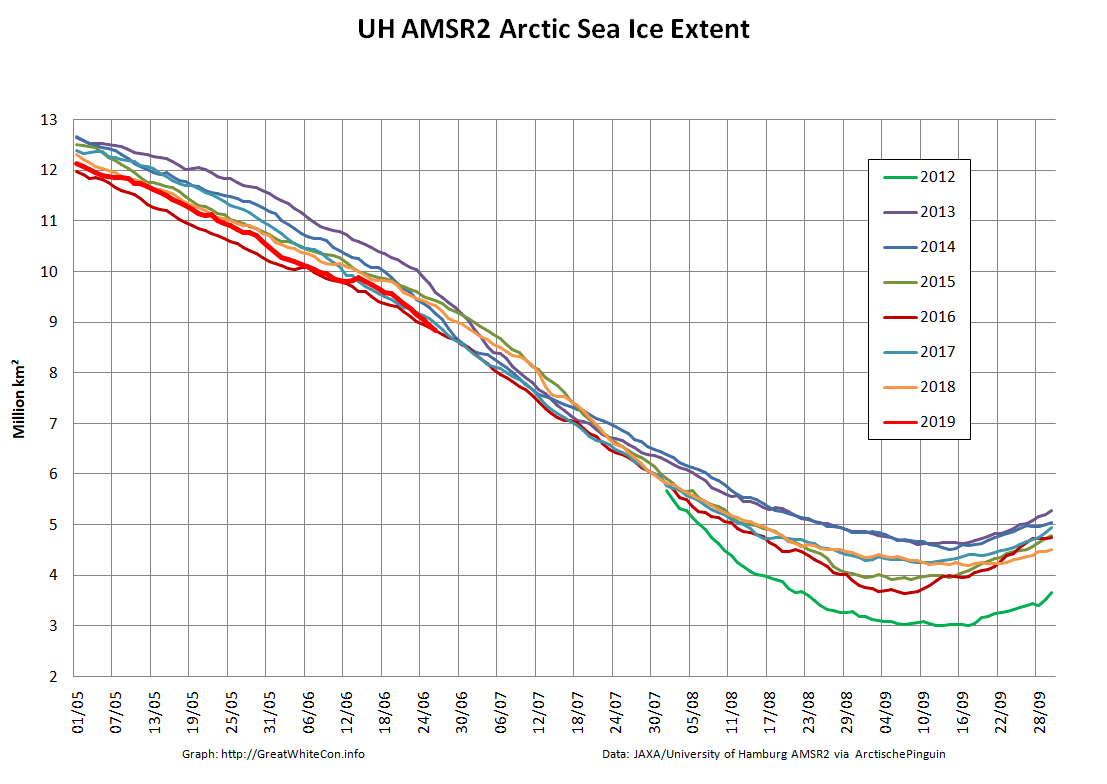
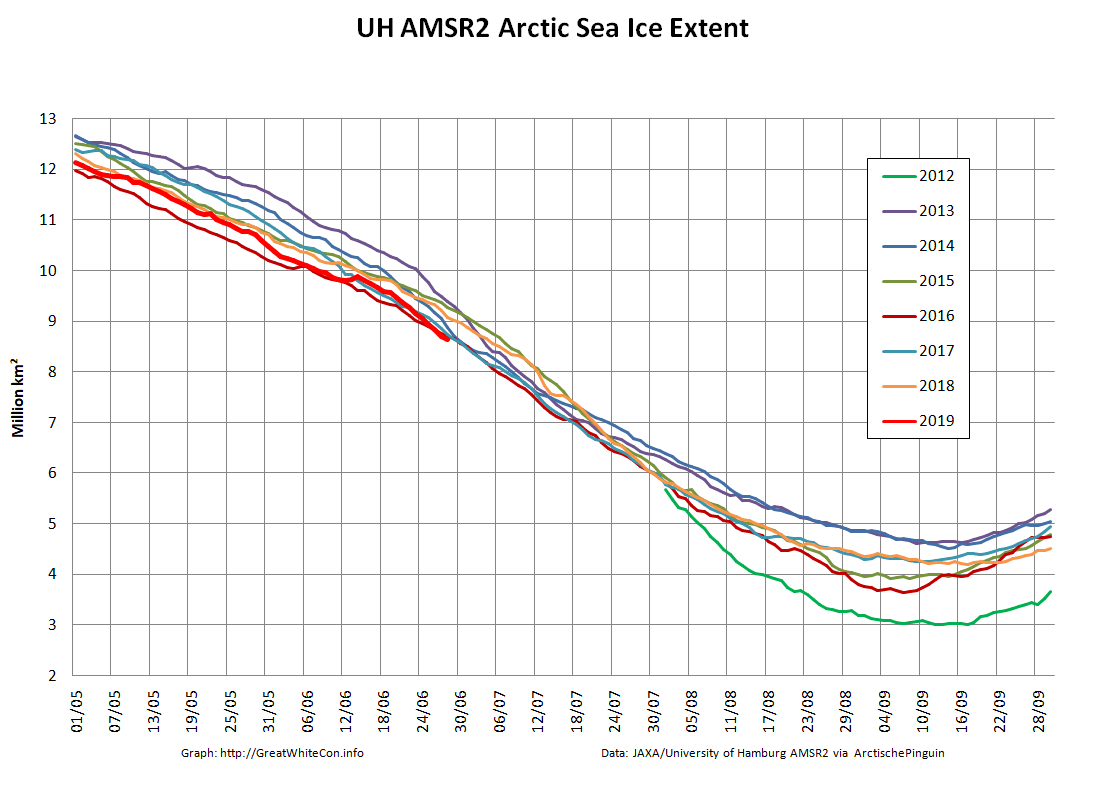
Arctic wide sea ice extent is now lowest for the date in the high resolution AMSR2 record:
Here’s Arctic wide sea ice area, which is still well below the rest of the pack:
[Edit – June 29th]
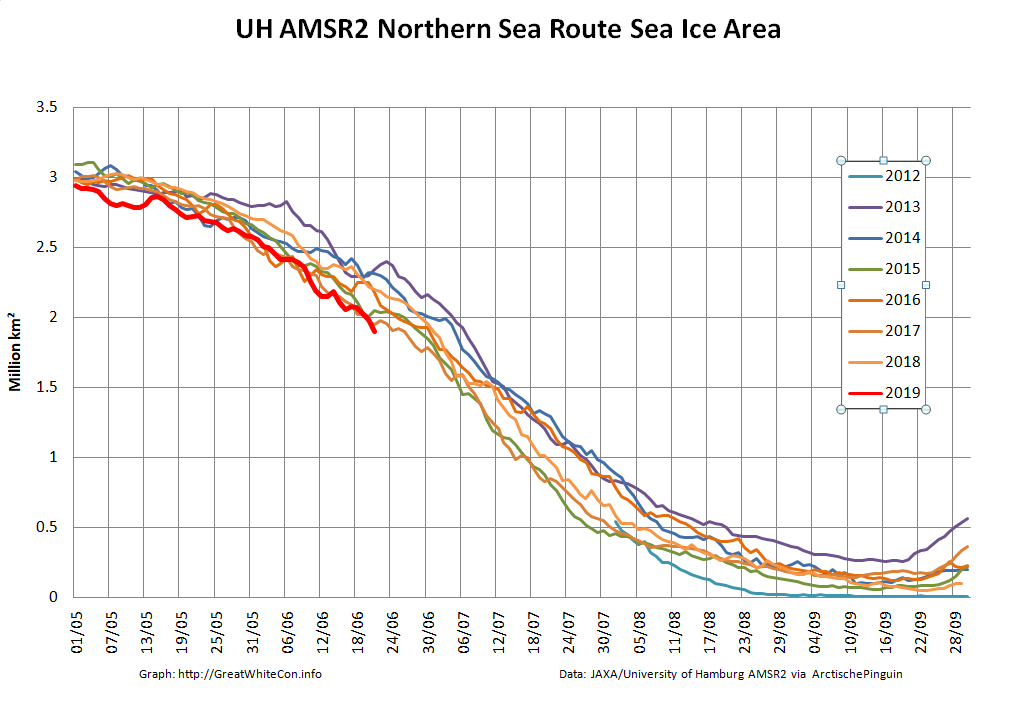
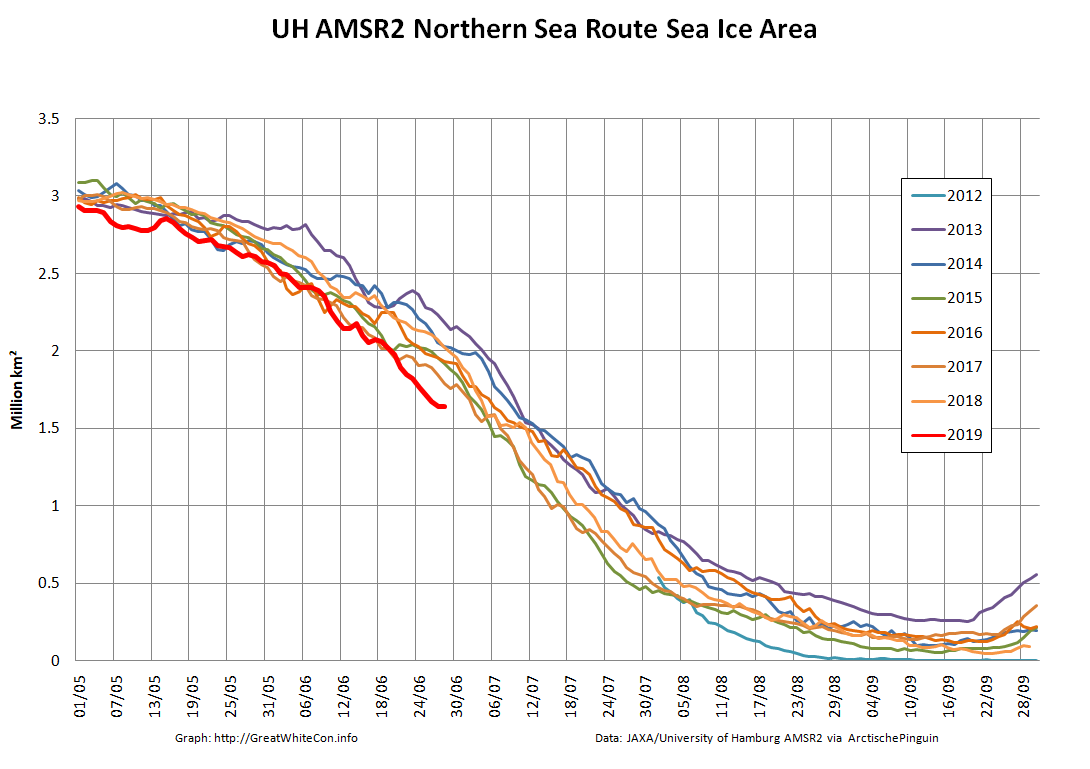
As the end of the month draws near let’s take a look at sea ice area along a couple of the famous sea routes above the Arctic Circle. First of all here’s the Northern Sea Route, comprising the Kara, Laptev, East Siberian and Chukchi Seas:
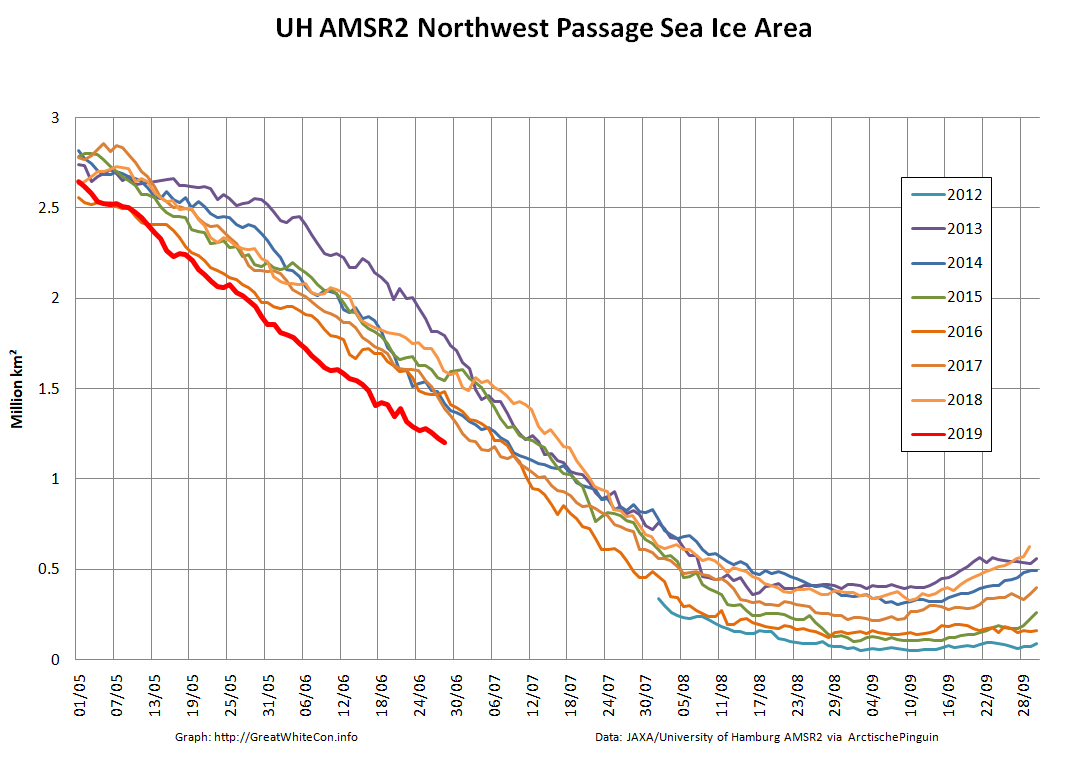
Next here’s the Northwest Passage, comprising the Chukchi and Beaufort Seas plus the channels of the Canadian Arctic Archipelago and Baffin Bay:
For completeness here too are the current Arctic wide area and extent numbers:
Our title for today refers back to the Great Arctic Cyclone of August 2012. There has been some speculation over on the Arctic Sea Ice Blog about whether a similar event is about to occur this year.
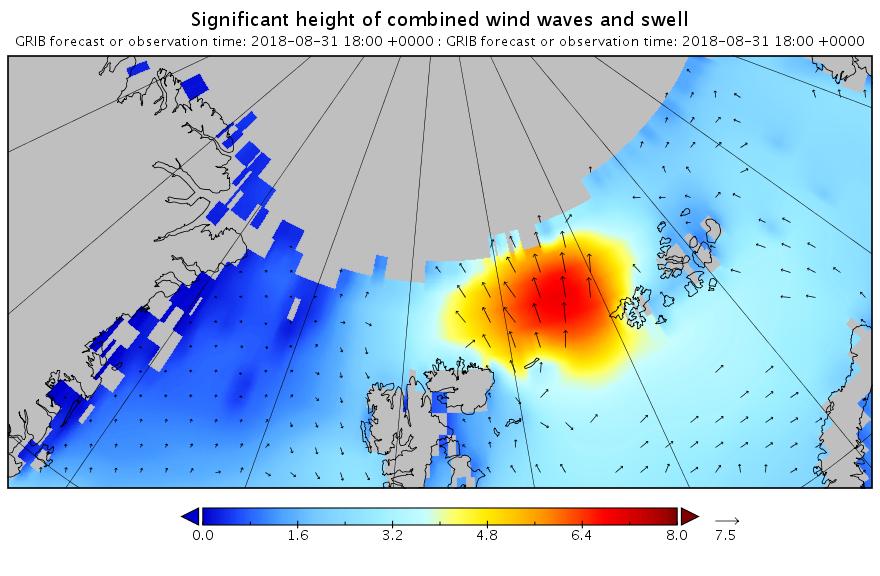
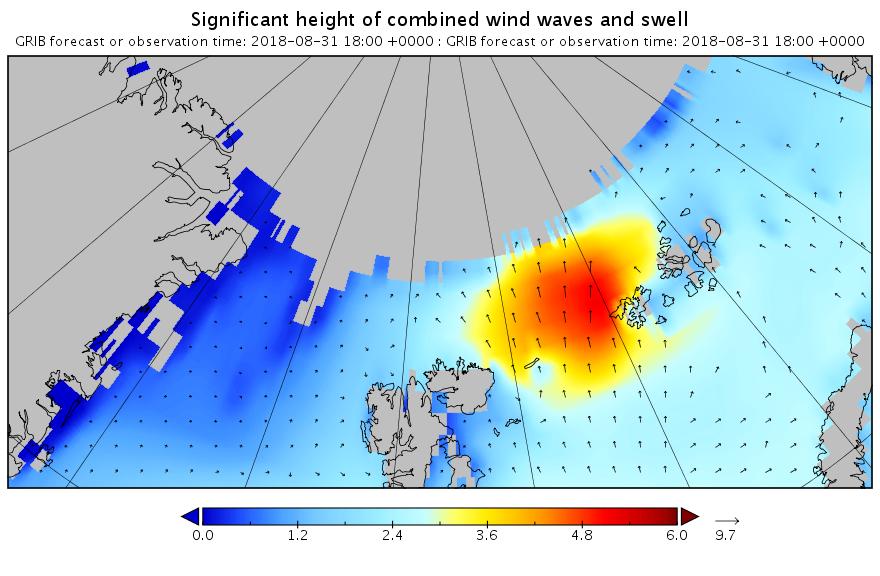
It’s later in the season of course, but as is our wont we always look at the waves first. Here is the current WaveWatch III forecast for the evening of August 31st UTC:
In summary the forecast shows some very large waves with a substantial period for inside the Arctic Circle directed straight at the ice edge. Let’s follow the forecast over the next few days carefully shall we?
[Edit – August 30th]
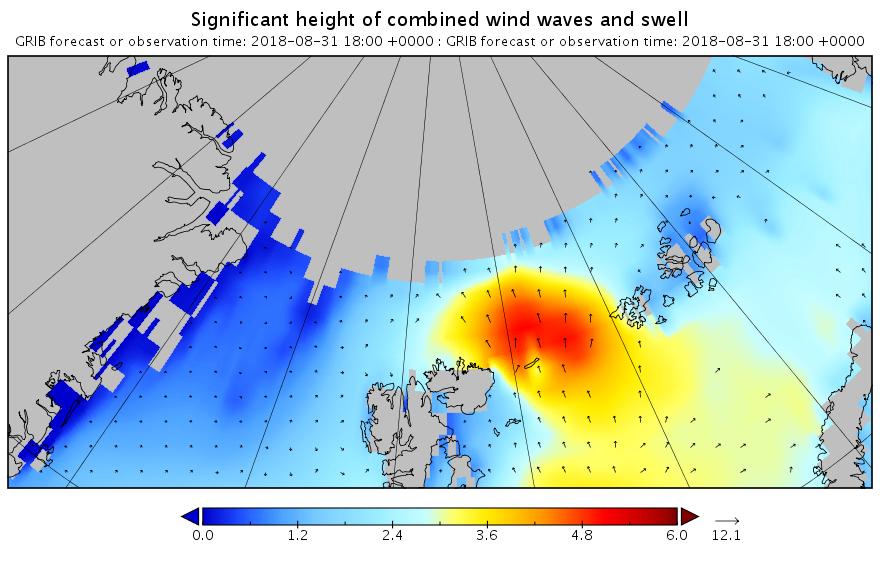
The latest wave forecast for tomorrow evening isn’t as extreme as 3 days ago. Note the change in the significant height scale:
Nonetheless the height and period are still very significant!
[Edit – August 31st]
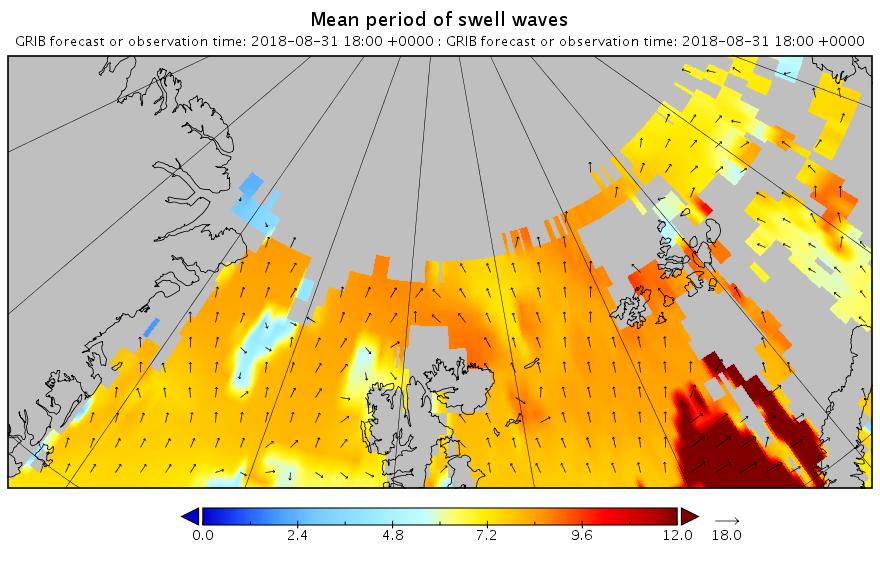
Here’s the latest forecast for 6 PM this evening (UTC):
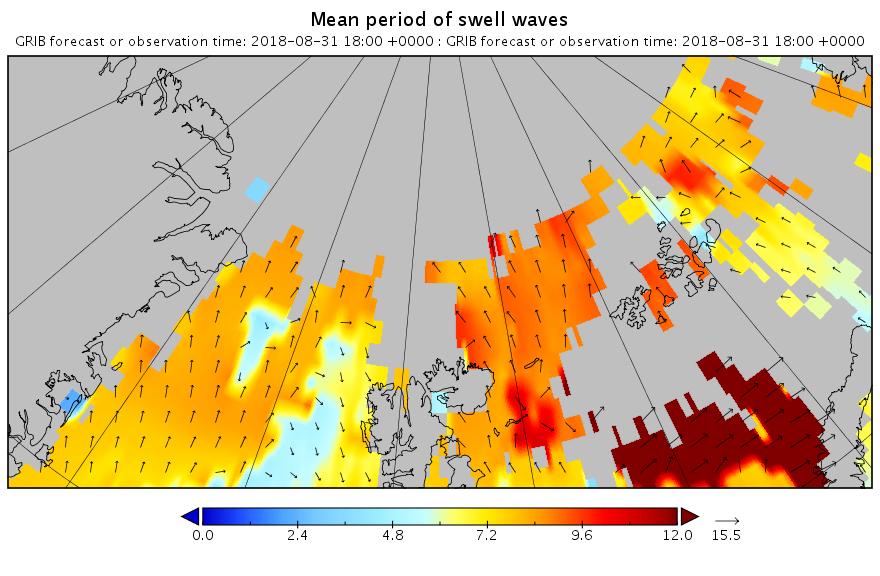
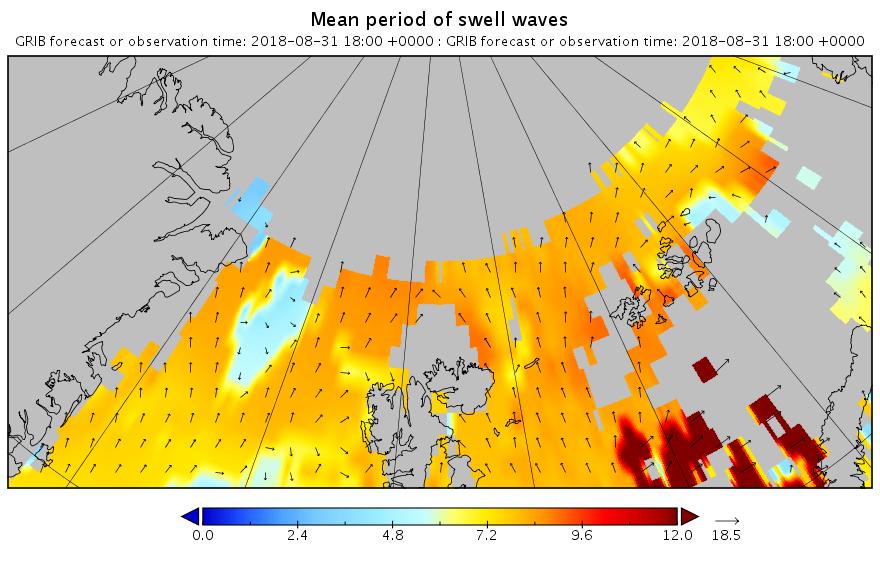
Note how the open water across almost the entire map is full of what in the Arctic counts as a long period swell. That means that the forecast for 2 days later looks like this:
Less height but with a longer period. All of which means that the sea ice north of the Atlantic Ocean isn’t about to receive a short sharp shock. It has a sustained battering lasting several days to look forward to.
[Edit – September 1st]
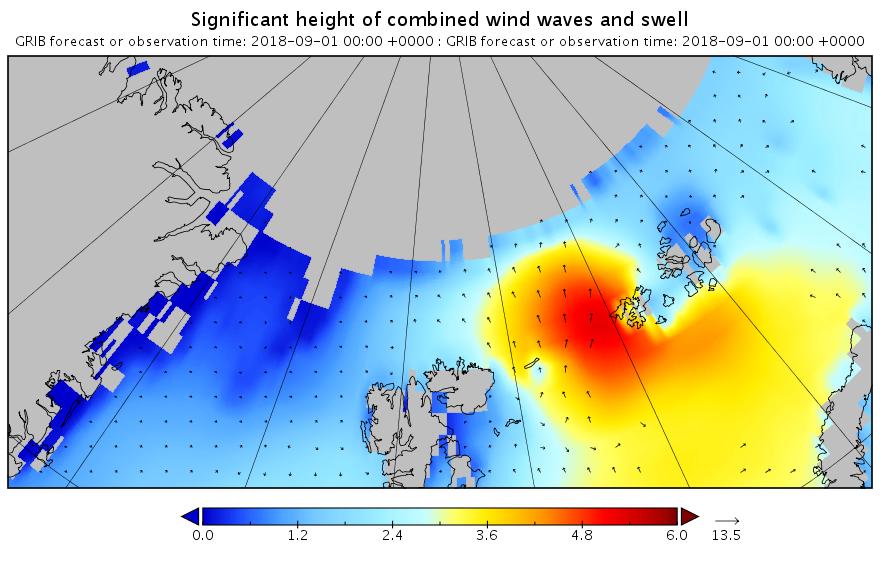
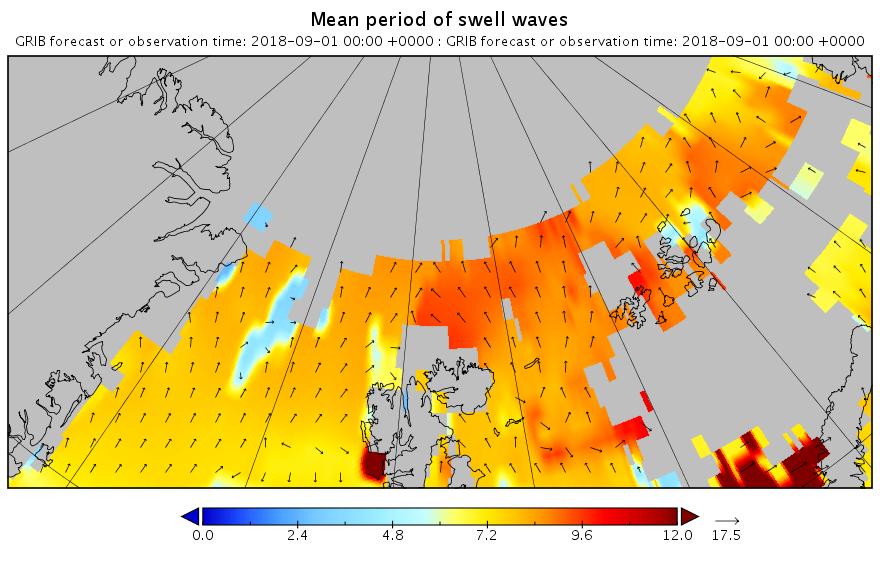
The barrage of assorted swells has begun. Here’s the “hindcast” from midnight last night UTC:
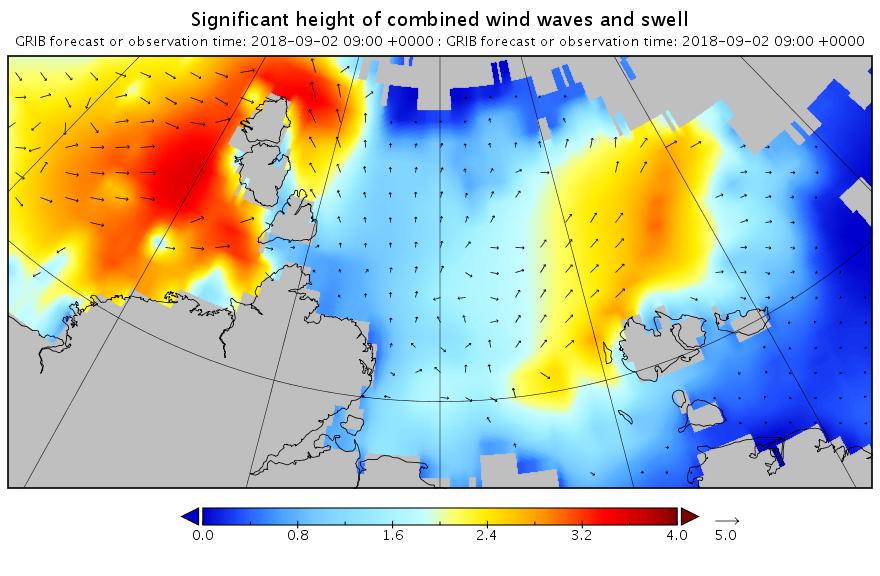
Now lets take a look at tomorrow’s forecast for the Laptev Sea. This is for 09:00 UTC:
Note once again the change of scale on the wave/swell height map. Nevertheless a 3+ meter swell heading over into the East Siberian Sea isn’t something you see every day.
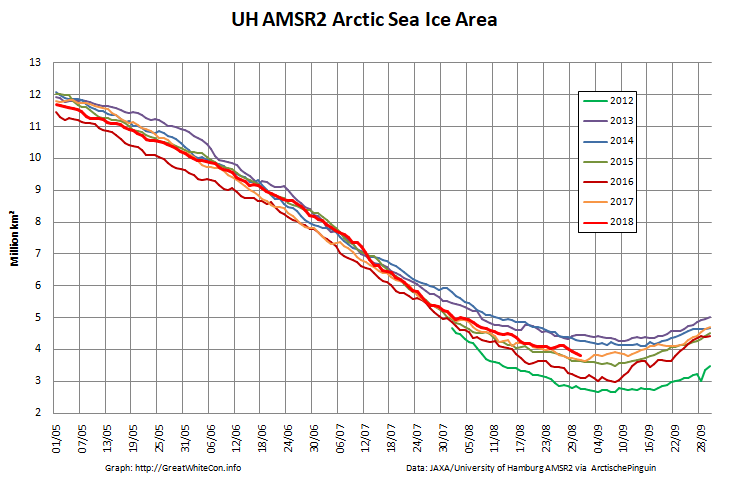
Now were into September the 2018 annual minimum extent can’t be too far away. Extent decline appears to have stalled. However “high res” AMSR2 area is currently falling fast, for the time of year at least:
[Edit – September 2nd]
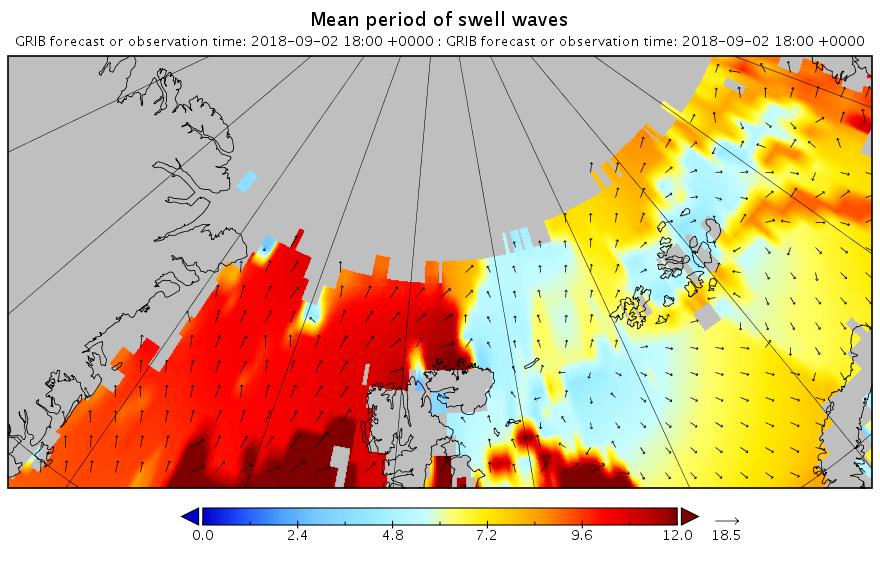
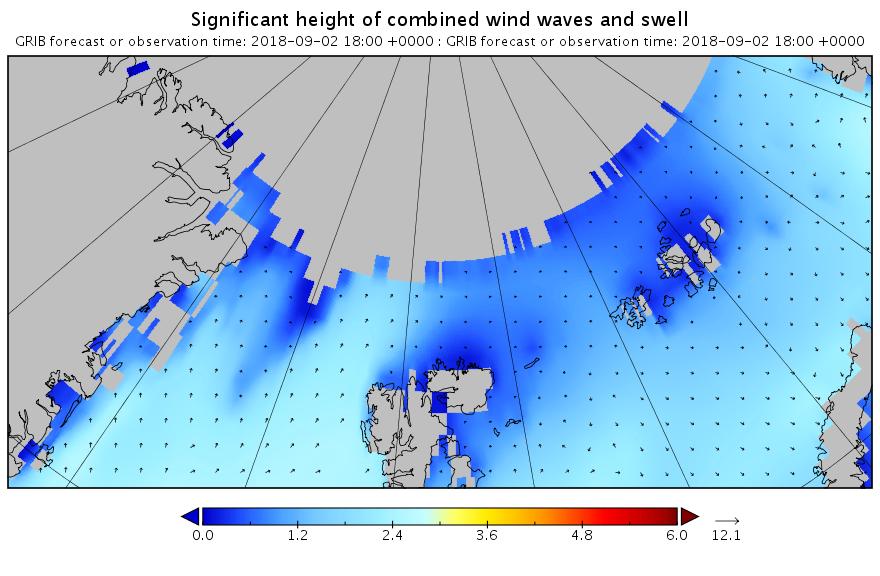
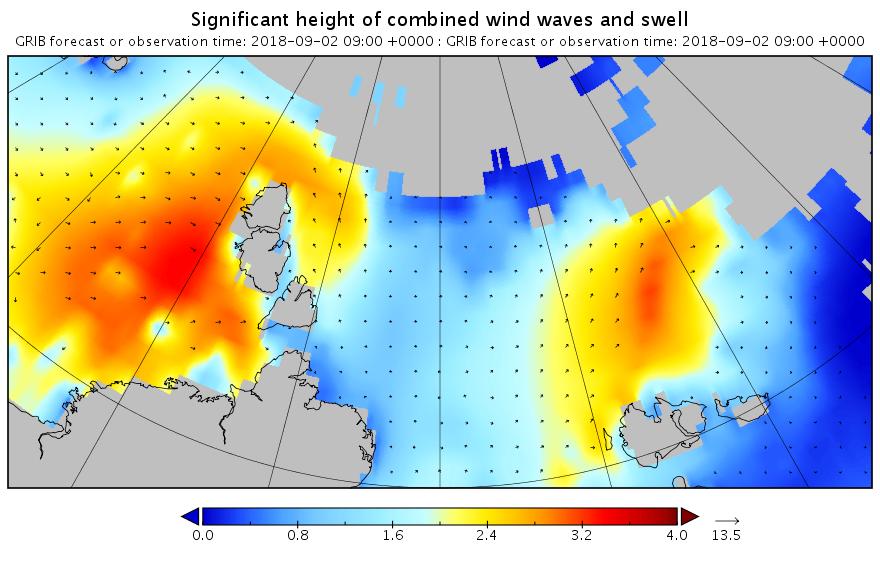
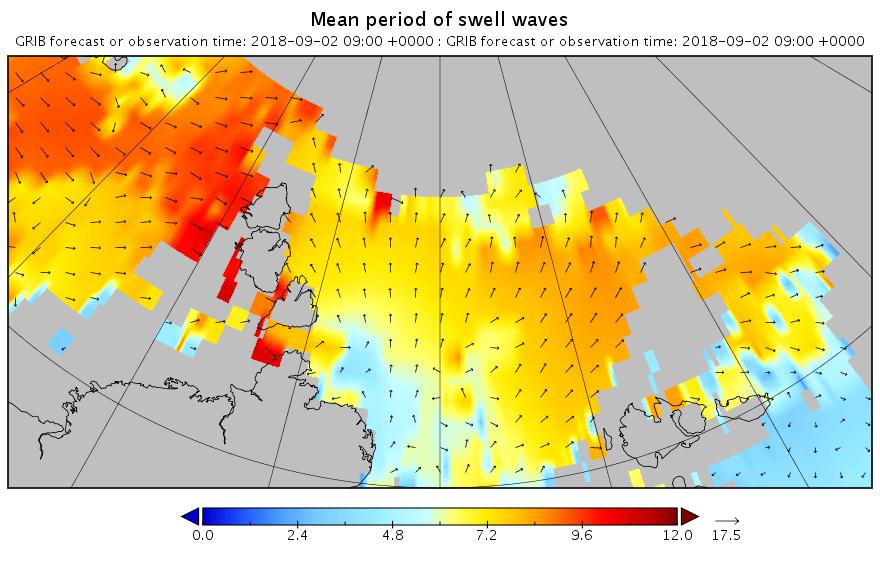
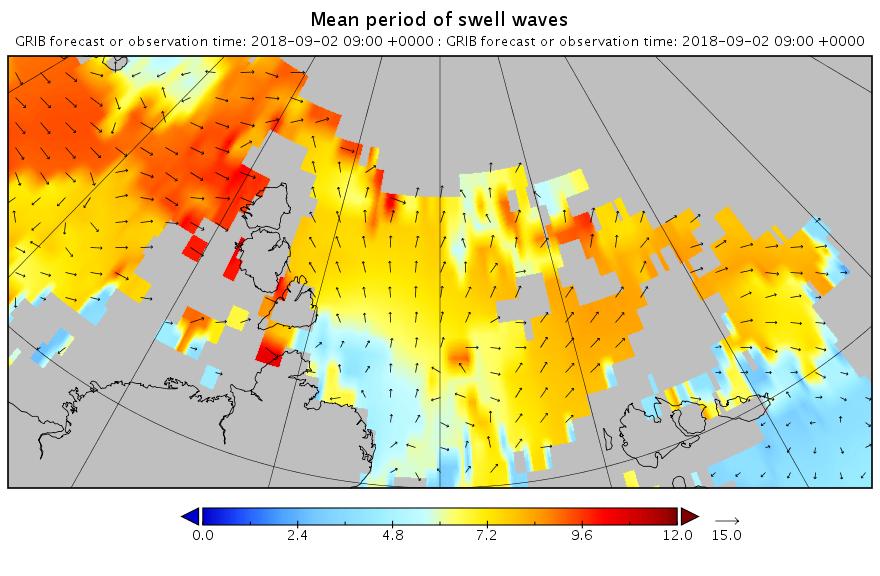
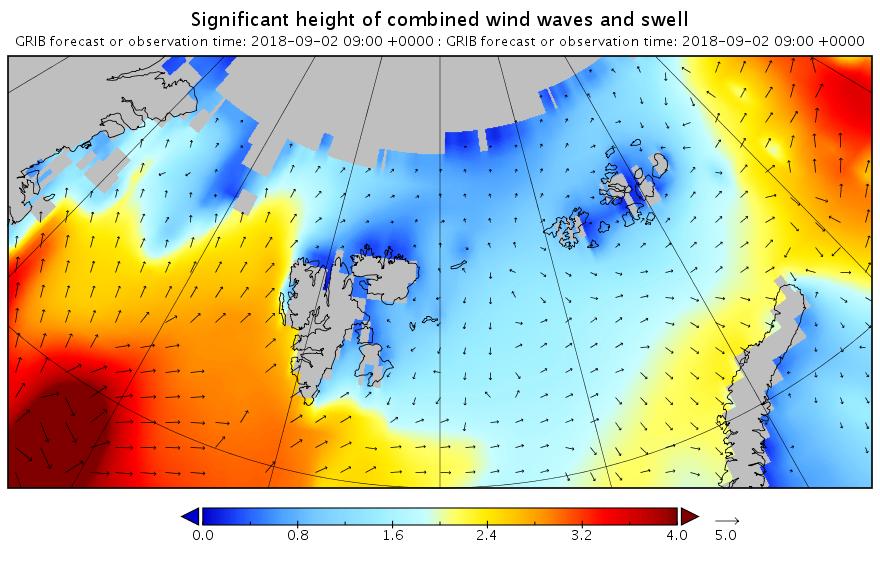
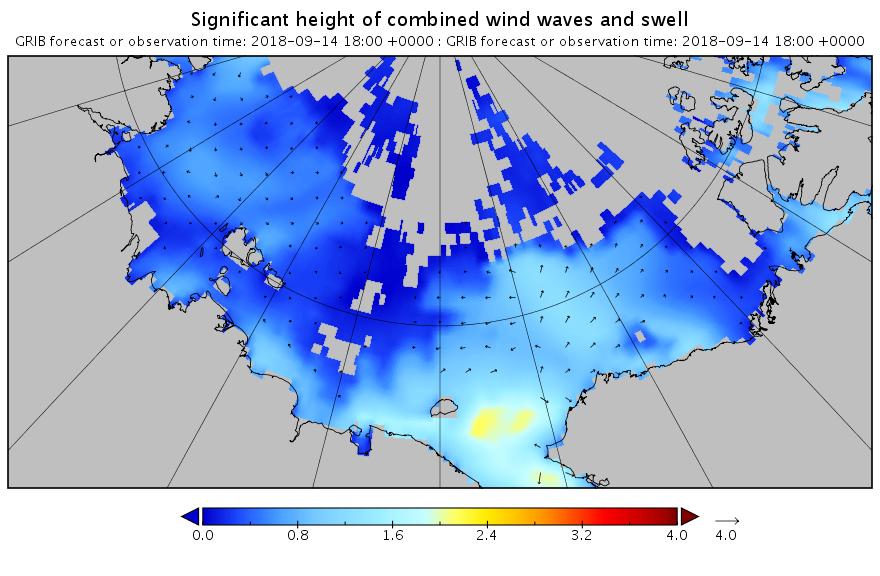
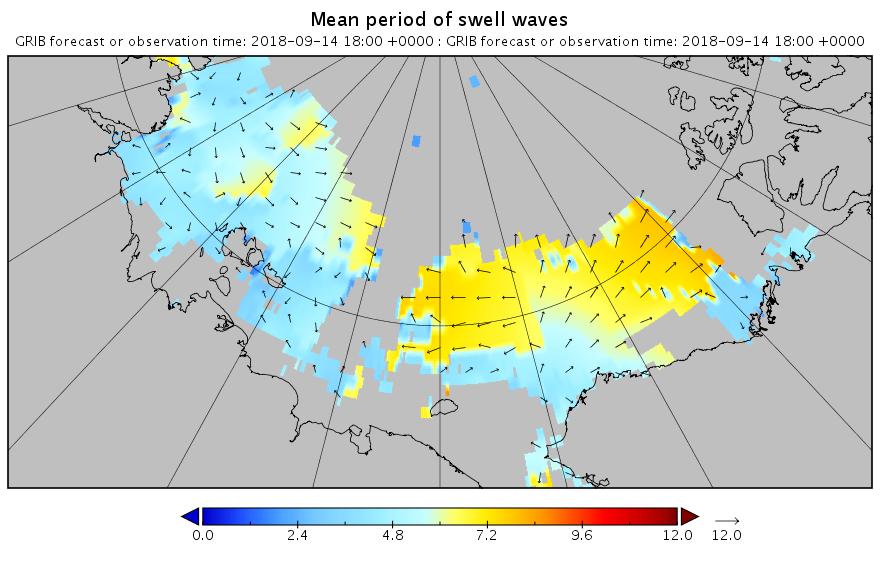
Here are the swell and period forecasts at midnight for round about now, 09:00 UTC:
All the seas between Greenland and the New Siberian Islands are awash with swells with a period of 8 second or greater. This is most unusual, to put it mildly!
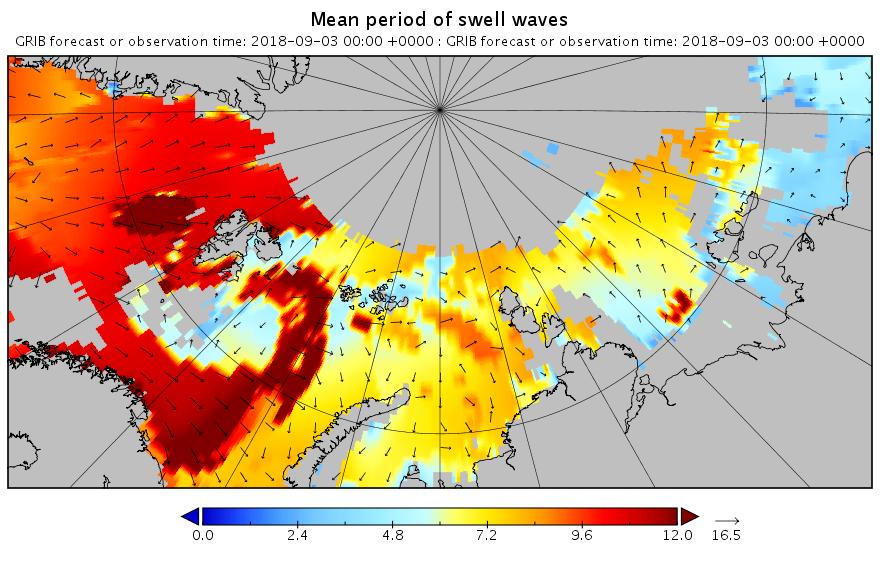
[Edit – September 3rd]
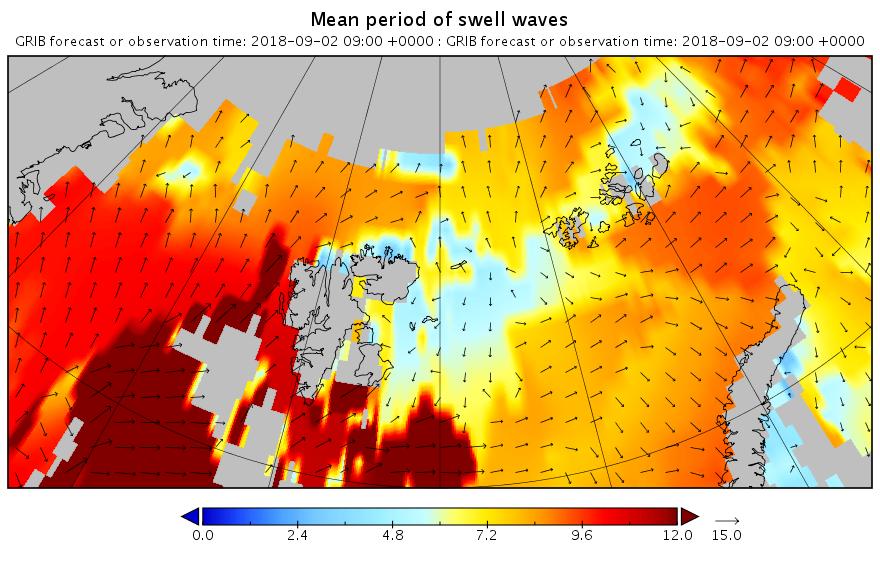
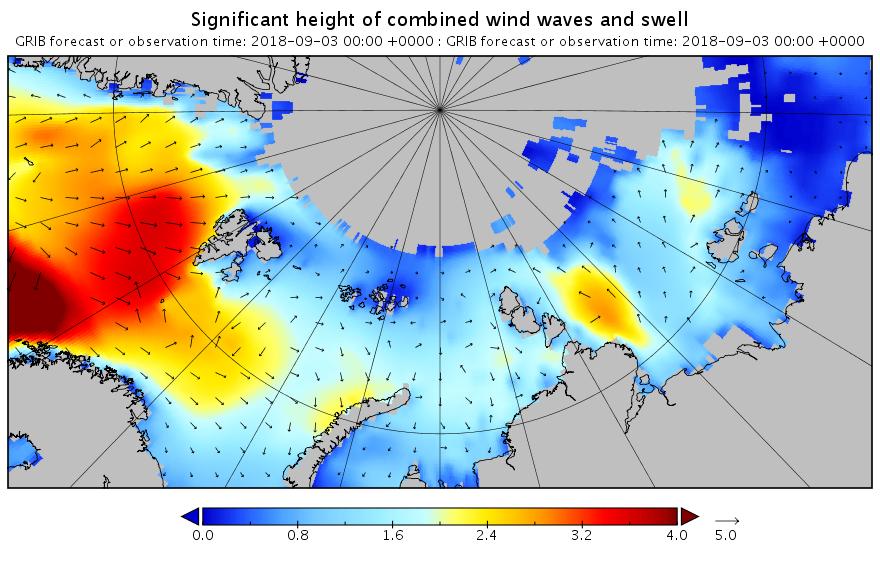
Here’s the WaveWatch III “hindcast” from midnight last night UTC for the Russian side of the Arctic Ocean:
There are still significant swells almost everywhere you look.
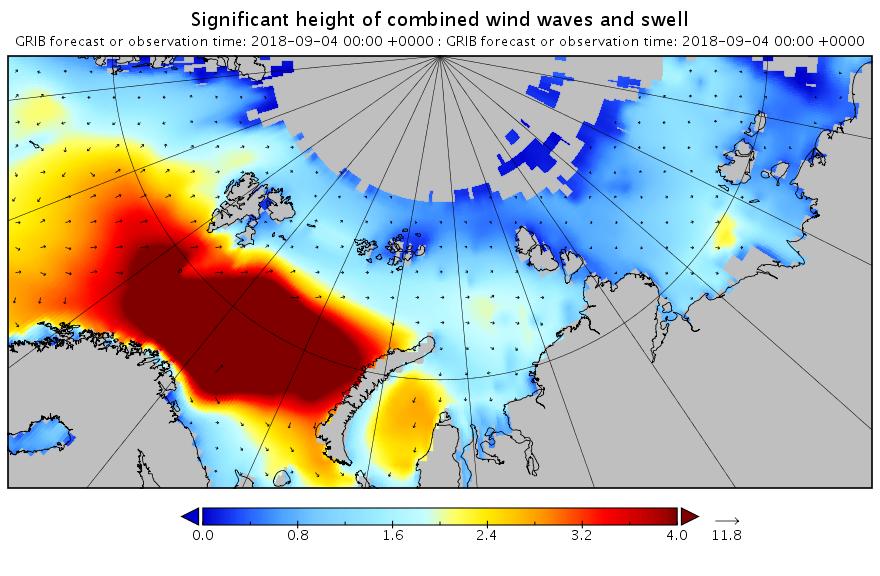
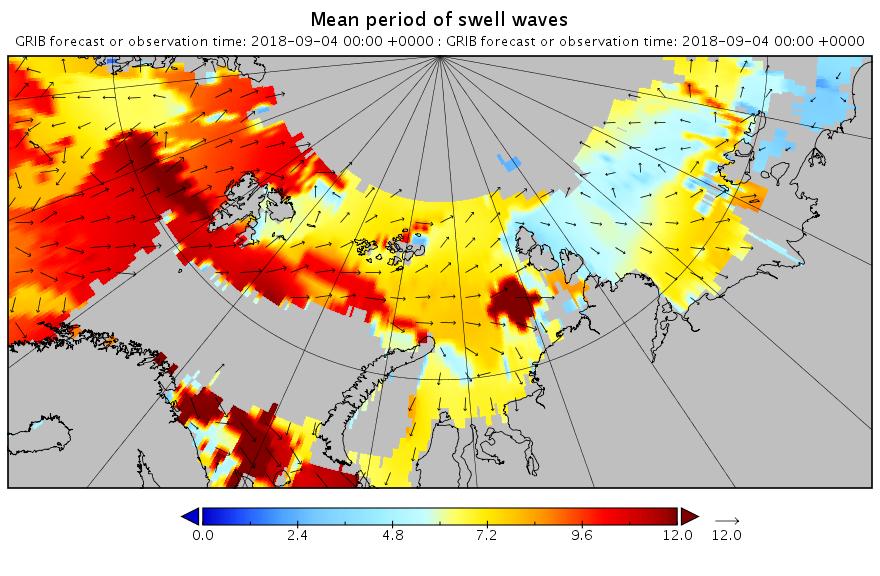
[Edit – September 4th]
Using the same scales as yesterday, here’s today’s hindcast from midnight:
There’s still plenty of action in the Arctic Ocean!
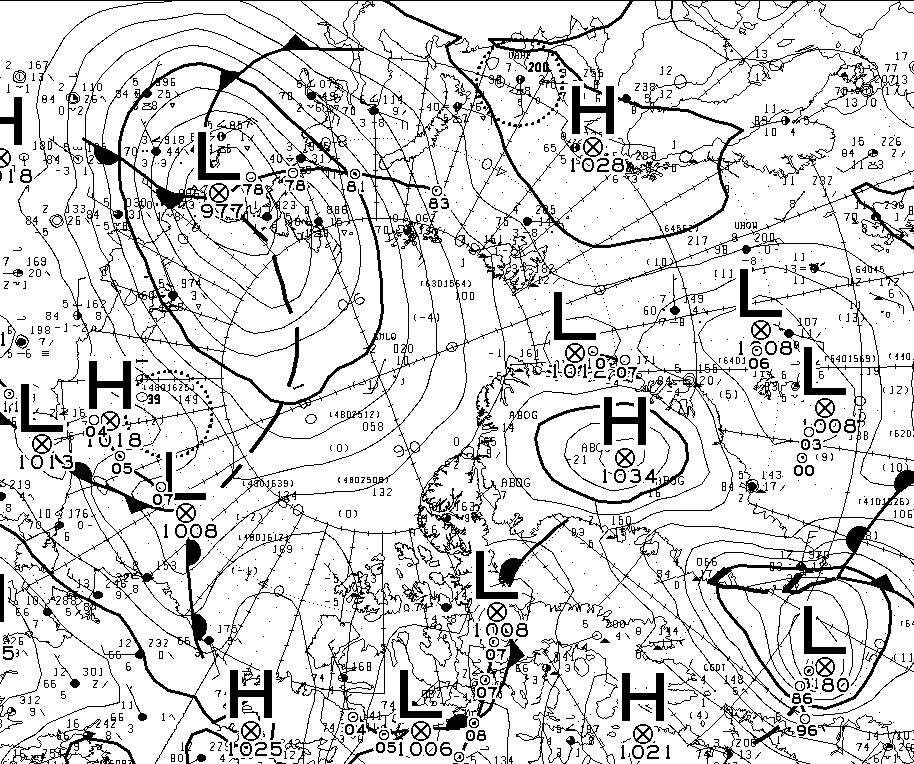
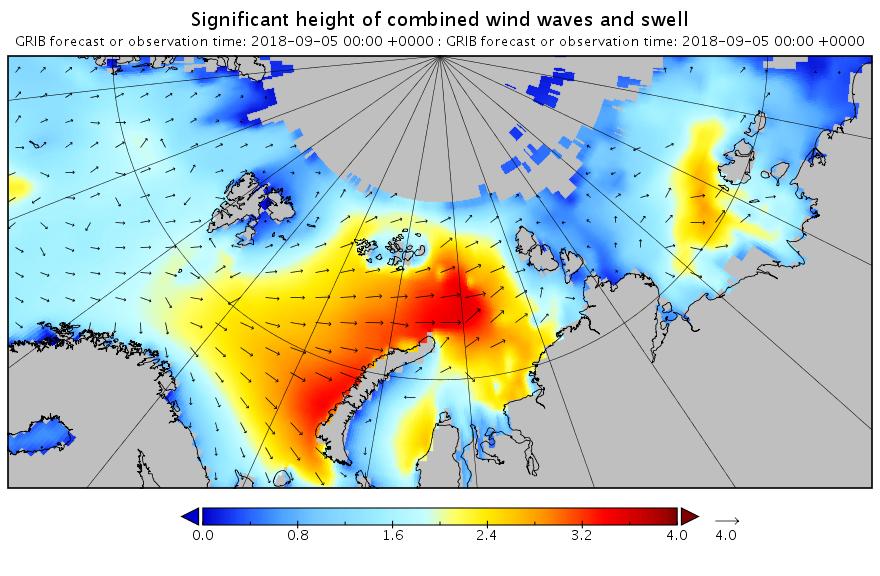
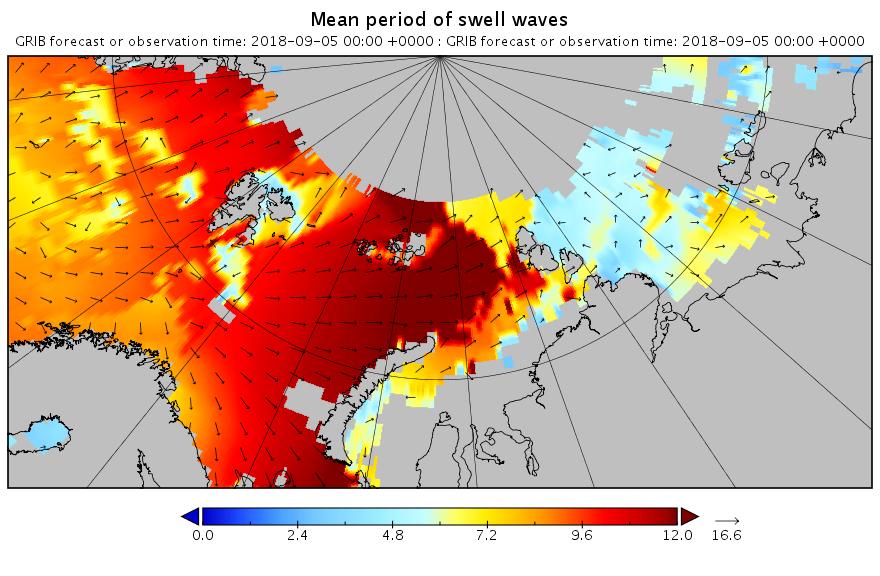
[Edit – September 5th]
Feel free to debate whether it merits the “Great” prefix, but this is how the early September 2018 Arctic cyclone has panned out. According to this morning’s Environment Canada synopsis the cyclone is centred near the coast of the Laptev Sea and is down to a MSLP of 977 hPa:
Here’s another WaveWatch III hindcast from midnight UTC:
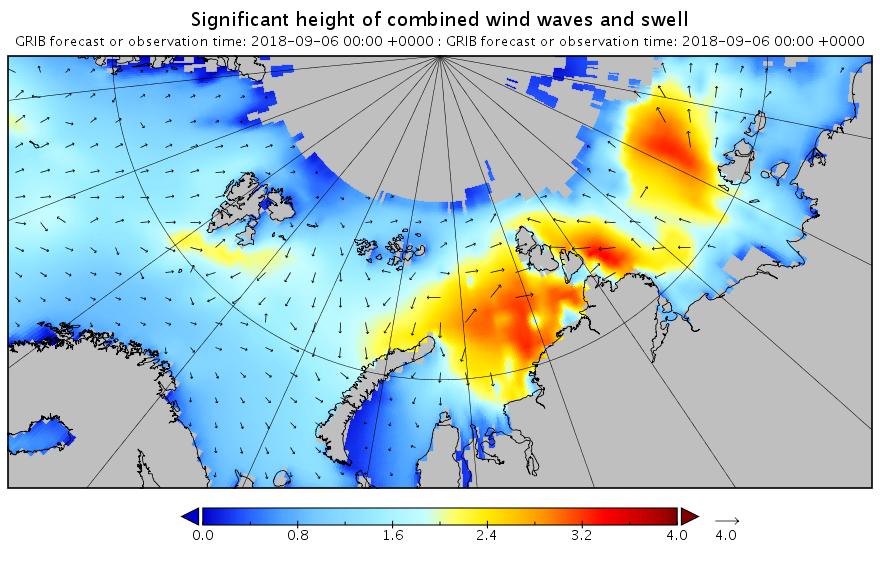
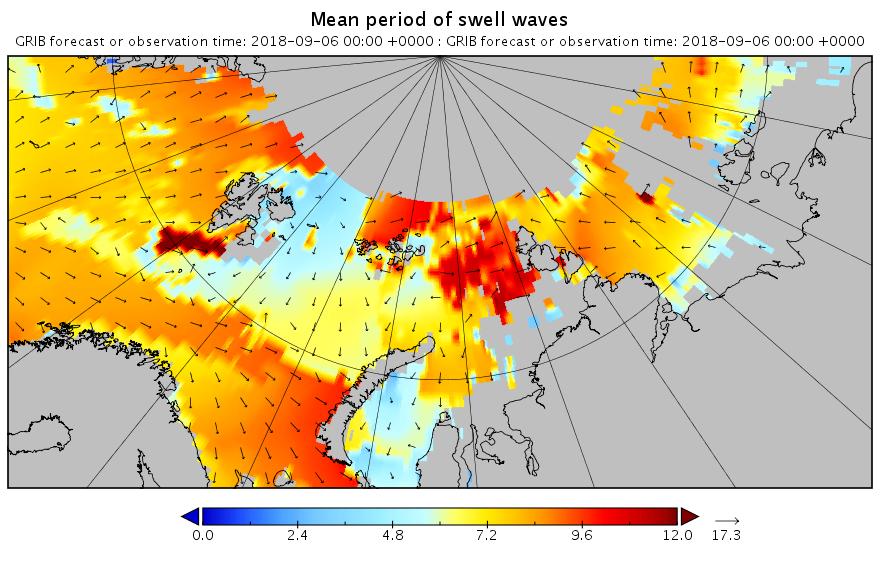
[Edit – September 6th]
Need I say more?
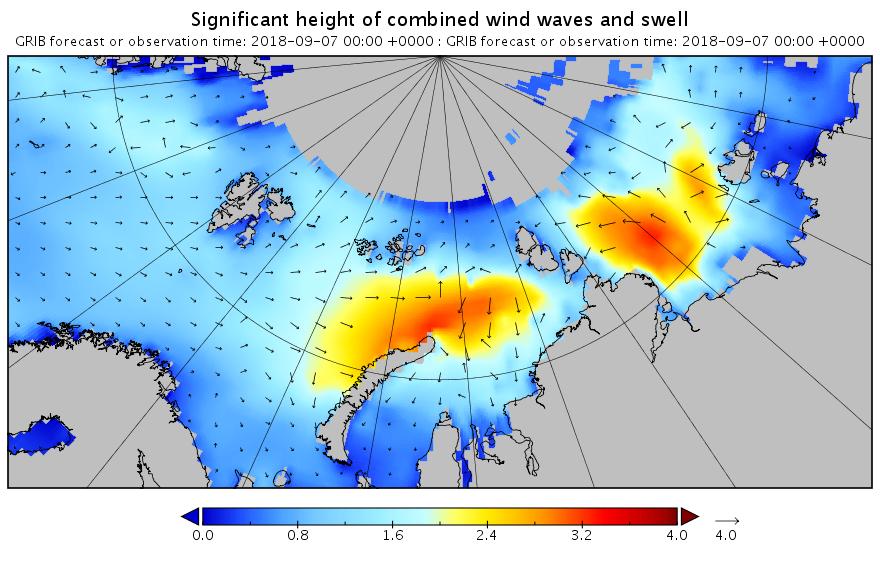
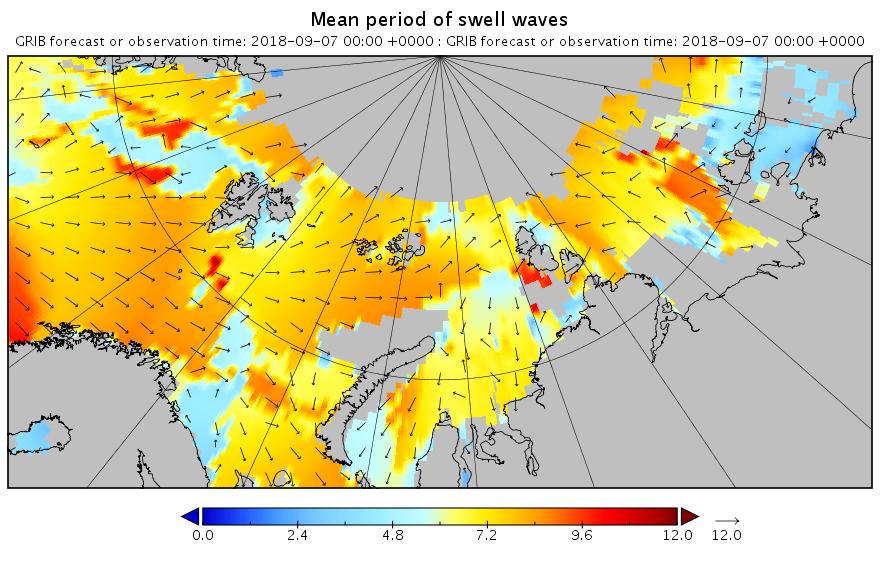
[Edit – September 7th]
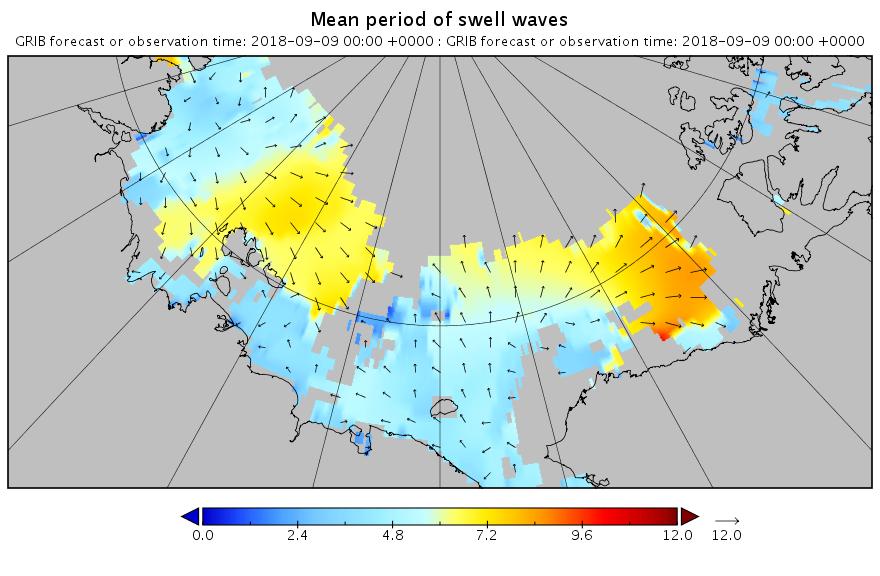
The swell in the Fram Strait an Barents Sea is diminishing, but the period in the Laptev Sea is increasing now:
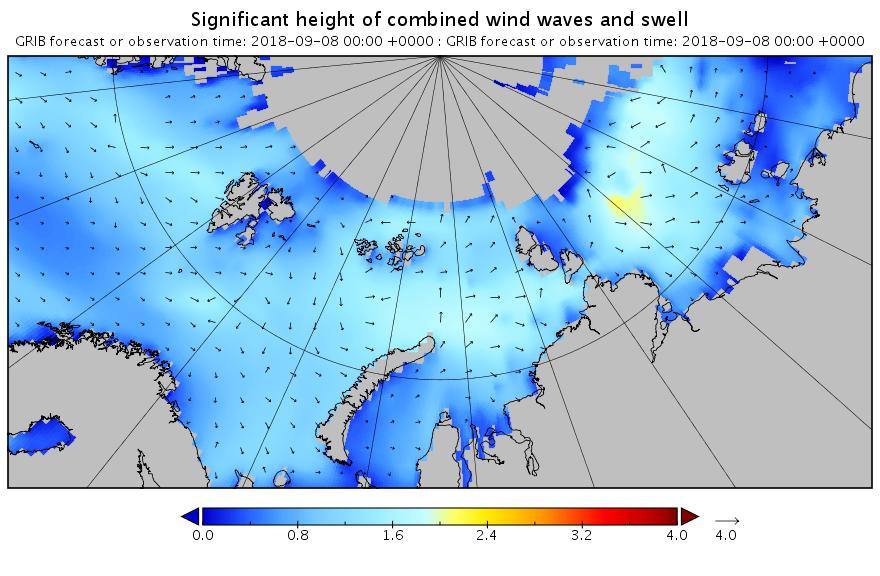
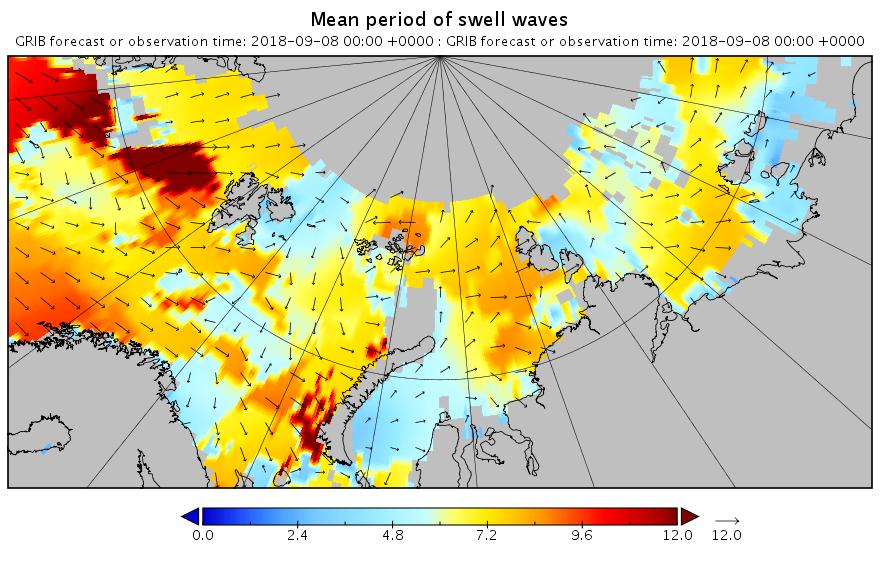
[Edit – September 8th]
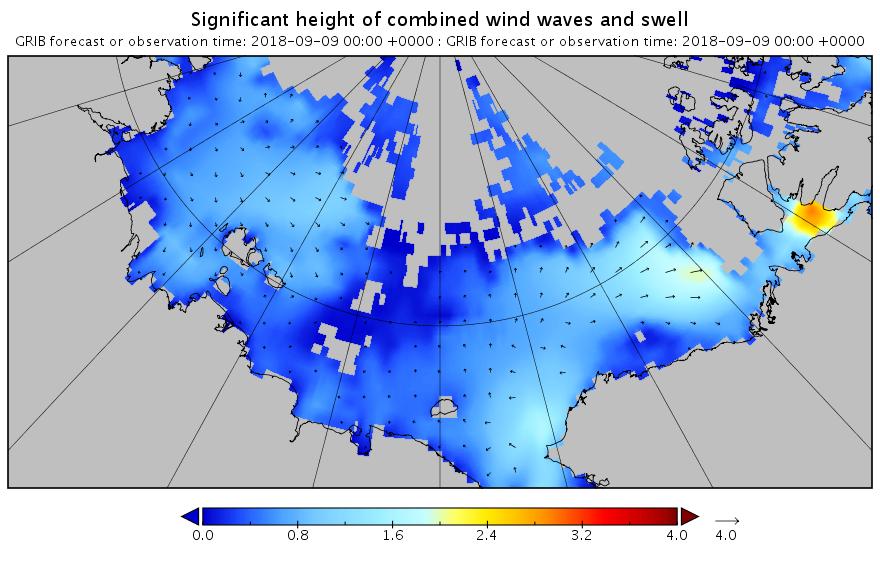
All the wave activity in the Laptev Sea is diminishing. Here’s the hindcast from midnight:
Meanwhile things are warming up in the Chukchi and Beaufort Seas. Here’s the forecast for midnight tonight:
[Edit – September 9th]
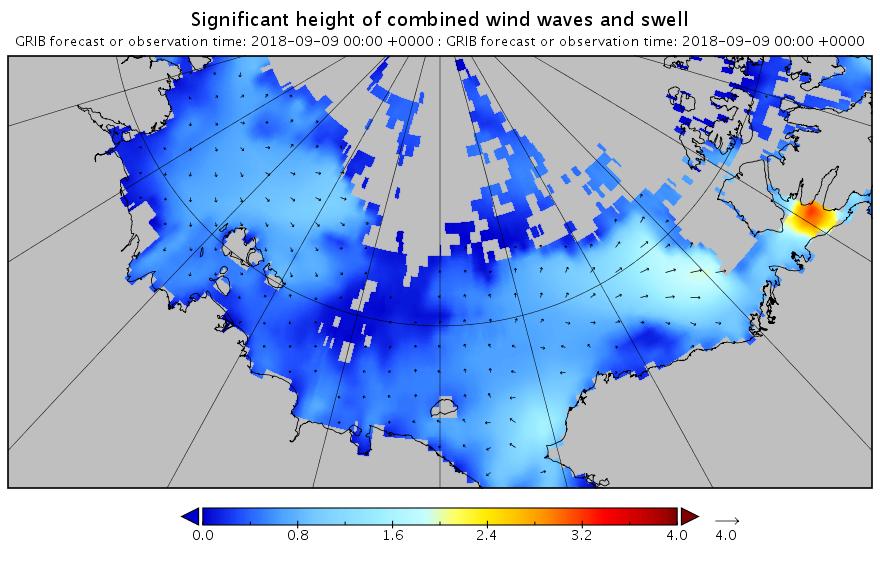
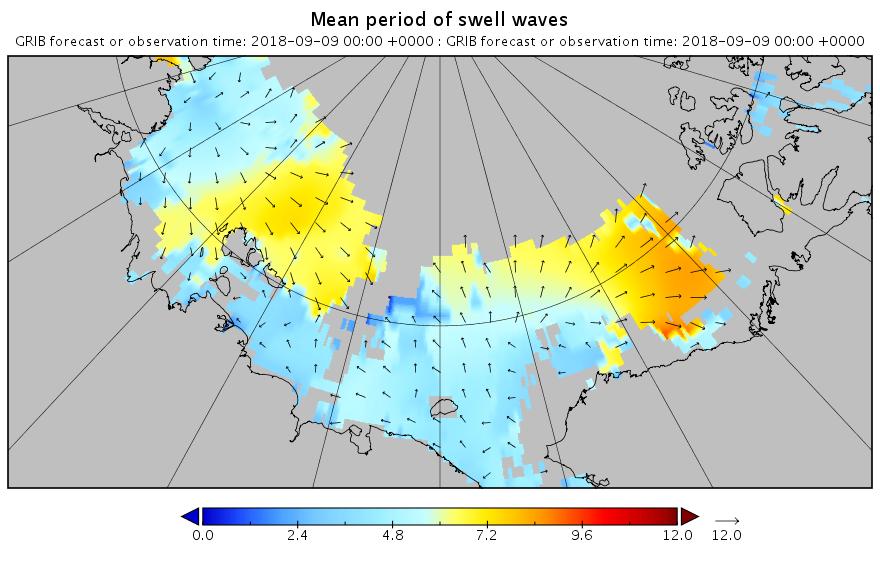
Here’s the hindcast for this morning’s swell in the Beaufort Sea:
This is currently a long way into the future and hence may not verify in practice. However any pulse of swell is currently forecast for September 13th:
This website uses cookies to improve your experience. We'll assume you're ok with this, but you can opt-out if you wish. Cookie settingsACCEPT
Privacy & Cookies Policy
Privacy Overview
This website uses cookies to improve your experience while you navigate through the website. Out of these, the cookies that are categorized as necessary are stored on your browser as they are essential for the working of basic functionalities of the website. We also use third-party cookies that help us analyze and understand how you use this website. These cookies will be stored in your browser only with your consent. You also have the option to opt-out of these cookies. But opting out of some of these cookies may affect your browsing experience.
Necessary cookies are absolutely essential for the website to function properly. This category only includes cookies that ensures basic functionalities and security features of the website. These cookies do not store any personal information.
Any cookies that may not be particularly necessary for the website to function and is used specifically to collect user personal data via analytics, ads, other embedded contents are termed as non-necessary cookies. It is mandatory to procure user consent prior to running these cookies on your website.