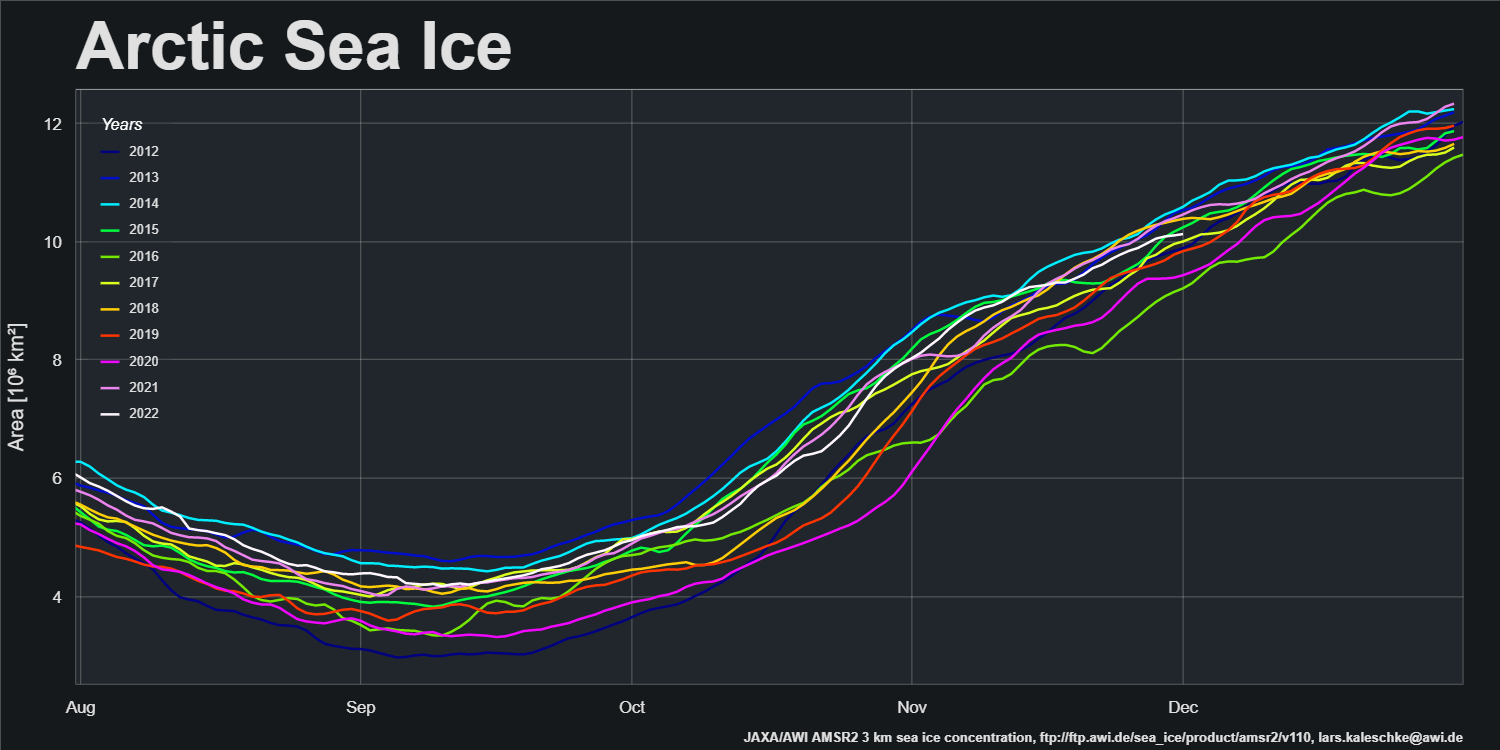
A new month is upon us and Christmas is coming! Here’s another look at Lars Kaleschke’s high resolution AMSR2 area and extent graphs for the Arctic as a whole:
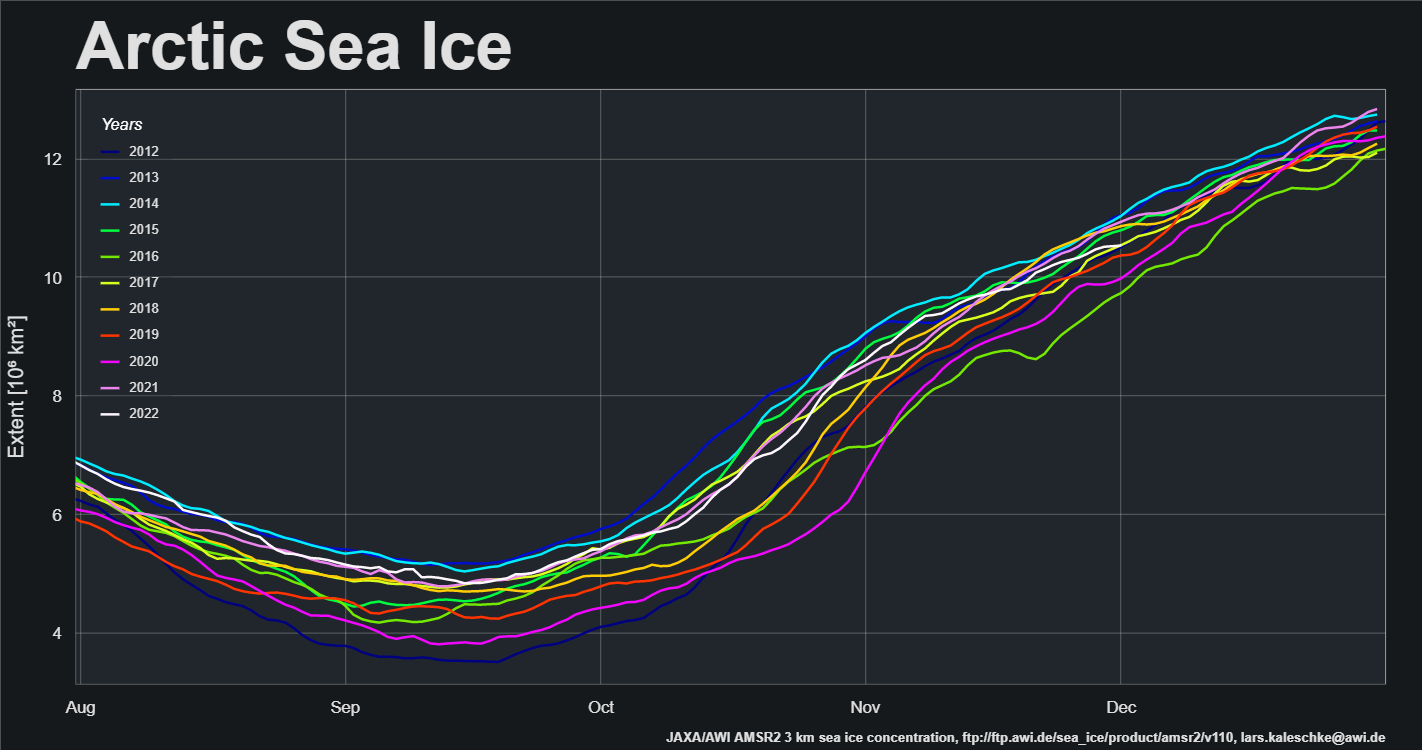
Extent increase stalled for the last few days of November, and as a result extent is now in a “statistical tie” with 2017 for 4th lowest extent for the date in the AMSR2 record.
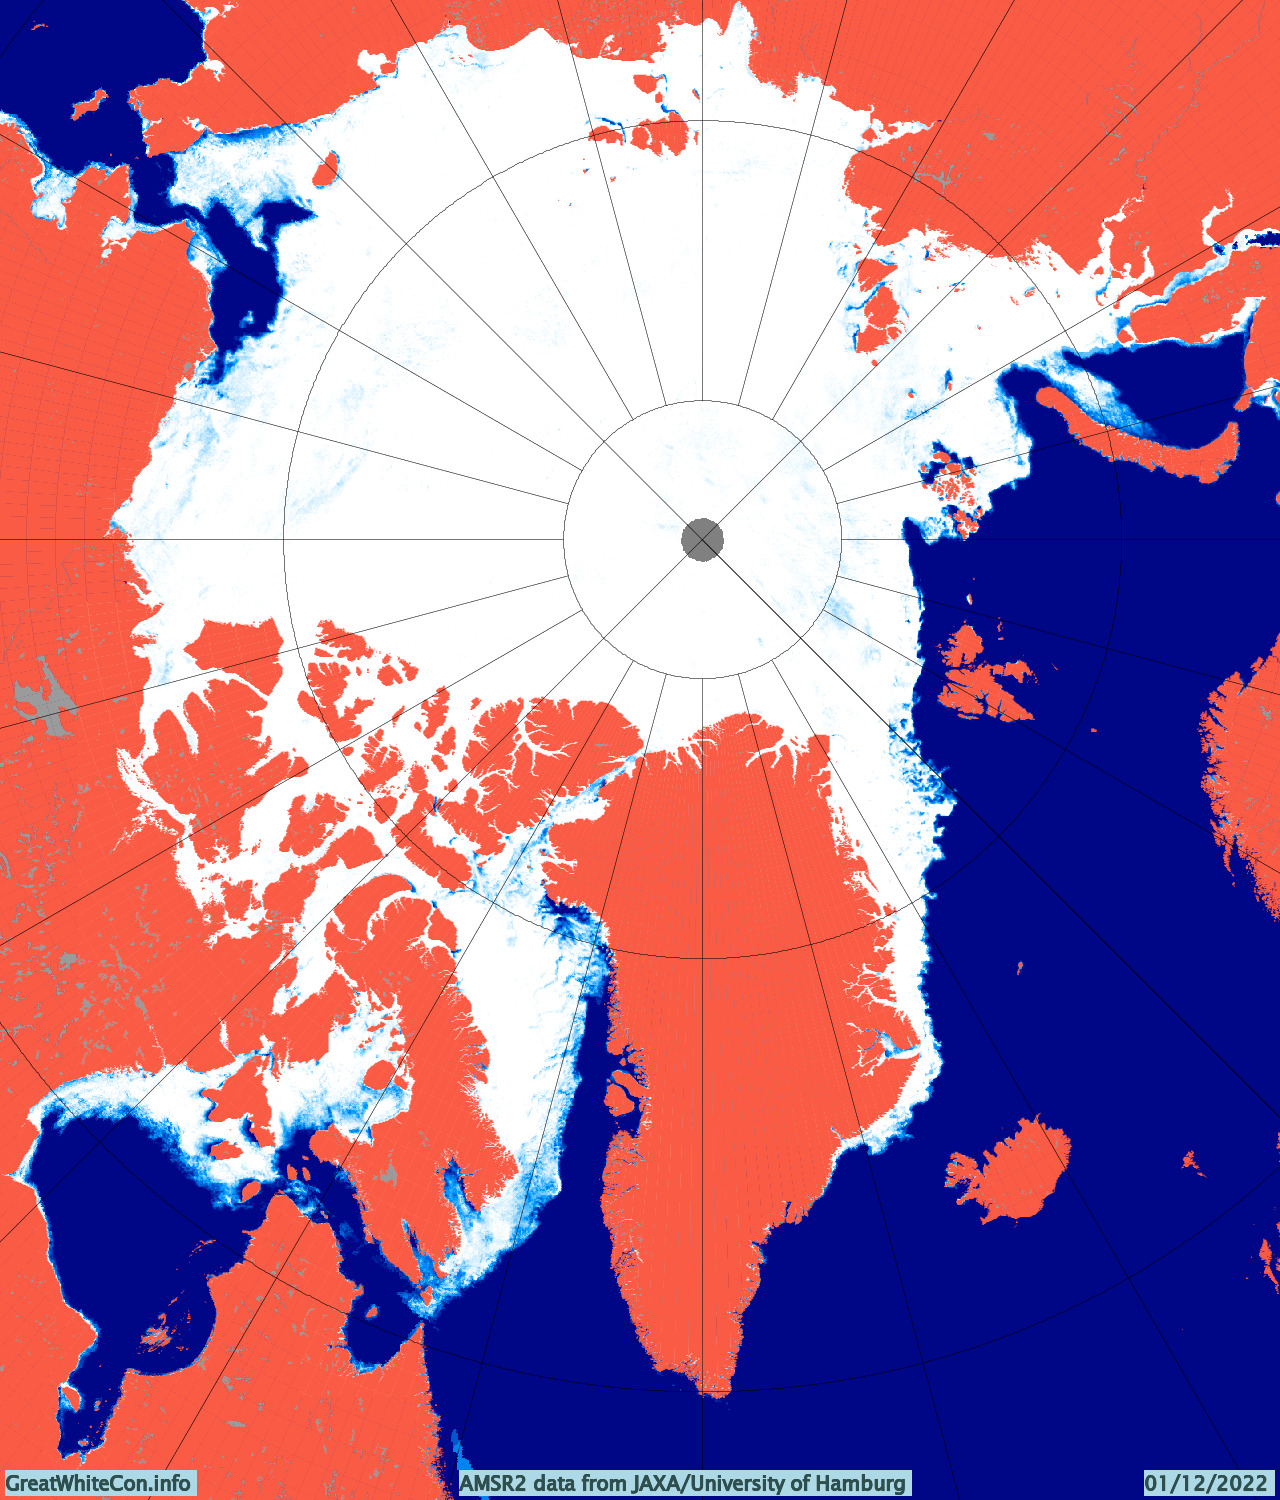
The AMSR2 concentration map reveals that the Chukchi Sea is now mostly refrozen:
However over on the Atlantic side of the Arctic there is now more open water than average in the Barents Sea:

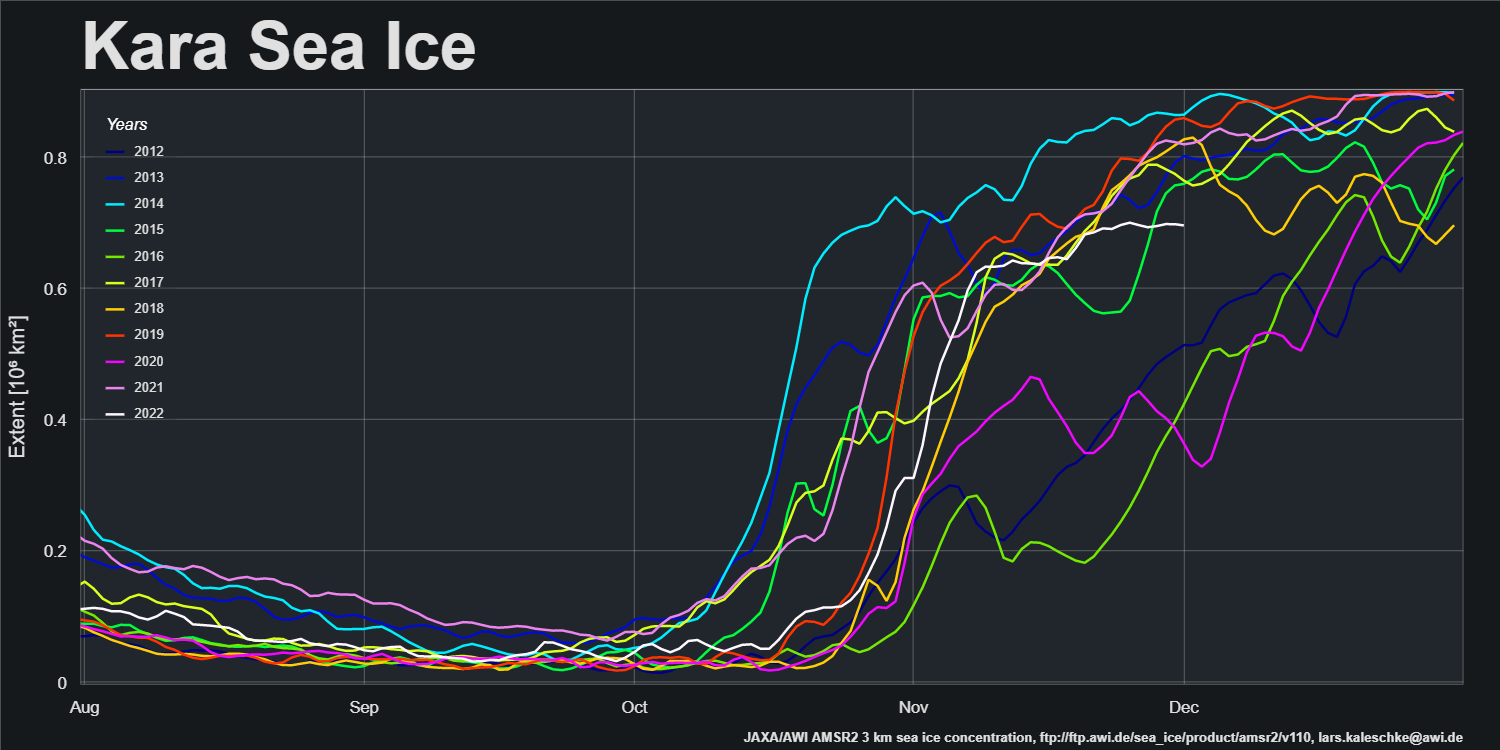
After a rapid rise at the start of November extent in the Kara Sea has barely increased over the last two weeks:
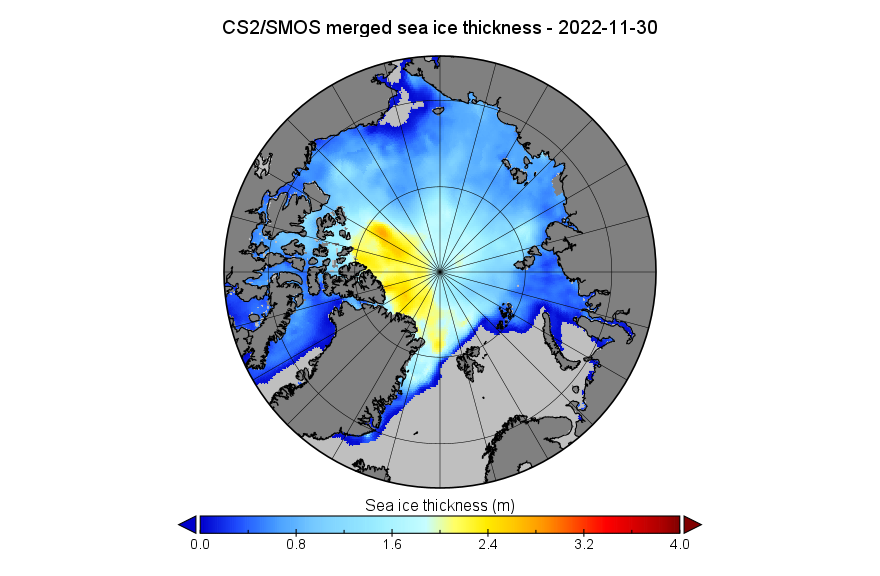
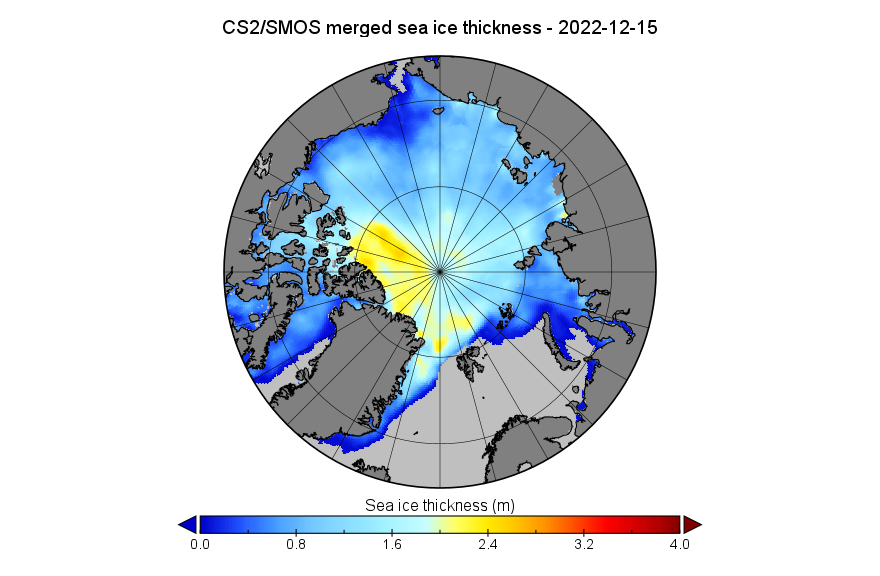
Looking at the third dimension next, here is the latest AWI CryoSat-2/SMOS Arctic sea ice thickness map:
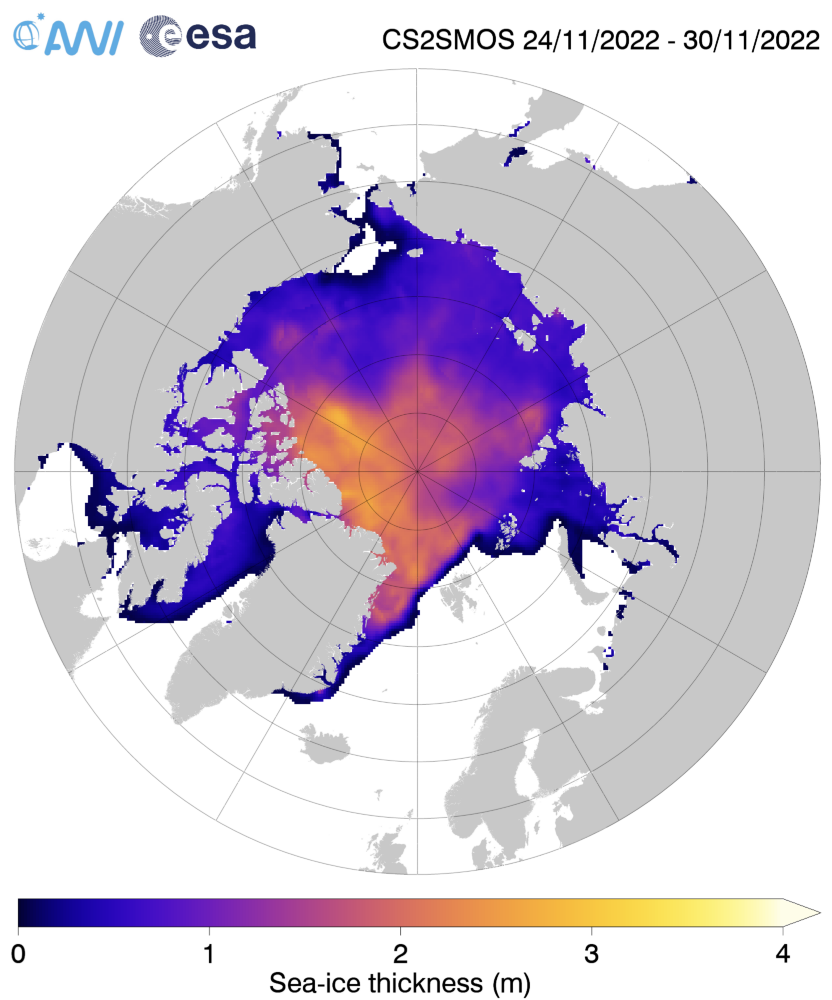
Rather than piled up along the north coasts of Greenland and Ellesmere Island as in days gone by, the thickest remaining ice currently appears to be in the Central Arctic north-west of the Canadian Arctic Archipelago.
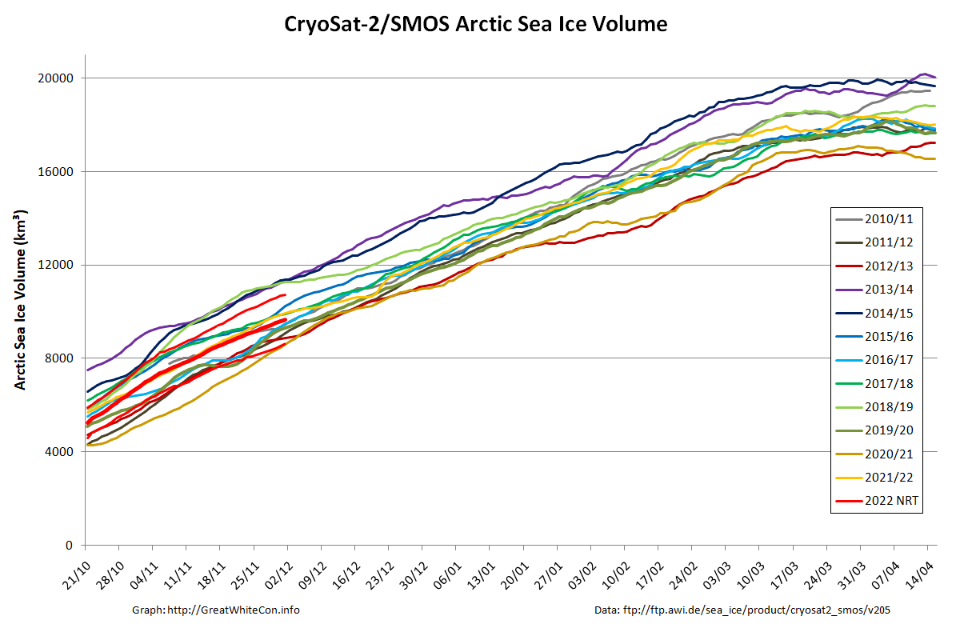
Finally, for the moment at least, here is the latest CS2/SMOS volume graph:
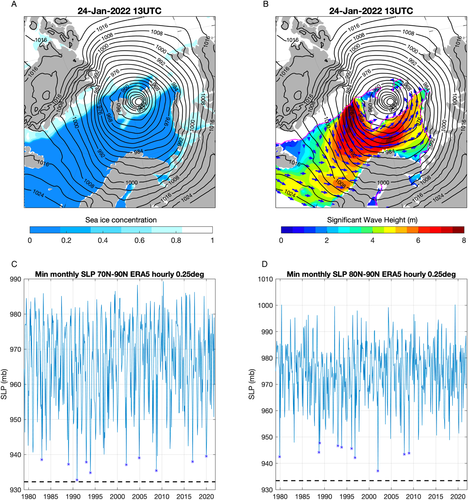
News via the ASIF of a recent journal article discussing the “Great Arctic Winter Cyclone” of 2022. In a paper entitled “Record Arctic Cyclone of January 2022: Characteristics, Impacts, and Predictability” Ed Blanchard-Wrigglesworth et al. point out that:
The cyclone resulted in a record (over the period 1979–2022) weekly loss of regional sea ice area and surface wind speeds, and generated ocean waves exceeding 8 m that impinged on sea ice in the Barents sea, observed via satellite altimetry as large waves-in-sea ice up to 2 m in amplitude more than 100 km into the ice pack. Surface heat fluxes were strongly impacted by the cyclone, with record atmosphere-to-surface turbulent fluxes. However, the direct atmospheric thermodynamic impact on sea ice loss was modest, and the record sea ice changes were likely mainly driven by dynamical and/or ocean processes. While the storm was well predicted up to 8 days in advance, subsequent changes in sea ice cover were not, likely due to biases in the forecasts’ sea ice initial conditions and missing physics in the forecast model such as wave-sea ice interaction.
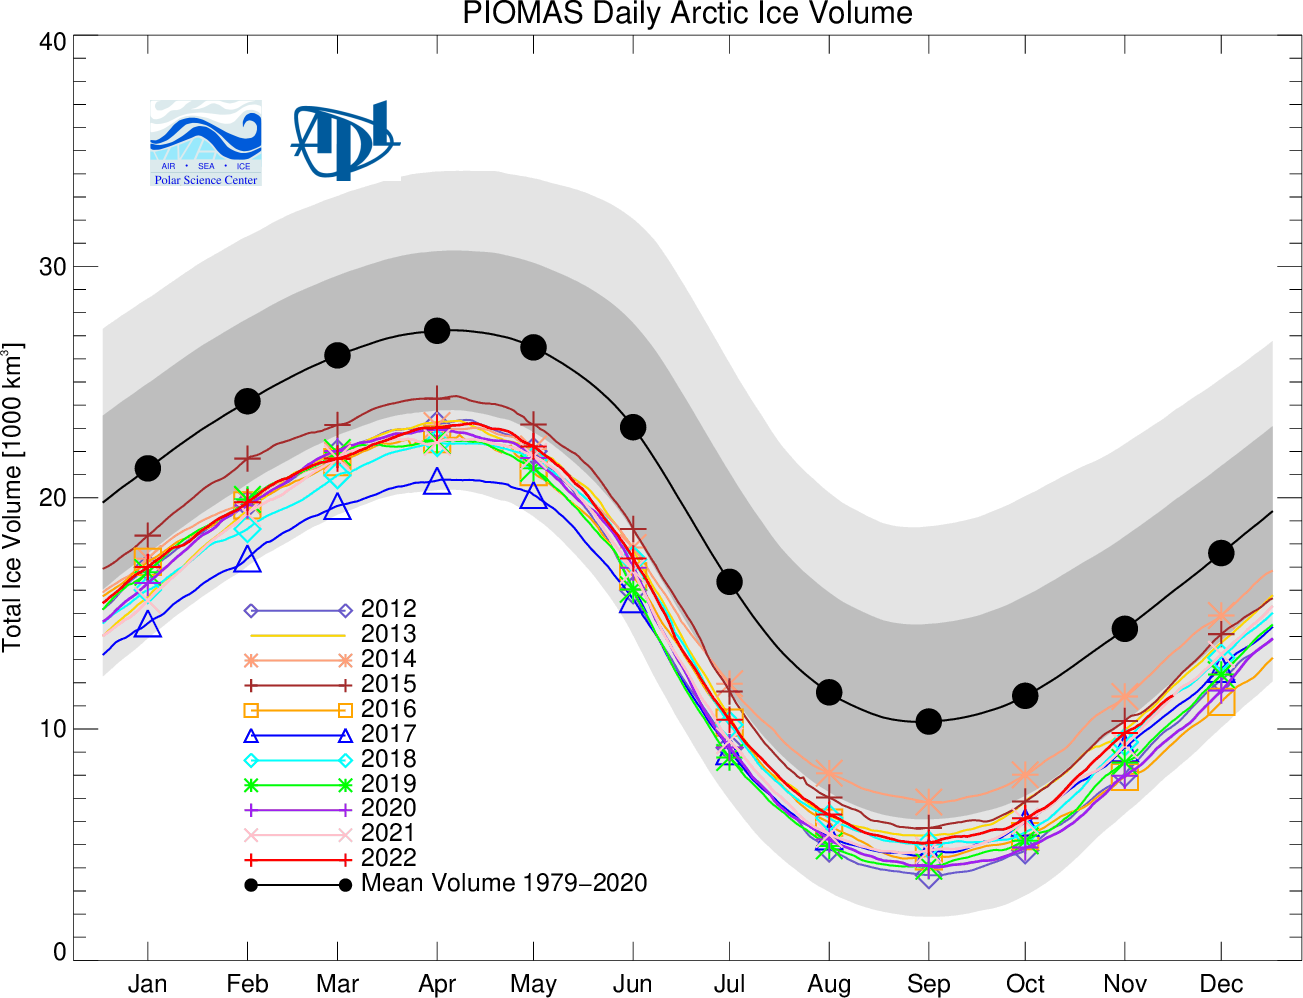
PIOMAS Arctic sea ice volume and thickness data for November 2022 has been released:
Average Arctic sea ice volume in November 2022 was 9,700 km3. This value is the 10th lowest on record for November, about 1,900 km 3 above the low record set in 2016. Monthly ice volume was 51% below the maximum in 1979 and 32% below the mean value for 1979-2021. Average November 2022 ice volume was 1.4 standard deviations above the 1979-2021 trend line…
The ice thickness anomaly map for November 2022 relative to 2011-2020 shows further strengthening of the positive anomalies north of Greenland and along the Canadian Archipelago:

Here too is the “unofficial” thickness map derived from the gridded thickness data:
Note the traditional build up of ice along the northern coast of the Canadian Arctic Archipelago which is absent from this CryoSat-2/SMOS thickness map:
The 2022 edition of NOAA’s Arctic Report Card has just been published. Here’s an introductory video:
According to the accompanying press release:
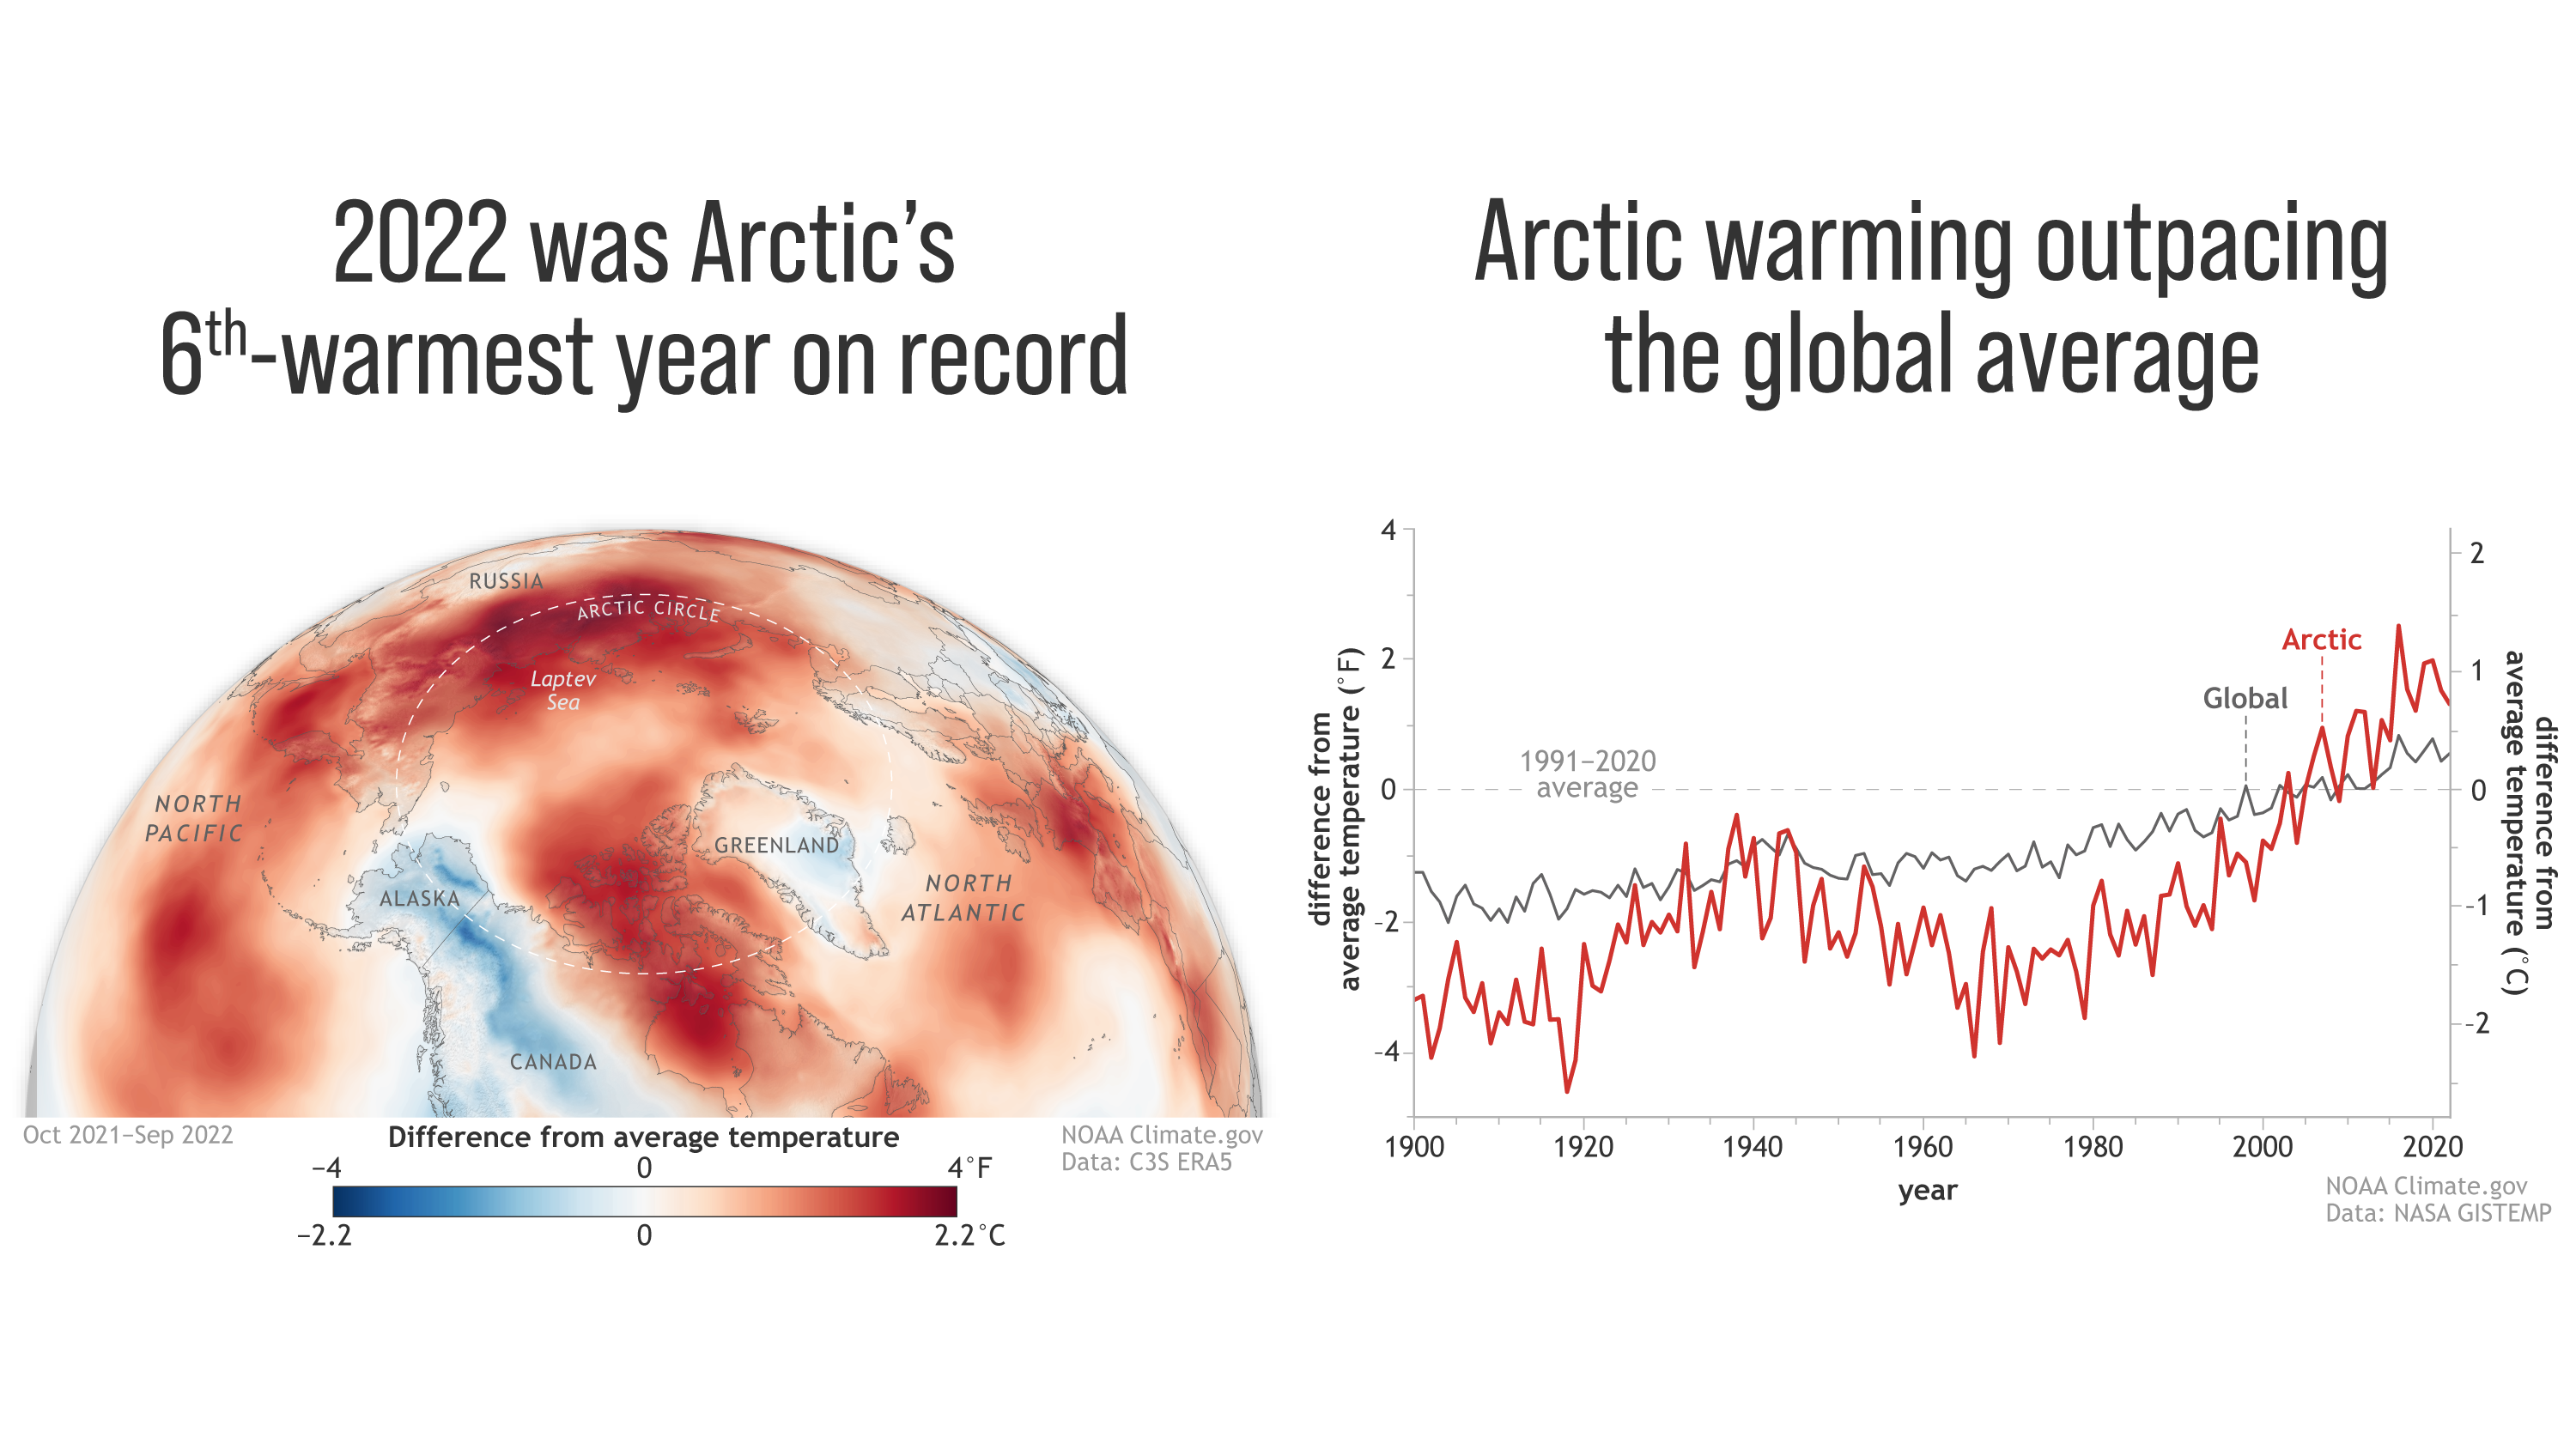
Arctic annual air temperatures from October 2021 to September 2022 were the sixth warmest dating back to 1900, continuing a decades-long trend in which Arctic air temperatures have warmed faster than the global average. The Arctic’s seven warmest years since 1900 have been the last seven years:
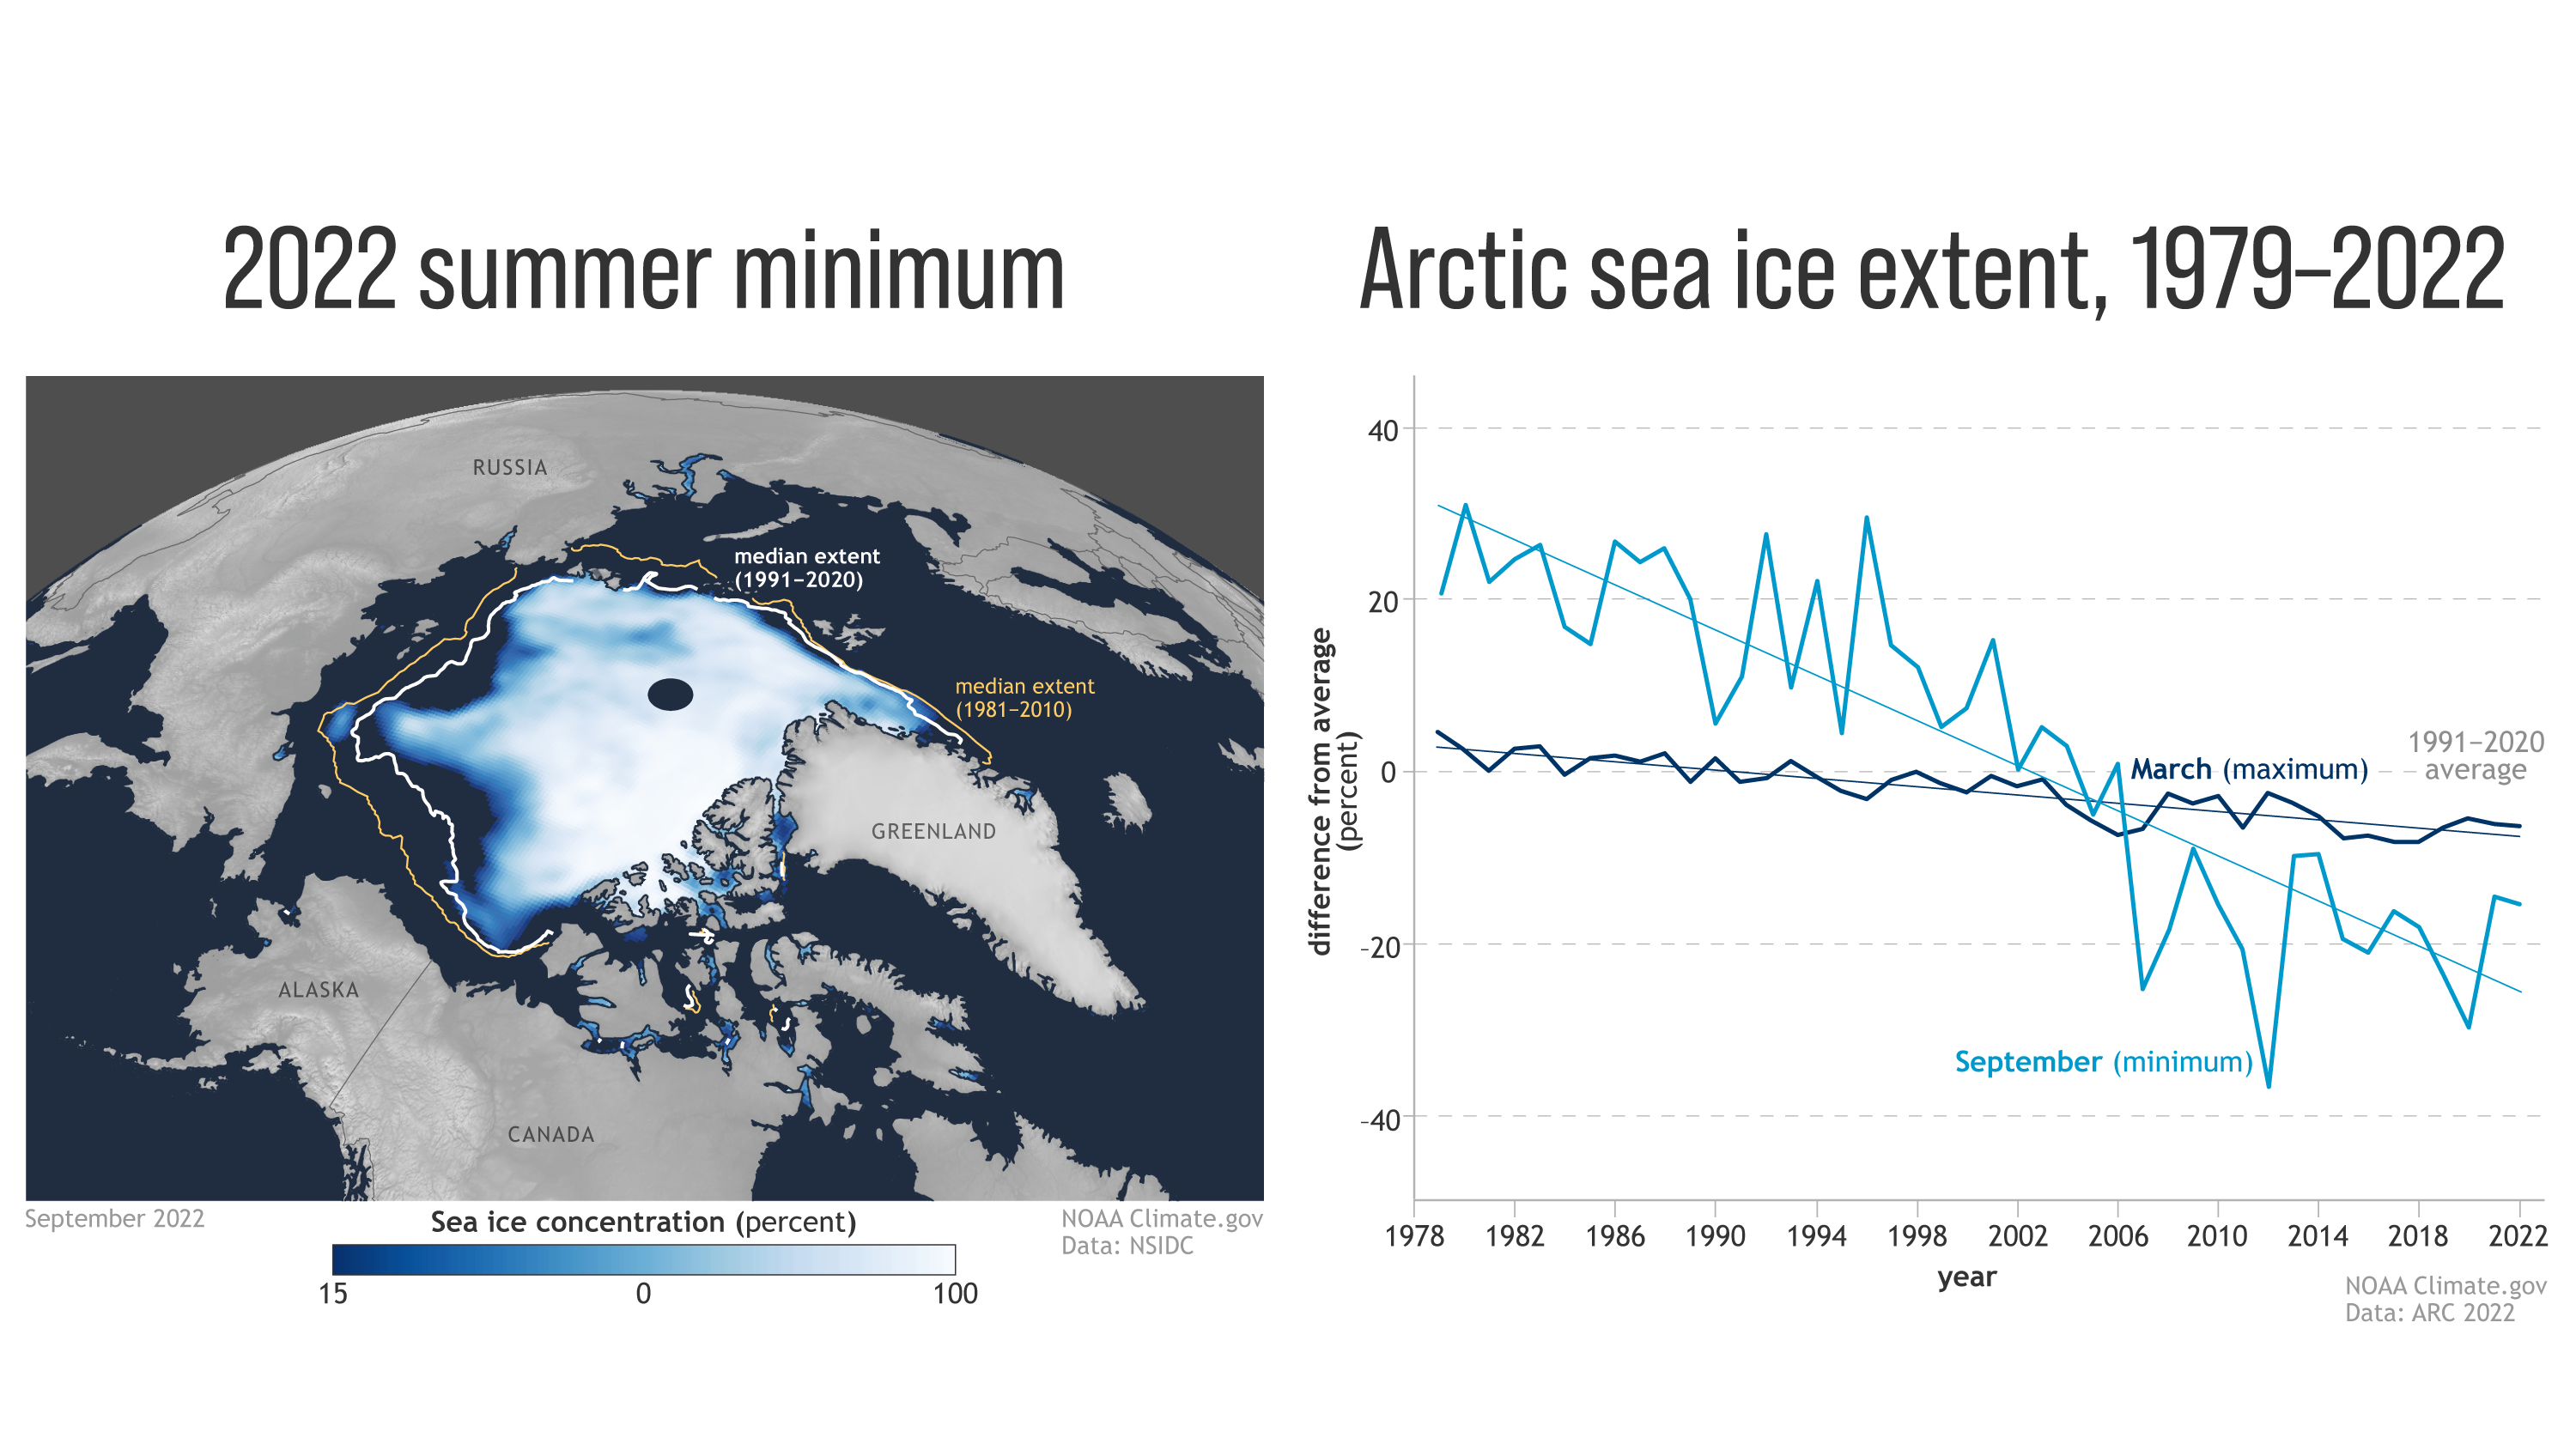
Arctic sea ice extent (coverage) was higher than many recent years, but much lower than the long-term average. Multiyear ice extent, sea-ice thickness and volume rebounded after a near-record low in 2021, but was below conditions in the 1980s and 1990s, with older ice extremely rare. Open water developed near the North Pole for much of the summer, allowing polar-class tourist and research vessels easy access. The Northern Sea Route and Northwest Passage were also largely open…
[Edit – December 25th]The 2021-2022 Arctic snow season saw a combination of above-average snow accumulation but early snowmelt, consistent with long-term trends of shortening snow seasons in several areas.
Wetter-than-normal conditions predominated over much of the Arctic from October 2021 to September 2022. Precipitation has increased significantly since the 1950s across all seasons and datasets. Heavy precipitation events are more common in the North Atlantic subarctic, while much of the central Arctic shows increases in consecutive wet days and decreases in consecutive dry days…
The Greenland ice sheet lost ice in 2022, the 25th consecutive year of ice loss. In September 2022, the Greenland ice sheet had unprecedented late-season warming, creating surface melt conditions over 36% of the ice sheet on September 3, including the Greenland ice sheet’s summit at 10,500 feet. This followed a July 18 large surface melt event observed across 42% of the Greenland ice sheet surface.
The August 2022 sea surface temperatures continued to show a warming trend that has been observed since 1982 for much of the ice-free Arctic Ocean. In the Barents and Laptev seas, August 2022 mean sea surface temperatures were 3.5 to 5.5 degrees Fahrenheit (2 to 3°C) warmer than 1991–2020 August mean values while unusually cool August sea surface temperatures of 5.4 degrees Fahrenheit (3 degrees Celsius) below the trend occurred in the Chukchi Sea, likely driven by late-summer sea ice in the region that was kept in place by the winds.
According to FlightRadar24 Santa Claus has recently completed his final deliveries to Alaska:

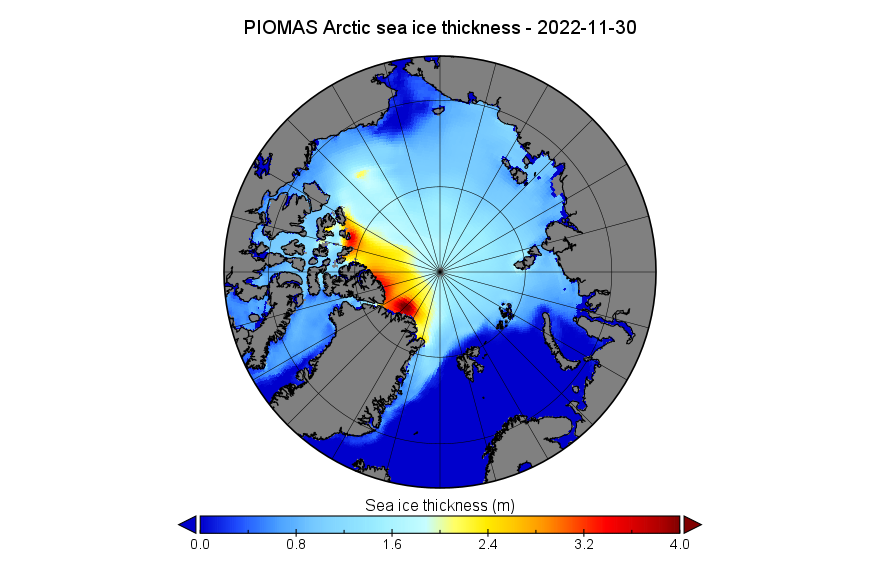
In other news from the far north here’s the mid December PIOMAS Arctic sea ice thickness map:

together with the CryoSat-2/SMOS equivalent:
CryoSat continues to show significantly thinner ice than PIOMAS in the area north of Greenland and the CAA. It does however reveal some thicker ice north of Svalbard.
Further news is now available on the January 2023 open thread.
Jan.31.—-16th.lowest. +333,064 sq.km. above 2010’s average.
Feb.28.—-11th.lowest +116,764 sq.km. above 2010’s average
Mar.31.—-10th.lowest -127,470 sq.km. BELOW 2010’s average
Apr. 30.—-14th.lowest +16,886 sq.km. above 2010’s average
May. 31.—15th lowest +395,097 sq.km. above 2010’s average
Jun. 30.—-10th.lowest +35,744 sq.km above 2010’s average
Jul. 31.—–12th lowest +228,905 sq.km. above 2010’s average
Aug.31.—-11th.lowest +203,902 sq.km. above 2010’s average
Sep.30.—–7th lowest +115,918 sq.km. above 2010’s average
Oct.31.—– 11th lowest, +269,119 sq.km. above 2010’s average
Nov.30.——5th lowest, -183,803 sq.km. BELOW 2010’s average
Dec.3.——-3rd.lowest, -366,500 sq.km. BELOW 2010’s average
December sea ice extent now fallen to 3rd.lowest.
JAXA agrees:
Currently only 2016 and 2020 are lower.
PIOMAS releases are getting a bit more timely, I’m glad to see, but the news is pretty much the same. For what I believe is the thirteenth month in a row, volume anomalies show “no trend in the past eleven years…”, and levels are again over a standard deviation over the trend line. Any bets, Jim, on how long the volume ‘pause’ will last?
It could take a while, on a typical year little ice remains outside of the central Arctic basin and the Canadian Arctic, the thickest and northernmost Arctic.
It could take something seriously out of the ordinary to finish them off
Agree, Tom. In the current climate, there is just too much ‘dark and cold’ in the Winter to make Summer ice disappear (defined as < one Wadham).
Taylor, do you believe in stagnation?
Intellectual, moral or physical stagnation? All are possible.
If you mean stagnation in the loss of Arctic ice, that does seem to be the case. There’s simply not enough heat in our current climate regime to overcome the heating loss from open water in the winter. That suggests an oscillation with a lower limit, but far above the good doctor Wadham’s limit of one million km^2. In an earlier, warmer regime (the MWP or RWP, for example) we might get to one Wadham, but not now. Tell Greta she can relax…
Of course, in a situation where global temperatures gradually warm, on average, a fraction of a degree per year/even decade, maybe one might expect the September minimum to “stutter along” for quite sometime before it starts breaking records .again.
I would hazard a guess that the loss of long stored up multiyear ice has done a lot to get us to this point.
Maybe if we all come back in 2050,we might be all the wiser about the Arctic climate.. and at that point if we experience further declines it probably will be too late!
Nobody ever thought it would go below 1 million lol
Jan.31.—-16th.lowest. +333,064 sq.km. above 2010’s average.
Feb.28.—-11th.lowest +116,764 sq.km. above 2010’s average
Mar.31.—-10th.lowest -127,470 sq.km. BELOW 2010’s average
Apr. 30.—-14th.lowest +16,886 sq.km. above 2010’s average
May. 31.—15th lowest +395,097 sq.km. above 2010’s average
Jun. 30.—-10th.lowest +35,744 sq.km above 2010’s average
Jul. 31.—–12th lowest +228,905 sq.km. above 2010’s average
Aug.31.—-11th.lowest +203,902 sq.km. above 2010’s average
Sep.30.—–7th lowest +115,918 sq.km. above 2010’s average
Oct.31.—– 11th lowest, +269,119 sq.km. above 2010’s average
Nov.30.——5th lowest, -183,803 sq.km. BELOW 2010’s average
Dec.12.——13th.lowest, +88,300 sq.km. ABOVE 2010’s average
December sea ice extent now back above 2010’s average
Yes, Neil, quite a rebound, particularly because it comes at a time when Arctic temps are well above normal as cold air is dumped into the lower latitudes. Joe Bastardi has been warning about that.
Did Big Joe point out that in early December the winds had changed direction over the Arctic periphery, and that Hudson Bay has quickly refrozen?
Latest from “Big Joe” is that the currently moderating mid-latitude temps (and corresponding fall in Arctic temps), is going to be followed by a mid January plunge in a repeat of a previous global pattern. He’s been fairly good at those calls, but we’ll see. It’s not what North America and Europe need right now, for sure.
Extent means nothing.
It is of course the easiest metric to measure, but true, a sudden change in the wind can add or subtract 100k+ overnight
Peripheral compaction went from highest for the date in the AMSR2 record to lowest in less than 2 weeks:
Thanks for the compaction notes, Jim. I used to enjoy tracking DMI’s 15% extent number vs their 30% number as a way to look at likely compaction, but sadly they no longer publish the 30% metric.
“Easiest metric to measure…”. Yes, Tom, you’d think so, but while all the major sources do measure it daily, they don’t agree very closely. I presume that looking at each one individually will at least give me the trend, but even the trend between the individual sources can change .
For example, right now NSIDC has the 15% metric at roughly 12.3, MASIE is more aggressive at 12.6, but perennial pessimist JAXA is lagging behind at around 11.8 (all purporting to measure 15% coverage extent in millions of km^2). Ok, that’s less than a 7% spread, but still, hardly precise. Should I average them to get a more accurate number? Is one “better than the other” in terms of both accuracy and precision? I haven’t a clue, but still look at all of them daily…
From what I understand, the MASIE extent is outlined manually, they don’t recommend use for tracking long term trends. Of the other two JAXA has the smallest grid size( finer resolution).
I would say just don’t mix the two,( the proverbial apples and oranges) to track the long term trend.. stick to either feet or meters!
I’m sure Jim has explained along these lines before.
Tom,
Yes, I’m aware of some of the technical differences in the various measurements. I sometimes think I prefer MASIE, because of the human intervention. At least they can sometimes look out the window (figuratively) and say “I don’t care what the satellite says, it’s frozen over right up to the coast” or “No, that’s not open water, it’s a melt pond on solid ice.” However, I sometimes also remember human frailty and wishful thinking and prefer a more dispassionate approach. It’s amazing that we devote so much time and energy (and even annual contests) to something so imprecise, without a corresponding effort to improve and standardize the metric.
If 7% is not precise then what is ?
“If 7% is not precise, then what is?” Well, the speed of light is known to be “approximately” 299,792,458 metres per second, a precision of at least 9 digits. If we knew the speed of light only in a 7% range of that number, it could vary by as much as 21,000 metres/sec. How much of physics would be impossible to prove if our measurement of C were so poor? Now I realize that given how bits of ice float around in the Arctic, that it’s unlikely that we could get an agreement precise to nine digits, but would be nice if the Arctic scientific community could at leas agree on who has the “best” (most likely accurate) estimate and standardize on that number/method.
For example, our host likes JAXA, but is it because it’s the most accurate, or the lowest? I don’t know, but I’m inclined to think the best of him, and conclude there’s no hidden motive. But we know DMI and NSIDC are higher -why? Should they give up, or persist in advocating for their measurement?
That scenario wouldn’t happen in physics. Anybody who said that C was 300,053 m/s would either have to produce incontrovertible proof, or be laughed out of the profession. Gives you a sense of the current maturity of Climate Science…
Sorry, in the post above, I realized that my 21,000 and 300,053 numbers above were expressed in km/s, not metres/sec.
That’s what I get for doing calls in my head and not proofreading before pushing the magic button. So as they say in Climate Science reporting, “it’s worse than we thought.”
‘Extent means nothing’ – until it does. It caused lots of excitement in 2012 in some quarters. As my mother used to say, “depends on whose ox is being gored…”
Taylor, admit it, extent means nothing.
Just exactly why are DMI temps so demonic?
“…why are DMI temps so demonic?” Doesn’t DMI stand for “Demonic Meteorology Institute”? /sarc off
Christmas update on sea ice extent.
Happy Christmas to you all.
Jan.31.—-16th.lowest. +333,064 sq.km. above 2010’s average.
Feb.28.—-11th.lowest +116,764 sq.km. above 2010’s average
Mar.31.—-10th.lowest -127,470 sq.km. BELOW 2010’s average
Apr. 30.—-14th.lowest +16,886 sq.km. above 2010’s average
May. 31.—15th lowest +395,097 sq.km. above 2010’s average
Jun. 30.—-10th.lowest +35,744 sq.km above 2010’s average
Jul. 31.—–12th lowest +228,905 sq.km. above 2010’s average
Aug.31.—-11th.lowest +203,902 sq.km. above 2010’s average
Sep.30.—–7th lowest +115,918 sq.km. above 2010’s average
Oct.31.—– 11th lowest, +269,119 sq.km. above 2010’s average
Nov30.——5th lowest, -183,803 sq.km. BELOW 2010’s average
Dec.25—-5th.lowest,-14,500 sq.km. BELOW 2010’s average
Taylor, how important to “the complex” is the subject of climate change compared to the subject of the speed of light?
7 percent, lol ?!?
Speak plainly, ‘SpeakMyLanguage” (if that is your name). I’m not understanding your meaning…
If you mean the ‘Governmental-Educational” Complex, I’d say Climate Change is important (critical source of funding). If you mean the traditional military-industrial complex, I’d say C is more important. Hard to imagine landing a probe on Mars or building an H-bomb without knowing the value of that constant…
Taylor, are you anti-big-government?
“Are you anti-big-government.”
In general, I’d say I’m anti government being bigger than it needs to be. I find today’s US government (and quite a few others) much bigger than it needs to be. The key functions of government (e.g. protecting the country from foreign threats, regulating commerce between states and other countries, enforcing the laws) require resources, for sure. Most of the other functions should only be done by the federal government if it is cheaper to consolidate the function, and the states agree that a ‘one size fits all’ approach is reasonable. Most of the rest is wasted, and from a funding and spending perspective, ‘nature abhors a vacuum’ – spending will always expand to fit the available resources, and if you can print money, will expand beyond that, as we clearly see today
Two party representative democracy is such a scam: the more efficiently we learn to use a resource the more of that resource is actually used. Career politicians put their kids through college via the taxpaying voter and set them up for generations. Surely the term “waste” is entirely subjective.
Reagan said Governments don’t voluntarily get smaller.
Was Reagan alluding to Jevons Paradox by coincidence?
Well, certainly Jevons Paradox explains why human life is getting more comfortable, as anyone who uses air conditioning in summer will attest. Low cost, widely available energy has led to finding ways to increase its consumption, and made possible a luxury we lived without for several million years. However, trying to apply the paradox to government is problematic, since it assumes government will become more efficient, a thesis disproven in all but the smallest communities.
The only thing I’ve noticed government getting more efficient at is extracting money from those who have earned it. At that they are pretty good…
its called the gravy train
Hycom seems to show a lot of thick ice being exported through the Fram at the moment, meanwhile Nares stubbornly refuses to block up.
I wonder if this says anything about the ice in the Wandel Sea, or could it have any effect going forward in 2023.
CryoSat-2 agrees regarding thick ice about to be exported through the Fram Strait.
See the new January thread: