Happy New Year to one and all.
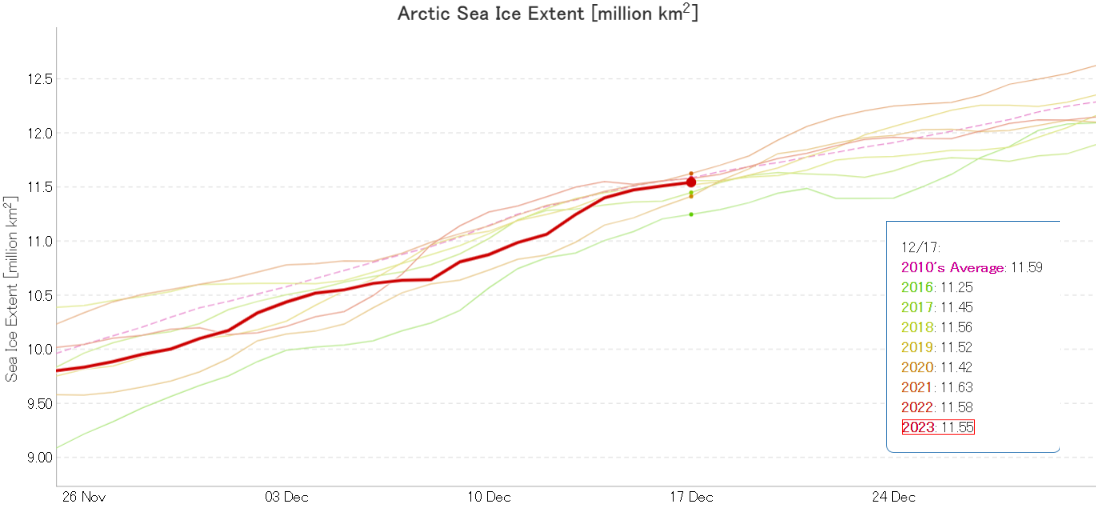
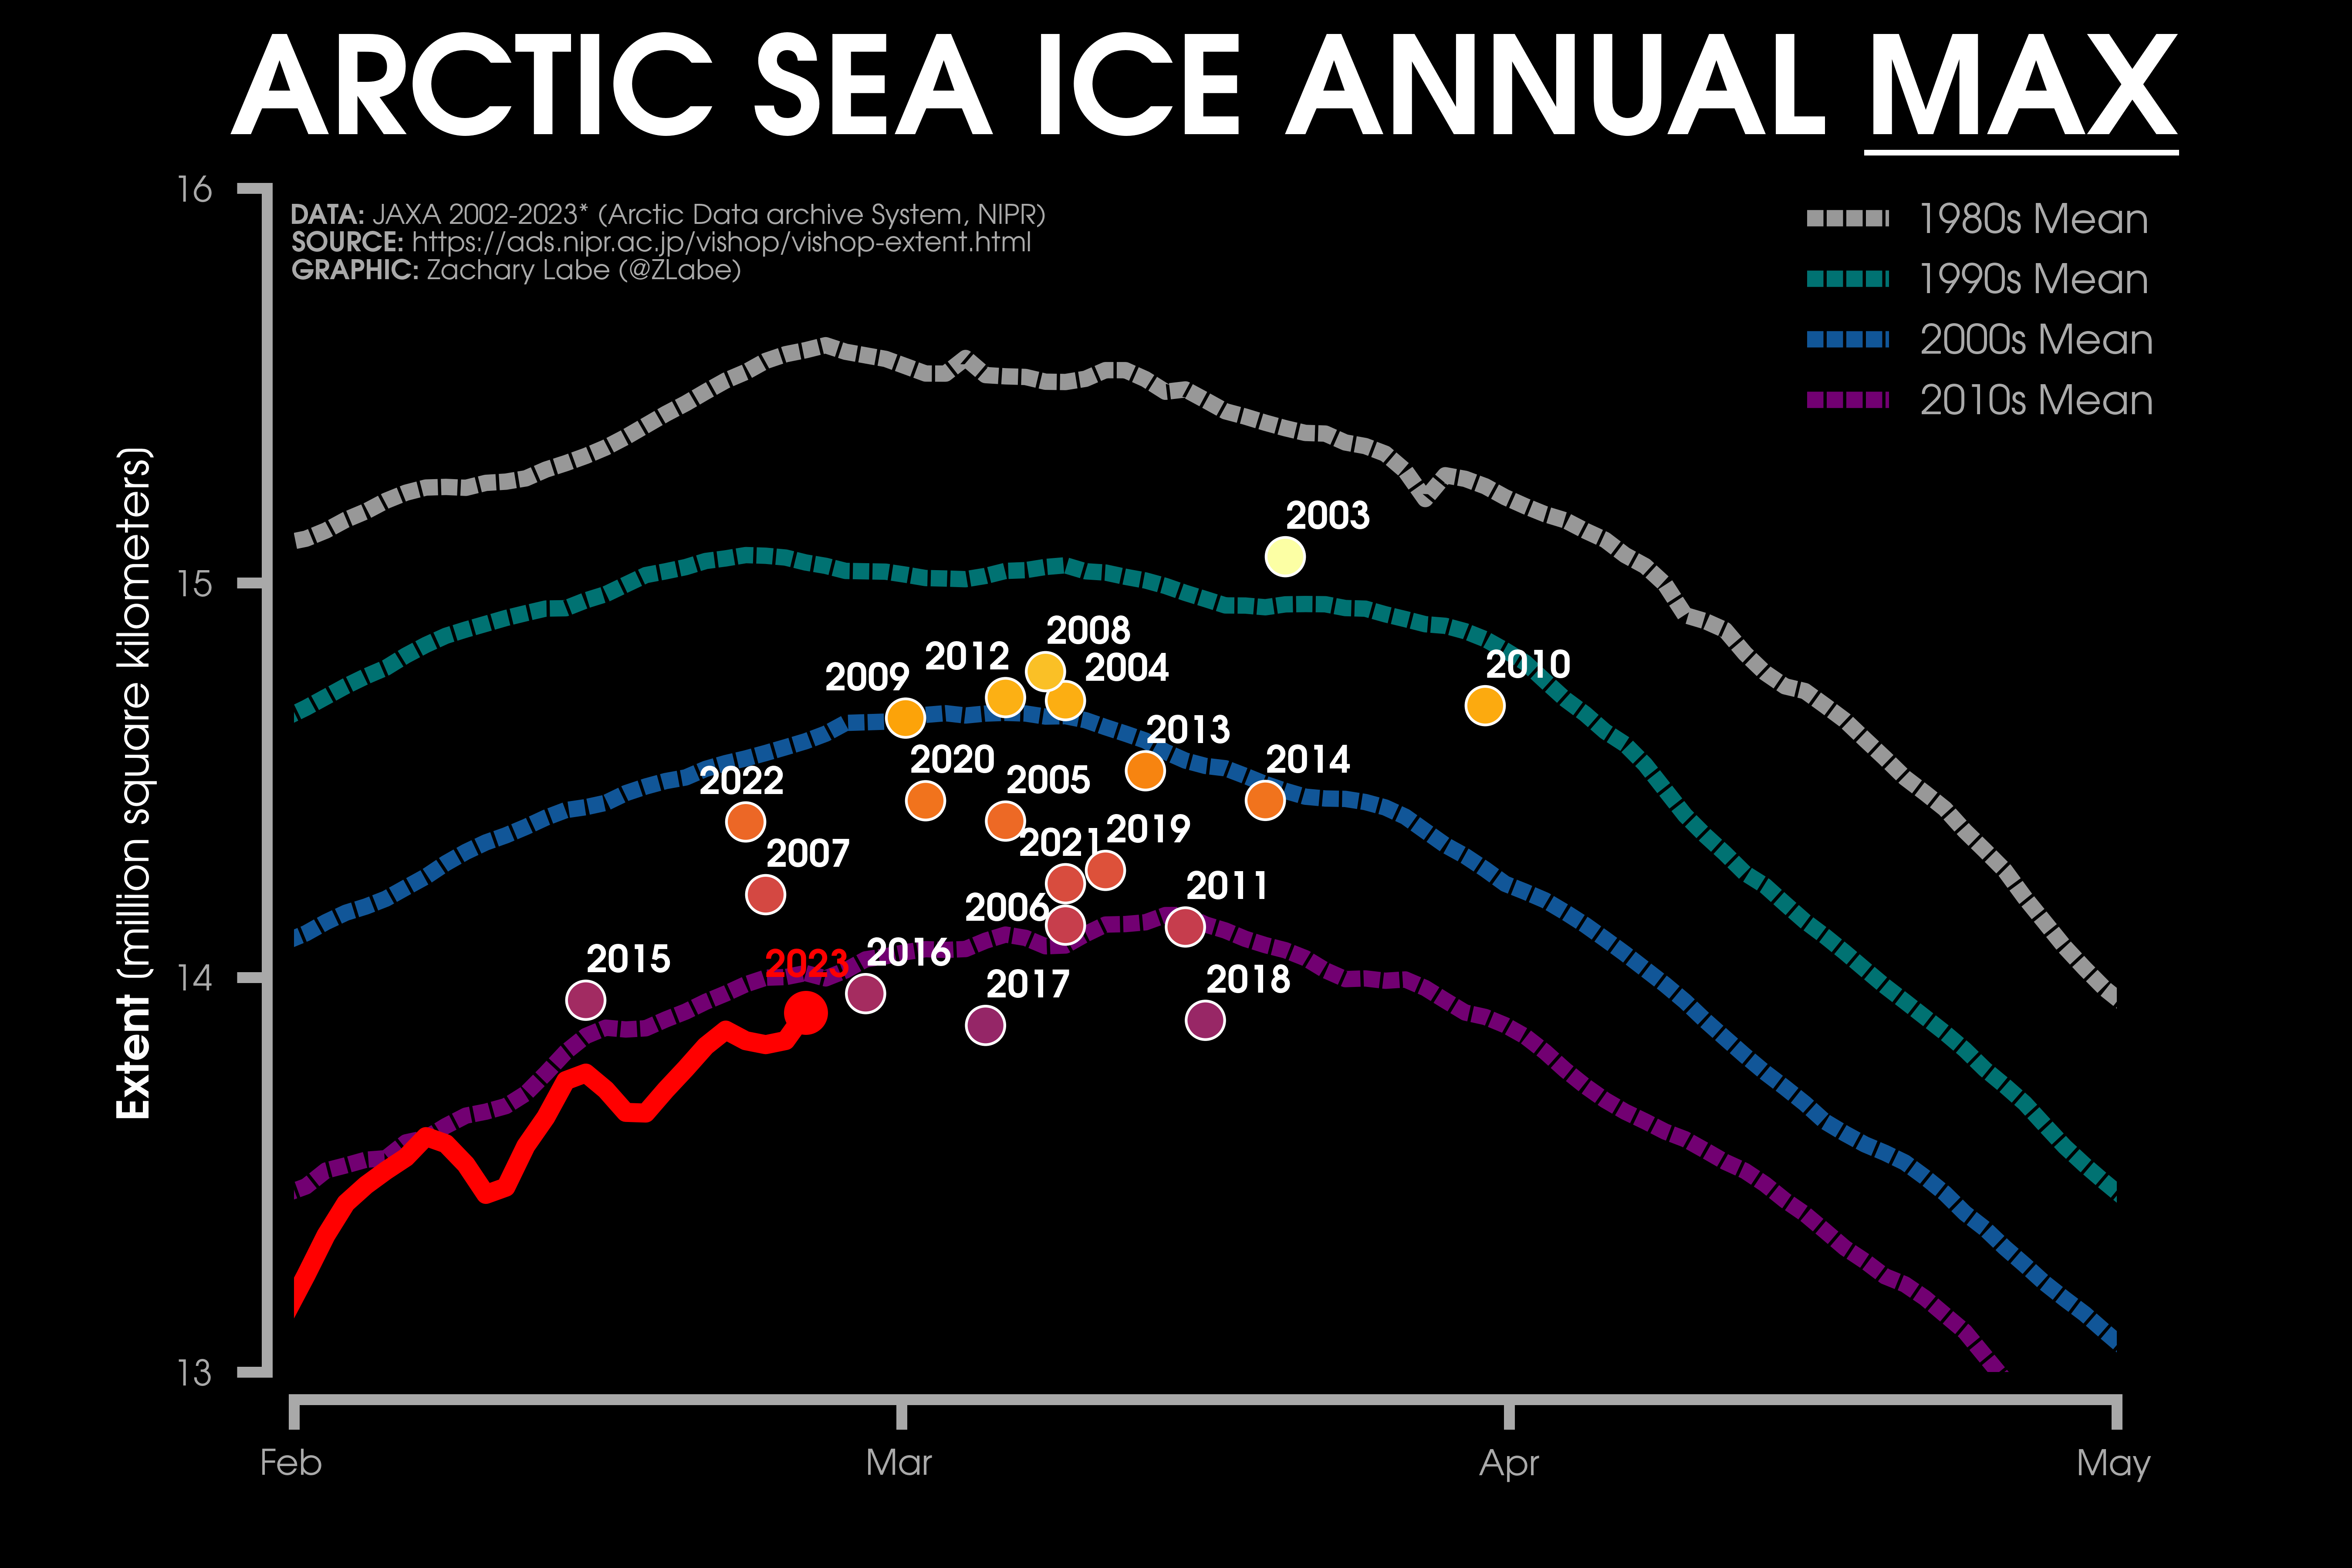
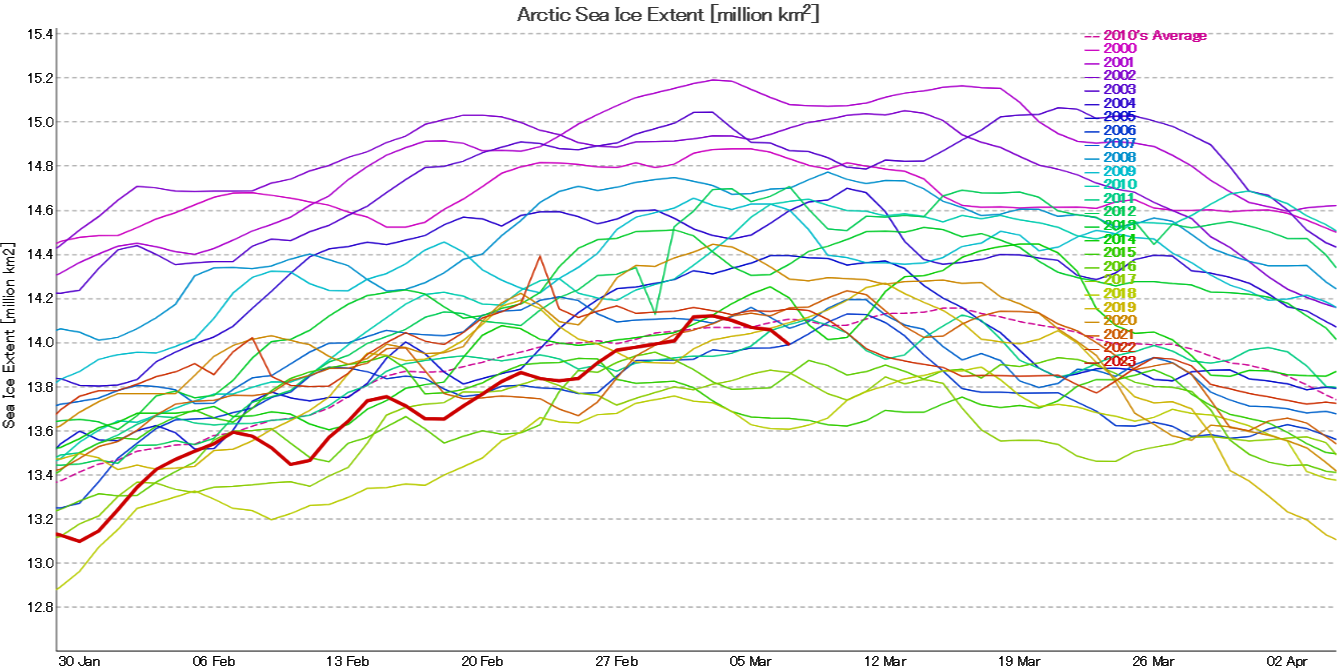
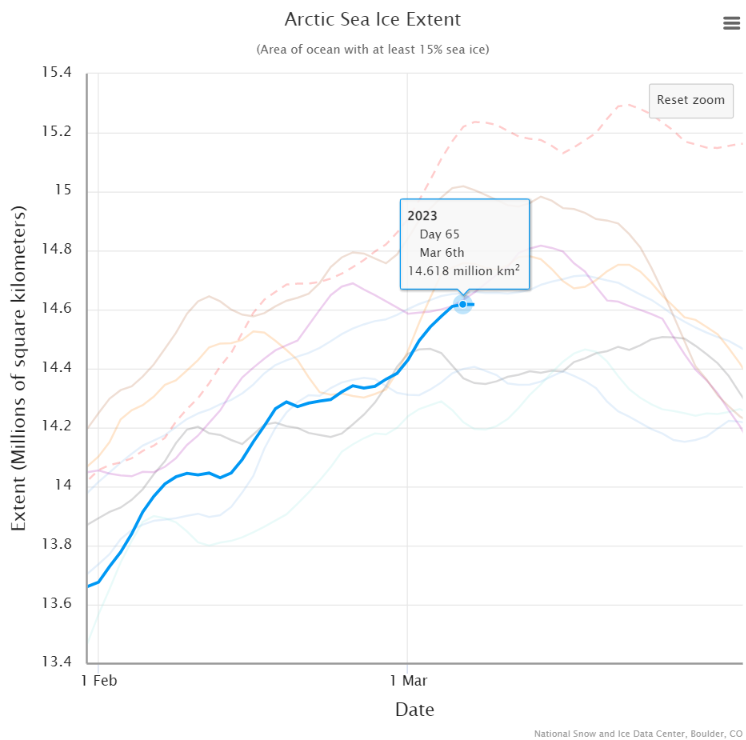
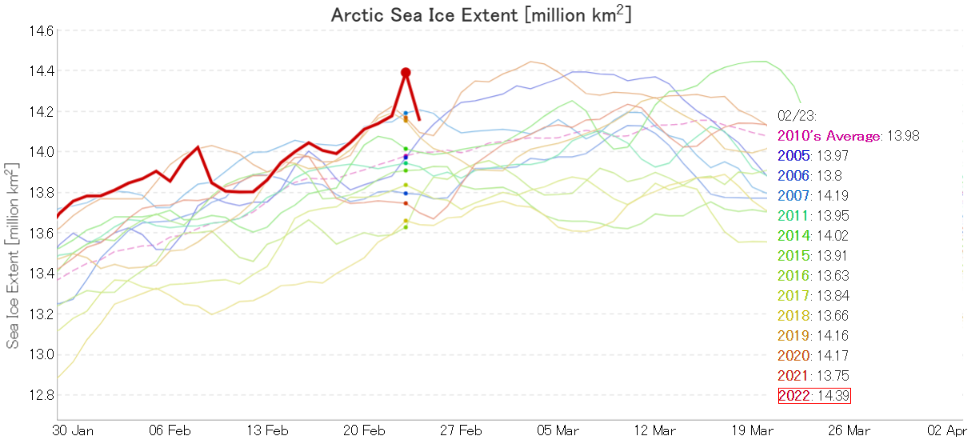
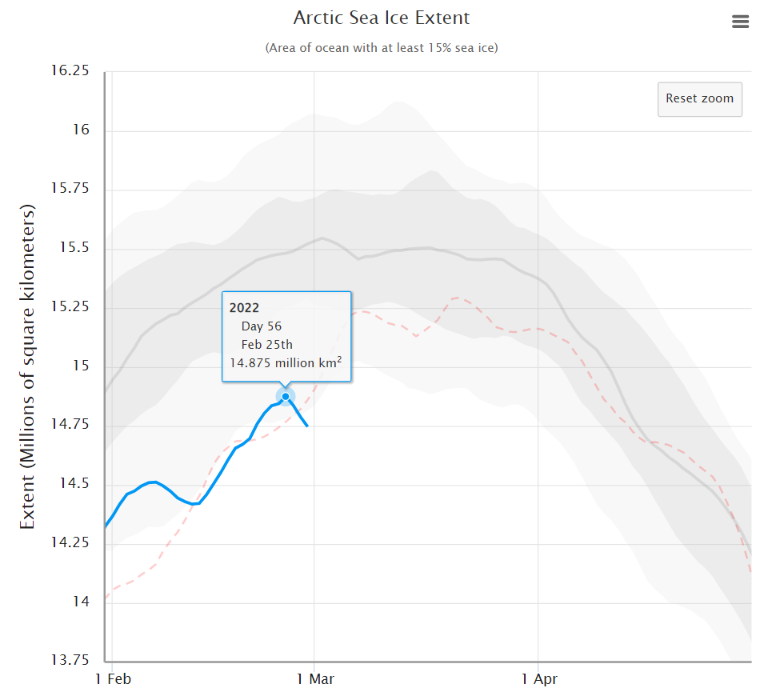
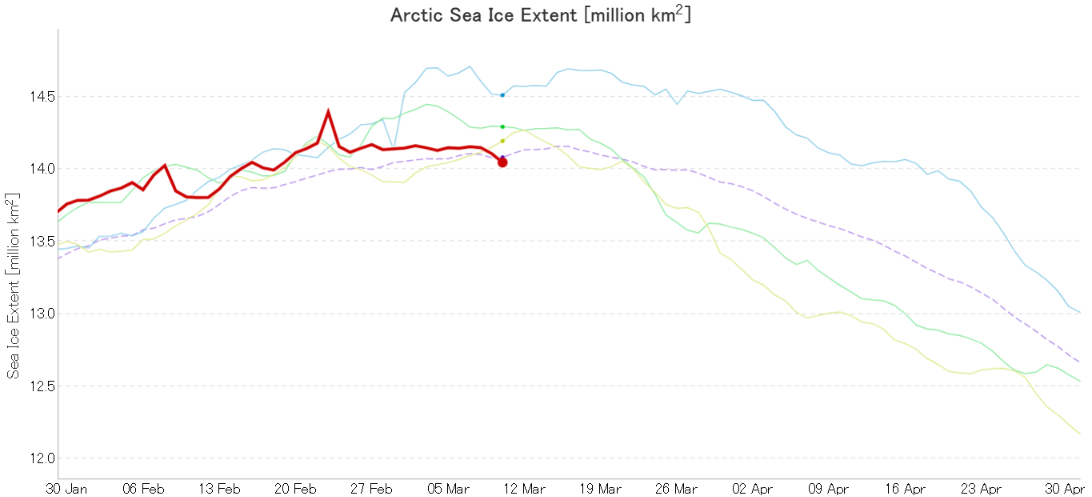
Whilst waiting for the all important thickness and volume data to arrive, we’ll start the new year in traditional fashion with a graph of JAXA extent:
The 2023 calendar year finished with this particular extent metric sitting at 15th lowest in the satellite era.
From Niall Dollard on the Arctic Sea Ice Forum comes evidence via the Sentinel 1A satellite that an arch formed in the Nares Strait between Greenland and Ellesmere Island in late December:
Since it’s a hot topic on (a)social media at the moment, here too is the Northern Hemisphere Multisensor Snow Extent at the end of 2023:
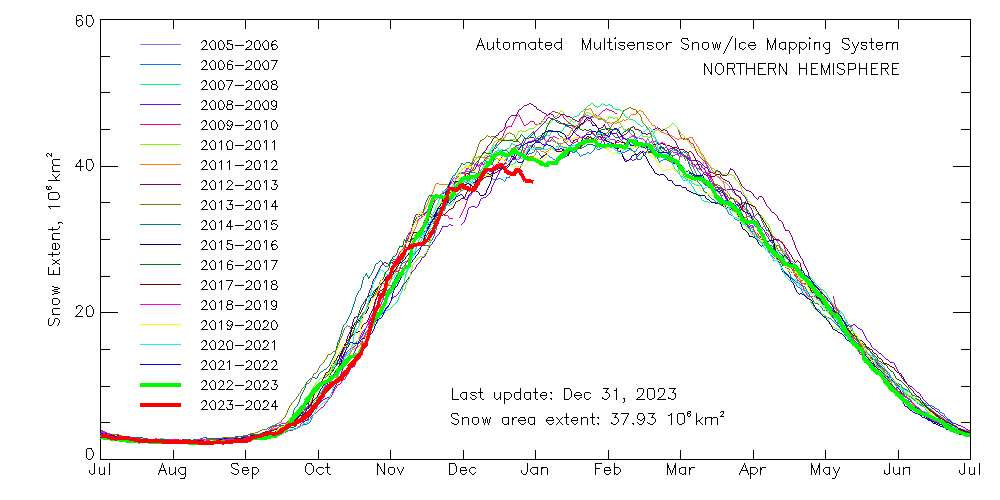
Please note the current record low NH snow extent. Matt predicts all that is about to change:
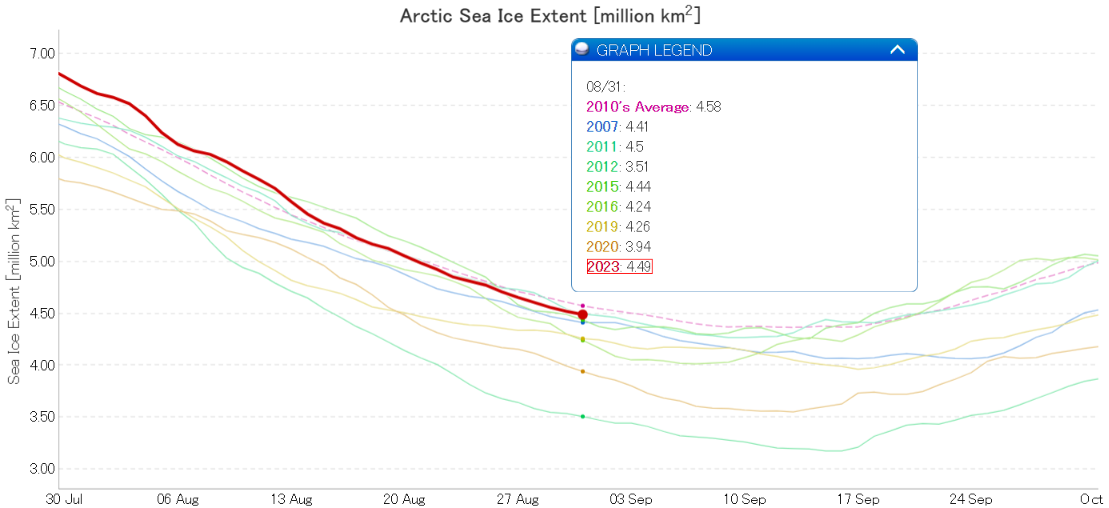
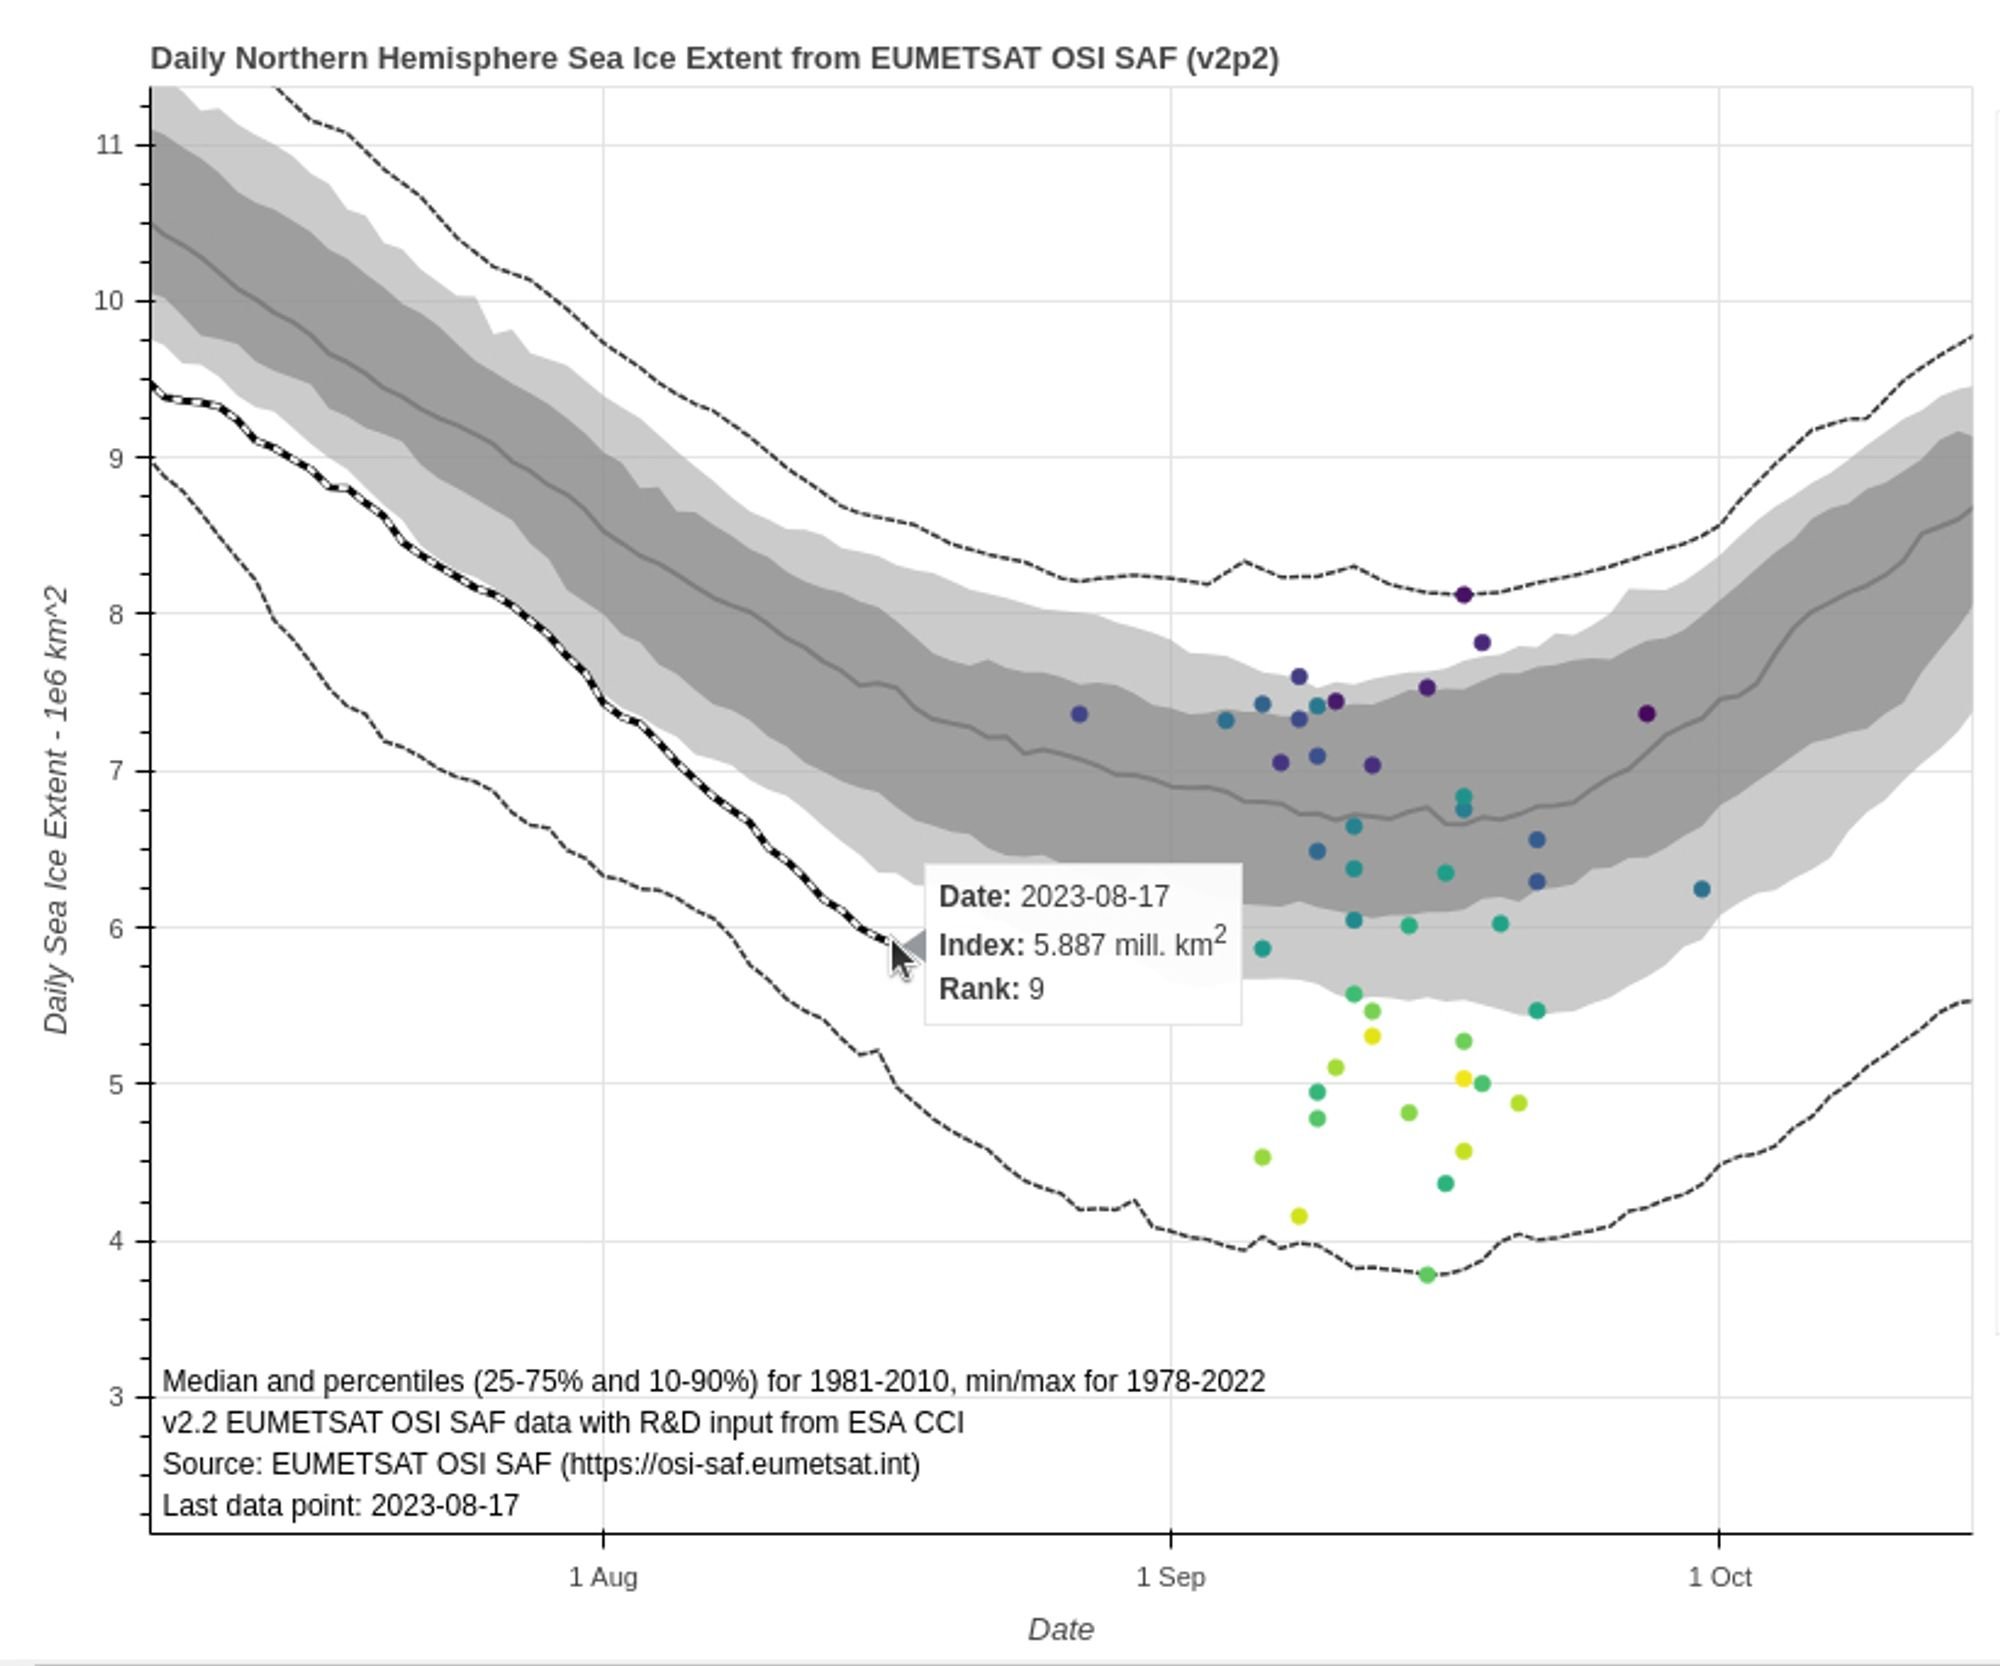
Hot off the Scandinavian virtual printing presses, here is the official December Arctic sea ice extent trend graph from the OSI SAF:
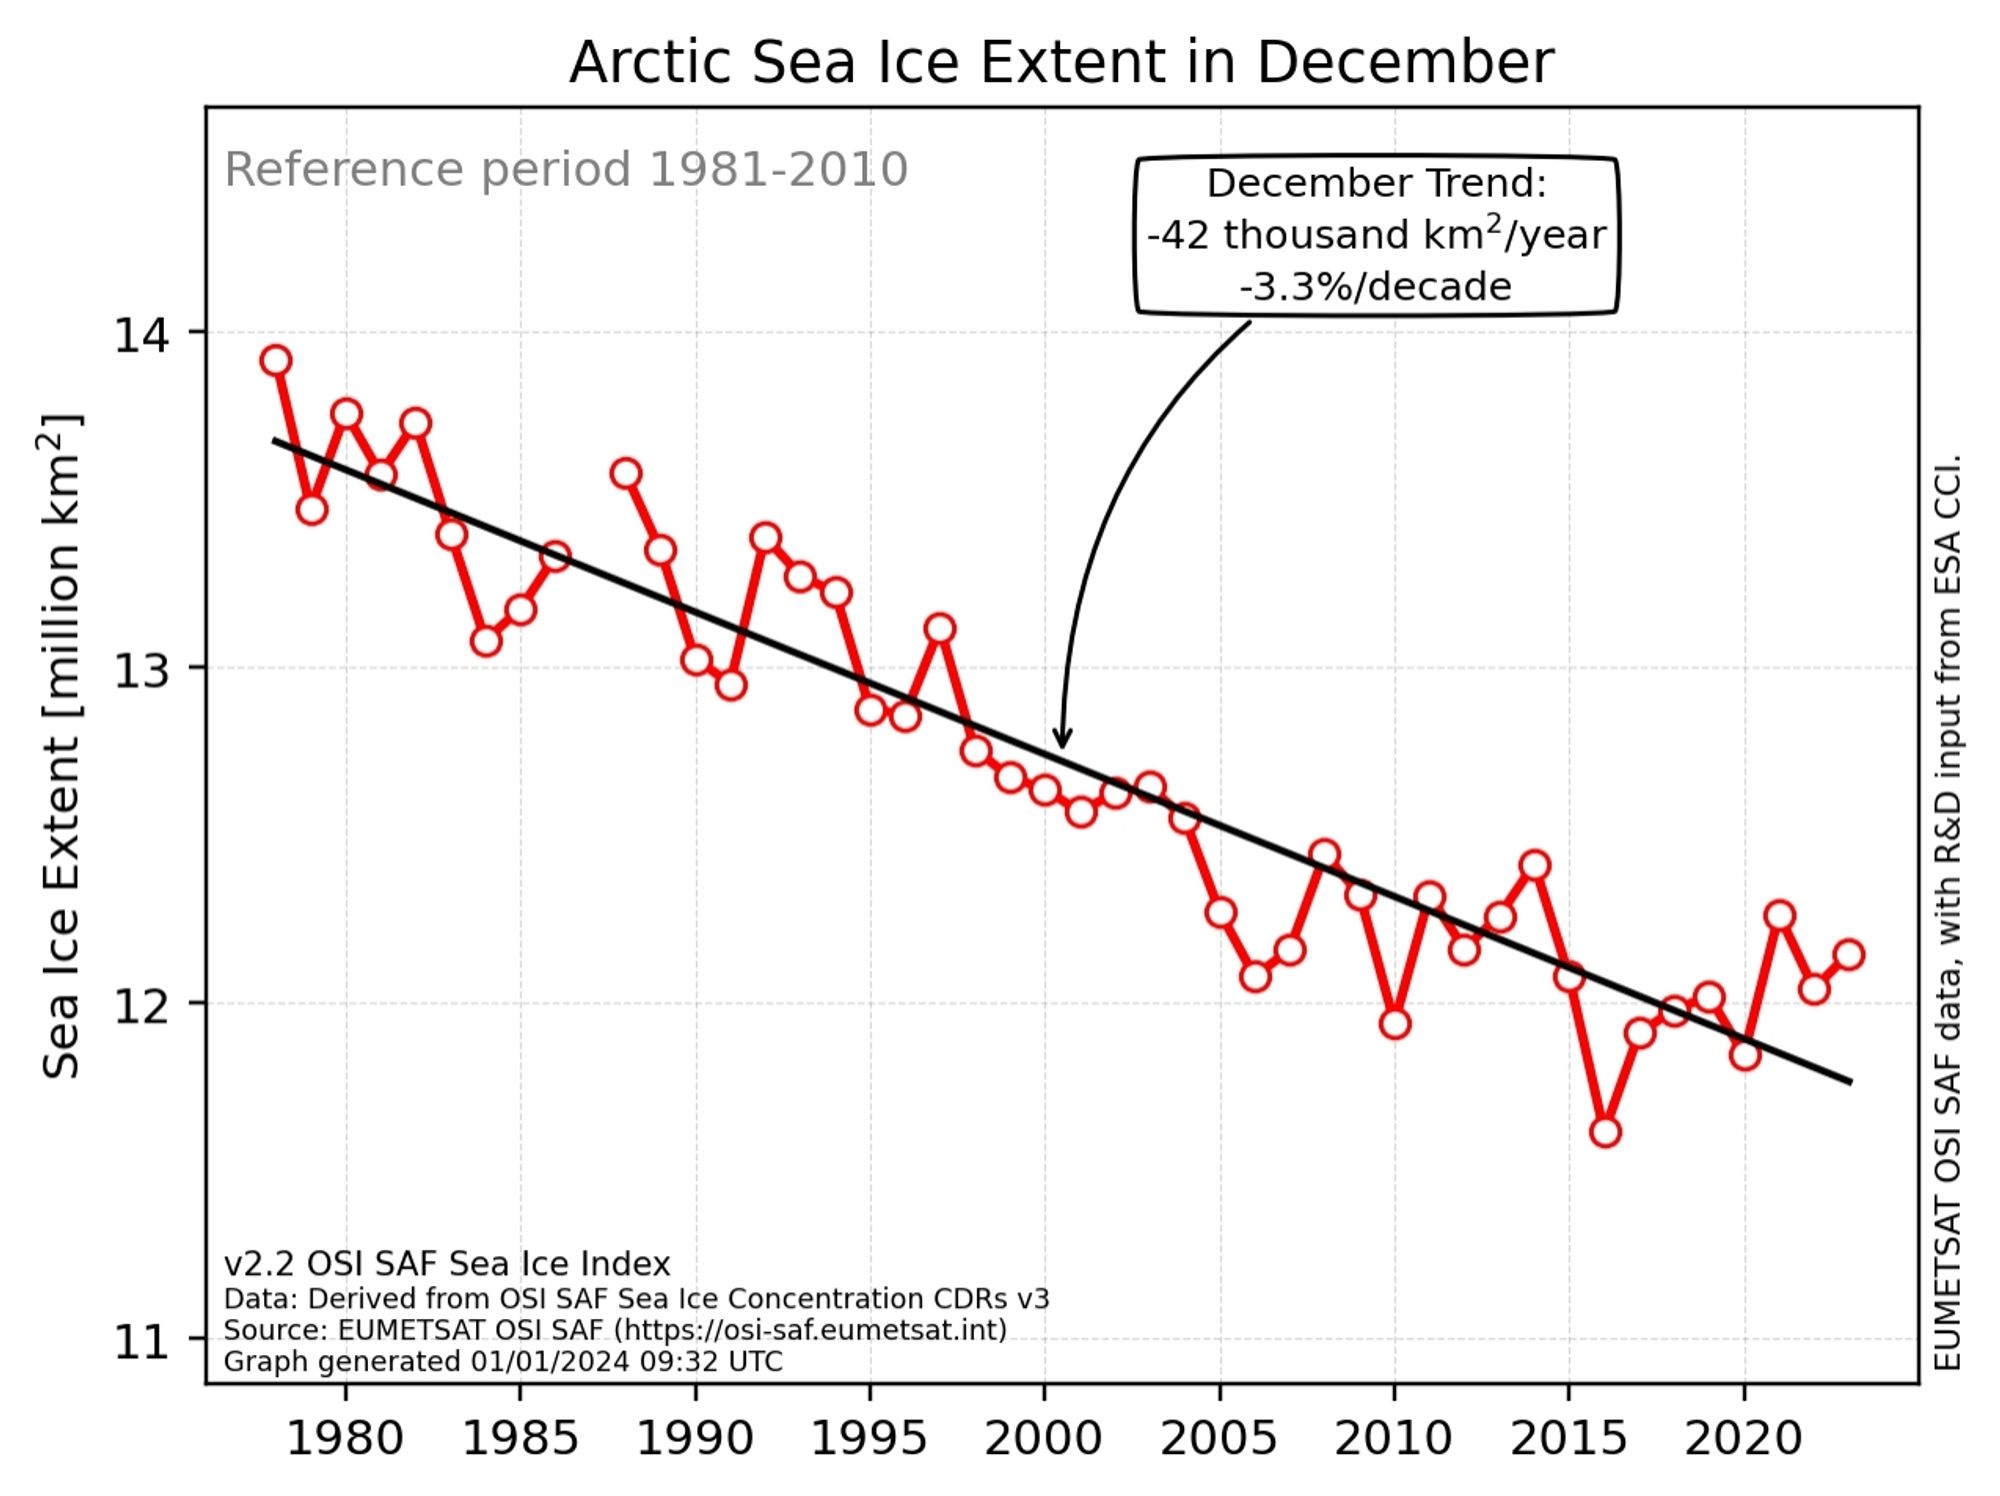
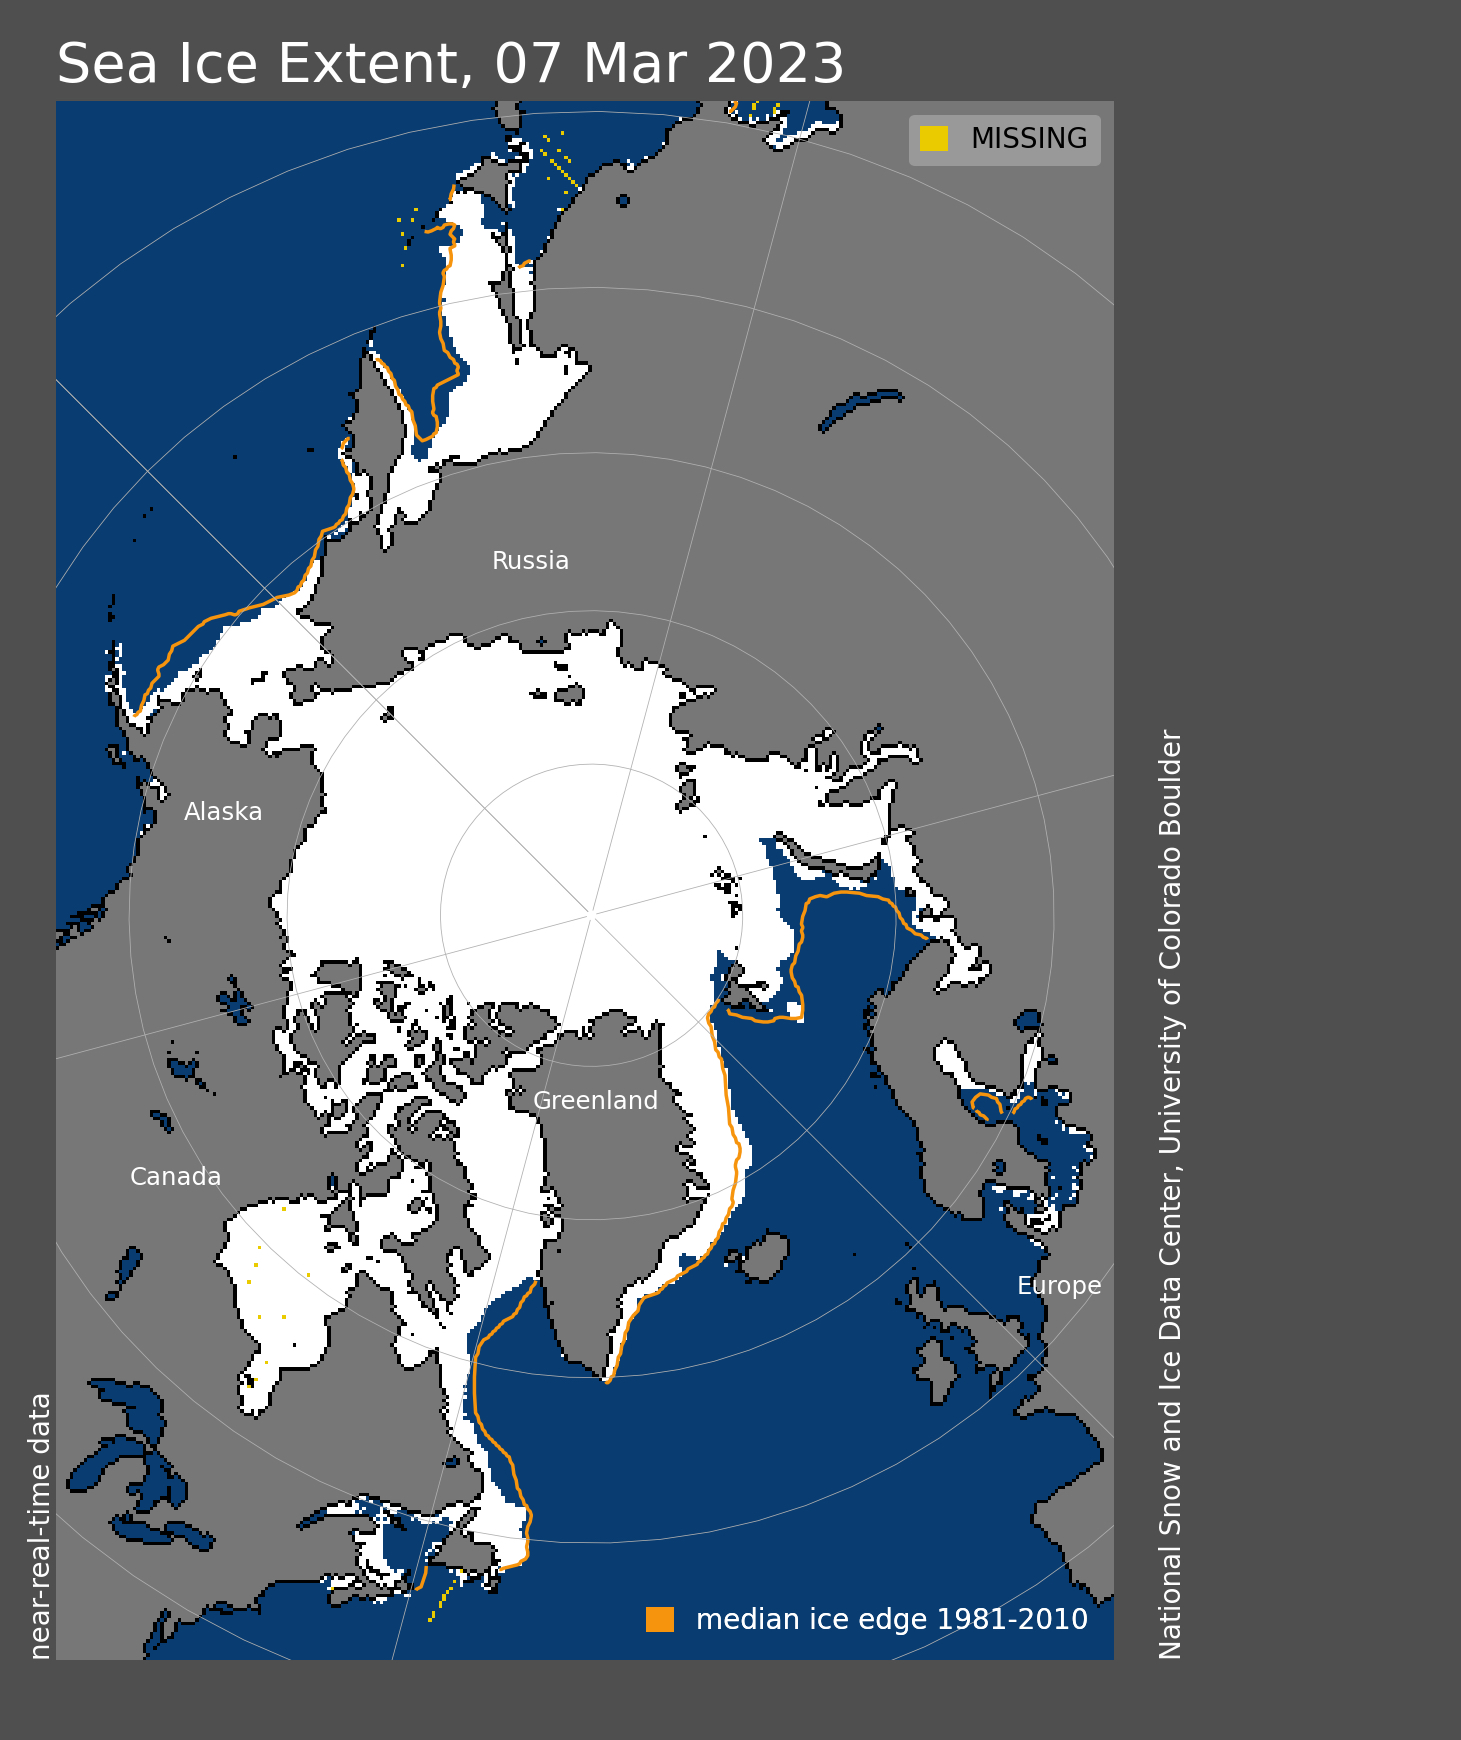
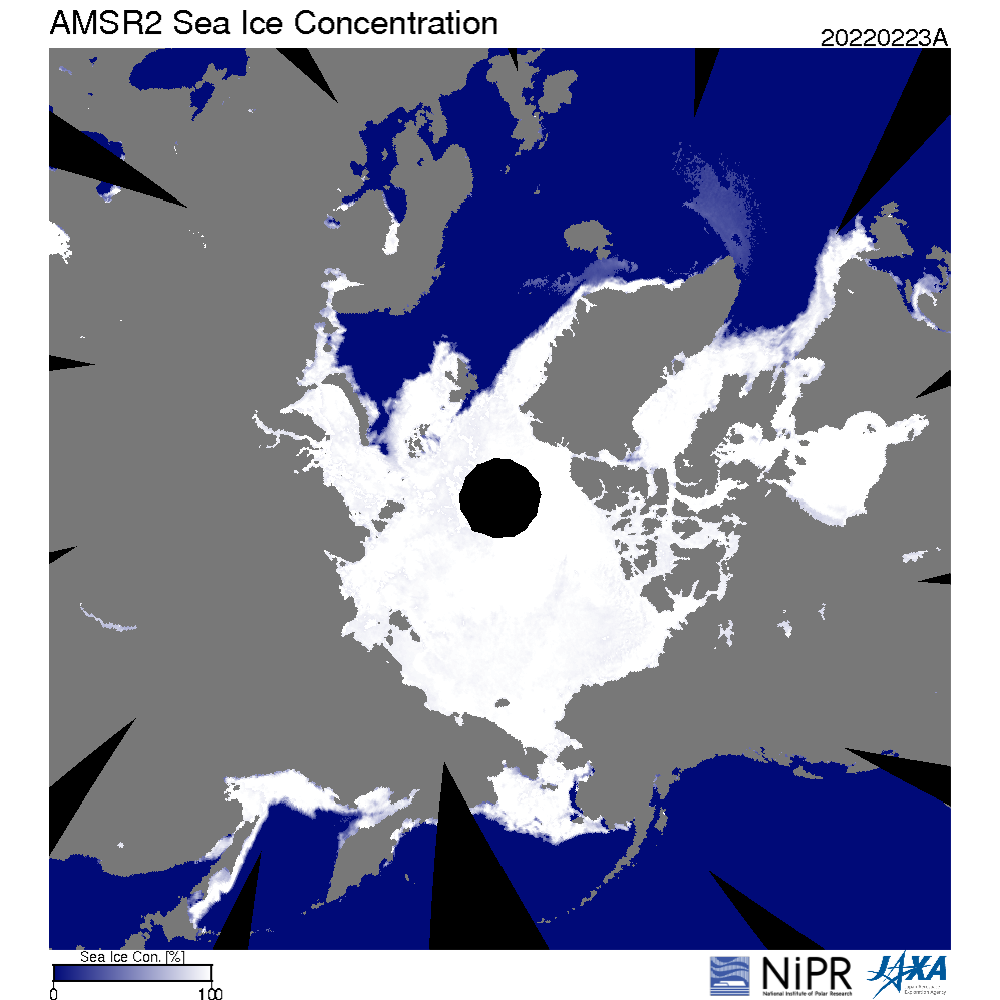
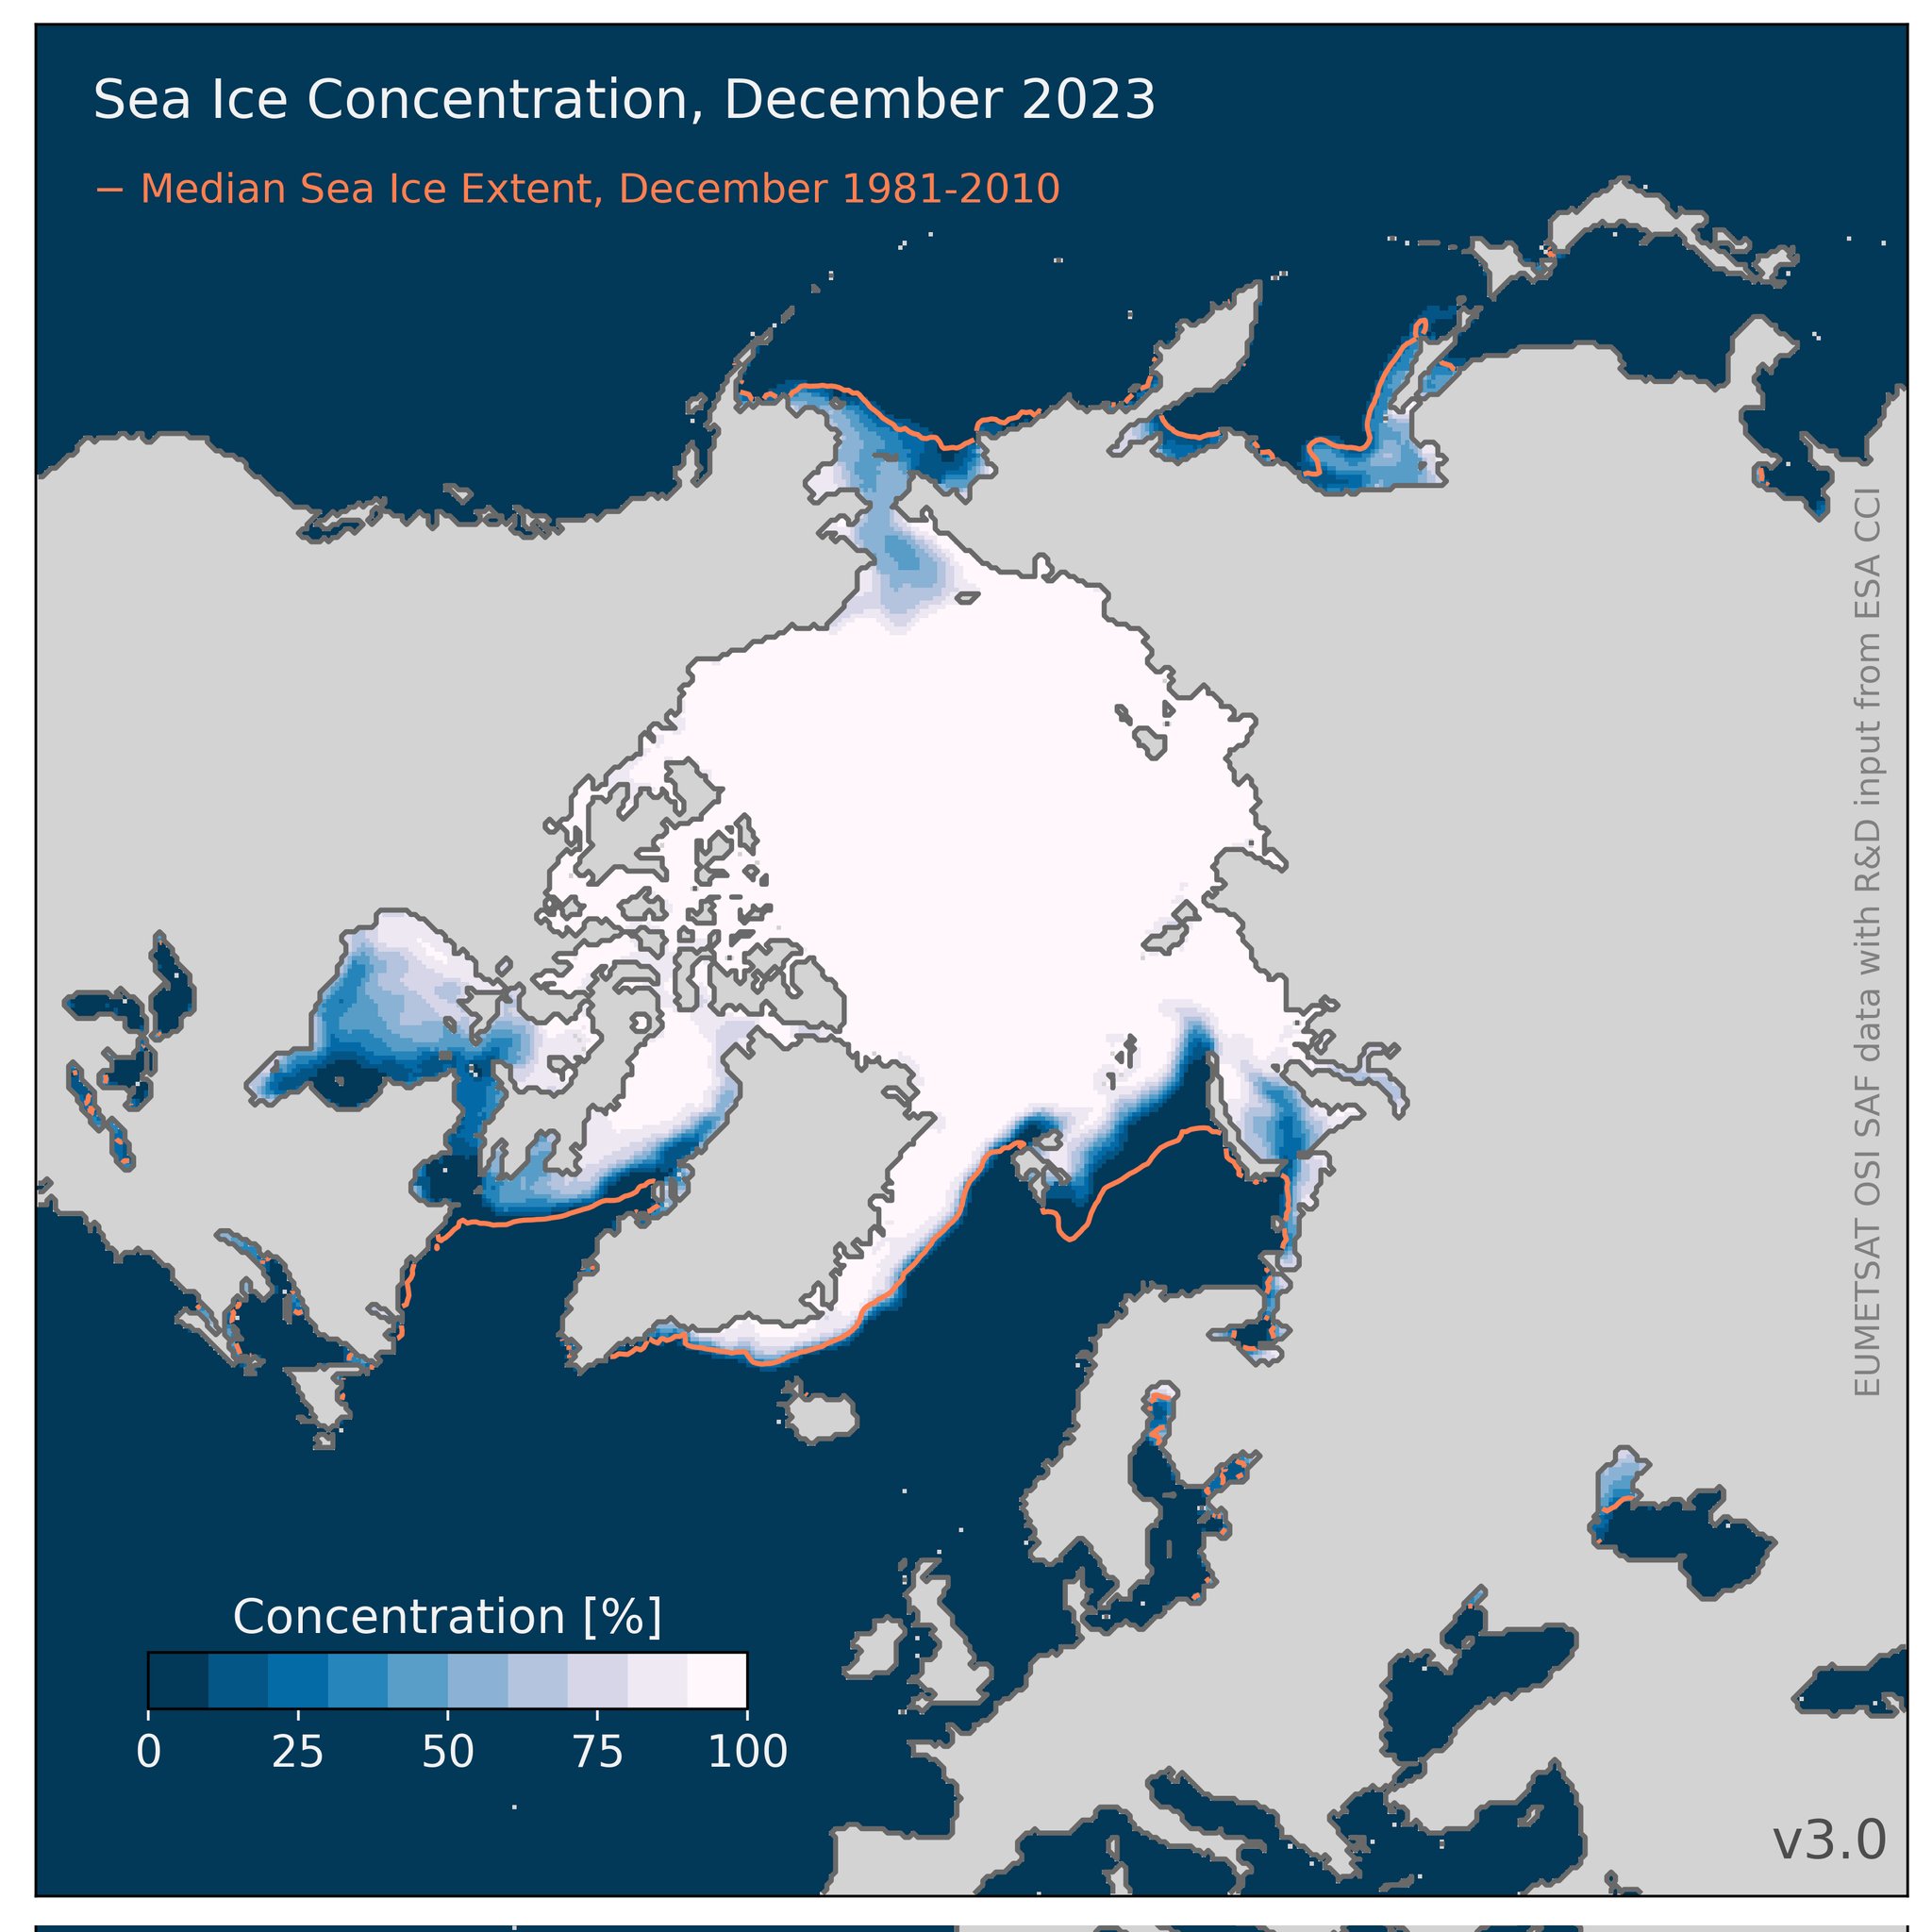
That’s “Steve”/Tony’s current metric du jour. When do you suppose he will bring it to the attention of his horde of regular readers? It’s accompanied by this matching concentration map:
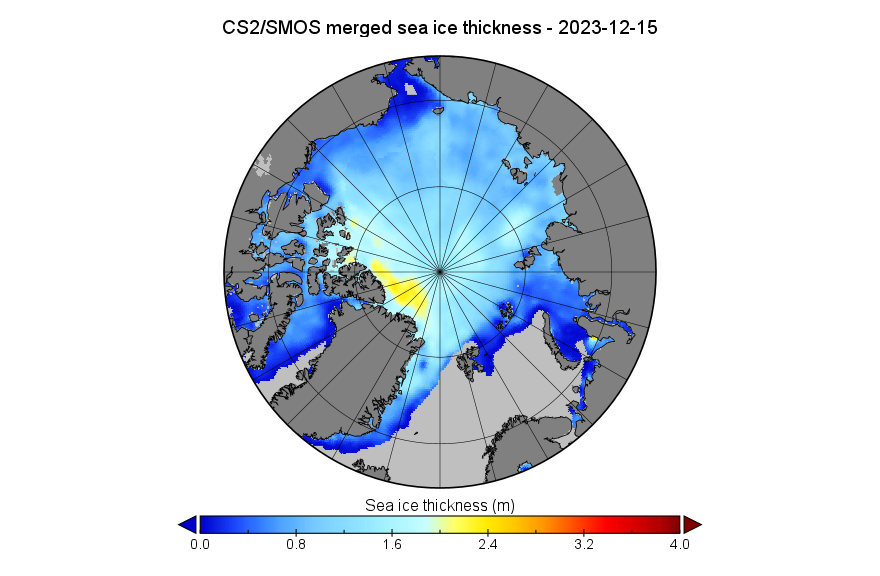
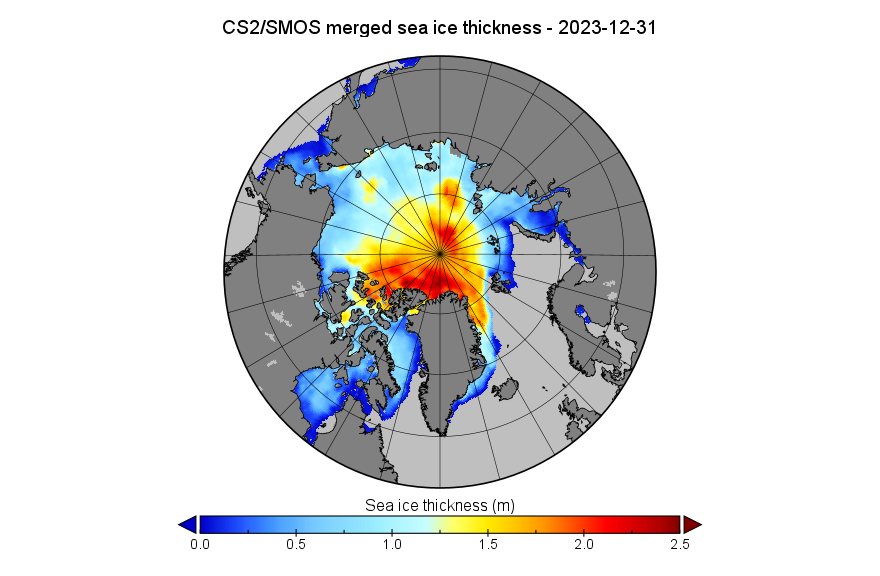
Here too is the CryoSat-2/SMOS thickness map for December 31st, in a different format to the one usually used here:
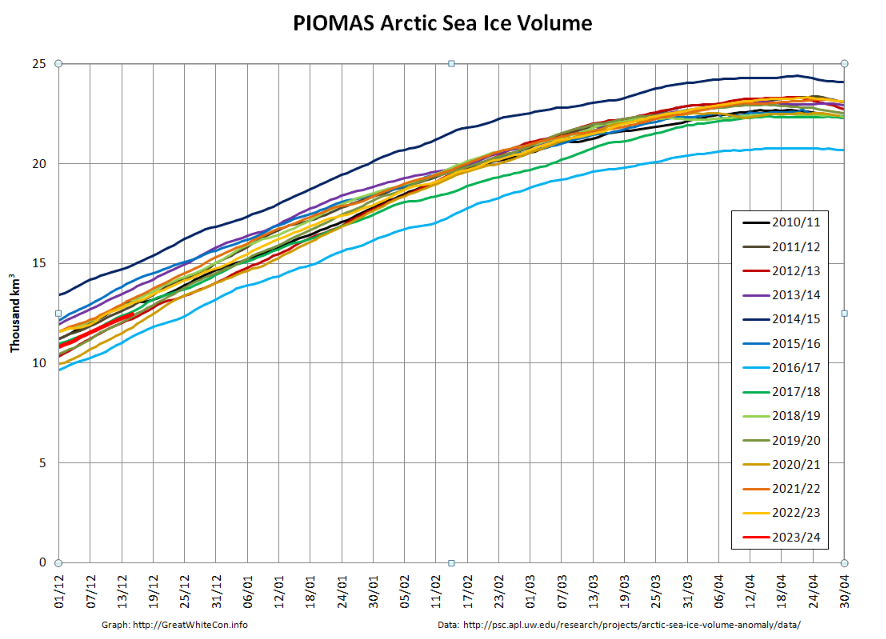
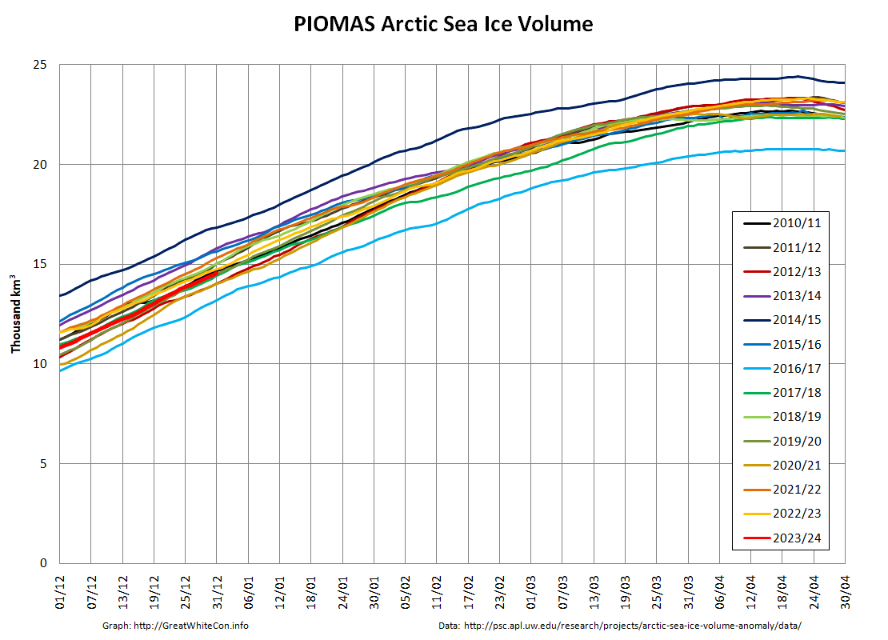
The December PIOMAS modelled gridded thickness data has been released. The calculated volume is 6th lowest in the satellite era:
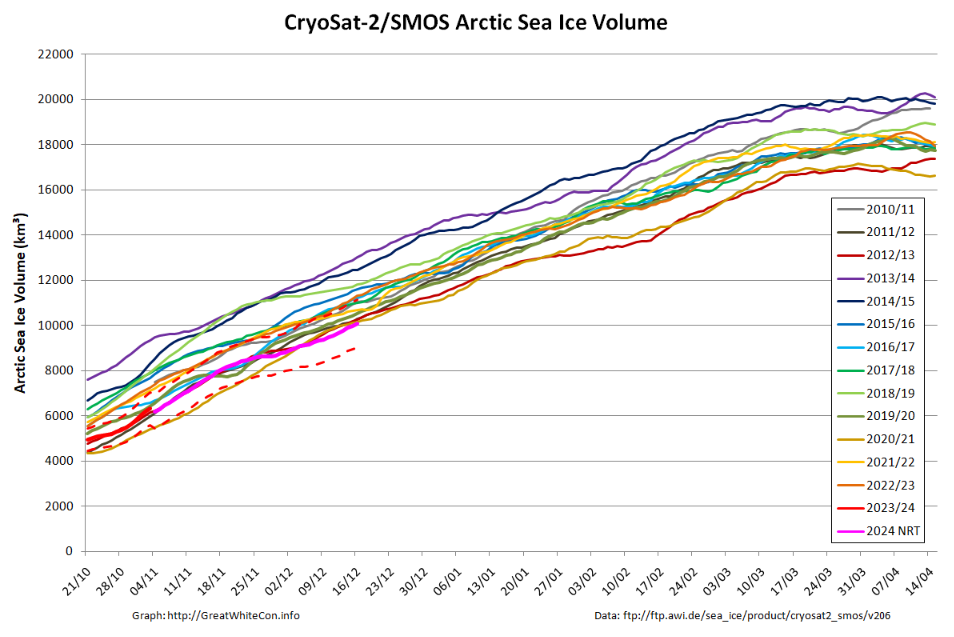
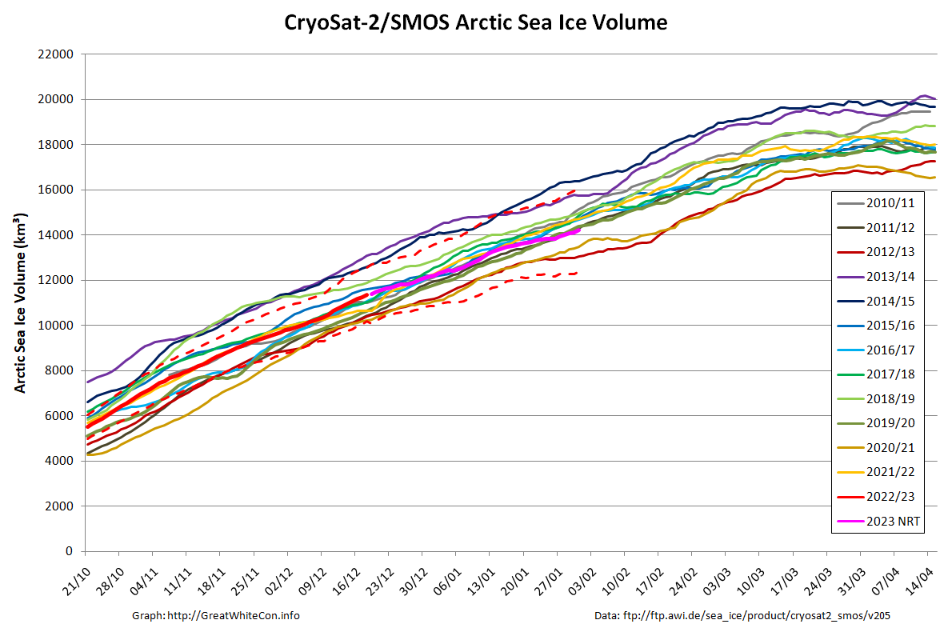
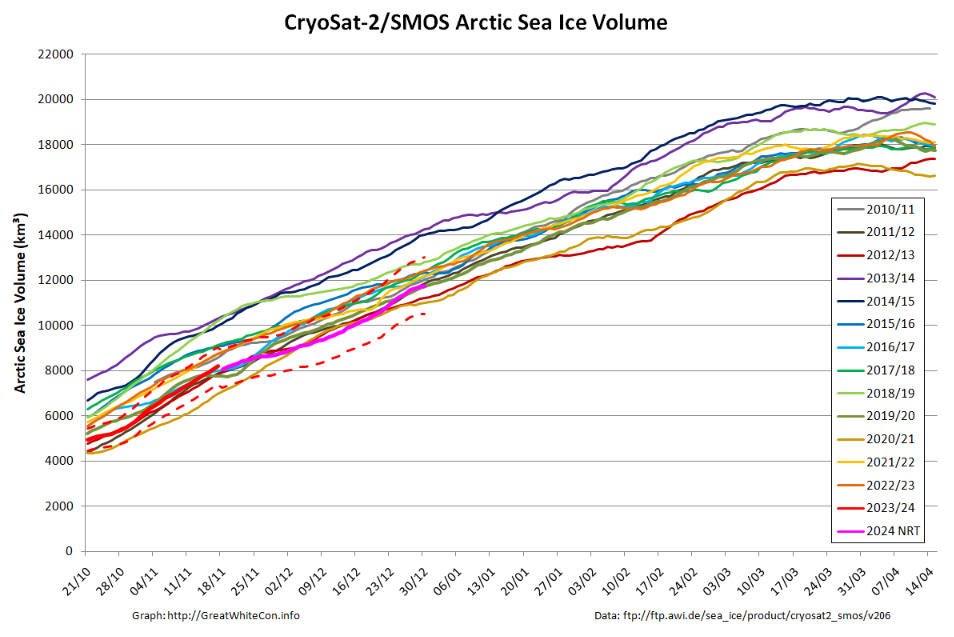
Here is the equivalent CS2/SMOS volume graph
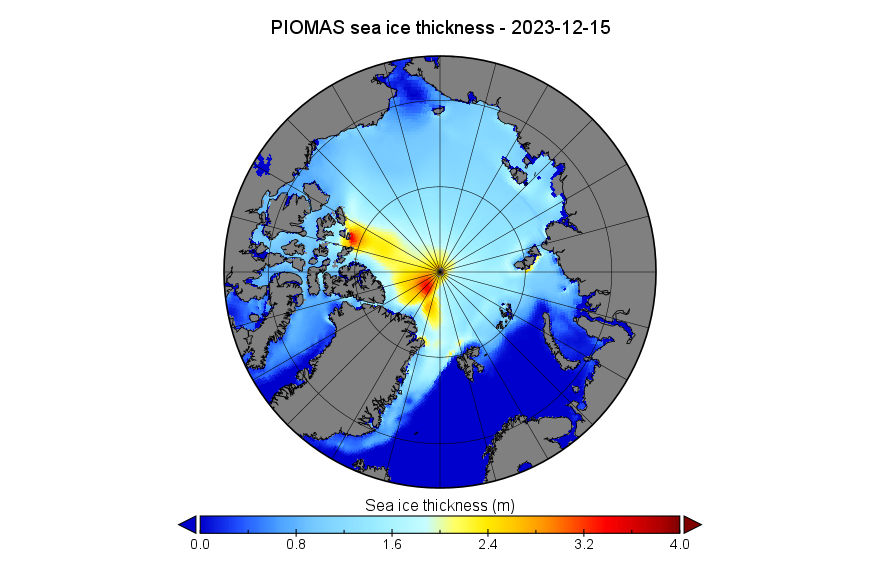
Here too is the PIOMAS thickness map for December 31st:
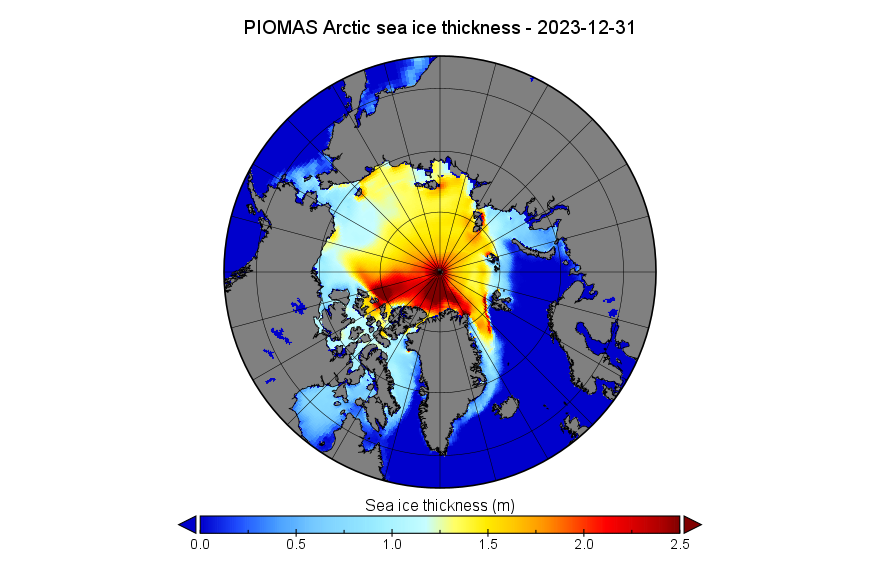
This uses the same Greenland down orientation and 2.5 meter maximum scale value as the CS2/SMOS map above.
[Update – January 6th]Here are the NSIDC area numbers from Gerontocrat on the Arctic Sea Ice Forum that Tom mentions below:
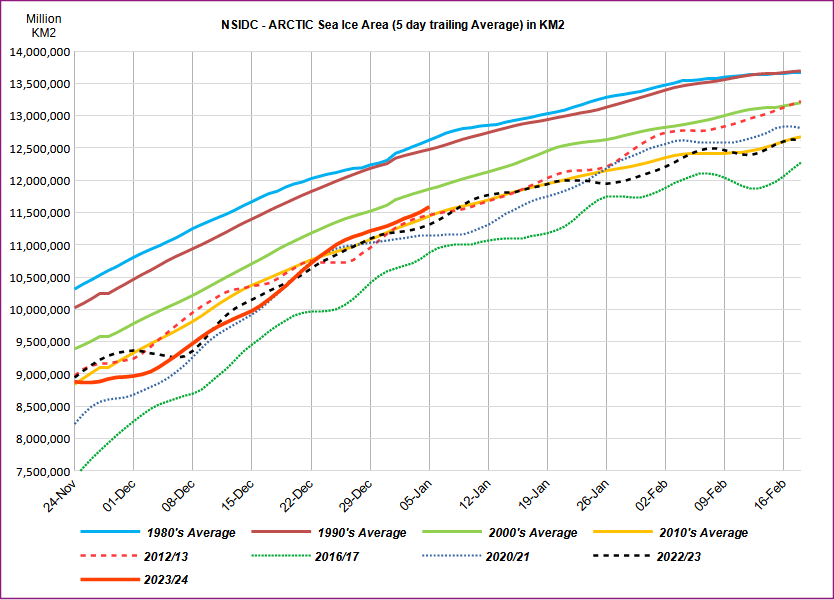
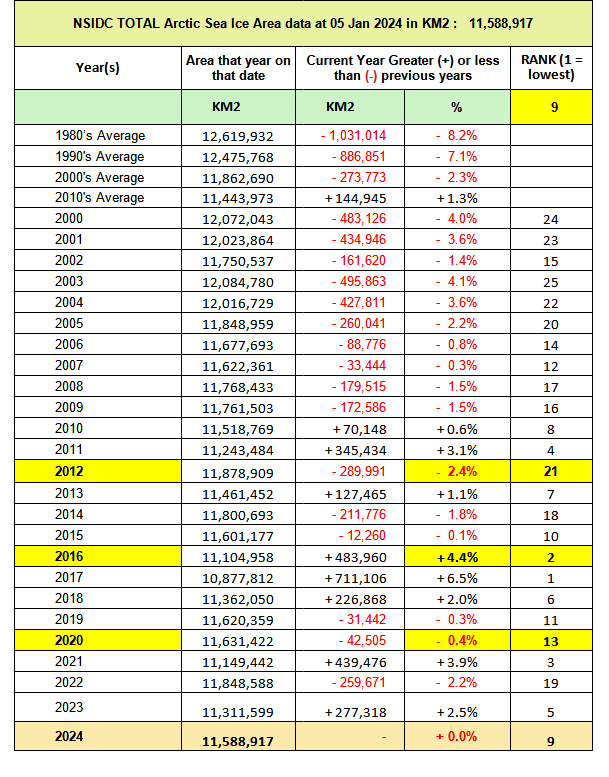
Currently 9th lowest for the date. In the satellite era!
[Update – January 8th]The National Snow and Ice Data Center has published the December edition of Arctic Sea Ice News:
The end of 2023 had above average sea ice growth, bringing the daily extent within the interdecile range, the range spanning 90 percent of past sea ice extents for the date. Rapid expansion of ice in the Chukchi and Bering Seas and across Hudson Bay was responsible.
Average Arctic sea ice extent for December 2023 was 12.00 million square kilometers, ninth lowest in the 45-year satellite record . Sea ice extent increased by an average of 87,400 square kilometers per day, markedly faster than the 1981 to 2010 average of 64,100 square kilometers per day.
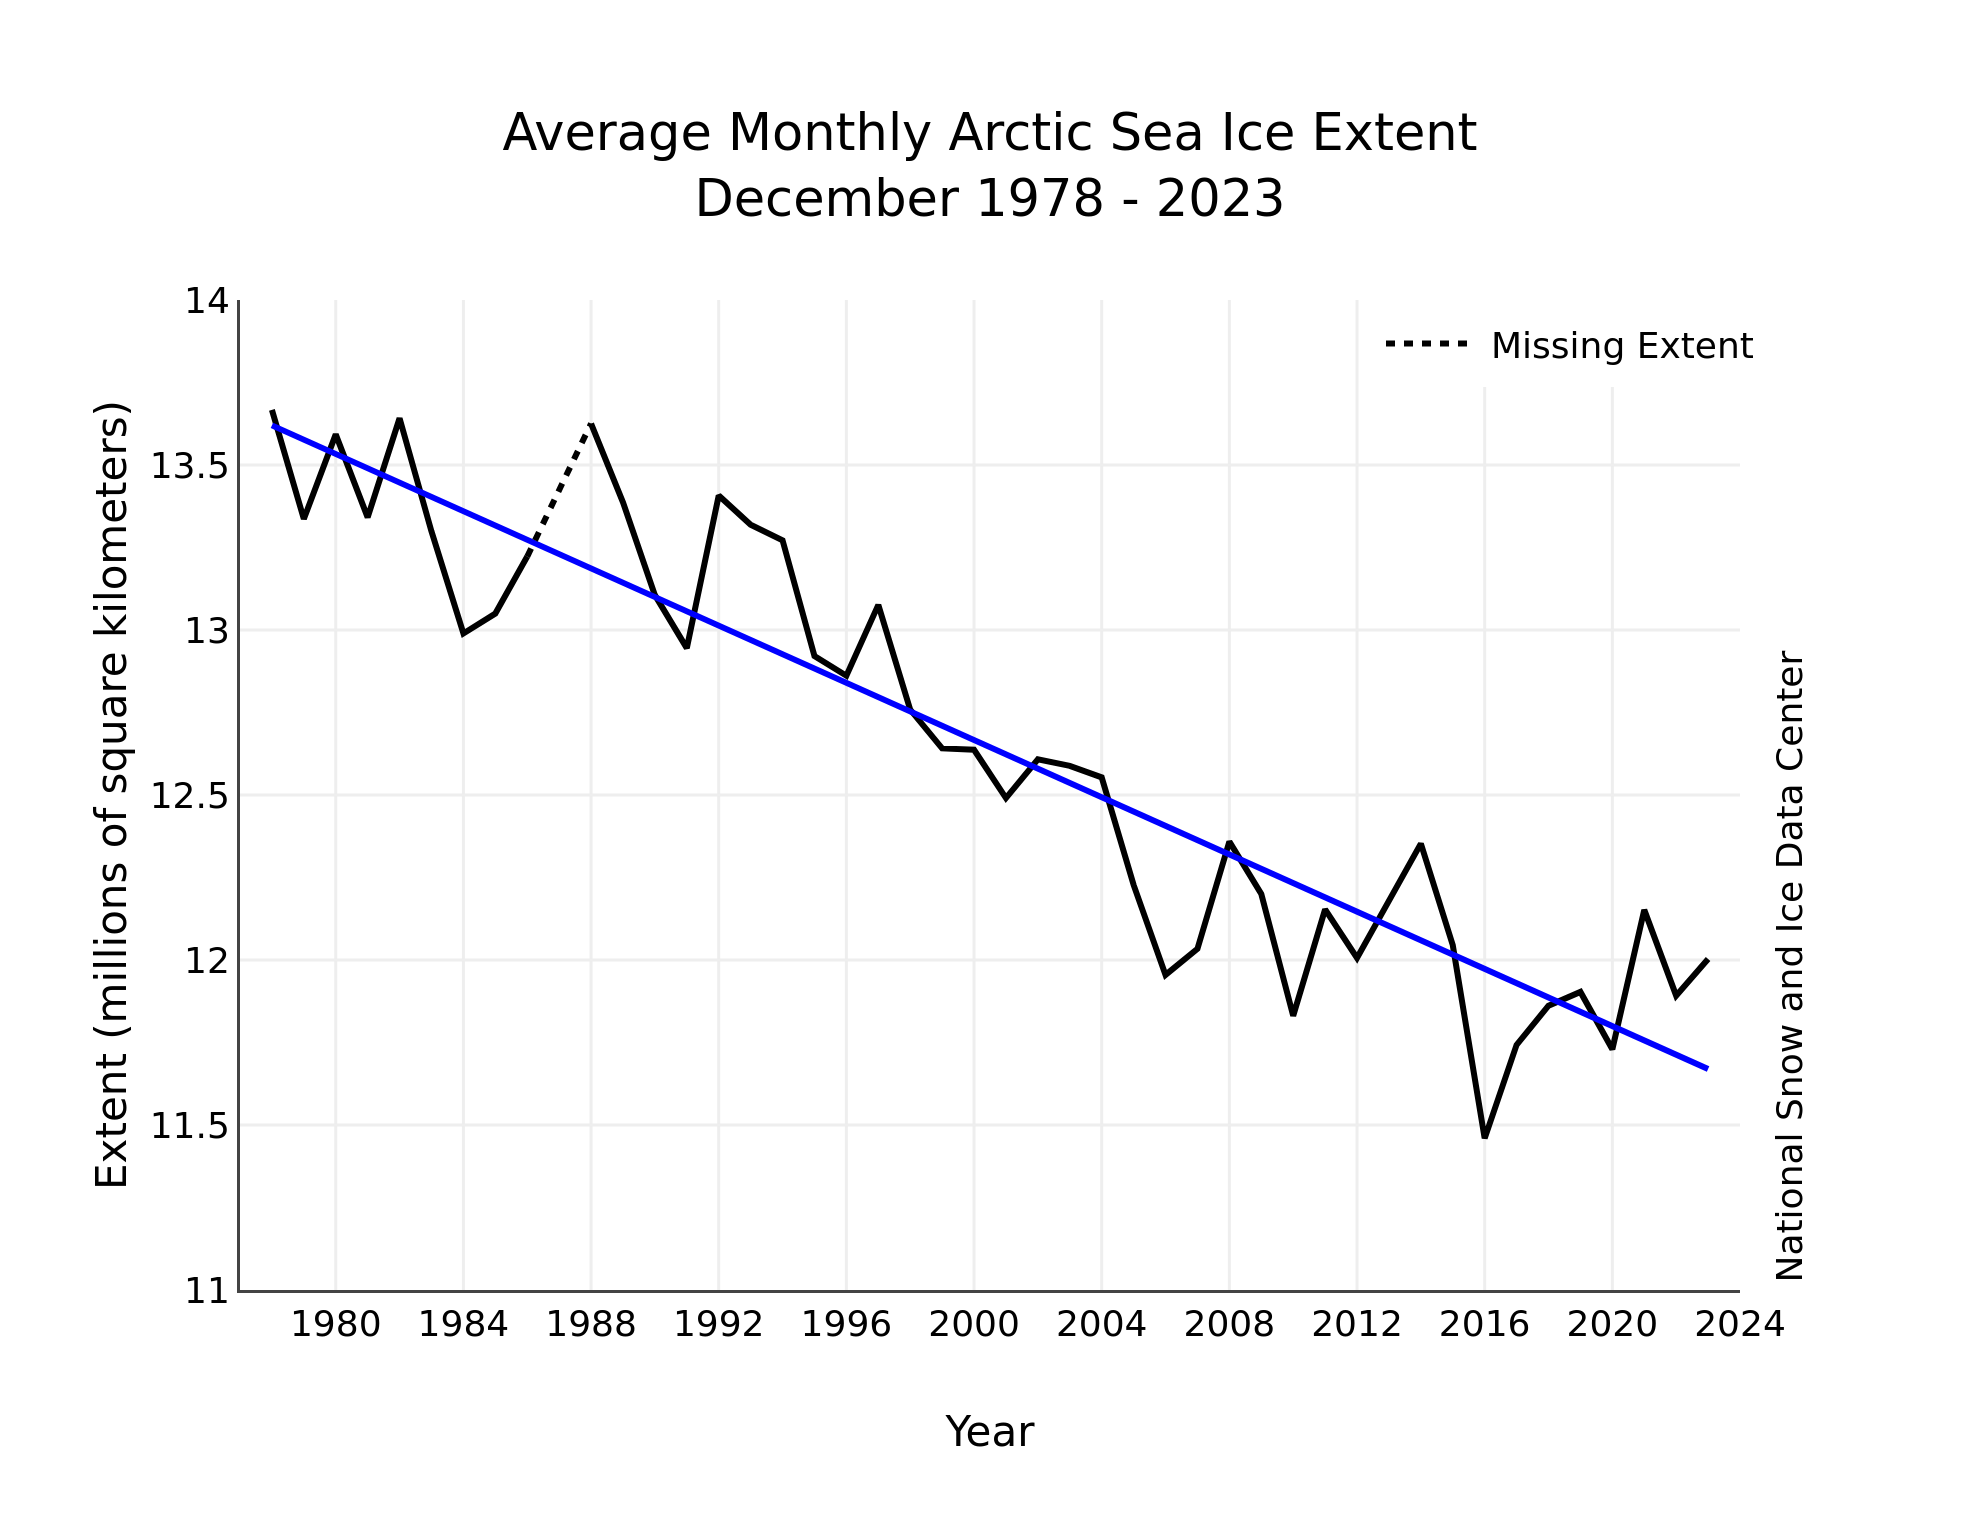
After a delayed start to the freeze-up in Hudson Bay, sea ice formed quickly from west to east across the bay, leaving only a small area of open ocean near the Belcher Islands at month’s end. In the northern Atlantic, sea ice extent remained below average extent, as has been typical for the past decade.
For December overall, 2023 had the third highest monthly gain in the 45-year record at 2.71 million square kilometers, behind 2006 at 2.85 million square kilometers and 2016 at 2.78 million square kilometers.
Moving on to the “Conditions in context” section:
Warm conditions prevailed over the central Arctic Ocean and Beaufort Sea regions, as well as over Hudson Bay and much of northern Canada, with air temperatures at the 925 millibar level (around 2,500 feet above sea level) 8 to 9 degrees Celsius above the 1991 to 2020 average. Elsewhere, relatively cool conditions prevailed, with air temperatures 2 to 4 degrees Celsius below average in southwestern Alaska, easternmost Russia, Scandinavia, and southeast Greenland. Cool conditions in the Bering and southern Chukchi Seas explain the rapid ice growth there. By contrast, the warm conditions over Hudson Bay, continuing since November, explain its delayed start of ice formation there.
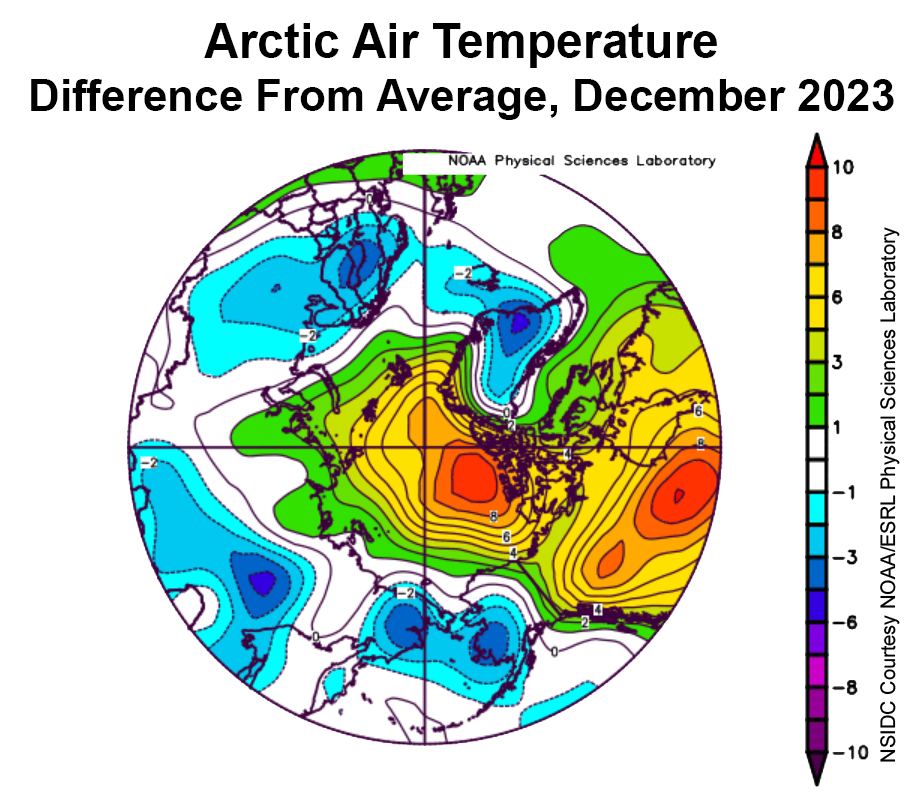
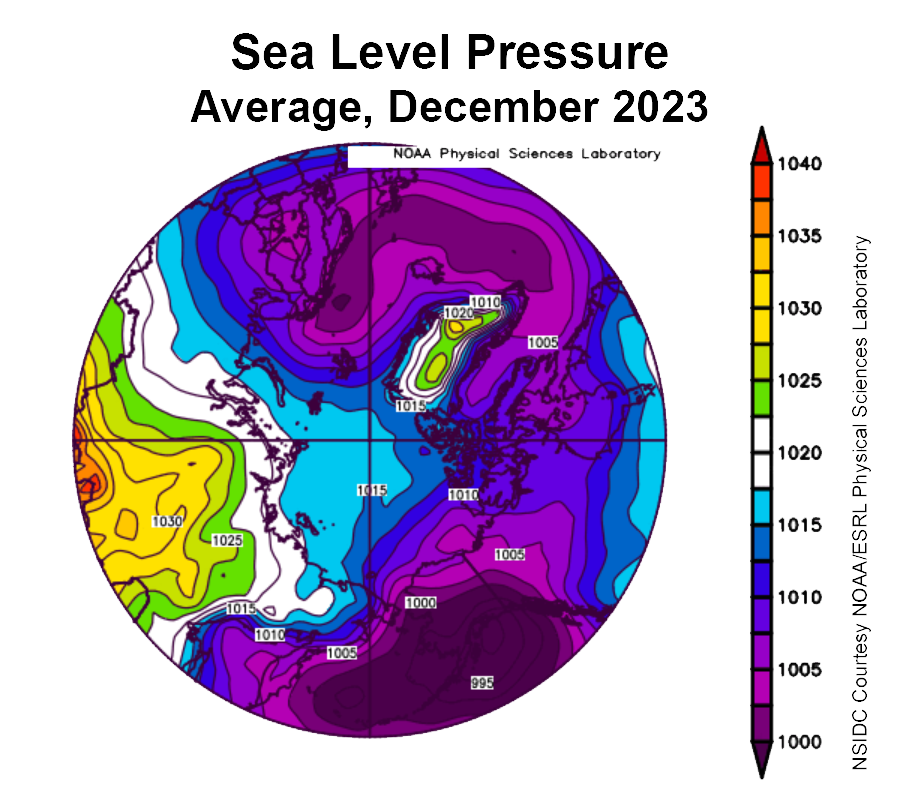
The atmospheric circulation pattern for December was marked by low sea level pressure over the Gulf of Alaska and northern Europe and high sea level pressure over central Russia. This pattern led to cold Arctic air flowing across the Chukchi Sea and into the Bering Sea as well as advection of relatively warm air across Canada into the Beaufort Sea:
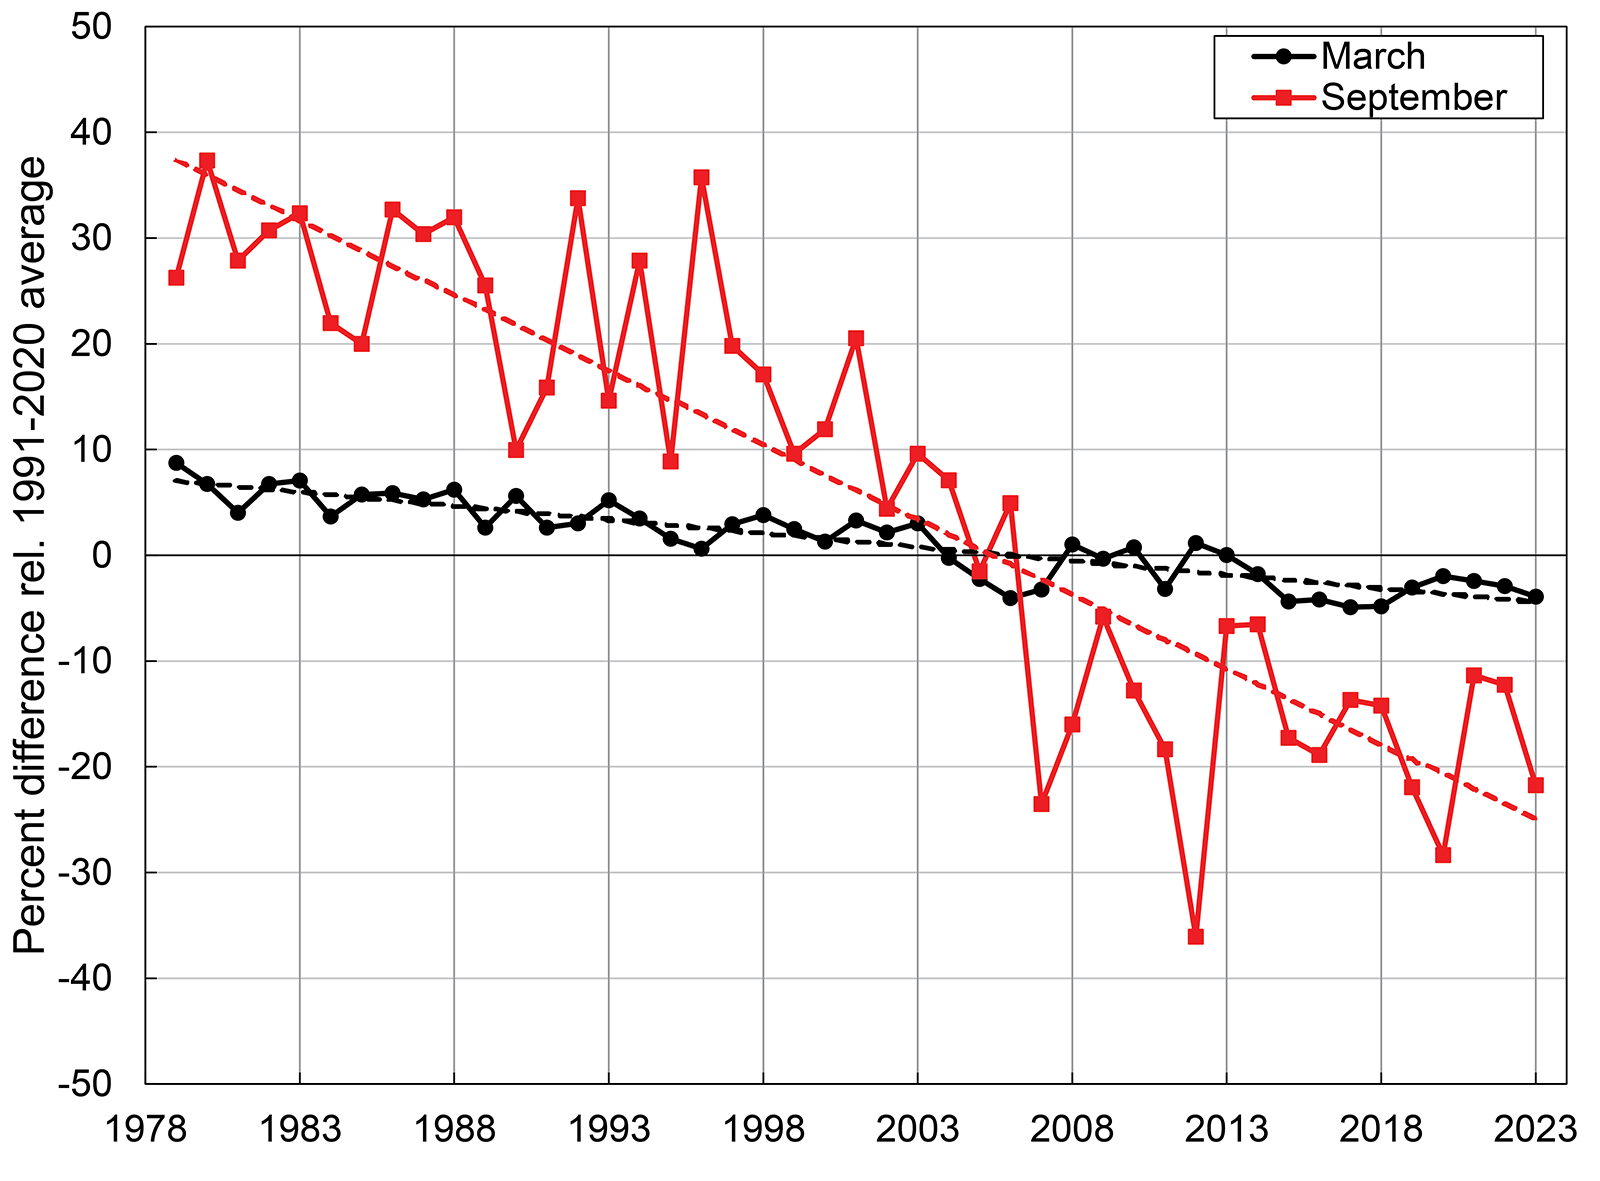
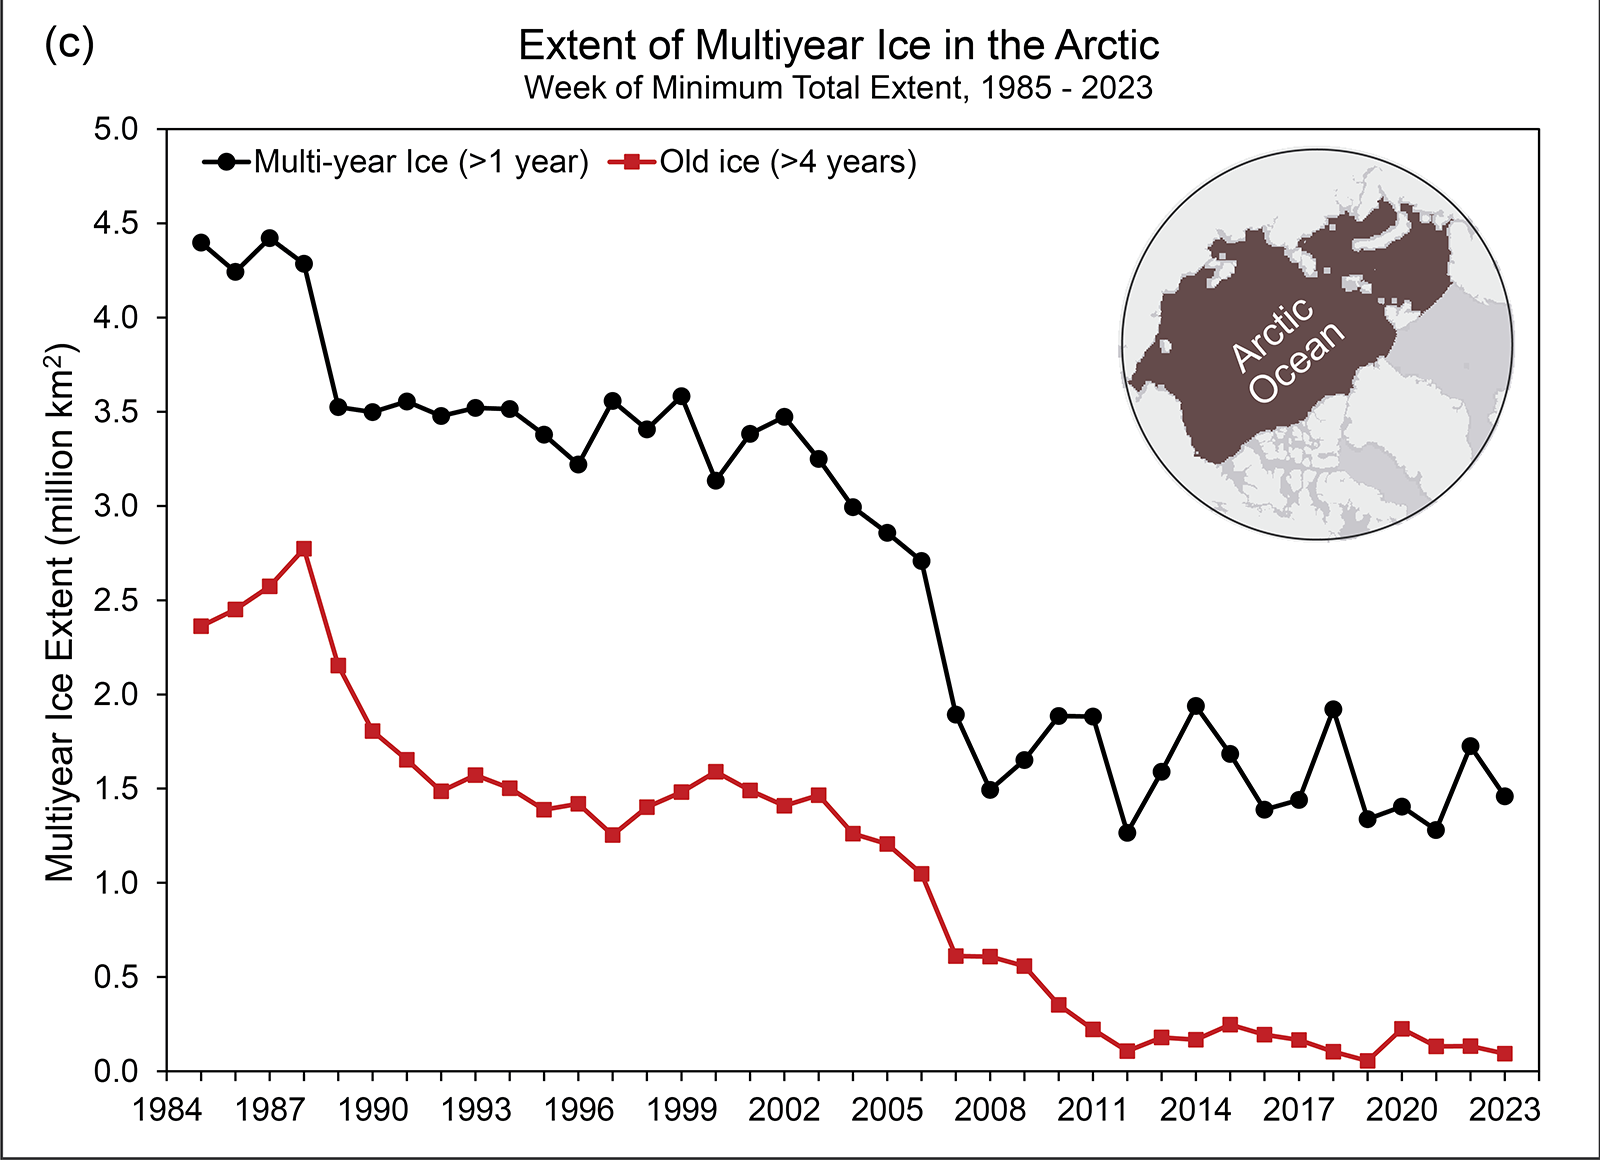
NOAA have published the 2023 Arctic Report Card.
Here’s a taste, but there’s much more at the dedicated article linked to above:
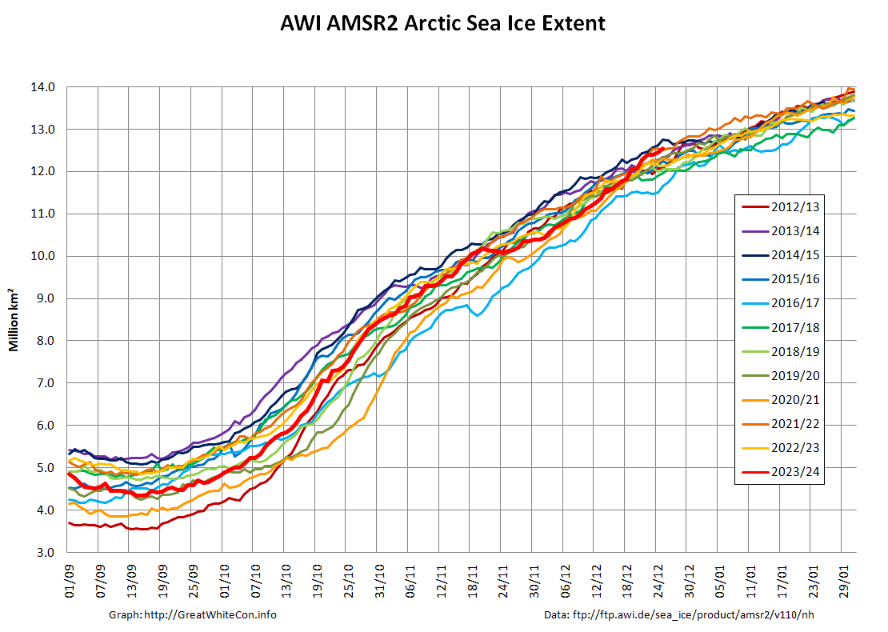
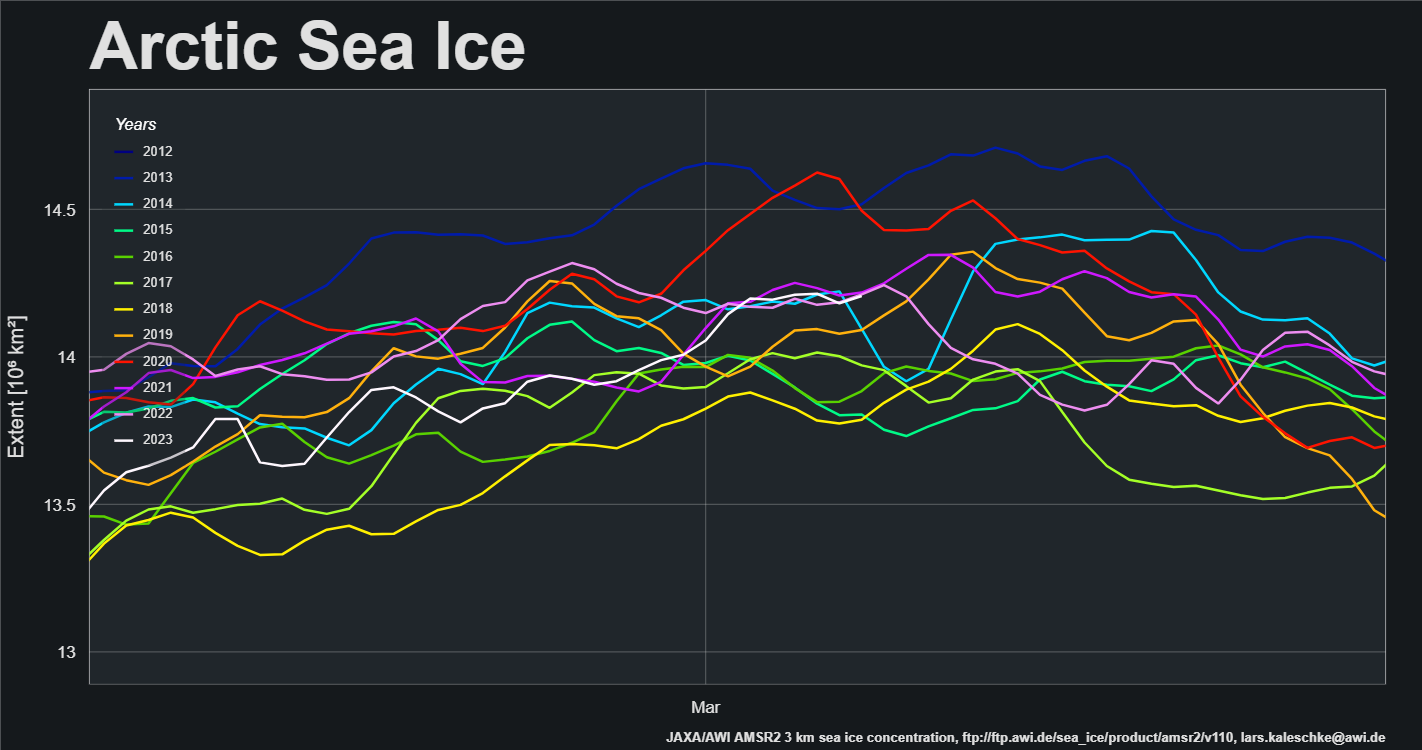
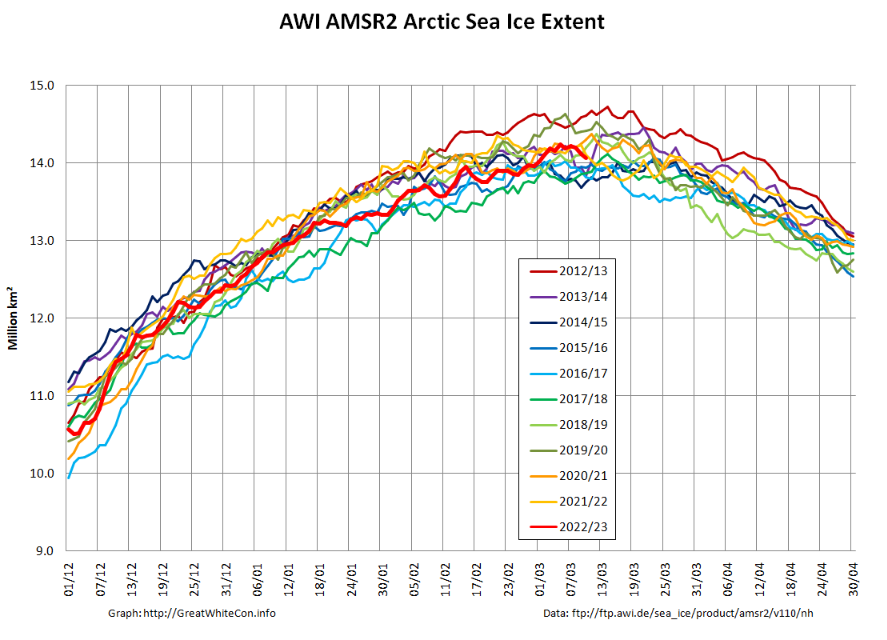
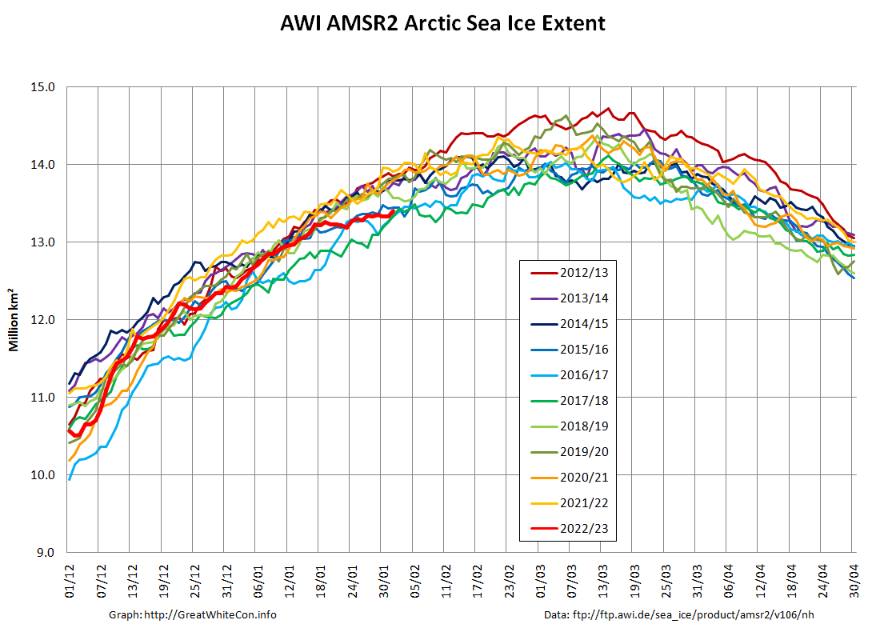
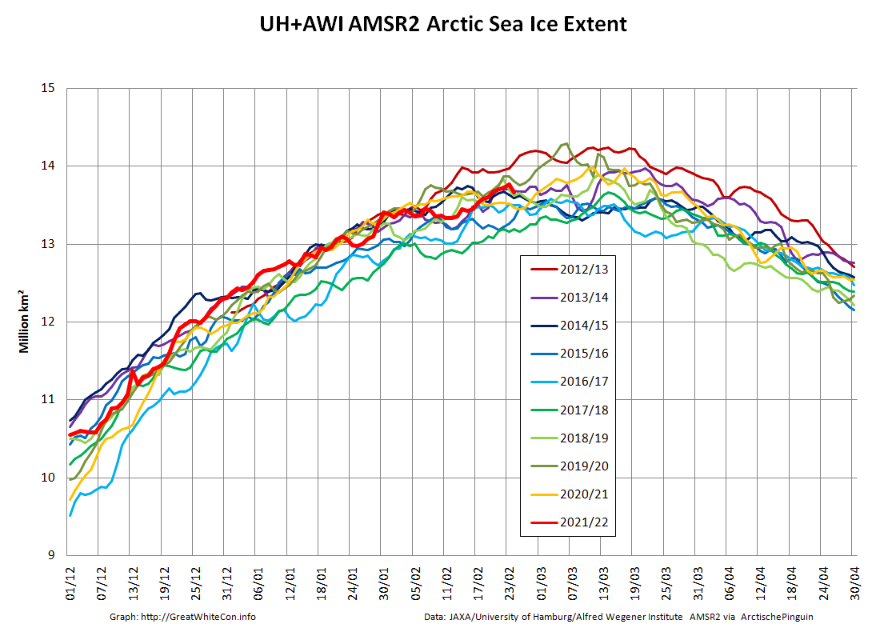
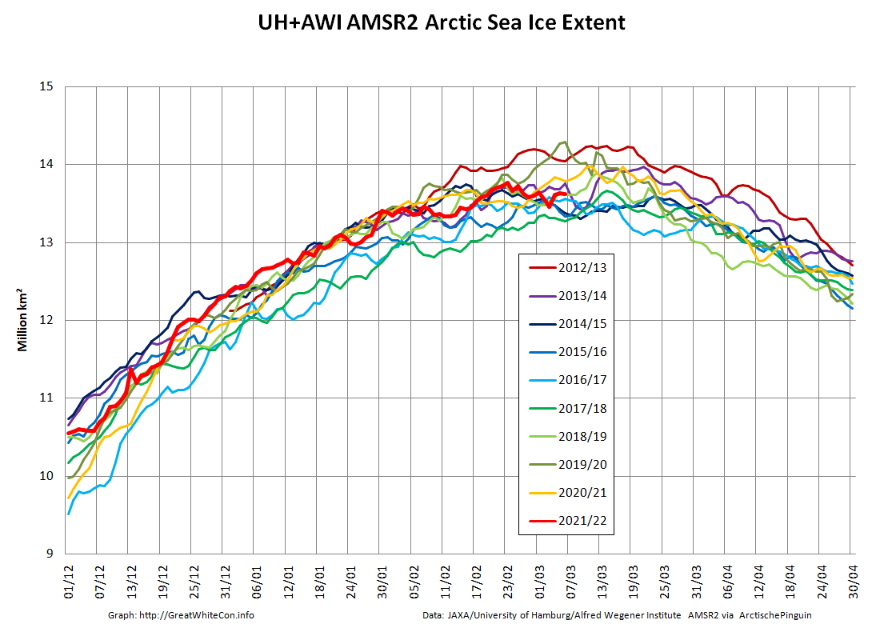
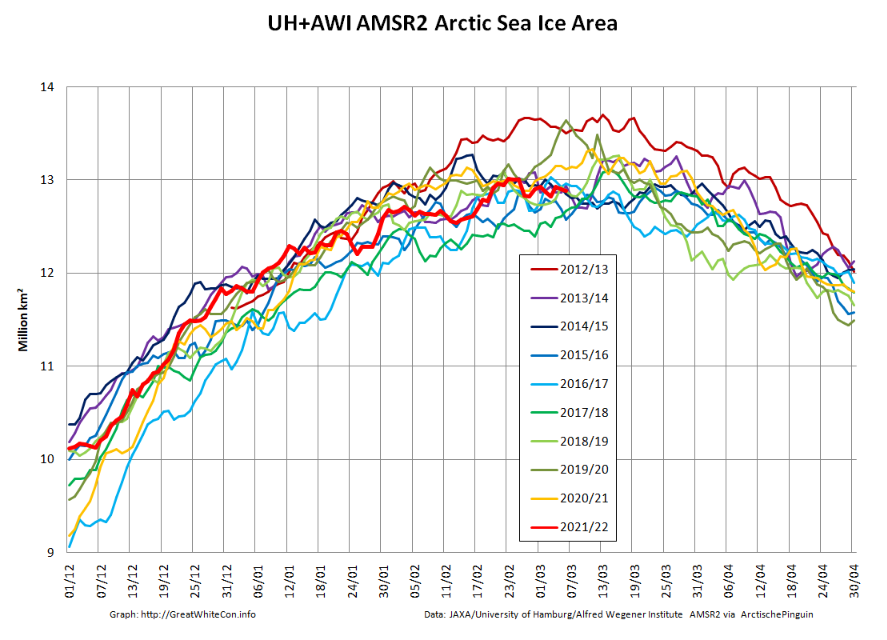
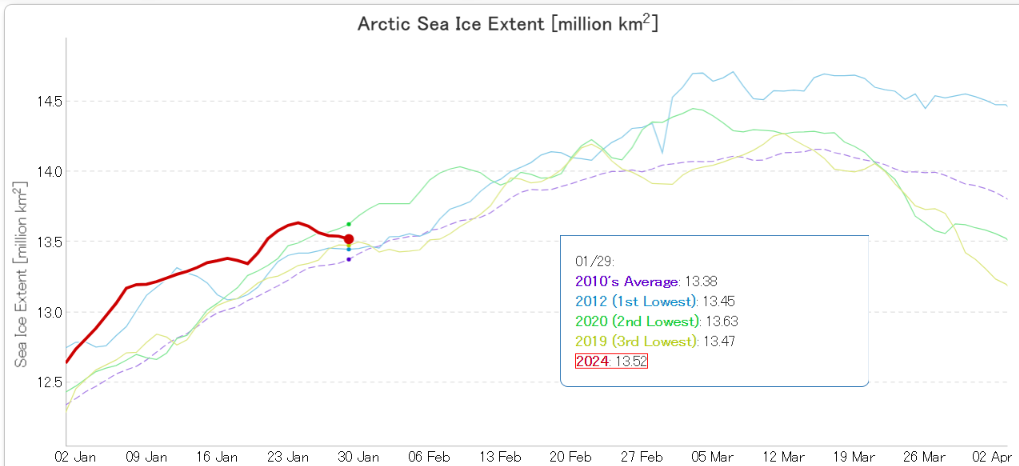
A change is as good as a rest, so here’s the AWI “high resolution” AMSR2 Arctic wide sea ice extent graph
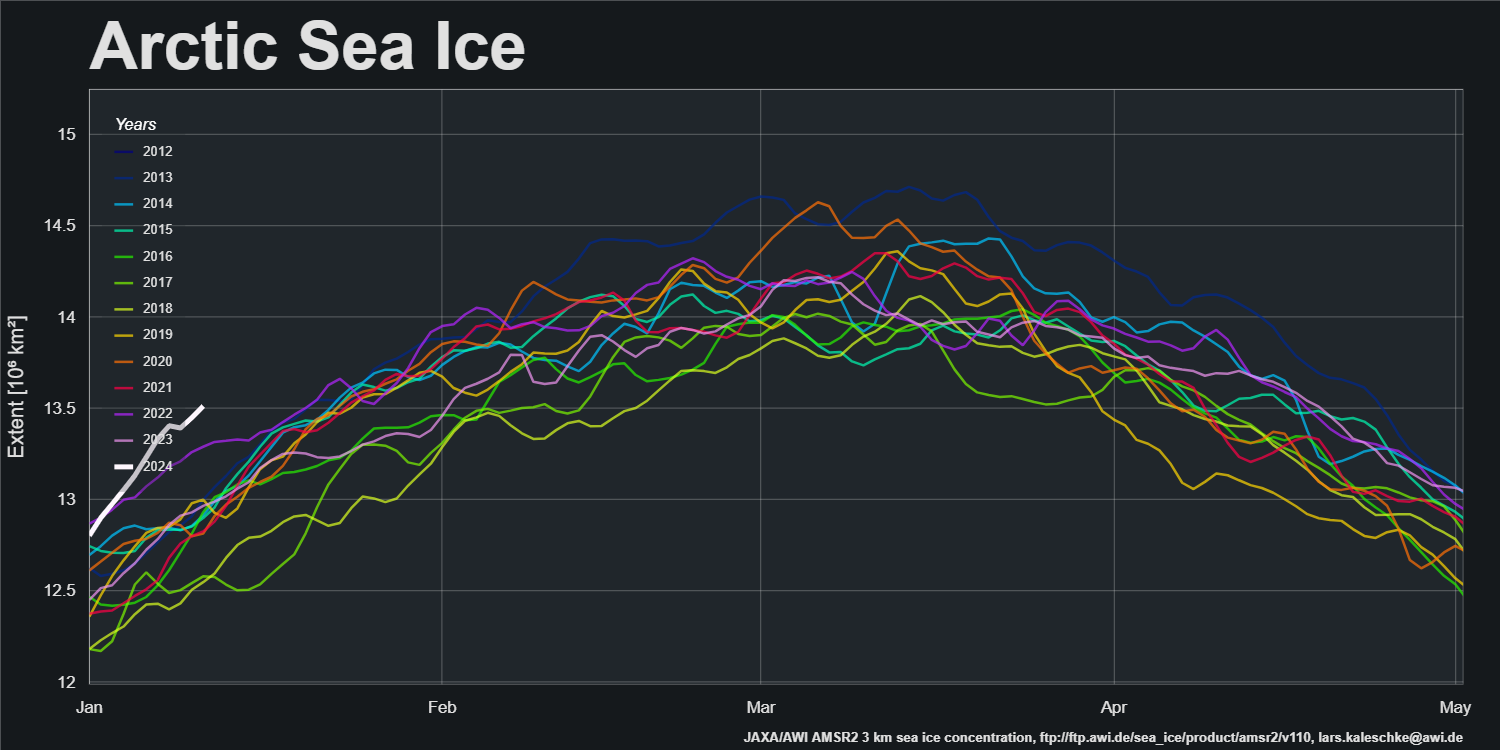
It’s currently highest for the date in the AMSR2 era by a significant margin.
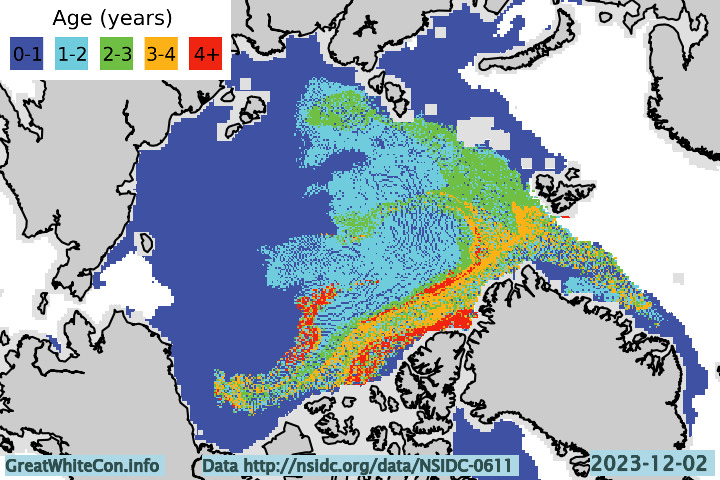
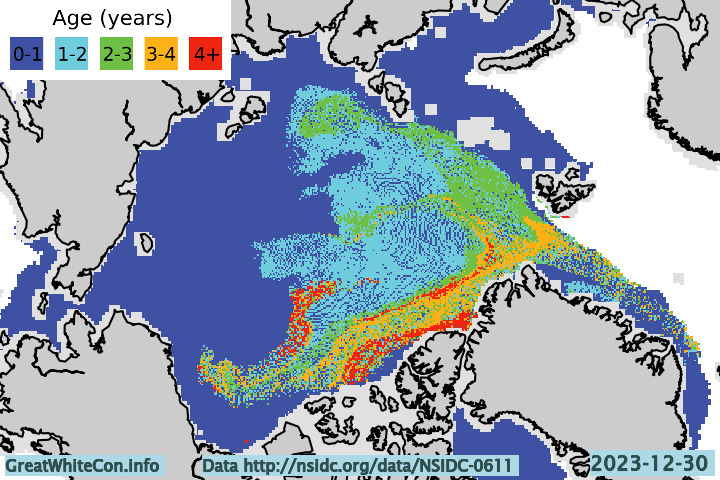
Here too is the ice age map for the end of 2023:
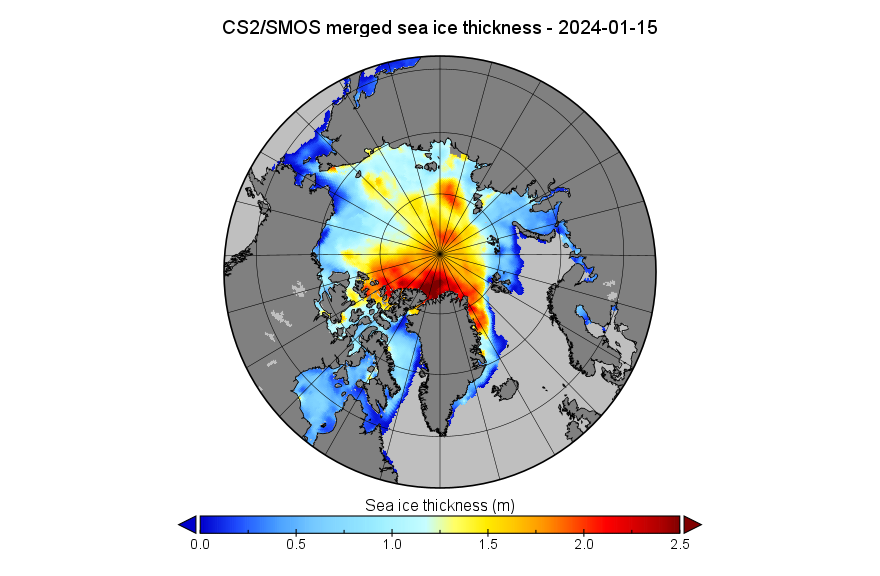
Something seems to have gone wrong with the processing of the mid-month PIOMAS gridded thickness data. For the moment we’ll have to make do with just the CryoSat-2/SMOS thickness map:
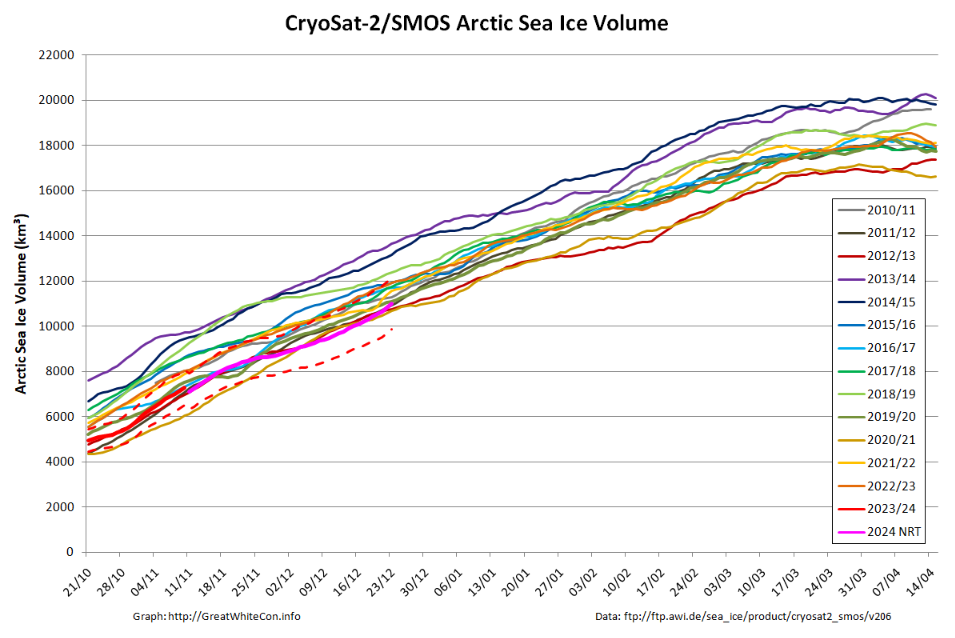
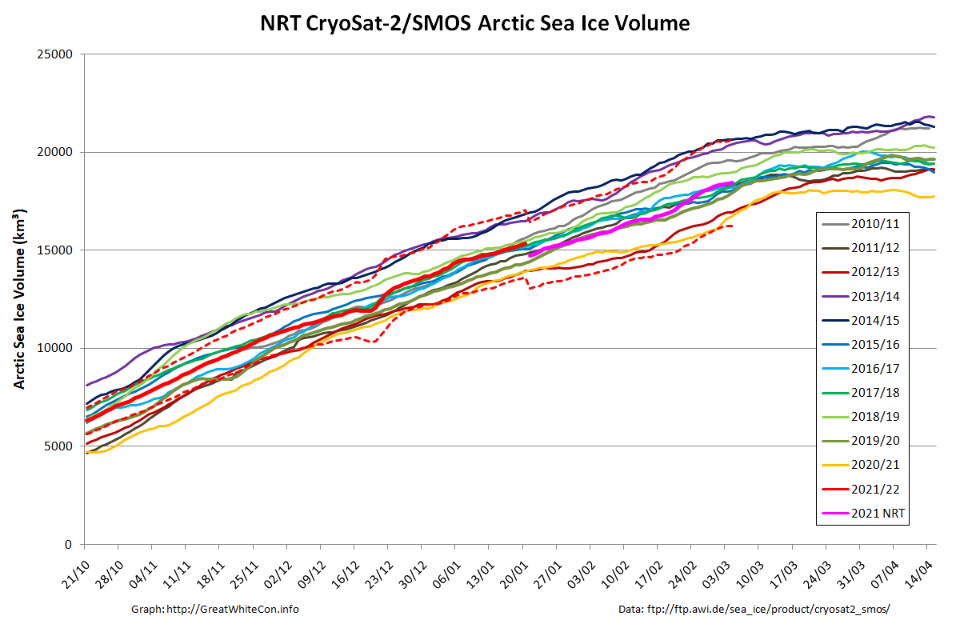
and volume graph:
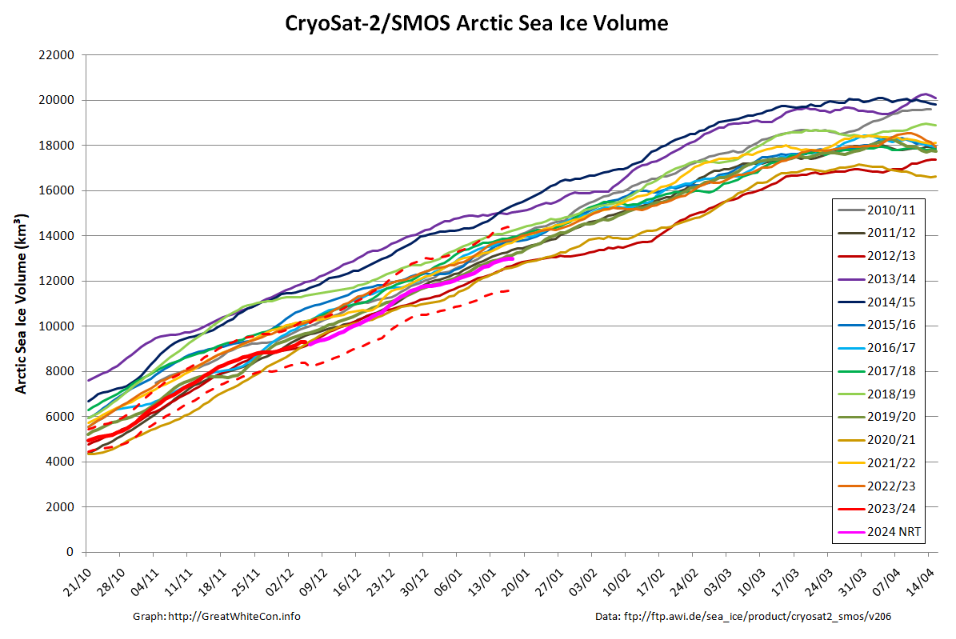
With the perennial caveat of a probable upward revision when the reanalysed data is released, Arctic sea ice volume is still close to the bottom of the range during the CryoSat-2 era.
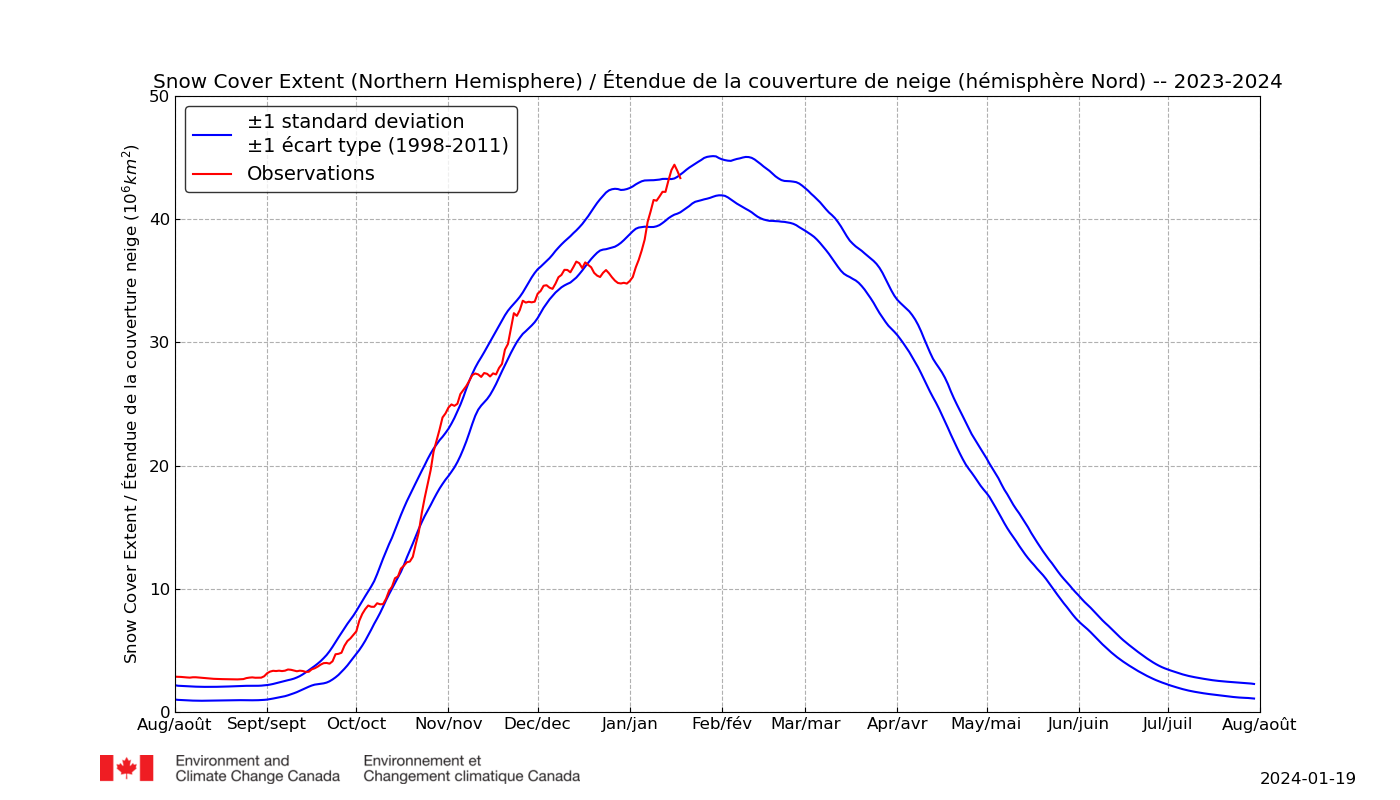
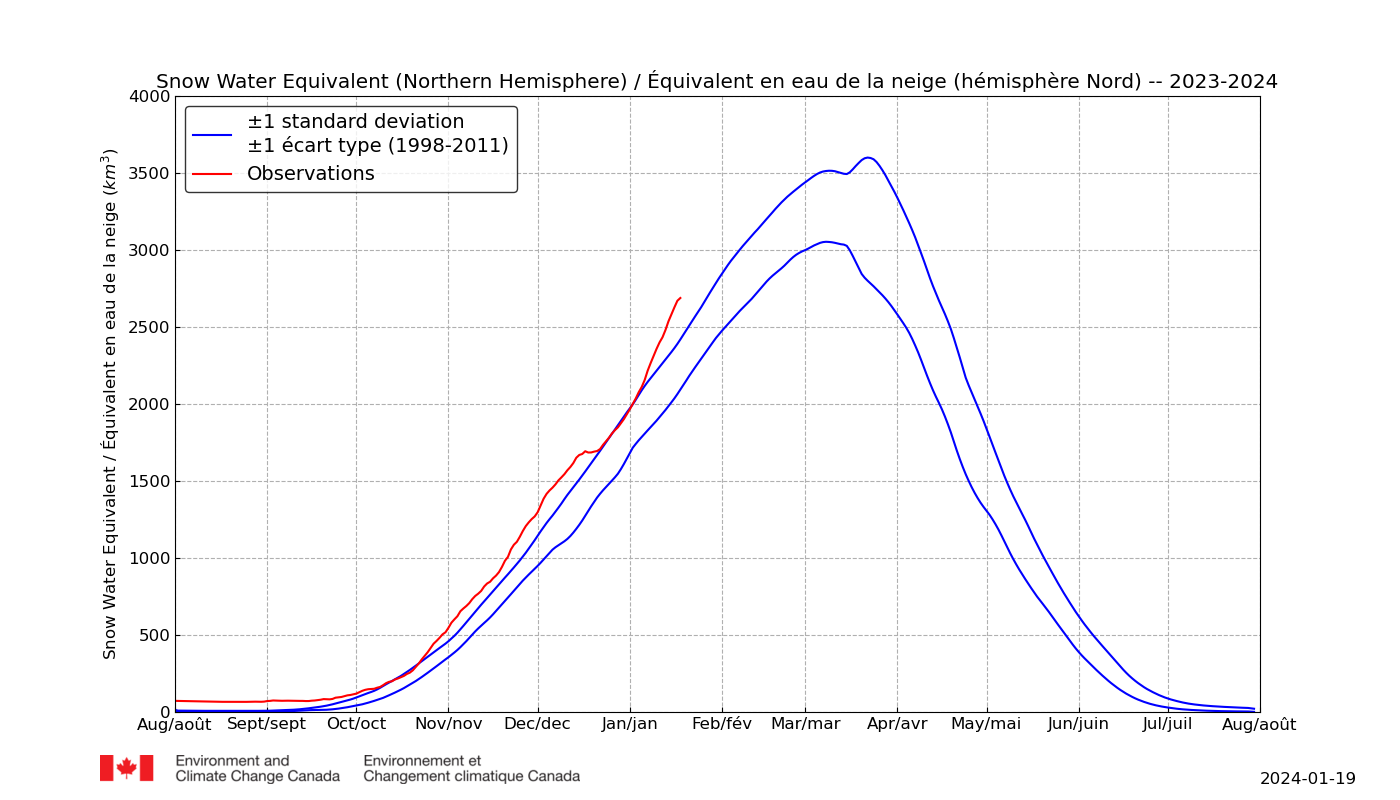
In addition especially for Matt, “Steve”/Tony and numerous others of a “skeptical” persuasion, here are the latest Environment & Climate Change Canada snow extent and snow water equivalent graphs for the northern hemisphere:
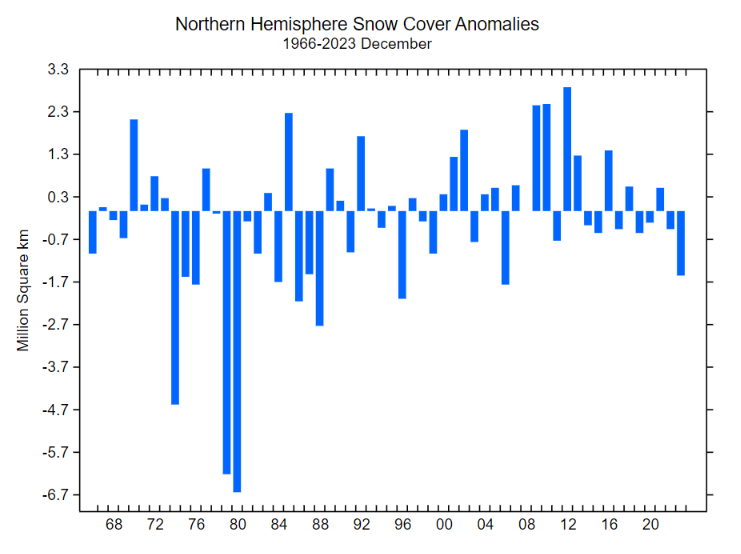
Last but certainly not least is the Rutgers Global Snow Lab northern hemisphere snow cover anomaly chart for December:
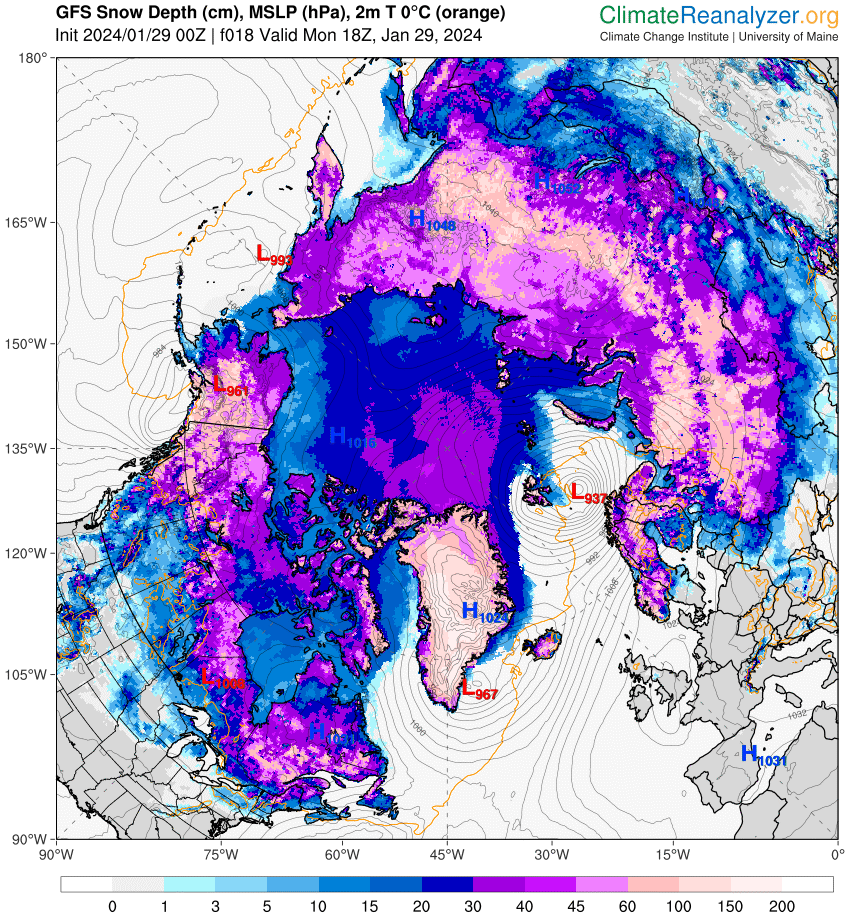
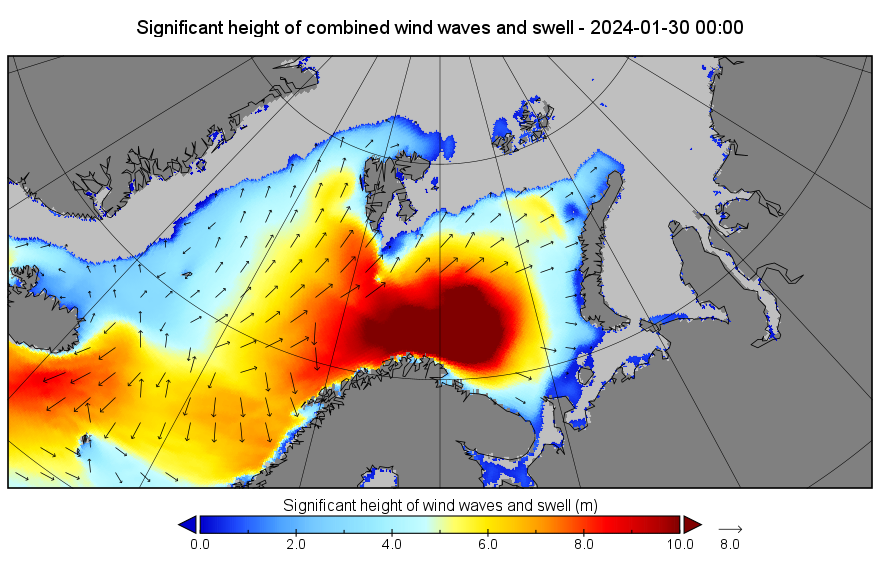
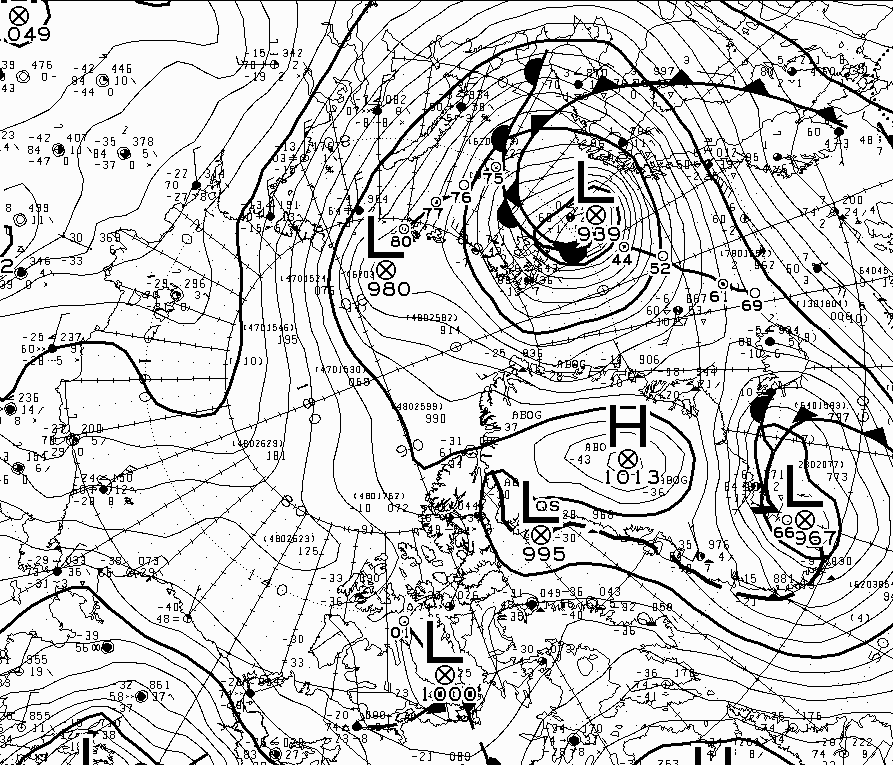
A winter cyclone is stirring up the far North Atlantic. It’s currently forecast to bottom out later today with a minimum MSLP of 937 hPa:
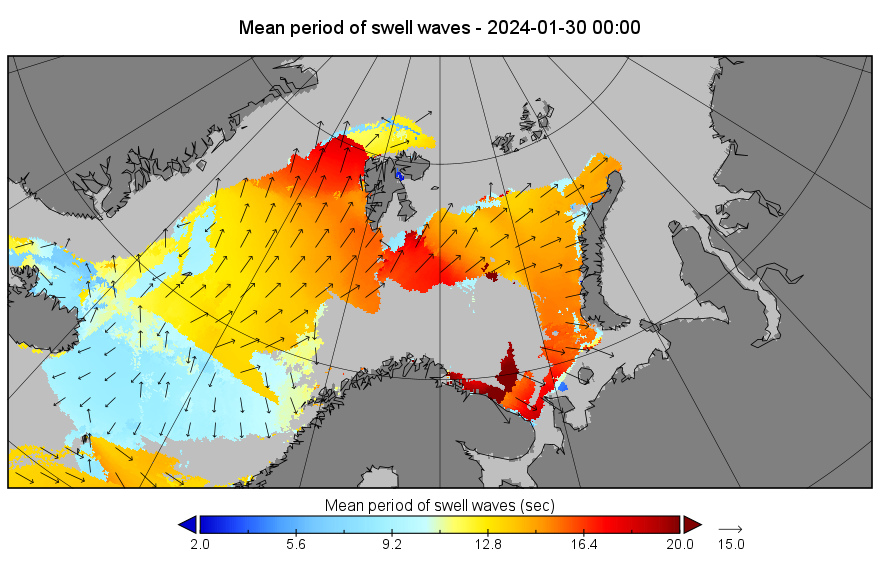
The storm has been creating a long period swell directed at the ice edge in the Barents Sea. By midnight that swell will be battering the ice in the Fram Strait too:
According to Environment Canada the cyclone bottomed out with an MSLP of 939 hPa at 12 PM UTC yesterday:
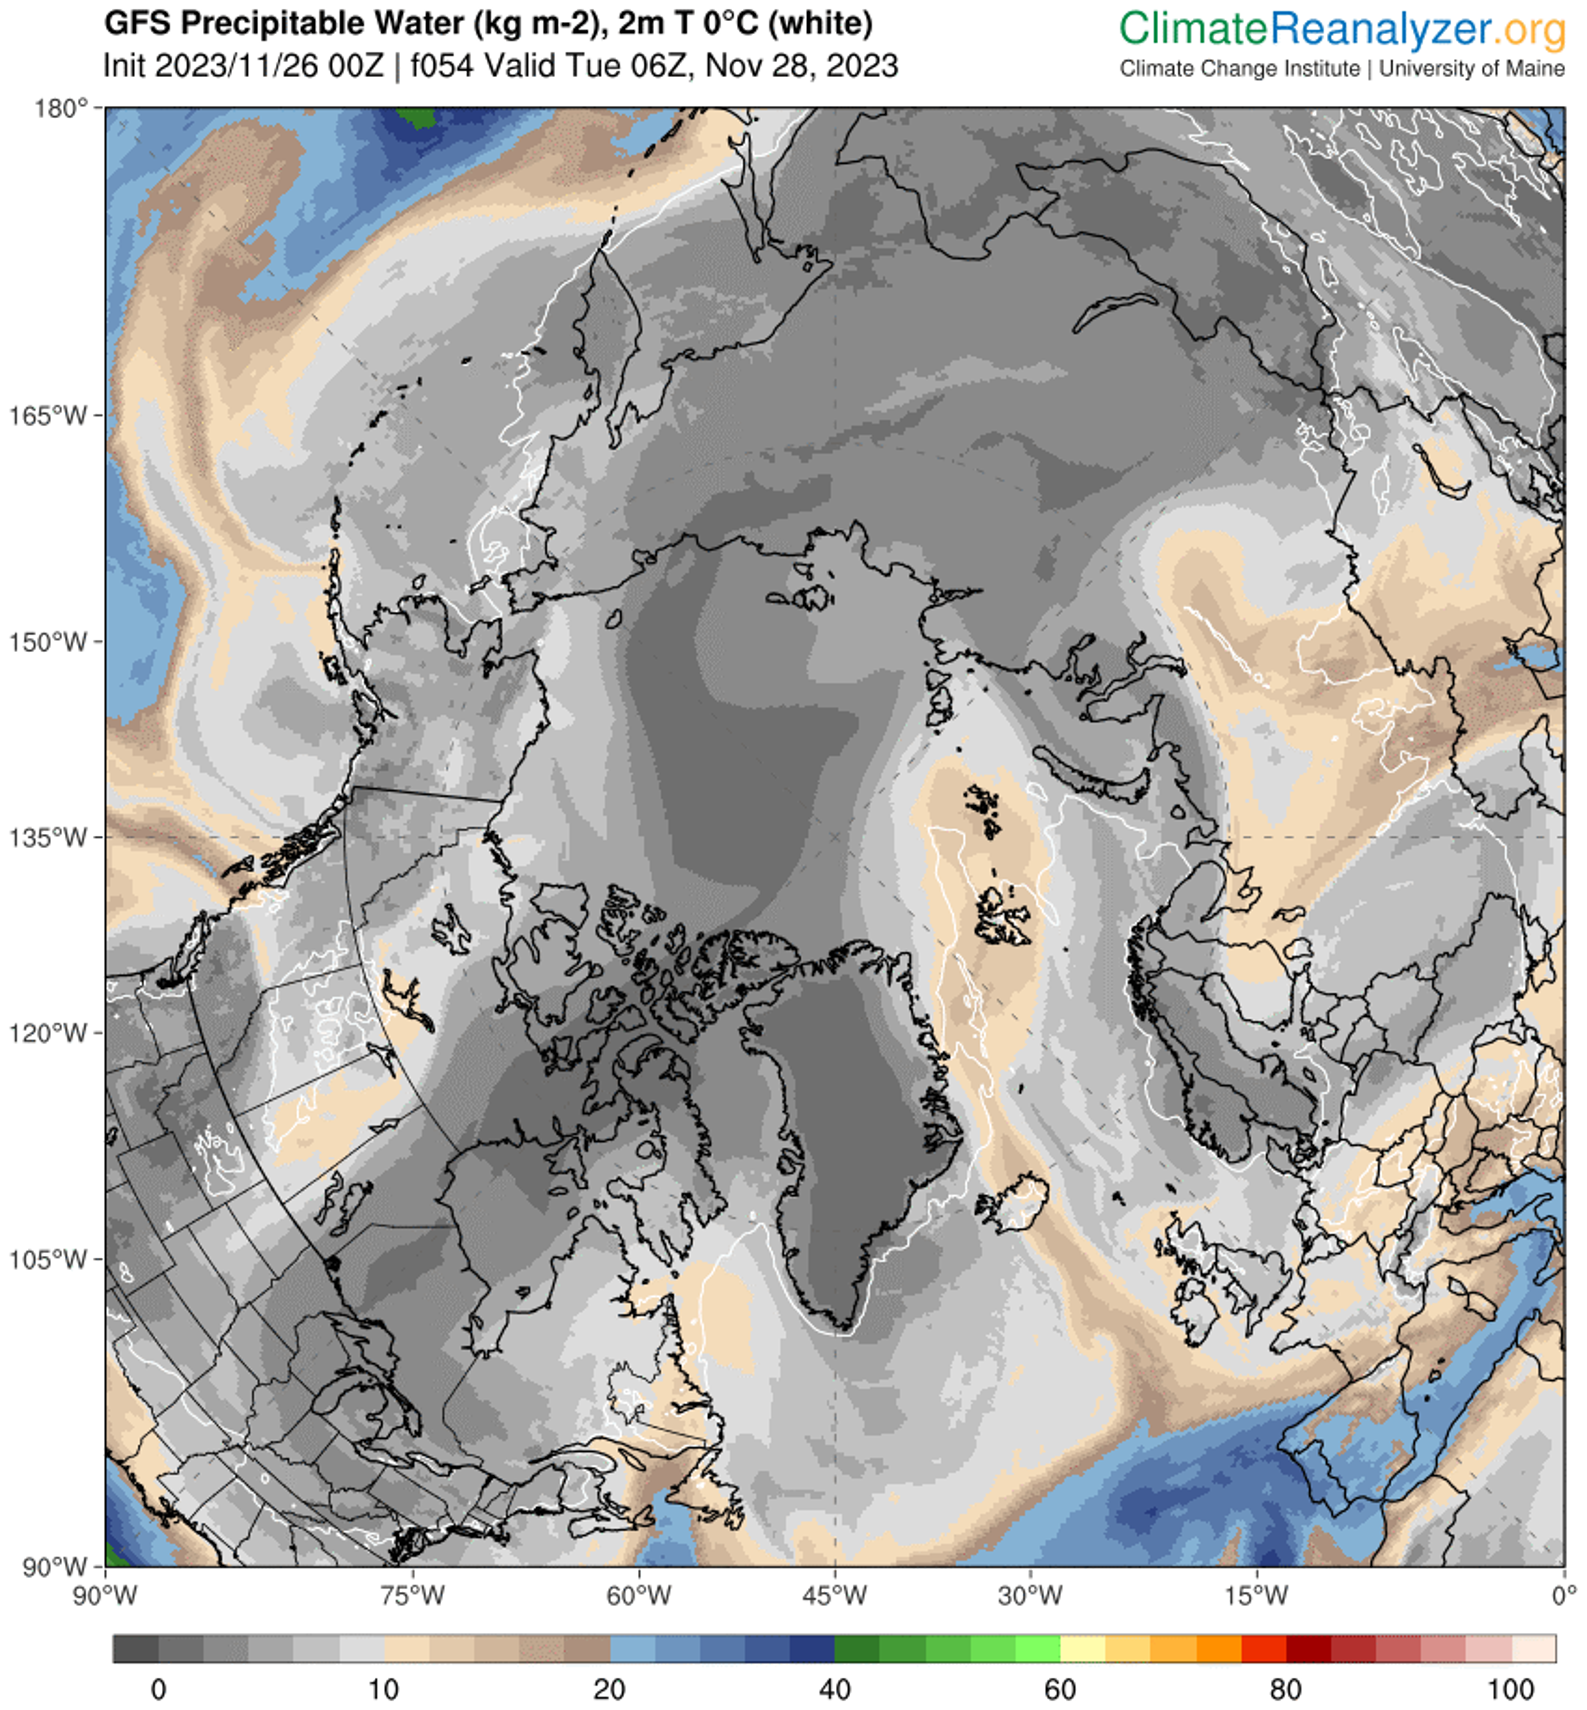
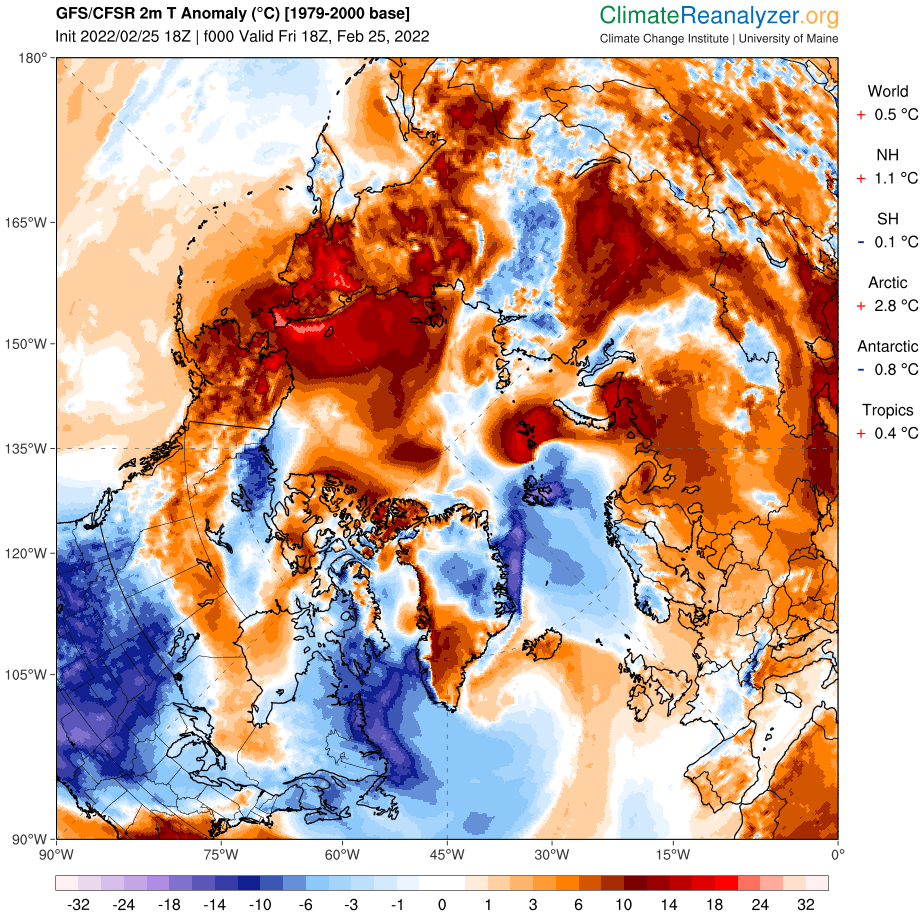
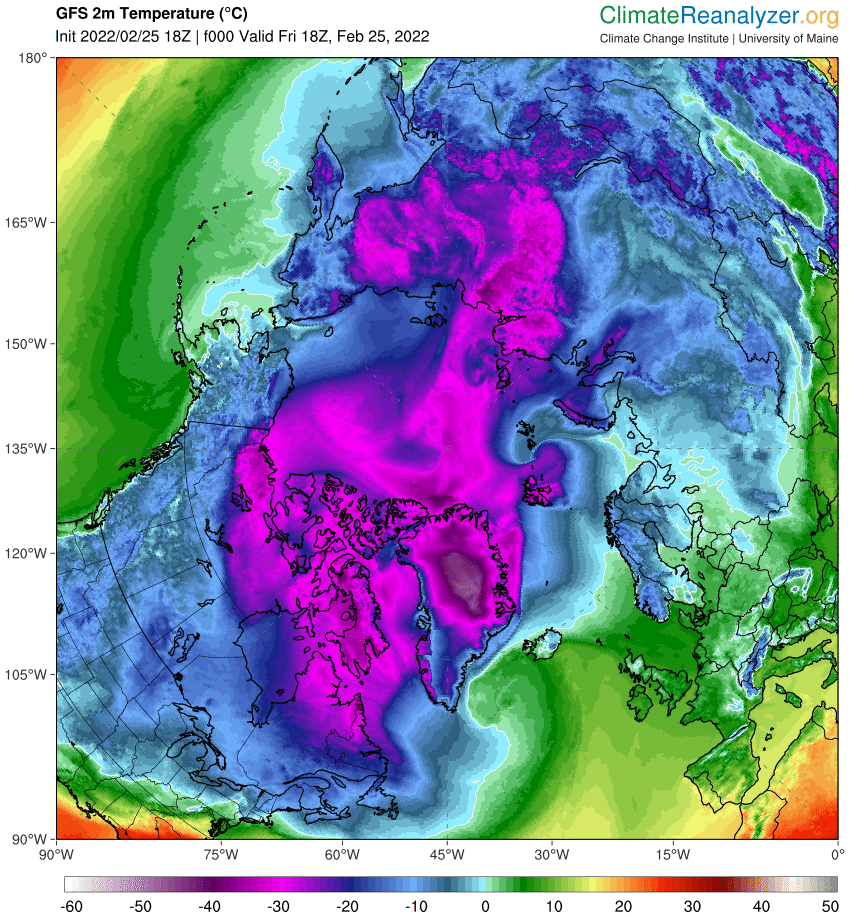
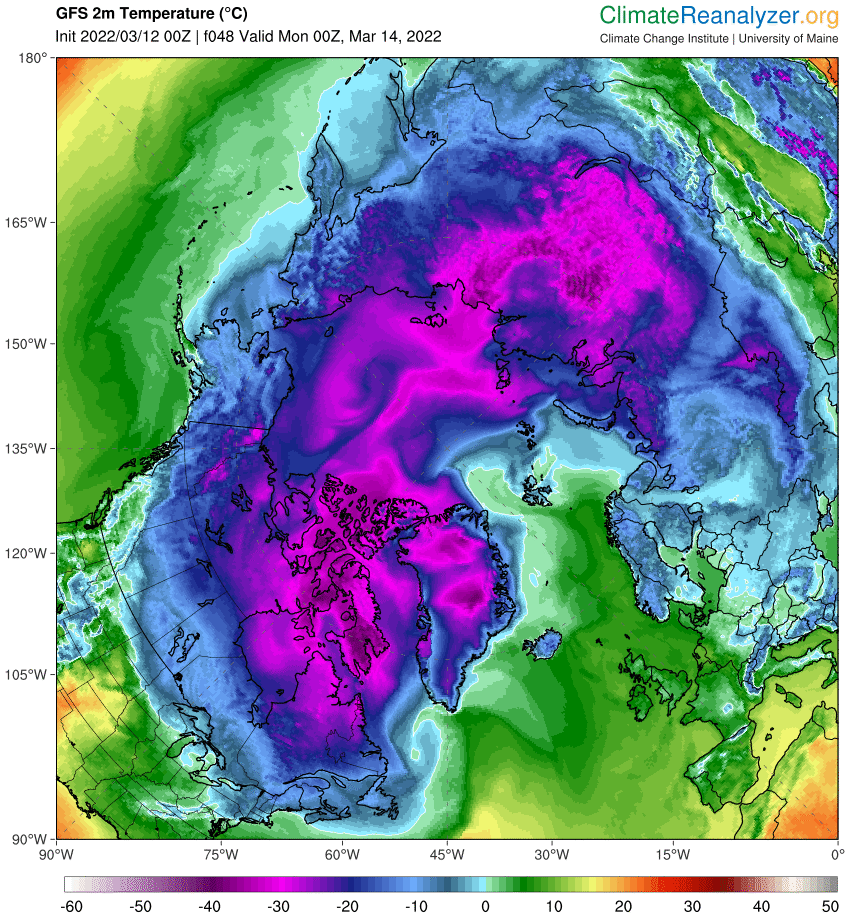
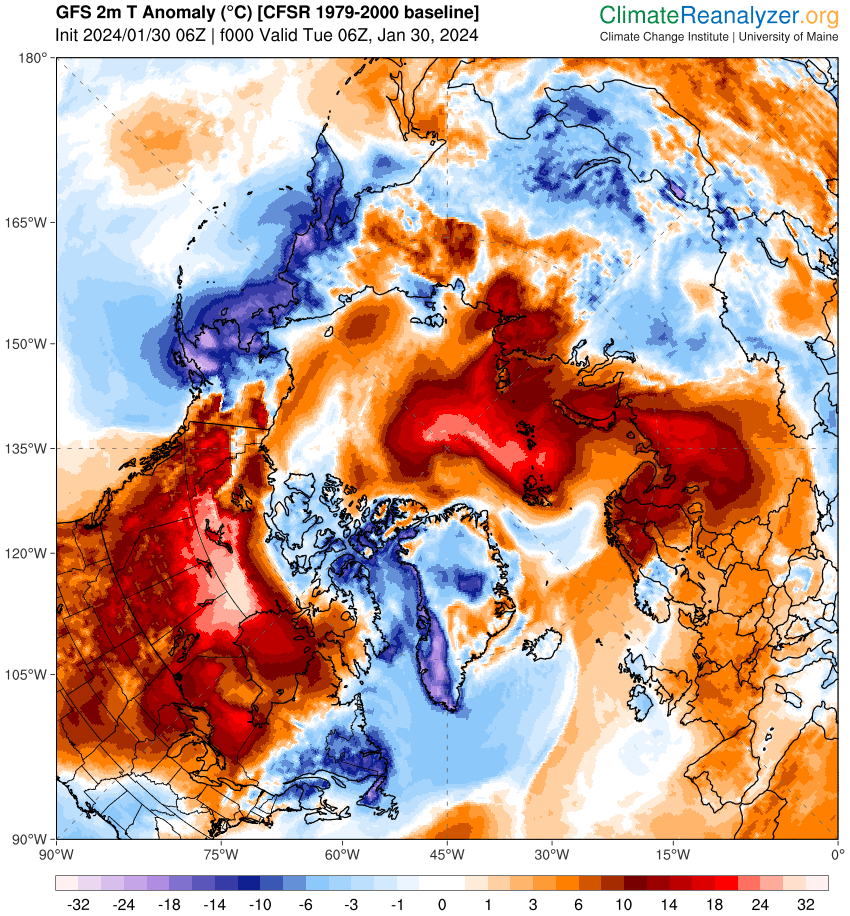
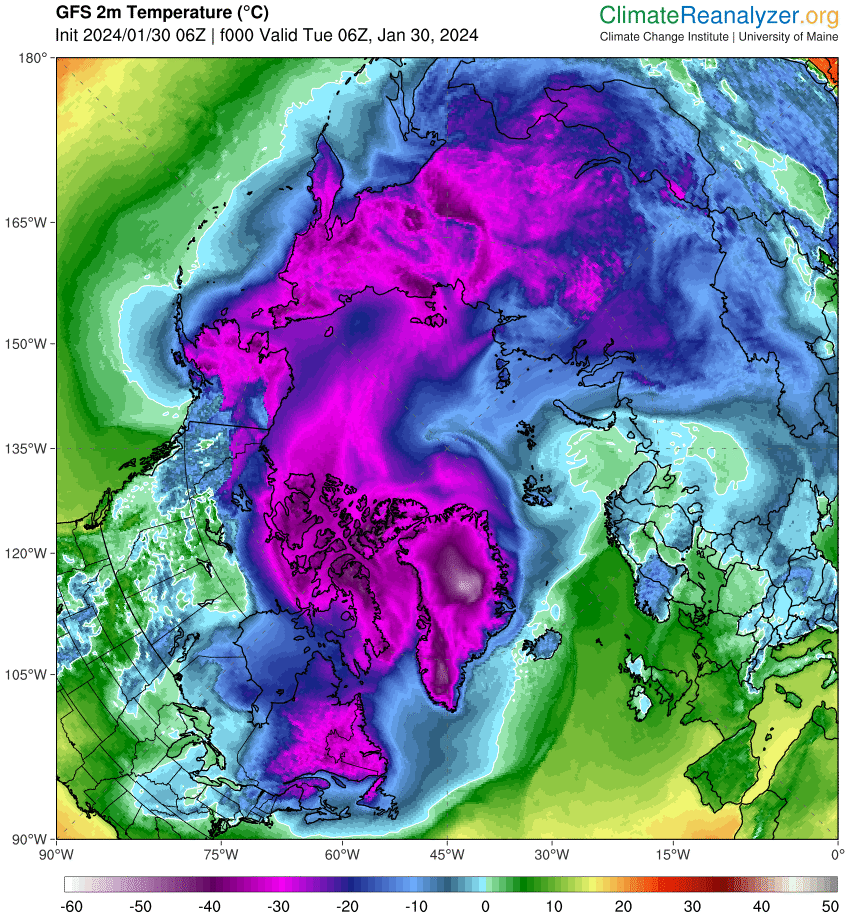
Associated with the storm is a pulse of abnormally warm air reaching to the North Pole and beyond:
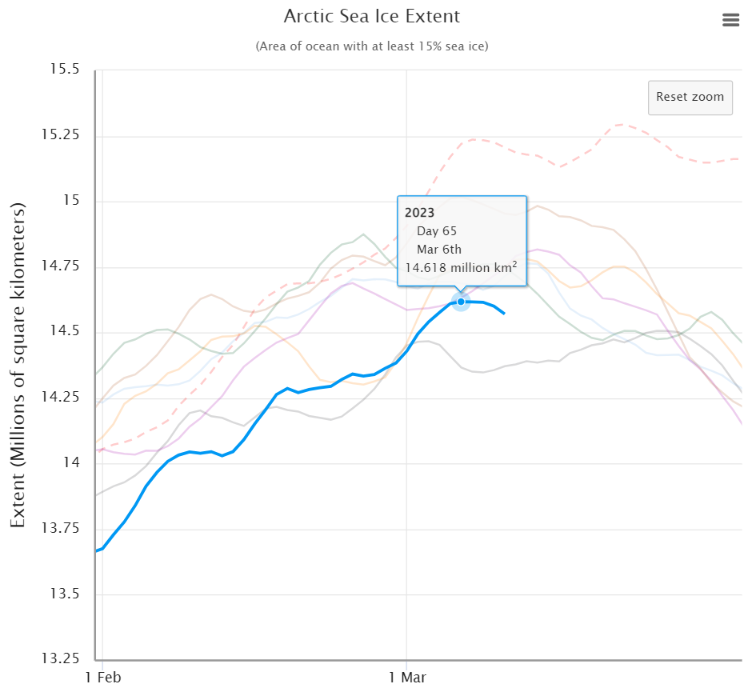
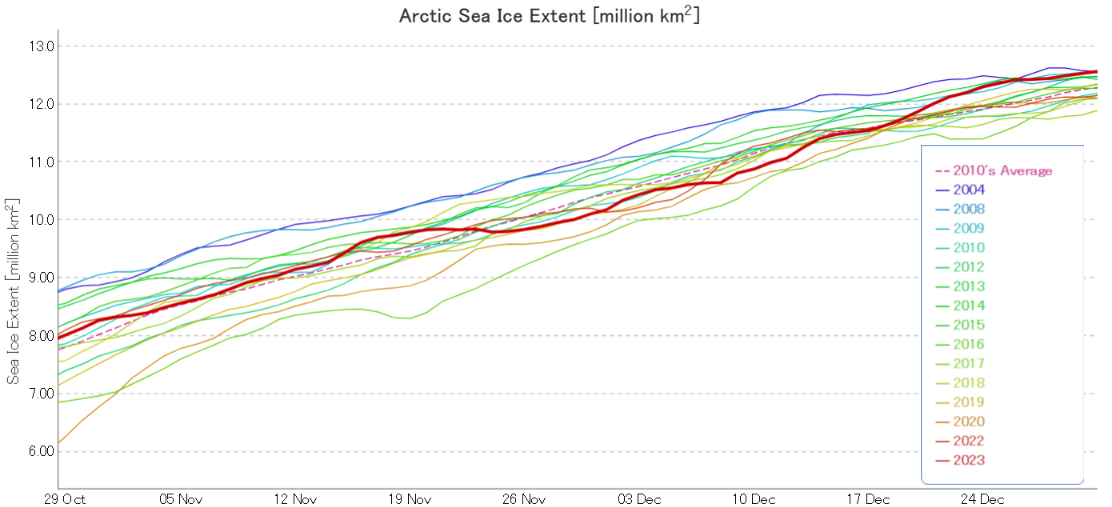
Here’s how JAXA extent looks as the big swell arrives:
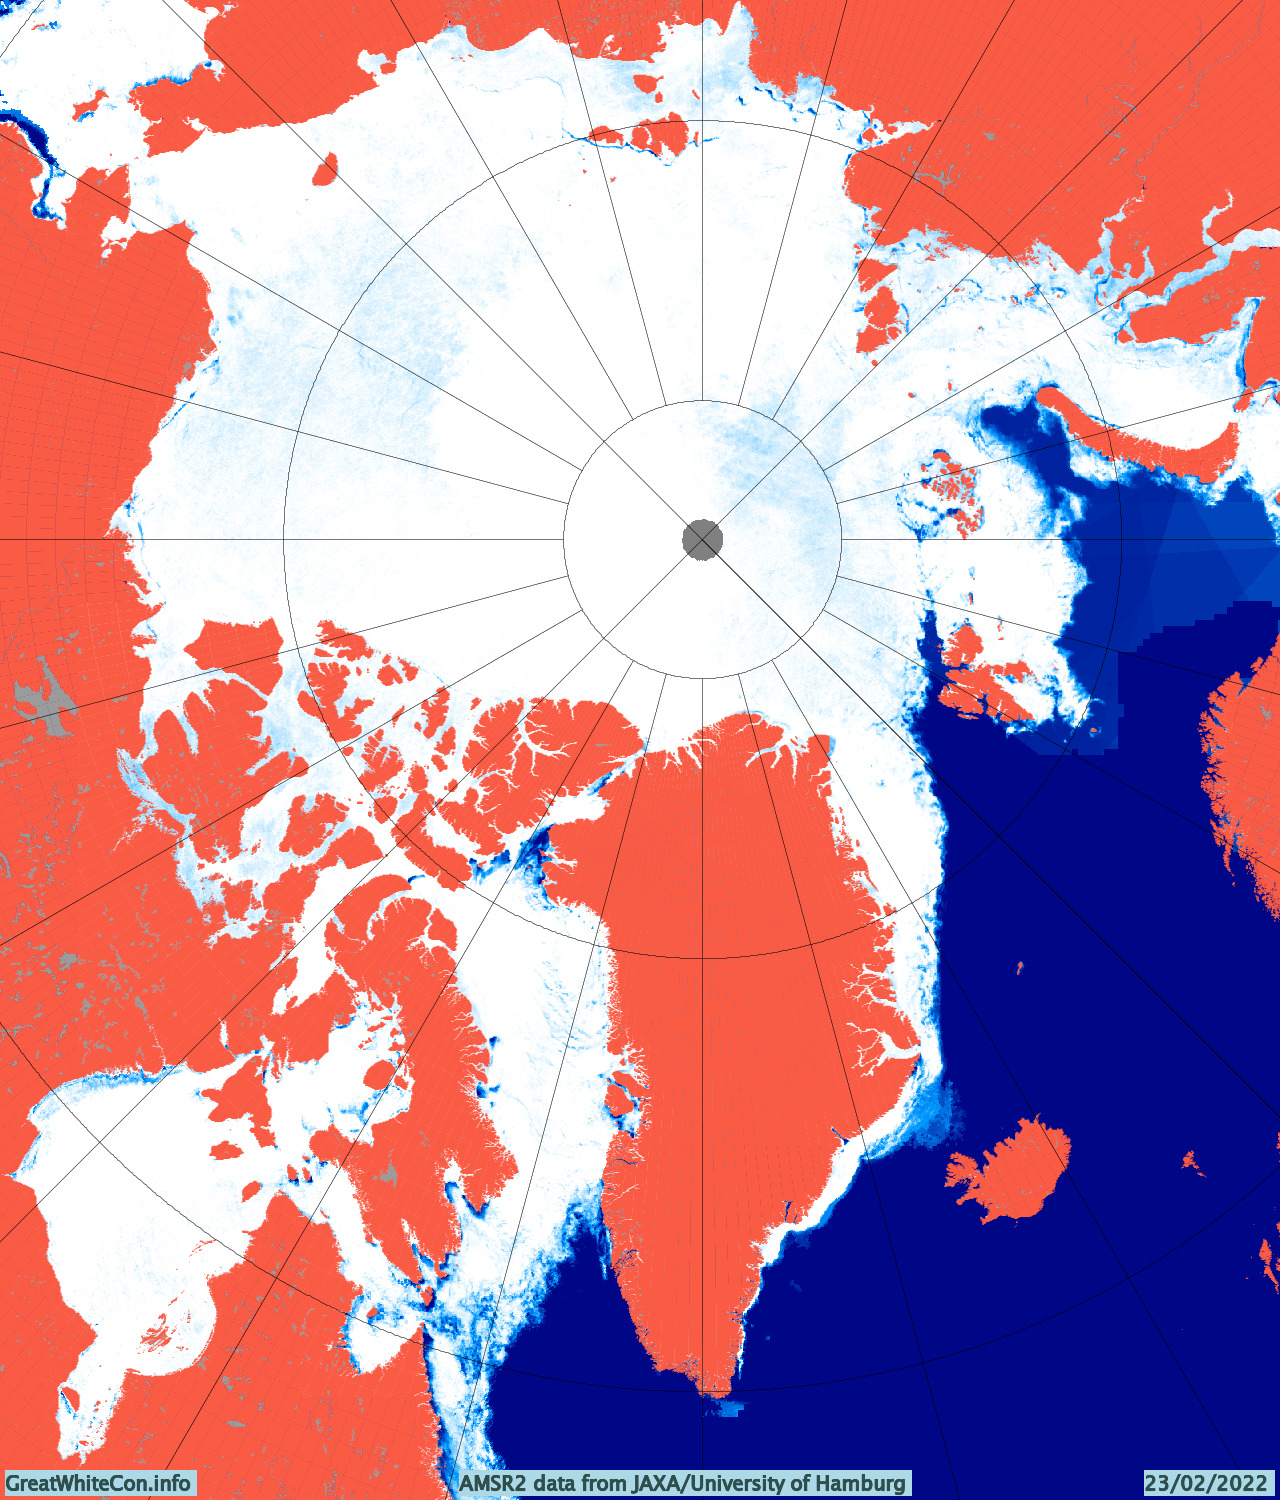
And here’s the lead enhanced AWI AMSR2 concentration map of the Atlantic periphery:
Let’s see how things change over the next few days.
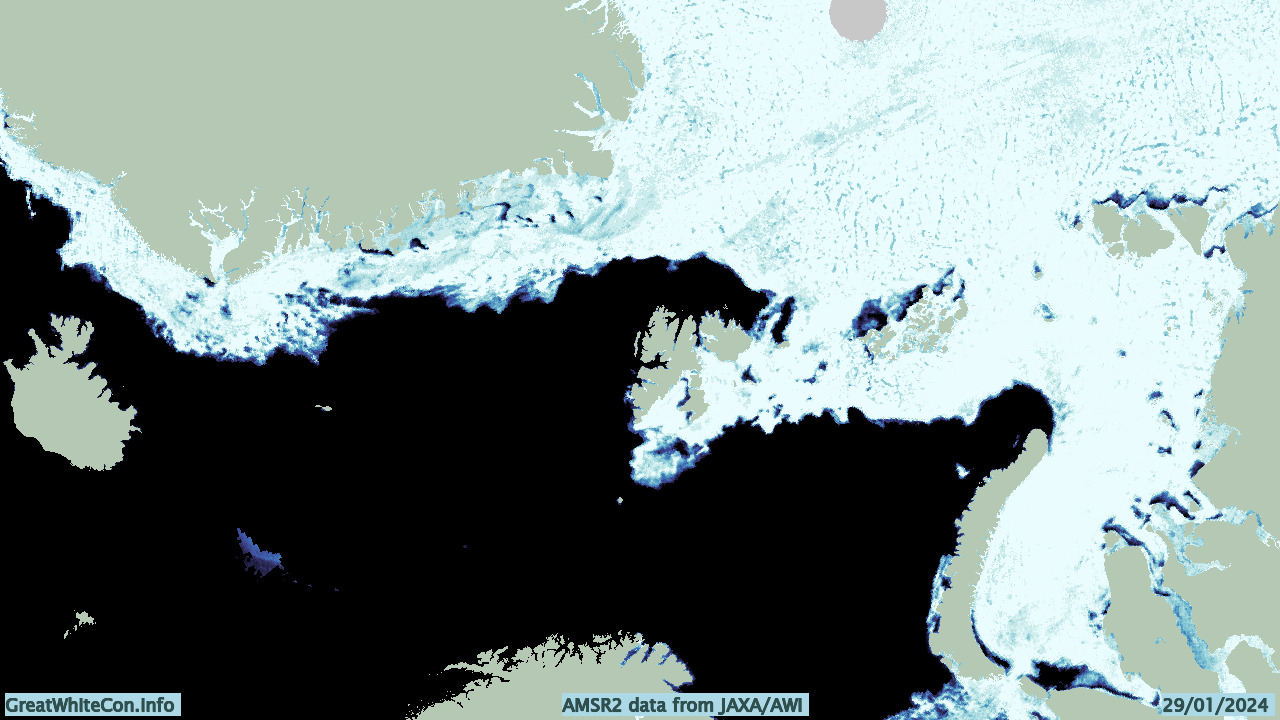
[Update – January 31st]Here’s a preliminary look at the effect of the recent Arctic cyclone and other “weather” on the sea ice in the Fram Strait and Barents & Kara Seas:
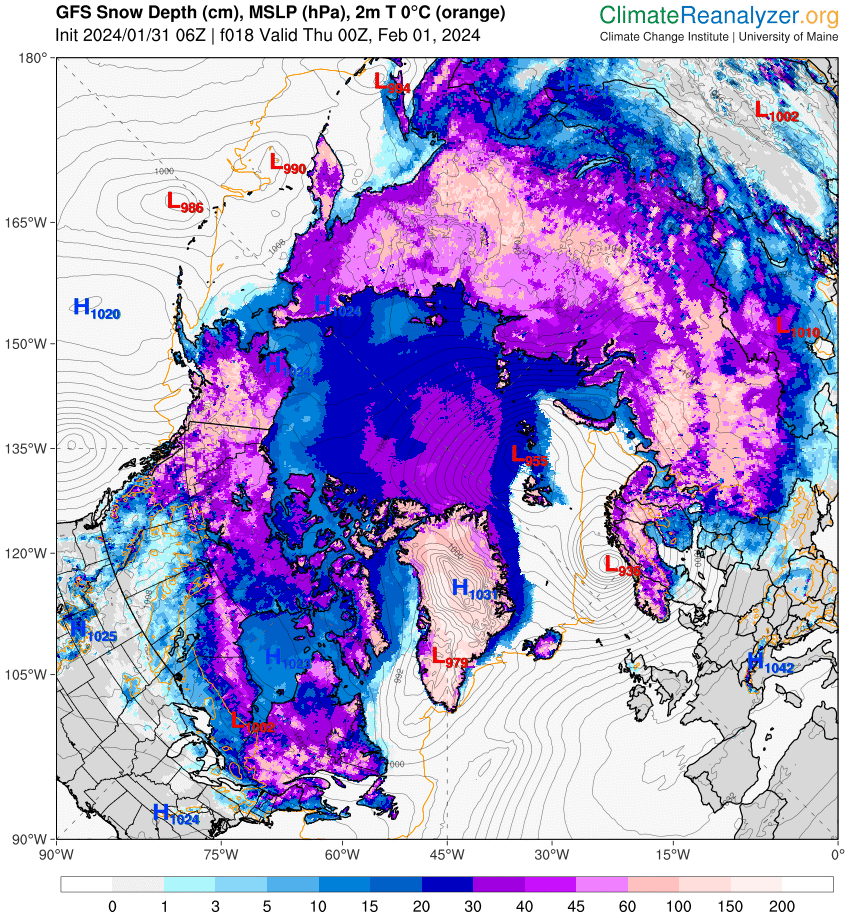
There is also another cyclone heading for the Barents Sea. This one is forecast to bottom out at 936 hPa at around midnight tonight near the Norwegian coast:
P.S. The cyclone mentioned just above has been named Storm Ingunn by the Norwegian Meteorological Institute:
👀 This swirl of cloud is #StormIngunn – an intense area of low pressure that's still rapidly deepening
— Met Office (@metoffice) January 31, 2024
😮 Wind gusts of over 120 mph have been reported in the Faroe Islands with the storm now moving towards Norway pic.twitter.com/TNuo52L7MW
A yellow warning for wind has been issued for Scotland, and a red warning for Norway:

The conversation continues over on the February open thread.