We’ll come on to the Arctic in a moment, but at more temperate latitudes I am proud to announce that my Cornish alter ego has been officially outed as an “environmental campaigner” by the BBC. Moving pictures of yours truly, discussing drought rather than sea ice, are available via BBC iPlayer until around 18:30 this evening, possibly to UK residents only.
[Stop Press! A shorter version of Kirk England’s report on two potential desalination plants in Cornwall (also including my 15 seconds of fame!) is available here until around 22:30 this evening ]
Alternatively we have recorded our own moving pictures of this momentous event:
And an added still image as well:

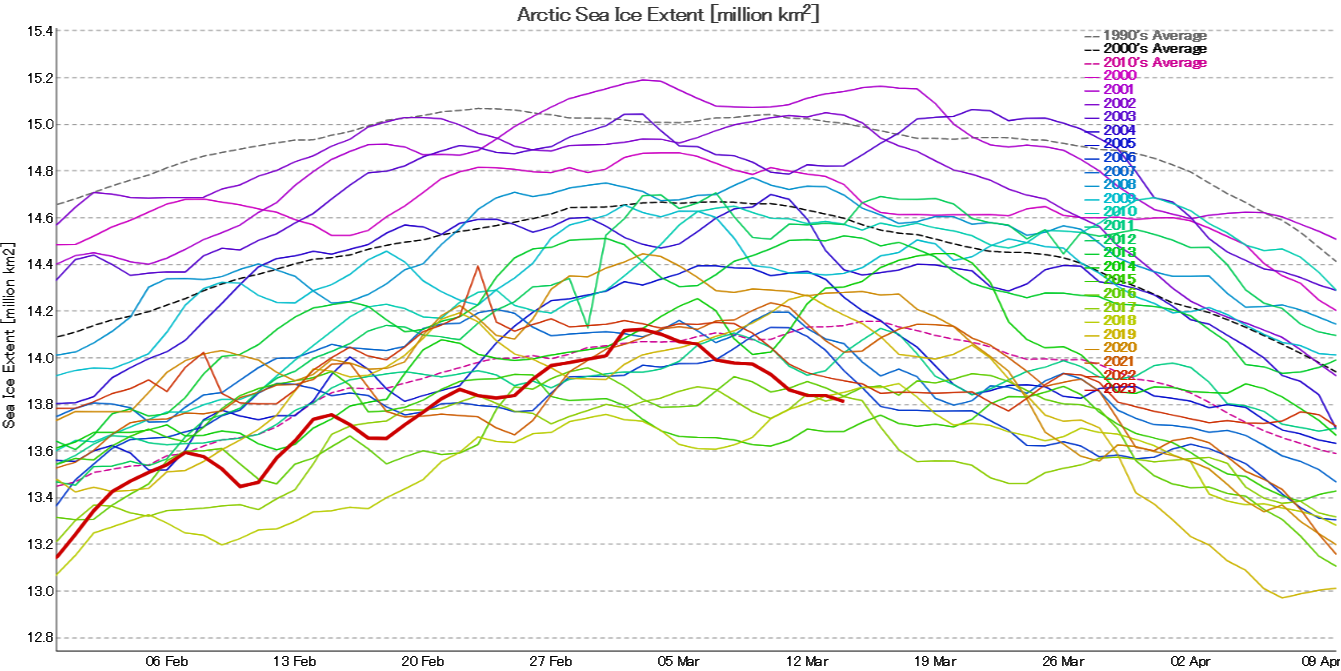
Heading back to the far north, it is entirely feasible that the maximum Arctic sea ice extent of the 2023 freezing season has been reached, according to JAXA/ViSHOP at least:
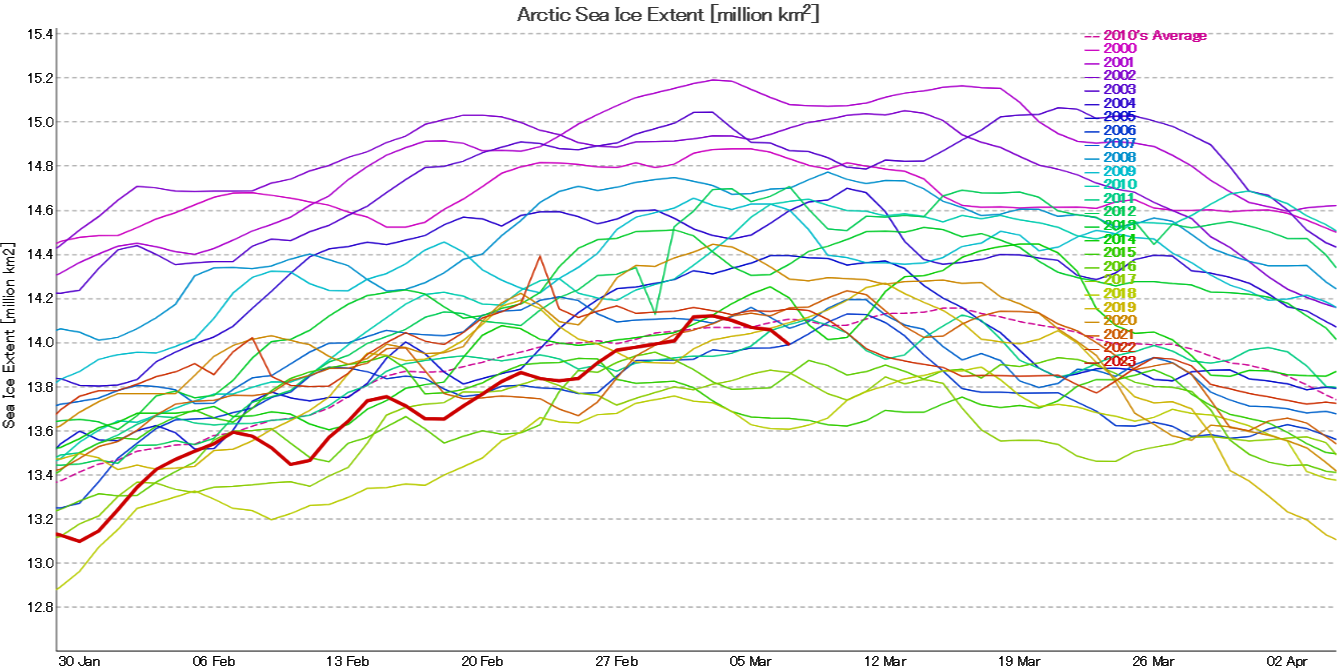
14.12 million km² on both the 2nd and 3rd of March.
In other news from within the Arctic Circle, the PIOMAS gridded thickness data for February has now been released. Here’s the modelled thickness map for February 28th:
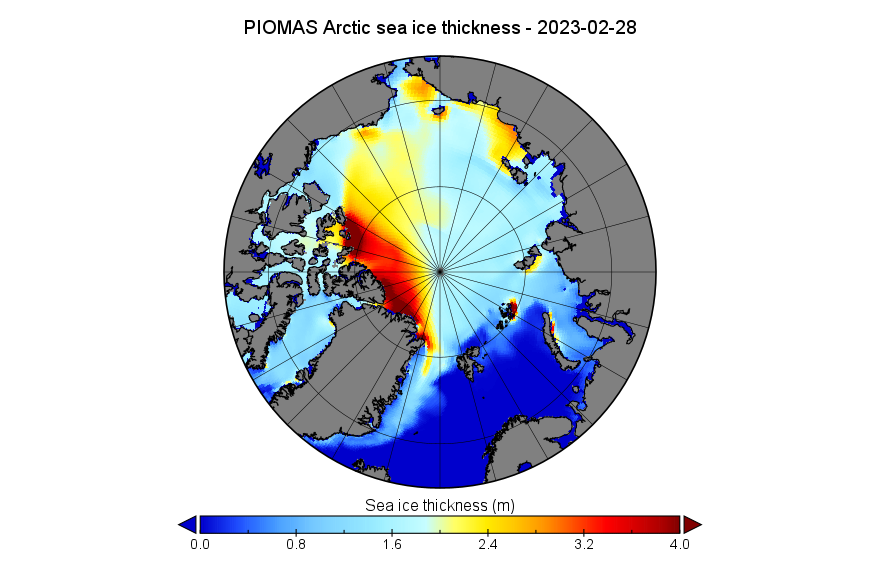
It reveals some of the thickest sea ice remaining in the Arctic Ocean taking the Fram Strait exit from the Central Arctic.
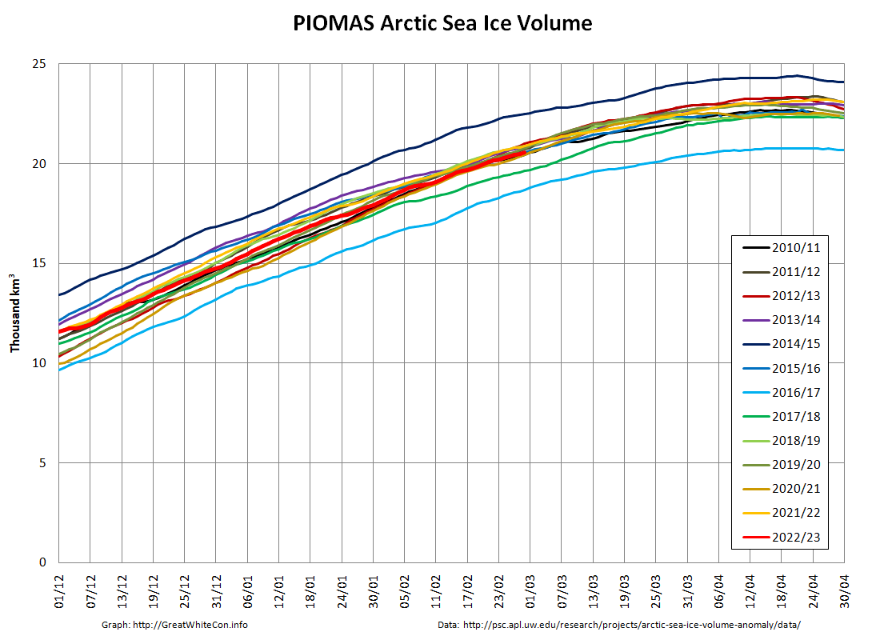
Since the “official” PIOMAS volume graph doesn’t seem to have been published yet, here too is one calculated from the gridded thickness data up to and including February 28th:
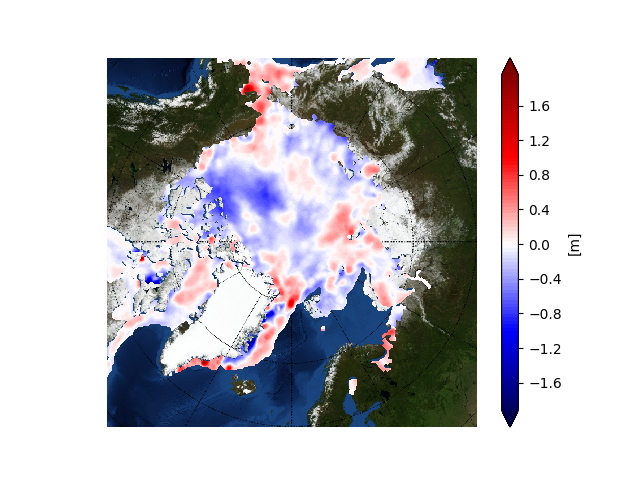
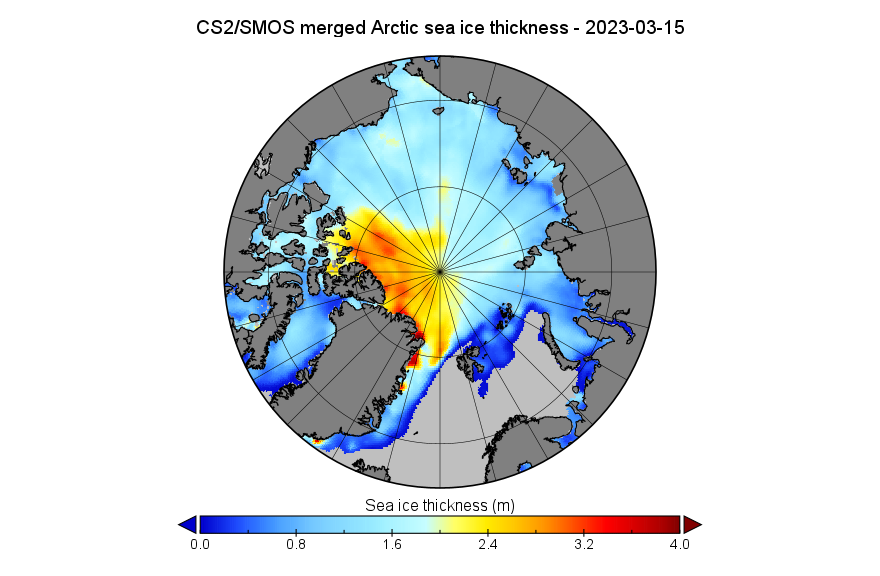
For comparison purposes here is the CryoSat-2/SMOS “measured” thickness map for the week ending March 6th:
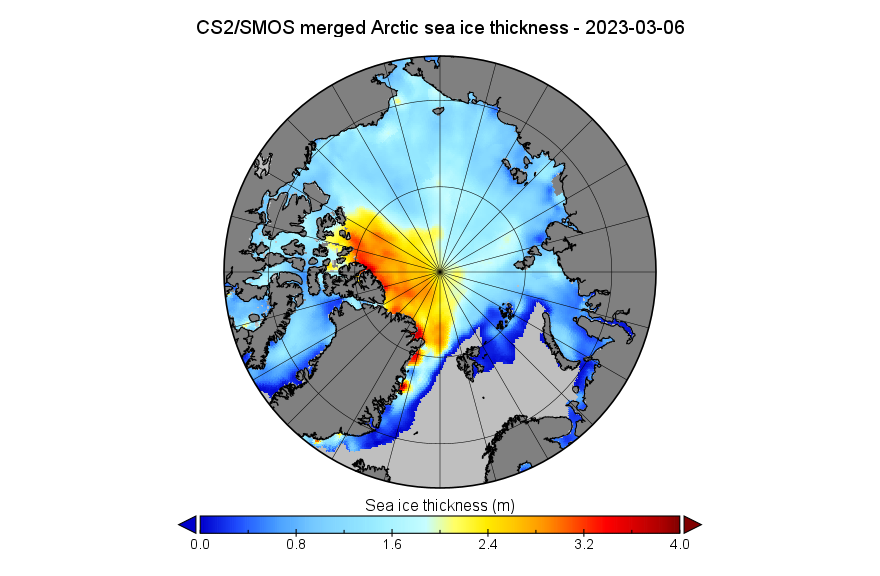
Although the ice distribution is somewhat different to that of PIOMAS, this also shows an area of thicker ice at the northern entrance to the Fram Strait.
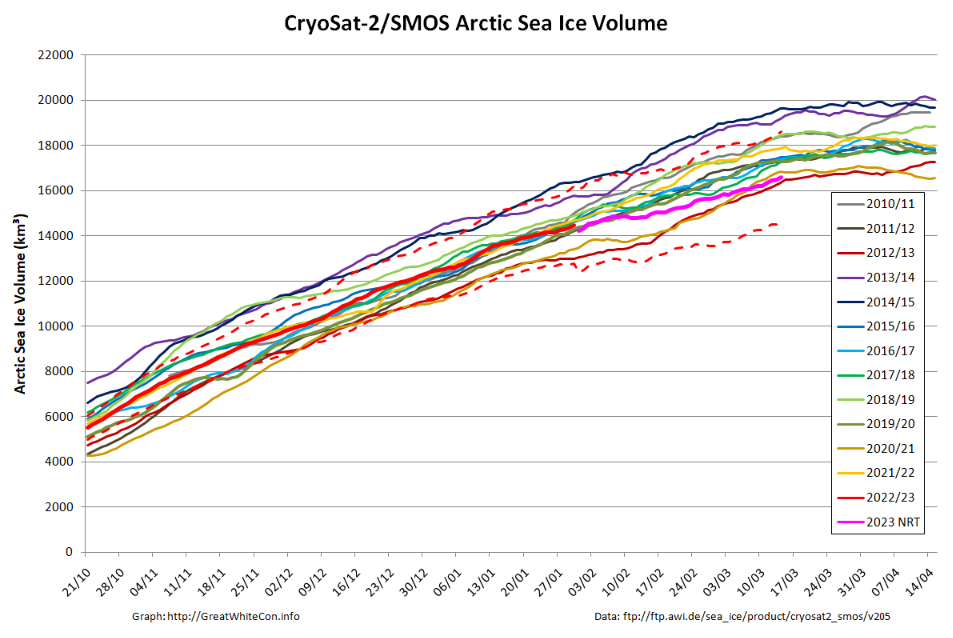
The near real time section of the CS2/SMOS volume graph suggests a recent slow down in the rate of volume increase:

Note that the PIOMAS version of the graph doesn’t show the same slow down. Several weeks will need to elapse before we discover if the reanalysed CS2/SMOS data confirms it.
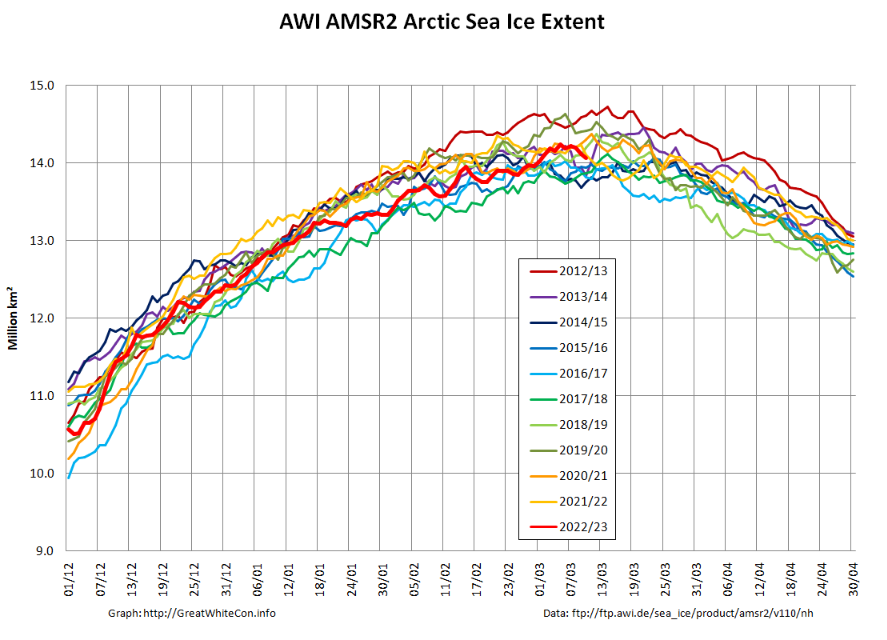
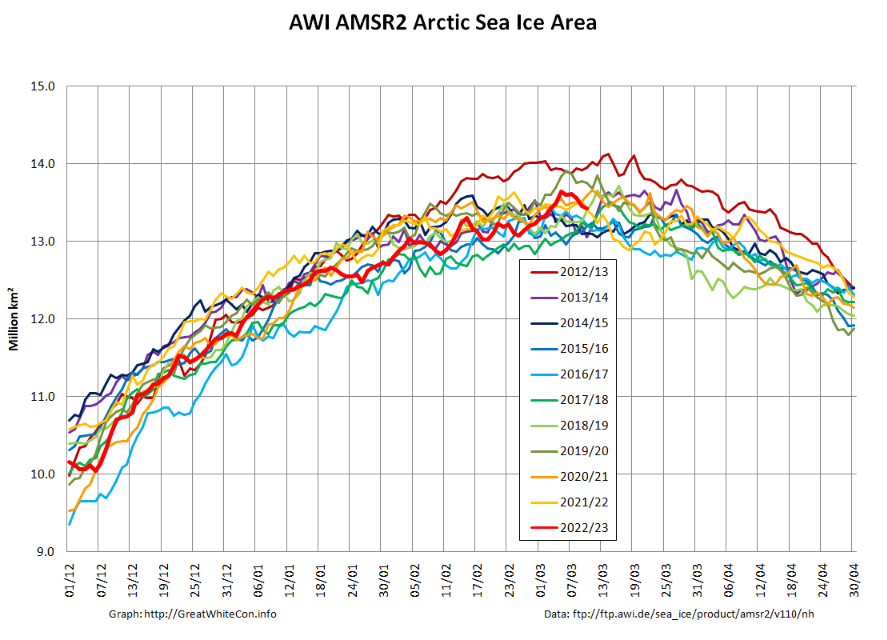
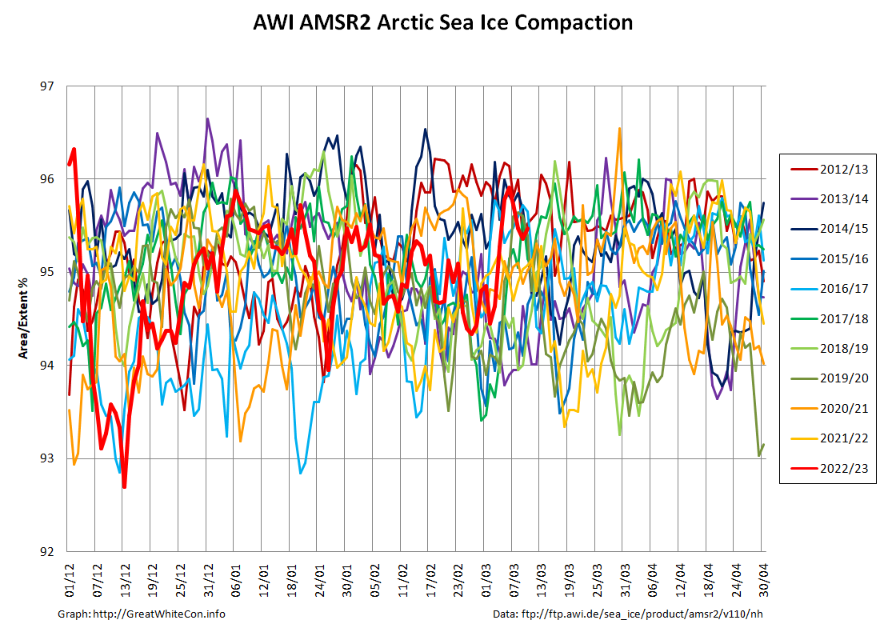
[Edit – March 11th]“Snow White” has called the 2023 maximum extent following NSIDC’s tumble yesterday. With only mild trepidation! More on some other extent metrics over on the 2023 Maximum Extent thread, but here is the current suite of graphs for our favourite “high resolution” AMSR2 based data from the Alfred Wegener Institute:
The latest thickness anomaly map from the Finnish Meteorological Institute still shows plenty of unusually thick ice waiting to be exported from the Central Arctic via the Fram Strait:
All of a sudden JAXA extent is down to second lowest for the date in the satellite era:
The PIOMAS web page has now been updated with the data for February, but before that here’s our mid month CryoSat-2/SMOS update:
There is of course a wide band of uncertainty, but note that the current volume is very near the lower boundary of the band of previous years.
On the thickness map note the thicker ice heading for oblivion via the Fram Strait:
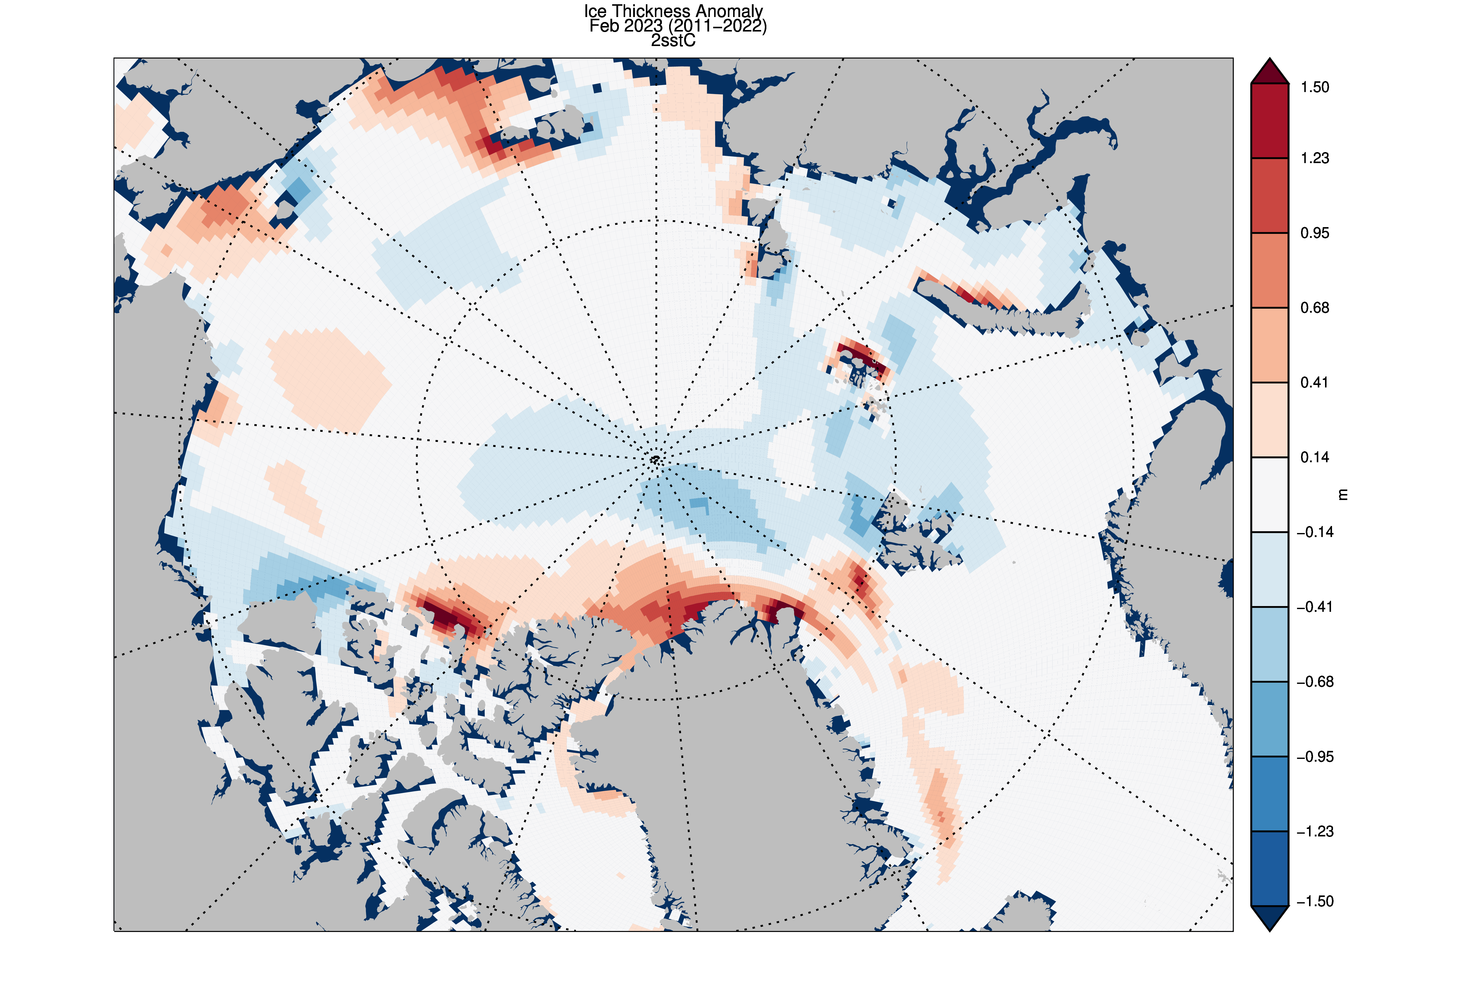
The PIOMAS report for February 2023 points out that:
Average Arctic sea ice volume in February 2023 was 19,400 km3. This value is the 6th lowest on record for February, about 2,000 km3 above the low record set in 2017. Monthly ice volume was 42% below the maximum in 1979 and 28% below the mean value for 1979-2022. Average February 2023 ice volume was 1.1 standard deviations above the 1979-2022 trend line…
The ice thickness anomaly map for February 2023 relative to 2011-2022 shows strong positive anomalies north of Greenland and along the Canadian Archipelago. The positive anomalies with particularly thick ice near Severnaya Zemlya that were present last month are now mostly gone, while they are still present in the CryoSat 2 satellite-derived ice thickness map. That now also shows an anomaly north of Greenland and along the Canadian Archipelago.
Here’s the accompanying PIOMAS thickness anomaly map:
plus the PIOMAS team’s version of the CryoSat-2 thickness anomaly map
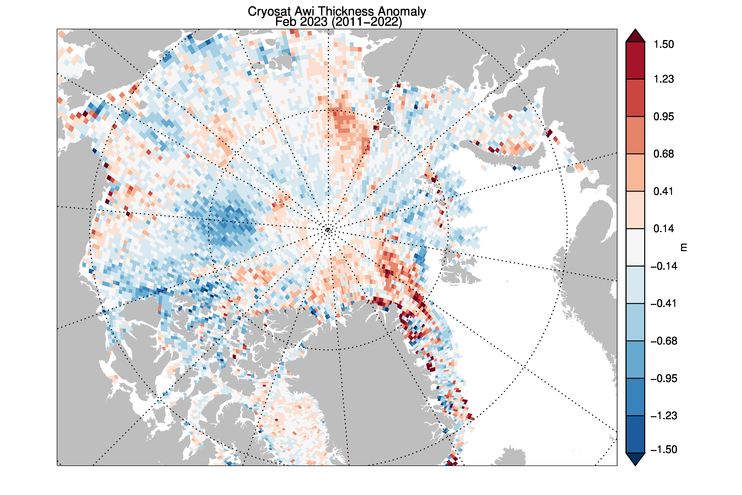
Everybody seems to be agreed about the abnormally thick sea ice currently taking the Fram Strait exit from the central Arctic Ocean.
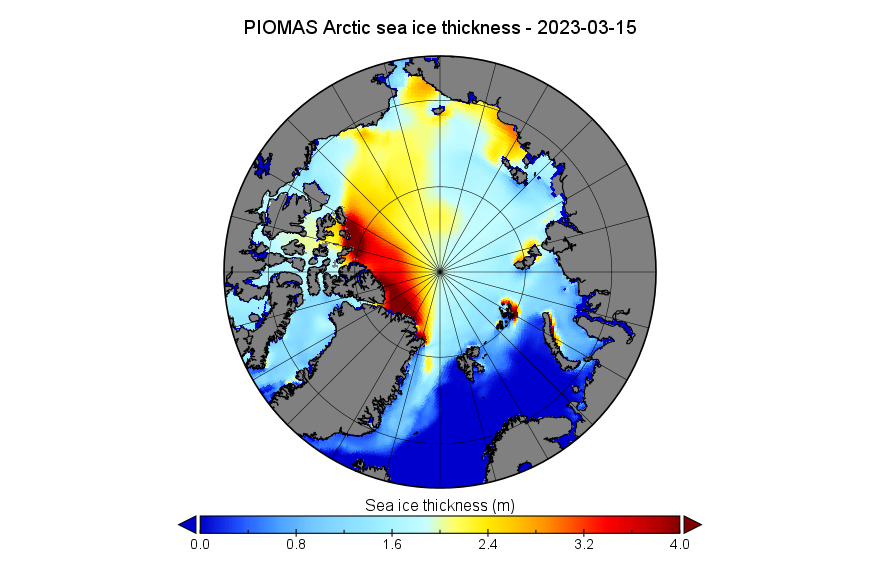
[Edit – March 21th]The mid March PIOMAS gridded thickness data has been released. Here’s the modelled thickness map:
Here too is the calculated volume graph:
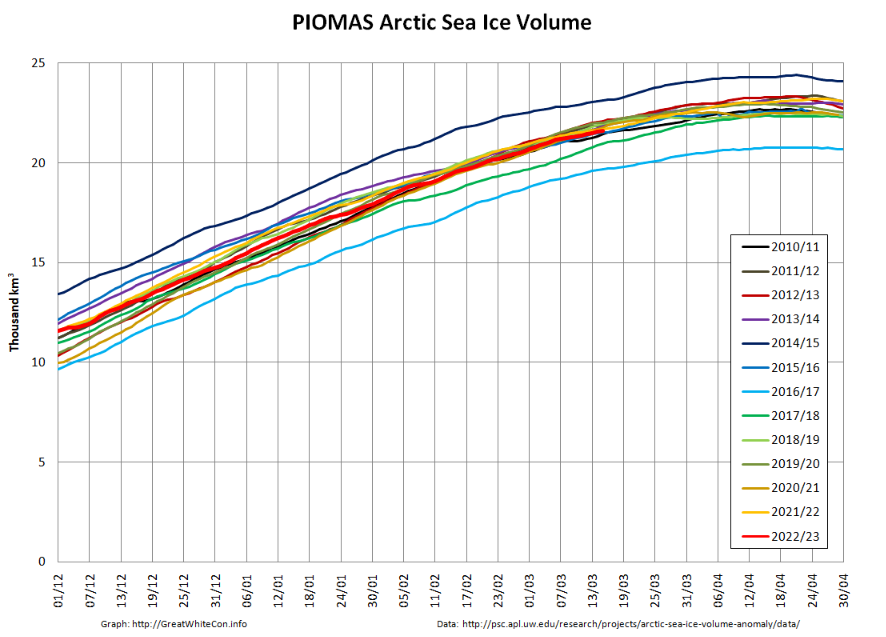
Modelled volume on March 15th was 21,620 km3, 5th lowest for the date in the satellite era.
The conversation has now moved to the April open thread.
PIOMAS seems to be in a state of crisis, worse than they’ve ever been thus far, as «2022 334 11.441» is their latest data point for sea ice volume. That’s November 30th, 2022, incidentally the same date LaMDA will give you if you ask her what day is today.
Going to the main key source for sea ice data feels increasingly like talking some more about ice with that spouse or aunt who really believes you should be doing something else, other than ice, and who just can’t comprehend why it’s such a big deal if a number is there or not.
I didn’t expect PIOMAS to go down that route, but then I guess they have their reasons for being less open and transparent about this. We just cannot know what said reasons are.
Since you ask, the latest I have is 20.58 on day 59 of 2023 (February 28th)
Let’s see how that compares with the “official” number once it’s released?