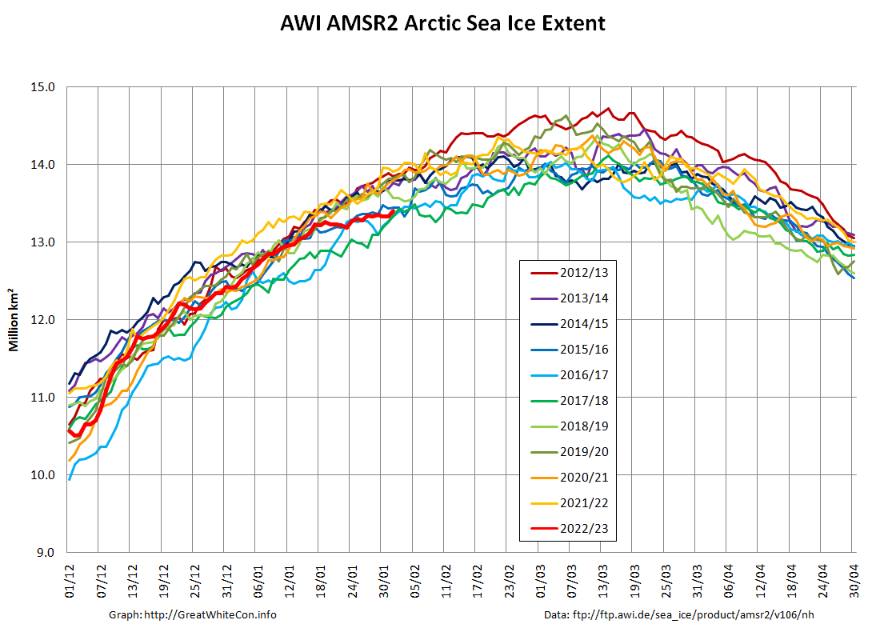
A new month has arrived, and during January several Arctic sea ice metrics have been drifting towards the bottom of their respective decadal ranges. To begin with here is AWI’s high resolution AMSR2 extent graph, which is currently very close to being lowest for the date in the AMSR2 record:
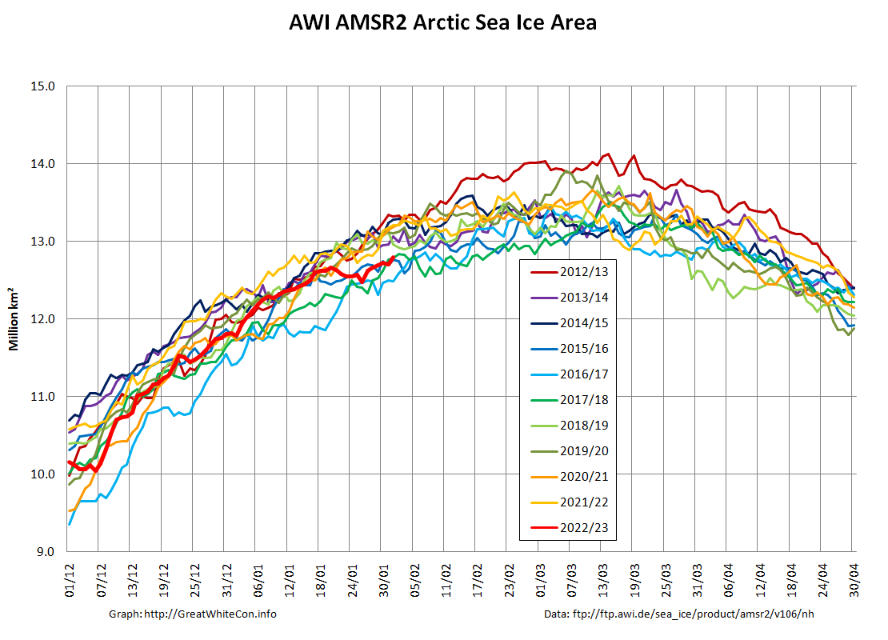
However that is less the case for area:
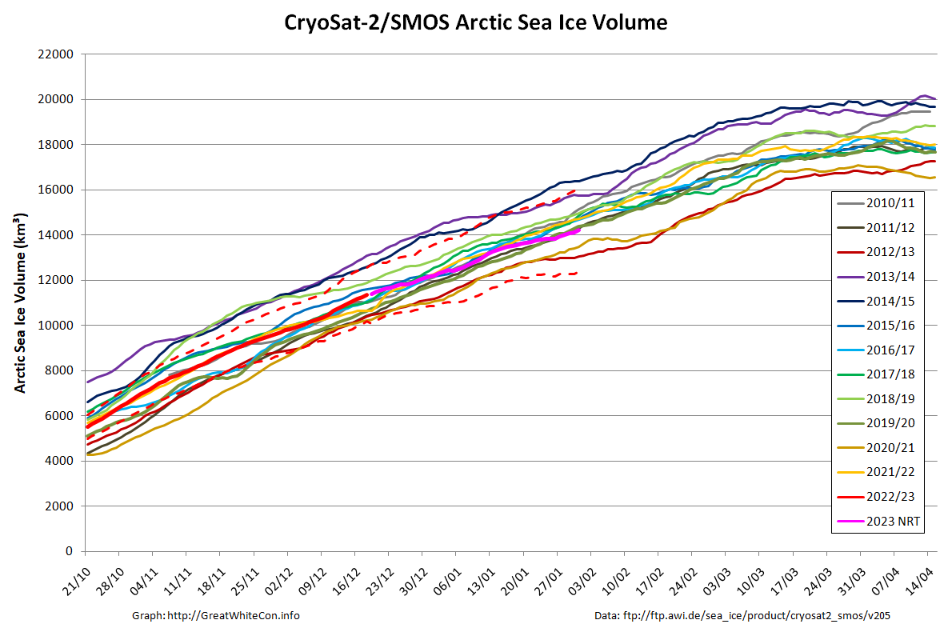
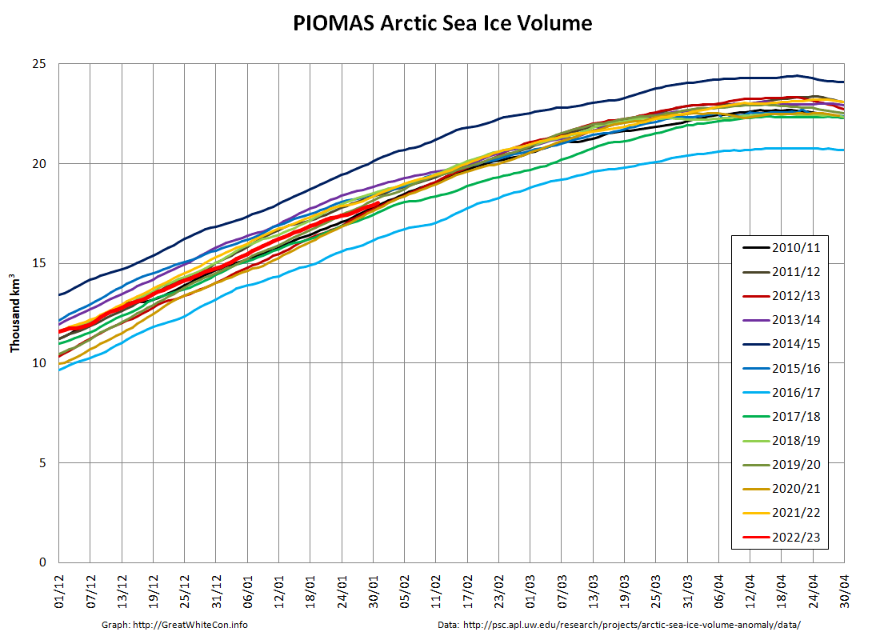
Taylor is keen to see the PIOMAS volume data for January, but whilst we wait for the latest Polar Science Center update here is the CryoSat-2/SMOS volume graph, which now includes a couple of month’s worth of reanalysed results as well as more recent near real time numbers:
Here too is the start of month CS2/SMOS thickness map:
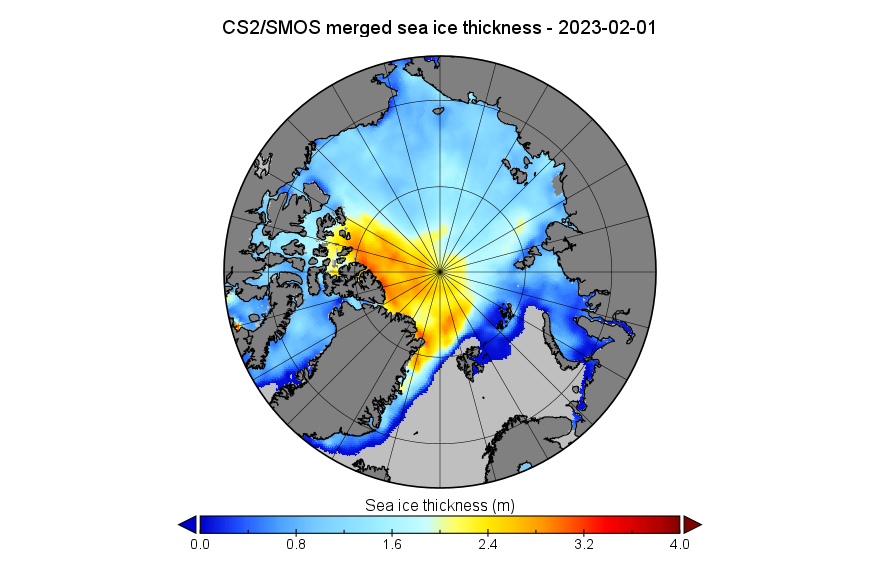
There is still plenty of thicker ice queuing up for the Fram Strait exit from the Central Arctic.
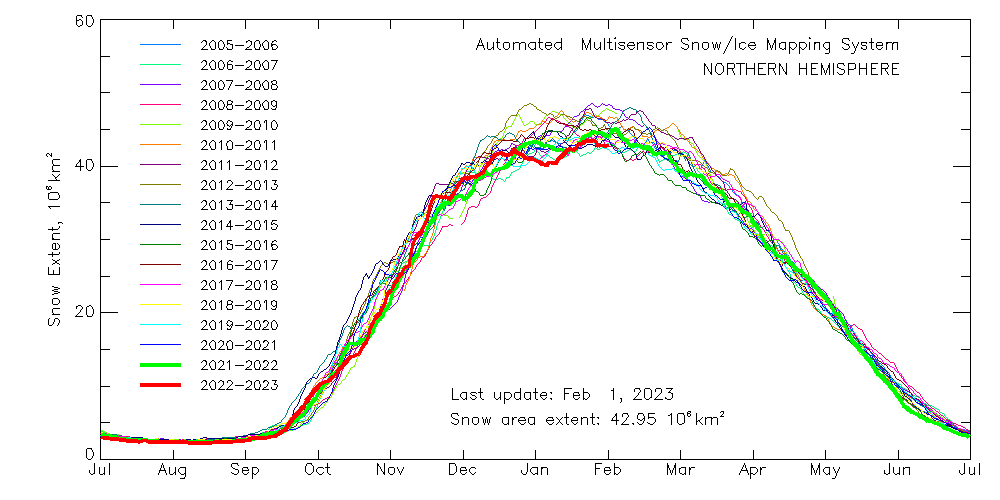
Finally, for the moment at least, Northern Hemisphere snow cover is also very close to the bottom of its recent range at the moment:
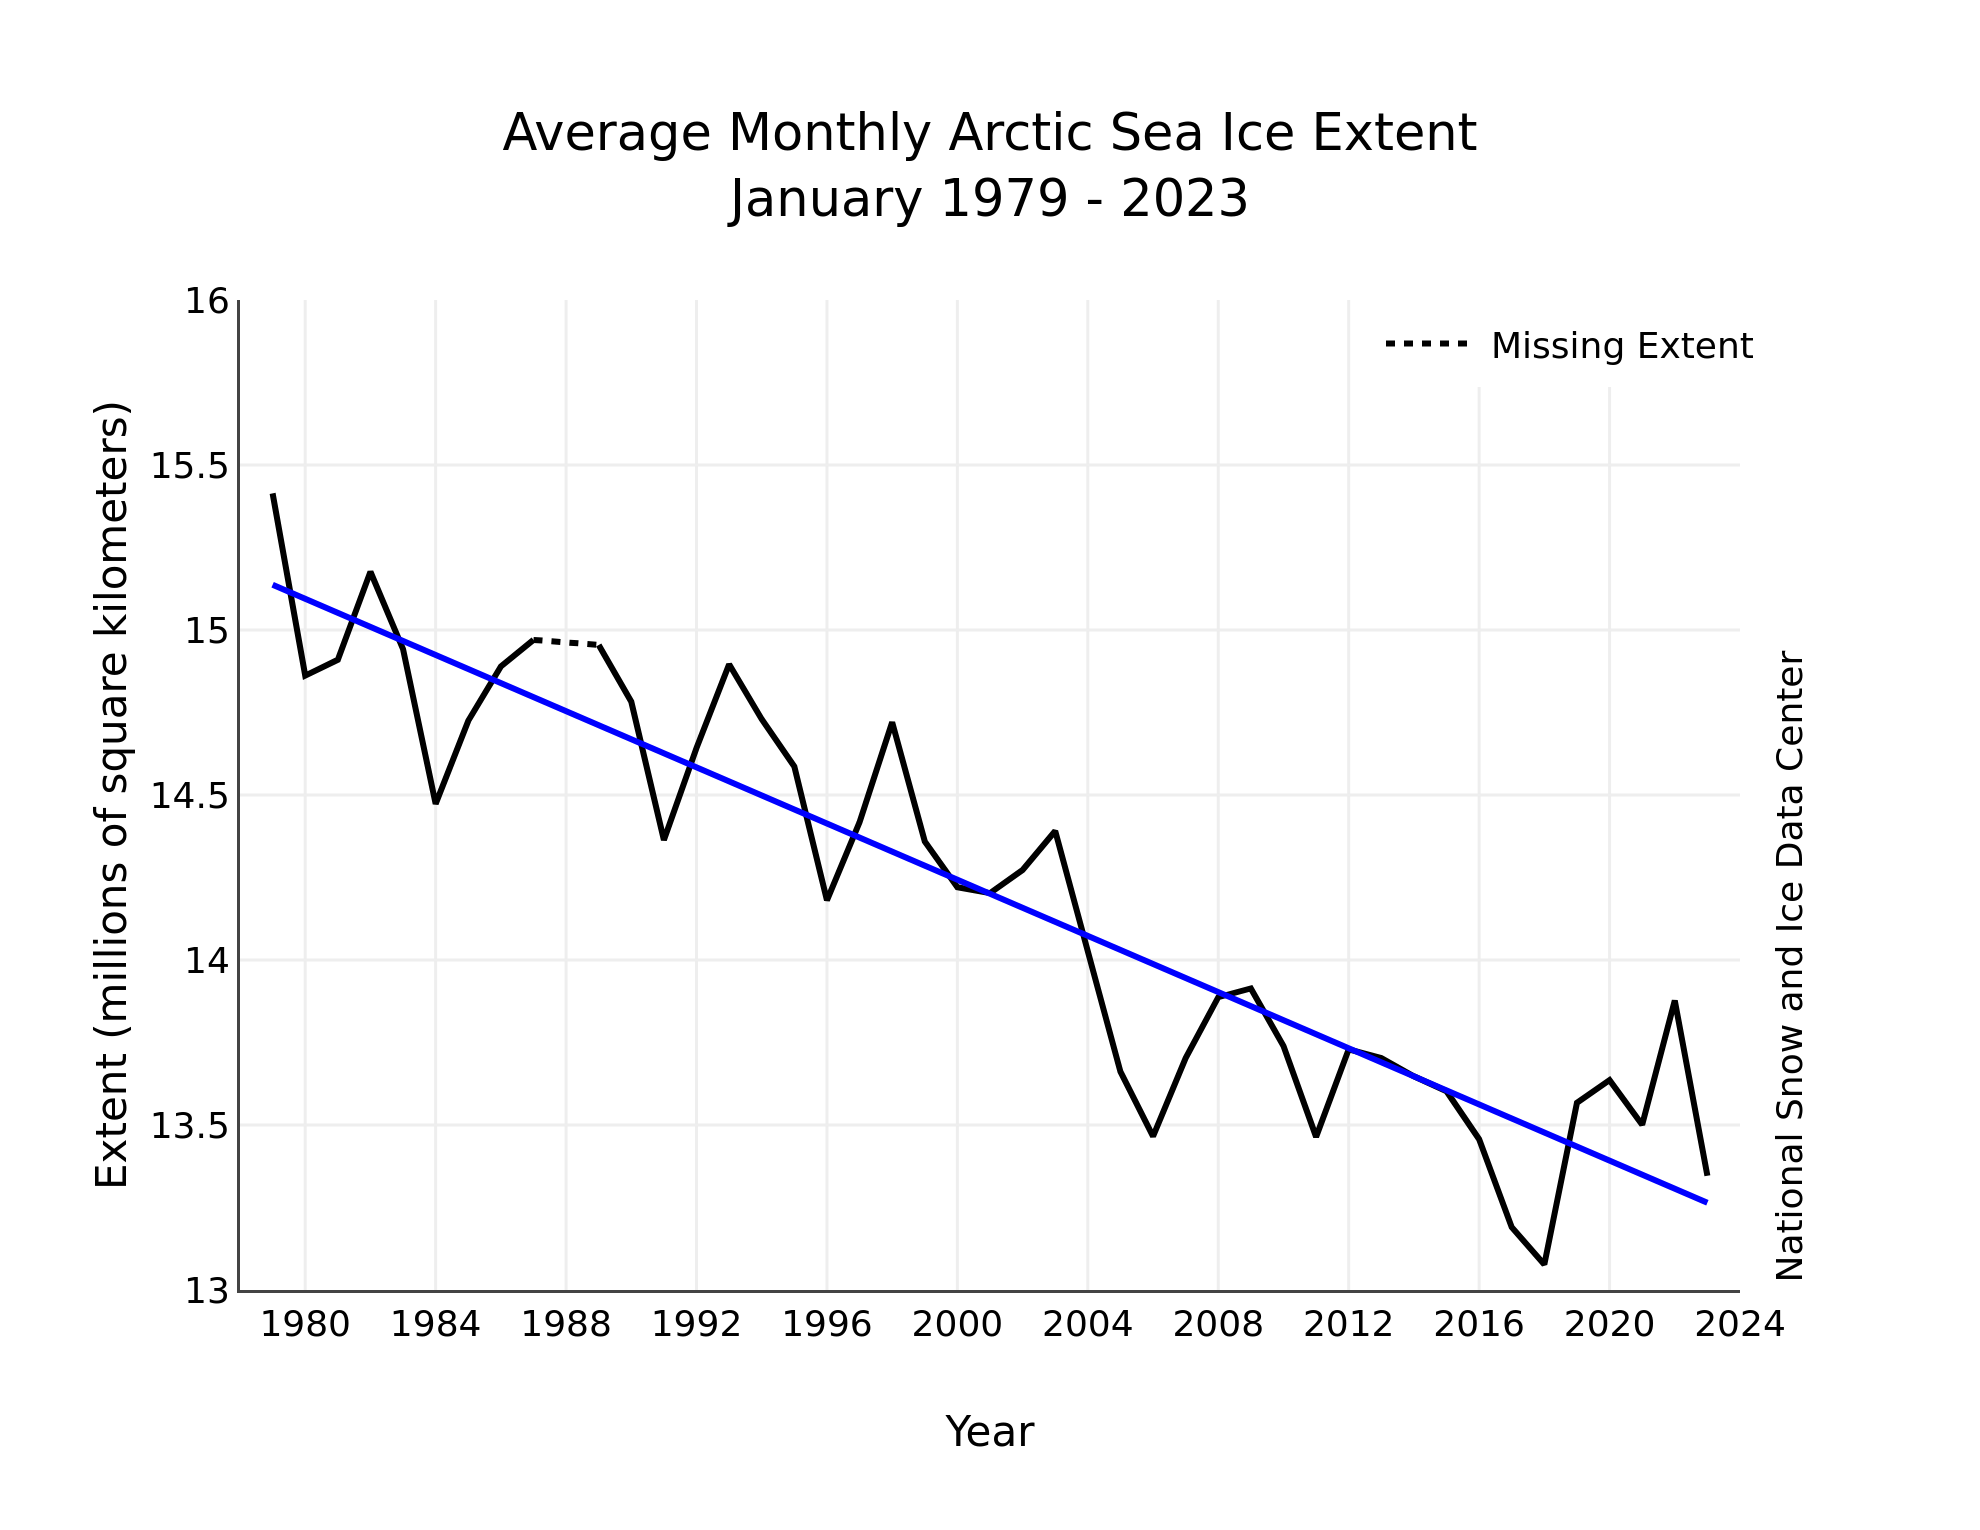
The latest edition of the NSIDC’s Arctic Sea Ice News has just been published:
The January 2023 average Arctic sea ice extent was 13.35 million square kilometers (5.15 million square miles), the third lowest January in the satellite record:
The sea level pressure pattern for January featured high pressure over the Pacific sector of the Arctic Ocean. This feature is known as the Beaufort High and is common in winter and spring:
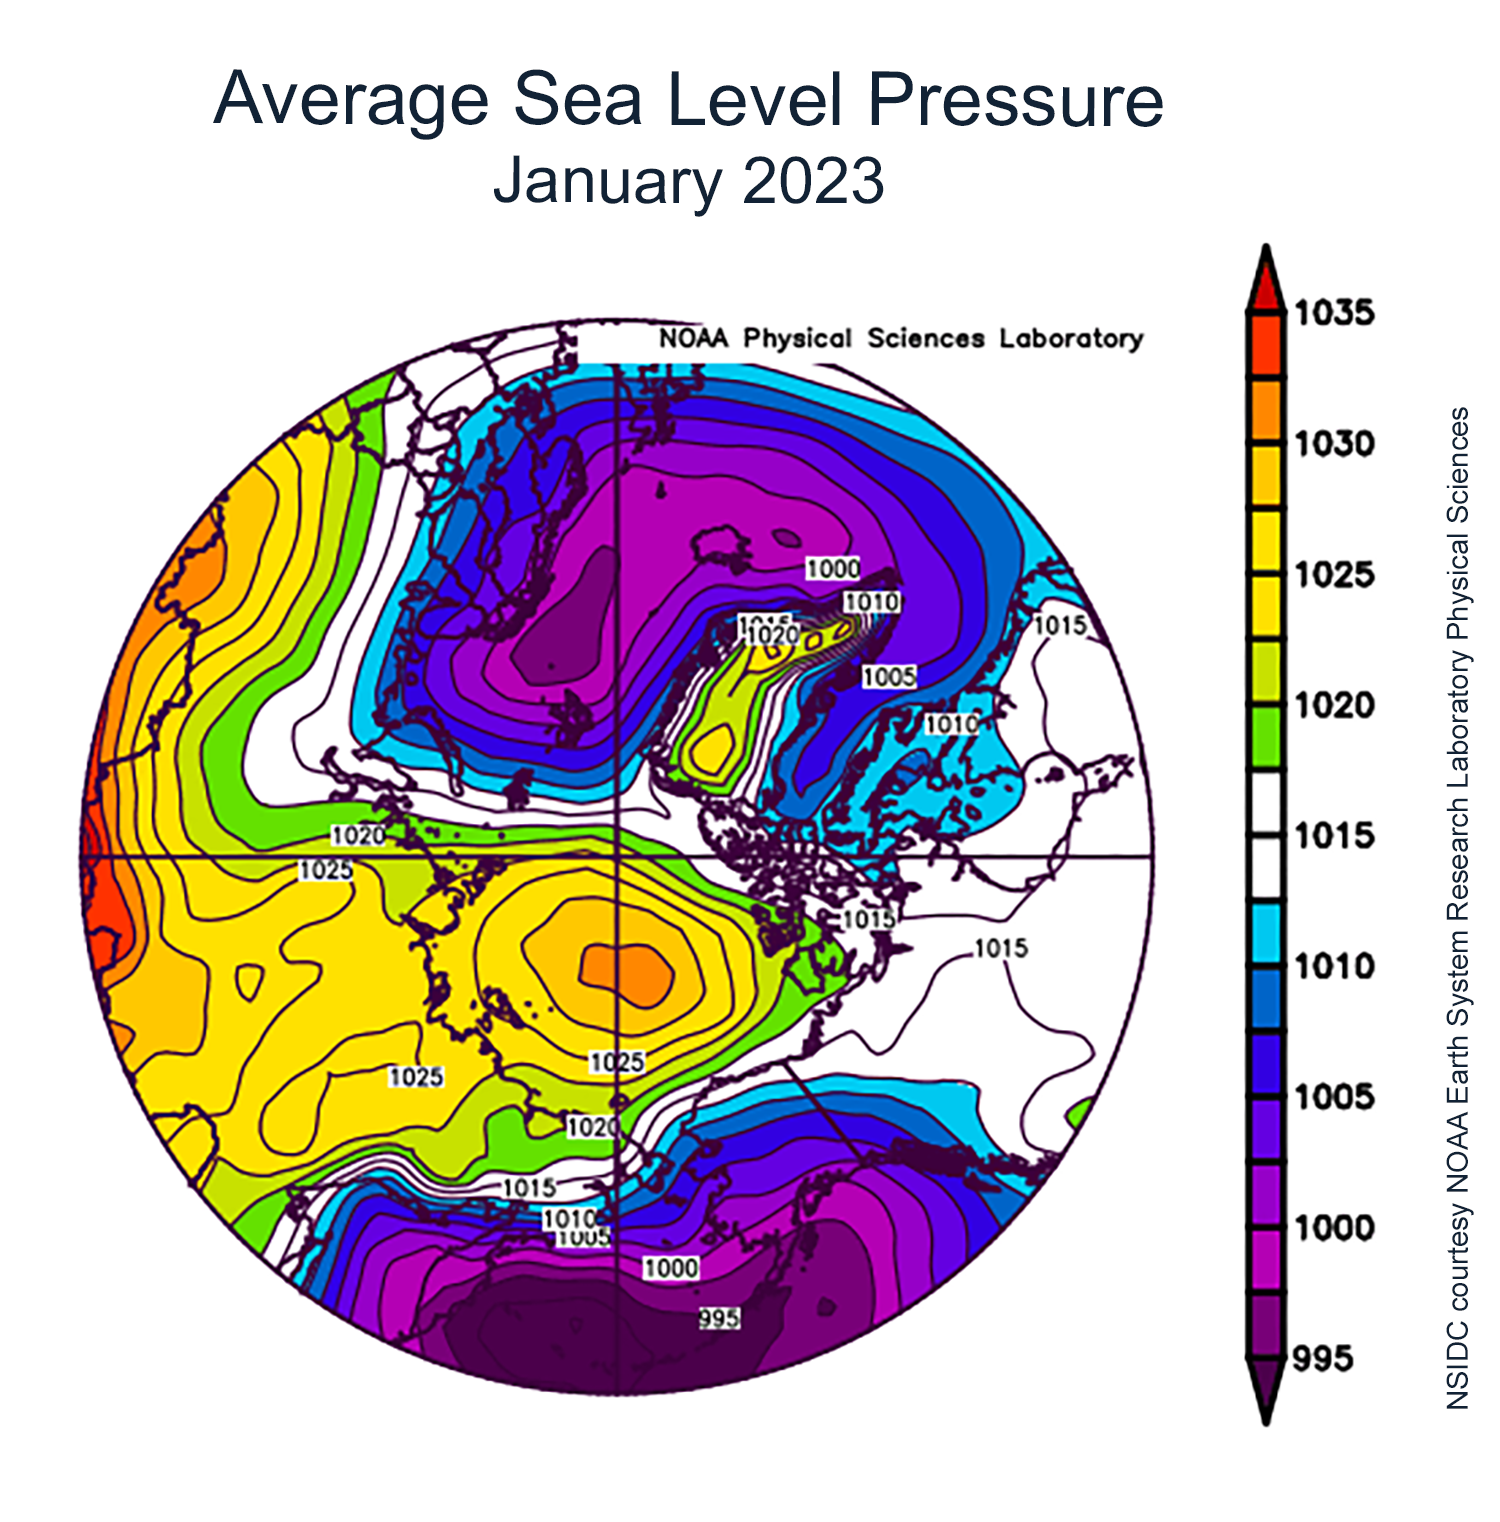
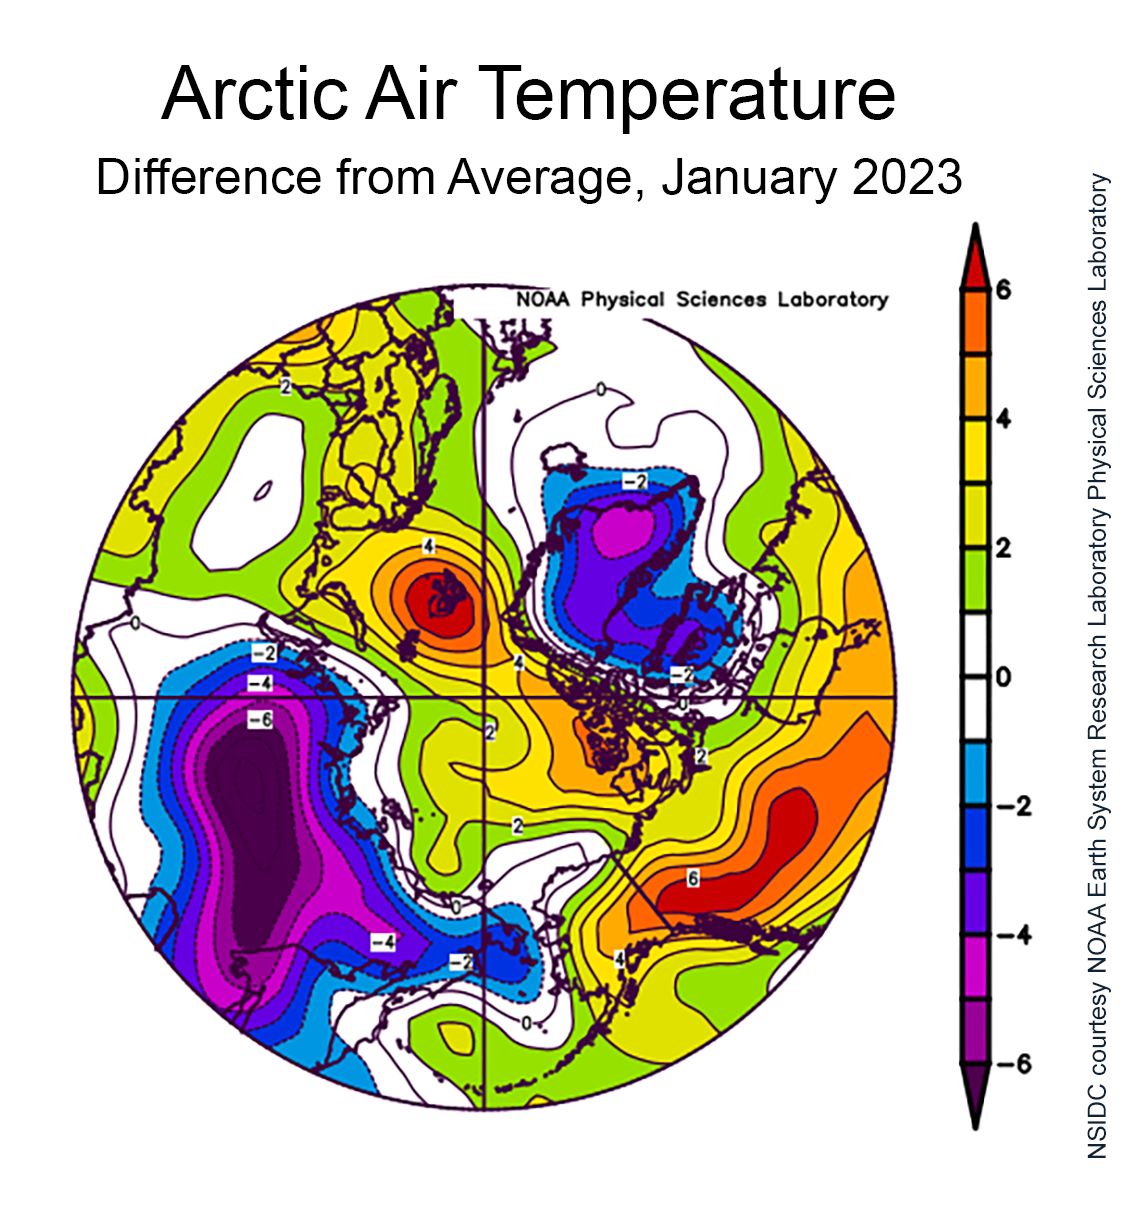
By contrast, over on the Atlantic side of the Arctic, low pressure dominated in the Barents Sea region. As a result, relatively warm air from the south moved into the Barents Sea region, leading to air temperatures at the 925 millibar level (approximately 2,500 feet above the surface) more than 6 degrees Celsius above average near Svalbard:
Here too is an animation of sea ice motion on the Atlantic periphery for the winter of 2022/23 so far:
See in particular the waxing and waning of the area of open water north of Svalbard. Note also that the current GFS forecast includes a 944 hPa MSLP cyclone hovering over the Fram Strait tomorrow morning UTC:
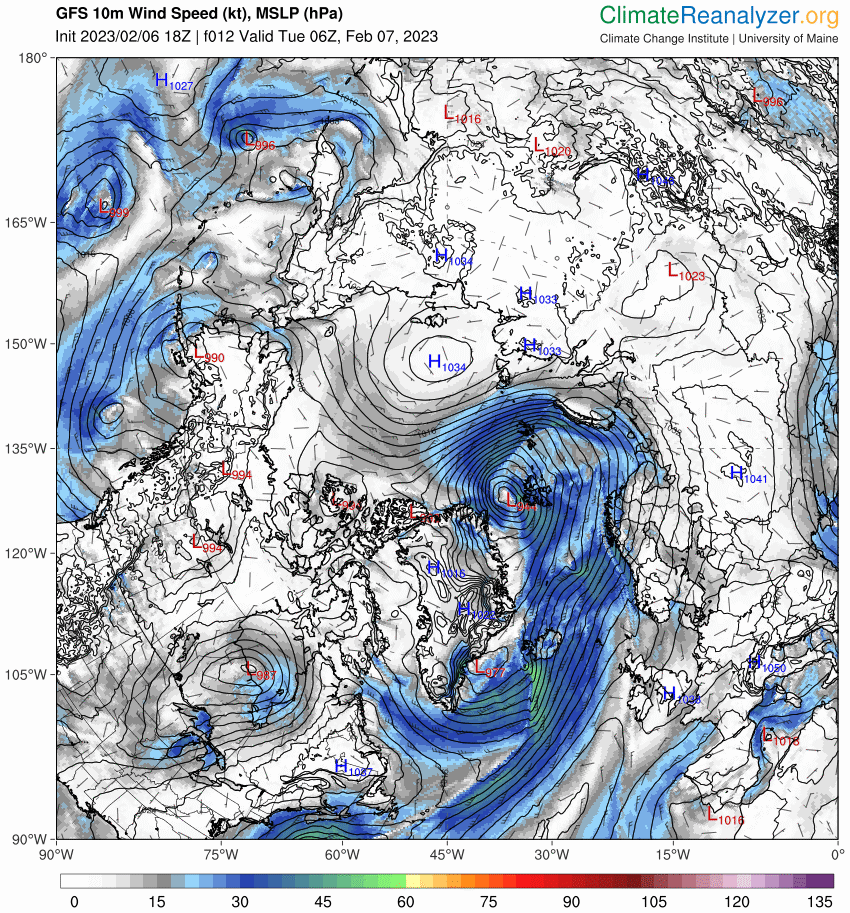
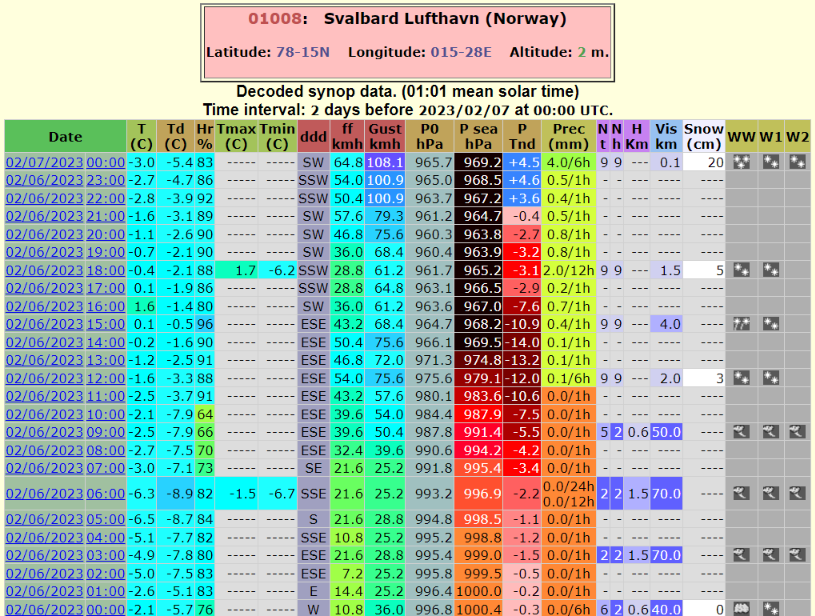
The cyclone is already bringing temperatures above zero to Svalbard:

Measured temperatures in Svalbard did rise above freezing point on February 6th:
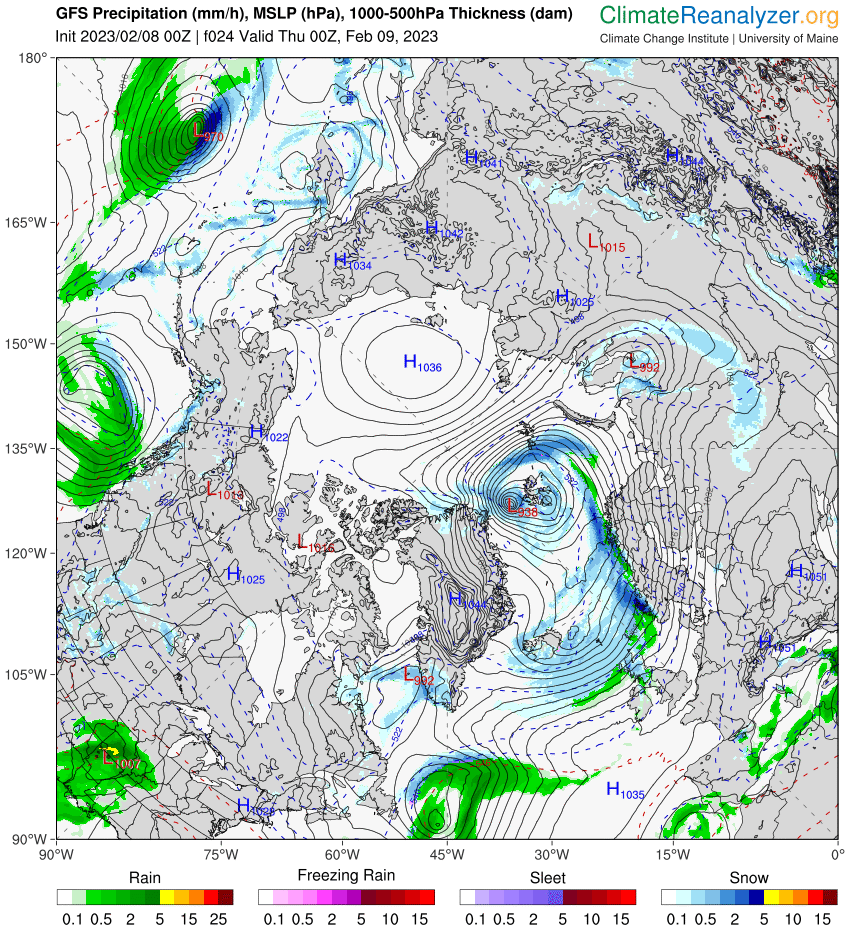
What’s more GFS is now forecasting yet another cyclonic blast, with MSLP down to 938 hPa at midnight tonight UTC:
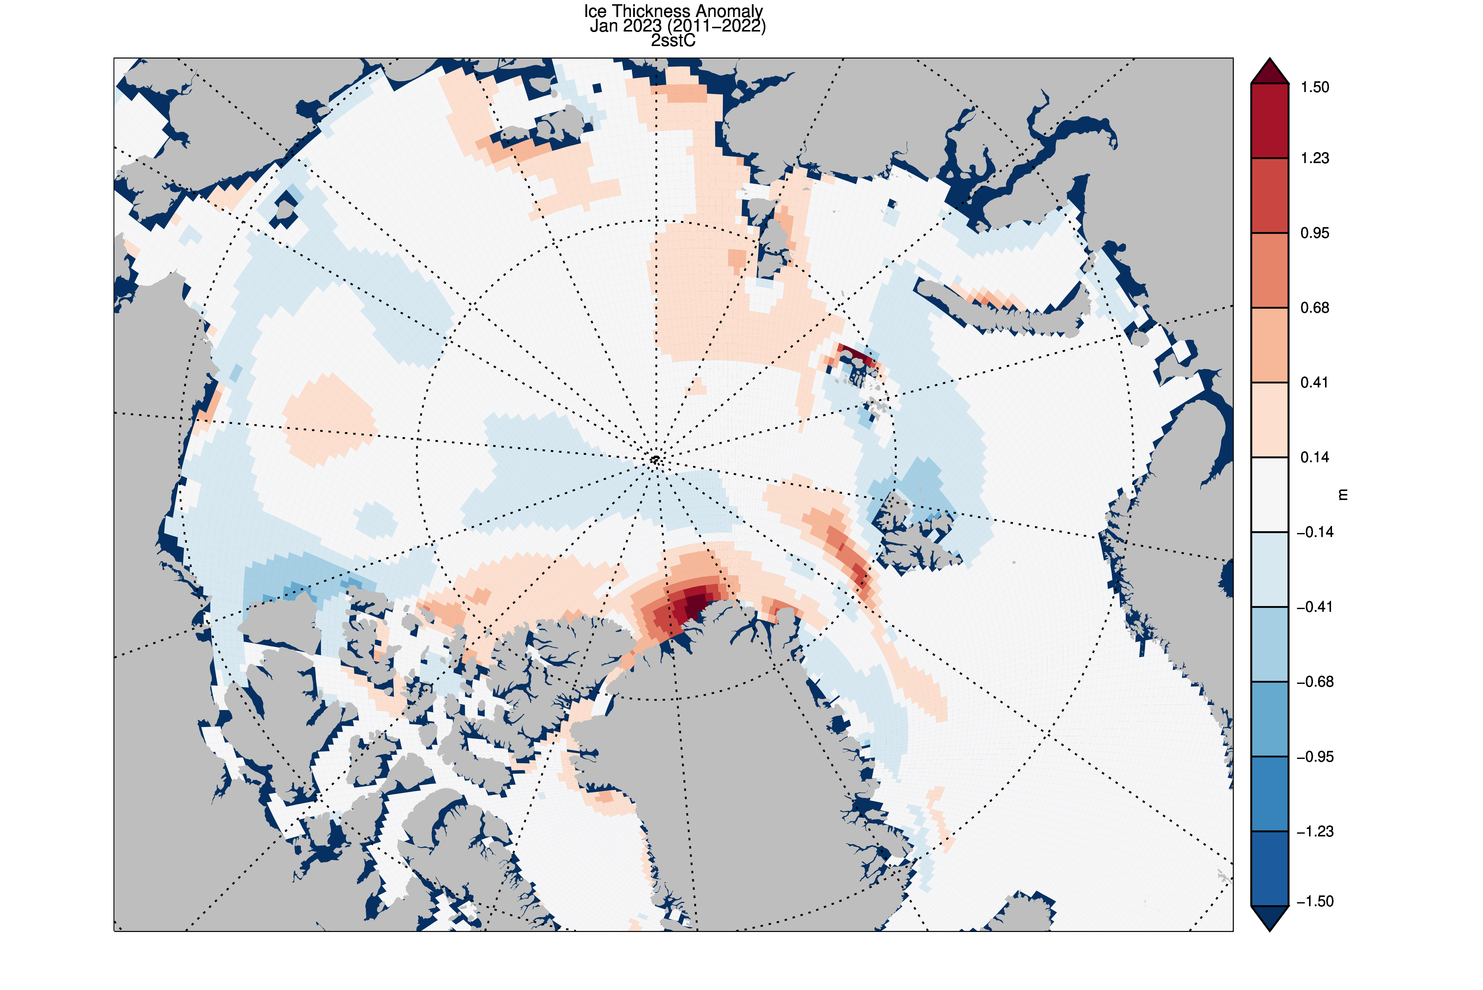
The PIOMAS gridded thickness data for January has now been released, so here’s the January 31st “modelled” thickness map. Compare and contrast with the CryoSat-2 “measured” thickness map above:

Here too is the associated daily volume graph, which now shows 2023 as 6th lowest for the date in the satellite record:
The PIOMAS page on the Polar Science Center web site has also been updated:
Average Arctic sea ice volume in January 2023 was 16,500 km3. This value is the 7th lowest on record for January, about 1,900 km3 above the low record set in 2017. Monthly ice volume was 40% below the maximum in 1979 and 22% below the mean value for 1979-2022. Average January 2023 ice volume was 1.1 standard deviations above the 1979-2022 trend line.
The ice thickness anomaly map for January 2023 relative to 2011-2022 shows positive anomalies north of Greenland and along the Canadian Archipelago. Positive anomalies are area also present in the Eurasian sector of the Arctic with particularly thick ice near Severnaya Zemlya:
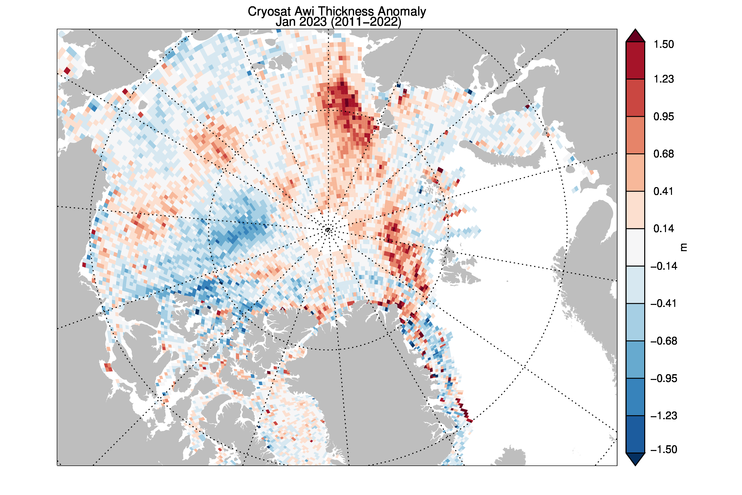
CryoSat 2 satellite-derived ice thickness maps show a weaker anomaly north of Greenland and along the Canadian Archipelago but they are narrowly confined to the near the coast (note that CS2 is a monthly composite rather than an average):
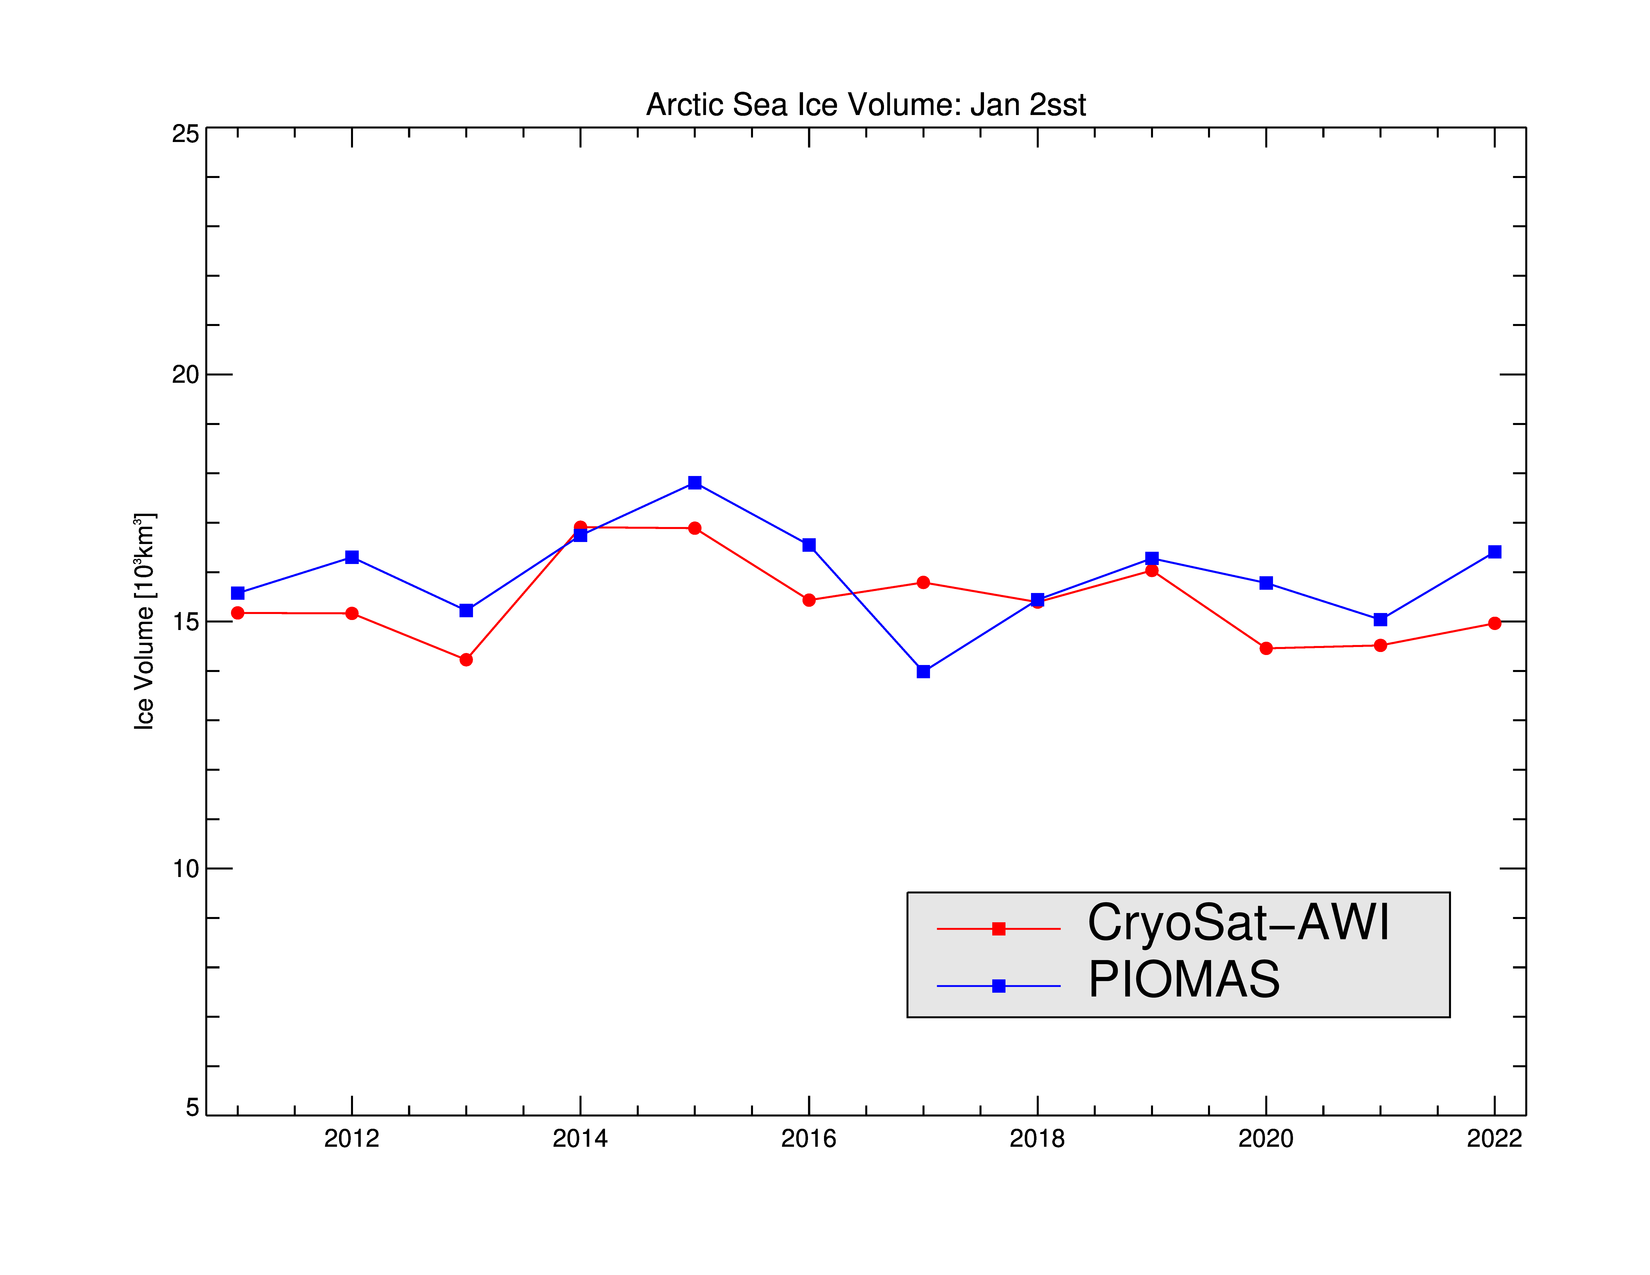
Especially for Taylor, the PSC also states that:
The January time series for both data sets agree within the estimated uncertainty have no apparent trend over the past 12 years. Comparing this with the 43 year 1979-2023 time series highlights the importance of natural variability in relatively short time series such as currently available from CS2 (see our recent paper). Both records show close match in magnitude and similar temporal variability:
If you can excuse the brief excursion down under, according to JAXA ViSHOP AMSR2 based sea ice extent around Antarctica has reached a record all time low for the satellite era:
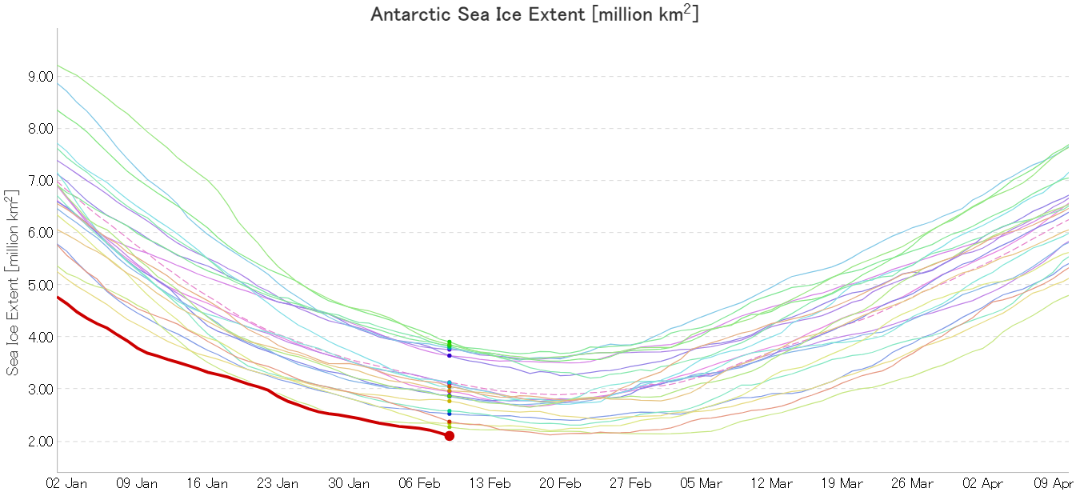
Currently 2.11 million km², with a week or two still remaining in the 2023 southern hemisphere sea ice melting season.
P.S. The Alfred Wegener Institute have now issued a lengthy press release about the new record, which you can read all about over here:
“New Record Antarctic Sea Ice Minimum Extent“
[Edit – February 11th]Back in the Arctic, there has been a sudden drop in JAXA extent over the past couple of days:
This animation of recent ice motion on the Atlantic periphery suggests the decline was caused by the recent cyclones:
As a consequence JAXA global extent is now at a record low level for the satellite era.
[Edit – February 17th]According to the CMC another in the apparently never ending sequence of “Fram Strait cyclones” bottomed out with an MSLP of 968 hPa at 6 AM UTC today:

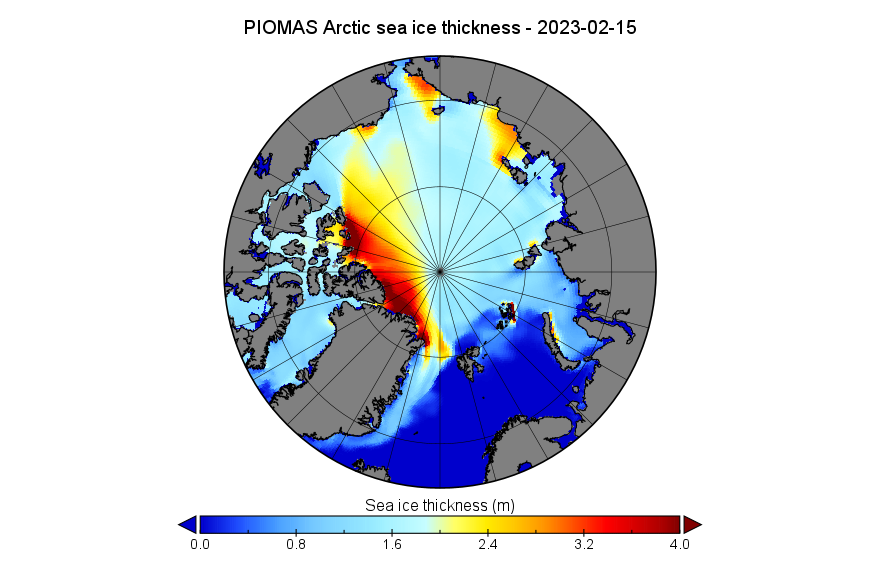
The mid month PIOMAS gridded thickness data has just been released, so here is the modelled thickness map for February 15th:
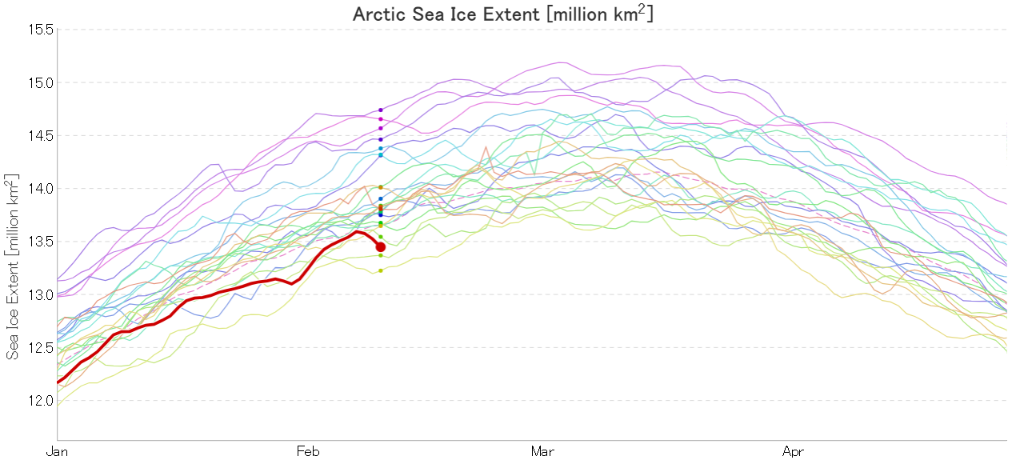
together with the PIOMAS volume graph up to February 15th:

For comparison purposes here is the CryoSat-2/SMOS merged thickness map for February 15th:

Here too is the latest CryoSat-2/SMOS volume graph, updated with near real time data to February 20th:

The conversation has now moved to the March open thread.
This is not strictly Arctic news of course. However I have been known to get into debates about global mean surface temperature in the past, so here is the newly updated Skeptical Science “Global Warming Escalator“:
Since there are those on Twitter who feel compelled to quibble, and getting back on topic, here too is a graph of Arctic temperature courtesy of Carbon Brief last summer:
Ah yes, Berkeley Earth, homogenized data that shows the peak in 1998-99 to be 0.4C lower than 2016, when satellite measurements show only a 0.1C difference. Easy to show excessive warming if the past is cooled and you can’t really measure the oceans or large land masses. And those Arctic warming numbers, what’s their source? BEST again? DMI? And is the concern warming in the winter (-25C vs -20C?) or summer, when there’s been virtually no warming (at least above 80 north).
Sorry, not time to panic yet.
I’m not a climate scientist( just a regular dude!) So I know nothing of the Berkley Earth data, but… As it’s a quiet Sunday morning, I’ll throw in my two cents on DMI temperature north of 80°.
In summer the temperature is still hovering just over freezing, like it has been for so long, because any excess heat goes into melting the ice.
While the central Arctic sea still has ice, it’s not getting any warmer.
( When it’s gone, that’s another matter)
The temperature has definitely rose in the “dead of winter”…
Why is that, where is this heat coming from?
Watching this, for a short few years, I’ve noticed that when the DMI temperature rises, the climate reanalyzer weather map reveals an intrusion of warmer air, a low pressure system coming in from the neighbouring Altantic.
As I know, as does Jim, the climate here in Western Europe is milder in winter because of the heat stored and transported north by the gulf stream, and that extends right up to the Arctic..
And it’s getting warmer..
DMI temperature data represents only the part of the Arctic off course, which is one complaint one might level at it, but I think it is at least telling us that the most significant ocean current entering into the Arctic has warned up!
My Arctic alter ego must be psychic Taylor?
The source of the “Arctic warming numbers” are identified in the legend.
Of course there’s been “virtually no (surface) warming in summer above 80 north”. For the moment at least, the ocean is (mostly) covered with ice up there!
P.S. I see Tom has already made the latter point.
My point Jim, is if there is ‘virtually no warming’ in sumner, then the Arctic Amplification is happening in the winter, when temps are well below Zero (C or F, take your pick).
In addition, your comment about ‘not living in [the lower troposphere]’ Is a bit misleading – of course you do, just the very lowest part of it. The point of UAH data is the anomaly trend, and it is the only way to get an accurate measure over the whole surface, or does HadCRUT have surface thermometers every 10km over the whole Arctic? For that matter, how about the whole Sahara, or the whole of Siberia or the Amazon or the Pacific. I thought so.
I would suggest that the next time you show a graph like the one above, superimpose UAH. While the measured temps are different, the anomalies are comparable.
There are some thermometers distributed across the Arctic sea ice you know Taylor:
You also seem to have missed my significant “(surface)” message? Using the wonders of WRIT, here’s a comparison between the surface (where humans and polar bears live):
and a bit higher in the polar troposphere:
You also seem to have missed this comment from Carl Mears of RSS fame a few years ago?
Quick question, is there anywhere online a version of the temperature anomaly for the whole Arctic, ie the DMI data, but for north of 70°?
You can create your own from a variety of data sets using NOAA’s Web-based Reanalysis Intercomparison Tool (WRIT for short).
Here’s one I didn’t create earlier!
WRIT data consists of monthly means. If you want to roll your own using daily data things get much more complicated:
https://forum.arctic-sea-ice.net/index.php/topic,1871.0.html
Since we find ourselves discussing “global warming” in general, here’s a new open access paper on ocean heat content (OHC for short):
“Another Year of Record Heat for the Oceans”
According to the Canadian Meteorological Centre the Fram Strait cyclone was down to 946 hPa MSLP at 06:00 UTC this morning:
P.S. The CMC’s 12Z synopsis came in at 948 hPa.
According to the CMC the next Fram Strait cyclone bottomed out at 945 hPa MSLP at 00:00 UTC this morning:
Once again the temperature at Longyearbyen airport rose above 0 °C (very!) briefly:
Noted with interest that PIOMAS has produced their January. I see no particular surprises. However, they had to update their “no trend for 11 years” mantra (which has been a consistent theme for a year or so. It’s now “no trend for 12 years” as the January volume was over a standard deviation above the long-term trend line.
They blame it on ‘natural variability’. It would be nice to see some studies funded on Natural Variability. Jim, maybe you could point me to some existing ones?
Punctuated equilibrium, a term I heard somewhere, sometime back.
Look back at the trend of volume minimum. September minimum fell quite gradually indeed, until about 2001-2010, give or take, when the percentage of multiyear ice fell close to today’s levels.
My instinct tells me ( for what it’s worth) either we’ll eventually hit some kind of tipping point again ( who knows when)
Or we’ll have a calamity like a low maximum folled by a very strong melt, breaking current records.
Maybe both possiblies are the same.
Of course this being February, we’re getting way off topic, for the Arctic at least anyway!
Tom,
Hard to say the impact of very low maximum. Given the the maximum typically occurs several month before air temps are above freezing, that means a lot of heat is lost to space during that period. Typically means a follow-on effect in the Fall and following Winter. Same situation after very low minimums. Makes things hard to predict, certainly for me…
It’s hard for everyone Taylor! Via a recent discussion on the Arctic Sea Ice Forum:
Jim, thanks for the link. I guess I should be happy that the experts share my lack of certainty, but on the other hand, some politicians seem to be totally convinced they know what’s going to happen (and they set policy…)
I popped over to the birdsite to announce the latest CS2/SMOS volume graph to the assembled throng.
As luck would have it my eyes alighted on a highly relevant “tweet” from the NSIDC:
https://twitter.com/GreatWhiteCon/status/1628423133454639104
There seems to be quite a difference between Piomas and Cryostat volume,
Which would give us a more accurate idea of the ice volume?
I understand it’s not as straight forward to measure volume, as area or extent.
Perhaps the paper promised by Jaakko will be enlightening? In the short term it is hard to be certain!
PIOMAS and CS2 do at least seem to agree that there is some thicker ice queuing up for for the Fram strait exit from the Central Arctic.